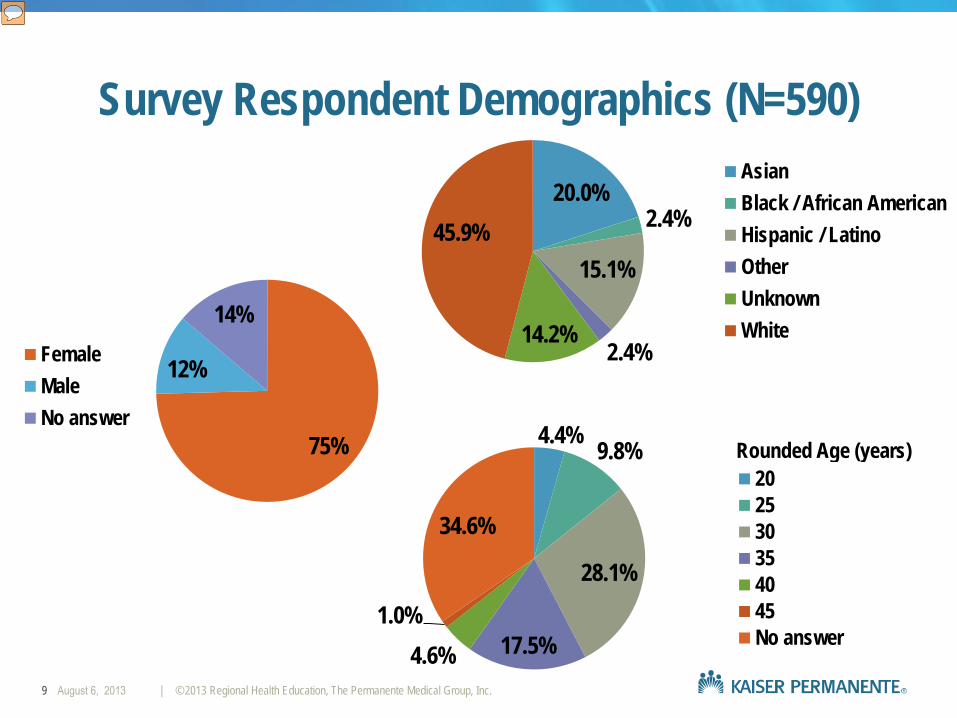
It may be valuable to explore whether these racial/ethnic demographics reflect the populations served by the facilities that administered the Prepared Childbirth survey. If these demographics are not representative of the member populations served, we will want to consider outreach strategies to underrepresented populations such as African Americans and Latinos, and may want to tailor our childbirth education class to resonate more strongly with those communities. Additionally, the 12% minority of male class participants suggests an opportunity for learning about the childbirth education needs of prospective fathers. Speaking with a small sample of male partners could help to assess their concerns and priorities. More research is needed to learn about the best way to support the transition to fatherhood for the men excluded from our sample population. (Though of course, the females in attendance may prefer a women-only environment, and/or may not have a male partner.) Similarly, it may be worth exploring whether the age distribution reflected in our survey sample mirrors that in our pregnant or expectant patient population. If not, the small proportion of 20-25 year olds and 40-45 year olds may suggest the need for a Prepared Childbirth class tailored to the needs of members at different life stages.
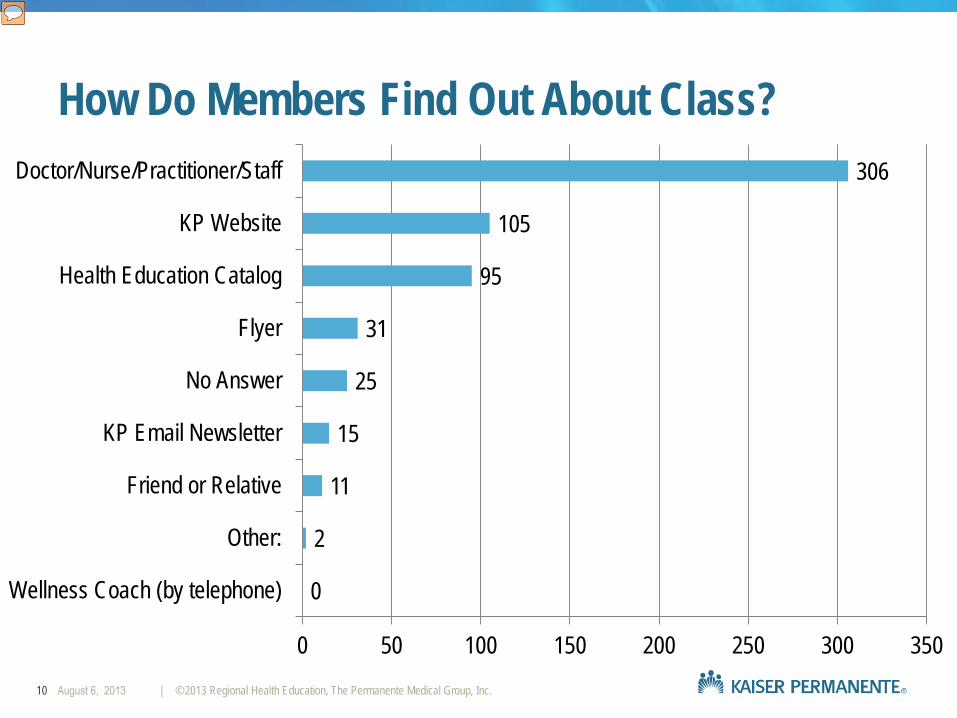
In reviewing the compiled surveys I found that 306 respondents—which represents 52% of our survey sample—learned about the Prepared Childbirth class from a doctor, nurse, practitioner, or staff member. This finding highlights the influential position of our clinical staff; our members turn to them for information and guidance. Keeping our clinicians informed about baseline classes is a great way to increase member awareness of the educational opportunities we have to offer.
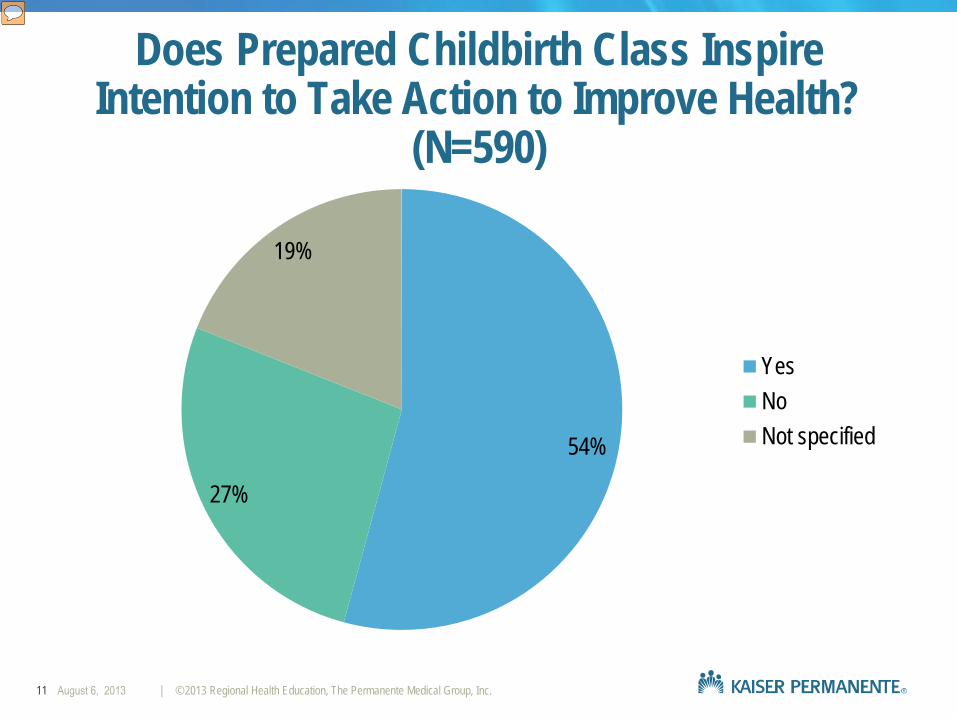
Does Prepared Childbirth Class Inspire Intention to Take Action to Improve Health?
(N=590)
11
54%
27%
19%
YesNoNot specified
Presenter
Presentation Notes
Results indicate that the class is very effective in inspiring intention to take action to improve health. However, in-class surveys are prone to response bias; participants want to please their instructor and portray themselves in a positive light. Additionally, the wording of the question, “Do you plan to take any action to improve your health as a result of this class?” requires speculation on future actions, which is not a reliable measure. Moreover, it’s not truly possible for respondents to identify what motivation for improving their health is a result of the class as opposed to external influences. Finally, it’s challenging to say whether this finding is applicable to external groups, since the survey sample is made up of people who took self-motivated enough to enact the positive health behavior of enrolling in this class. They may have participated in the class for non-health related reasons, but the self-selected nature of this sample should temper our interpretation of this result. They may be more likely to say “yes” because they’re already motivated to make life improvements and are at a stage of change receptive to positive suggestion. They may say “no” for almost the same reason—class participants were already self-motivated before the class began, so they may not attribute their intention to take action to improve health to the class. Similarly, participants who already practice positive healthy behaviors may not have much room to approve—in this way, the question is prone to the “ceiling effect.”
How Does Intention to Take Action to Improve Health Vary by Race?
The survey data indicates that Hispanic and African American class participants are more likely than Asian or White participants to assert their intention to take action to improve their health as a result of the Prepared Childbirth class. With 32% stating that they do NOT intend to take action to improve their health as a result of the class, White participants have the largest proportion of negative respondents. Due to the relatively small sample size of non-White participants, particularly African Americans, more data is needed to validate findings. As mentioned previously, this question is prone to bias since class participants have different baseline health behaviors. Research indicates that unhealthy eating habits are particularly prevalent among African American and Hispanic populations, for example, so African American and Hispanic class participants may have more room for improvement and therefore may be more likely to respond affirmatively to this question. However, given that people of all backgrounds can benefit from improved health behavior, and given that intention is a critical prerequisite to behavior change, it would be valuable to follow up with the “no” respondents to learn more about their lack of intention to improve health.
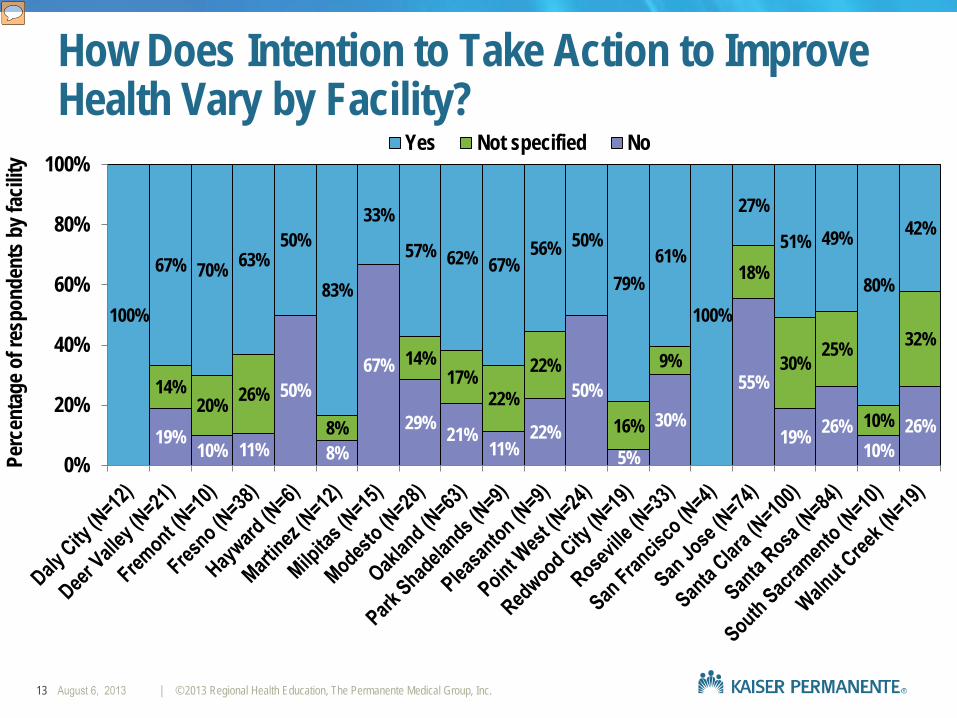
How Does Intention to Take Action to Improve Health Vary by Facility?
13
19% 10% 11%
50%
8%
67%
29% 21%11%
22%
50%
5%
30%
55%
19% 26%10%
26%
14% 20% 26%
8%
14% 17%
22%
22%
16%
9%
18%
30% 25%
10%
32% 100%
67% 70% 63%50%
83%
33%
57% 62% 67%56% 50%
79% 61%
100%
27%
51% 49%
80%
42%
0%
20%
40%
60%
80%
100%
Perc
enta
ge o
f res
pond
ents
by f
acilit
y
Yes Not specified No
Presenter
Presentation Notes
I found significant discrepancies in how effectively the Prepared Childbirth class inspired participants to take action to improve their health. Of course, the range in number of respondents per facility means that the results from facilities with relatively few respondents (such as San Francisco with 4 or Hayward with 6) aren’t as valid as the results from facilities that produced many respondents, such as Santa Clara with 100 and Santa Rosa with 84.
Actions Participants Plan to Take to Improve Health
Most common write-in responses: “Practice relaxation and breathing techniques” (N=85) “Exercise more regularly” (N=31) “Walk” (N=25) “Drink more water and other fluids” (N=22)
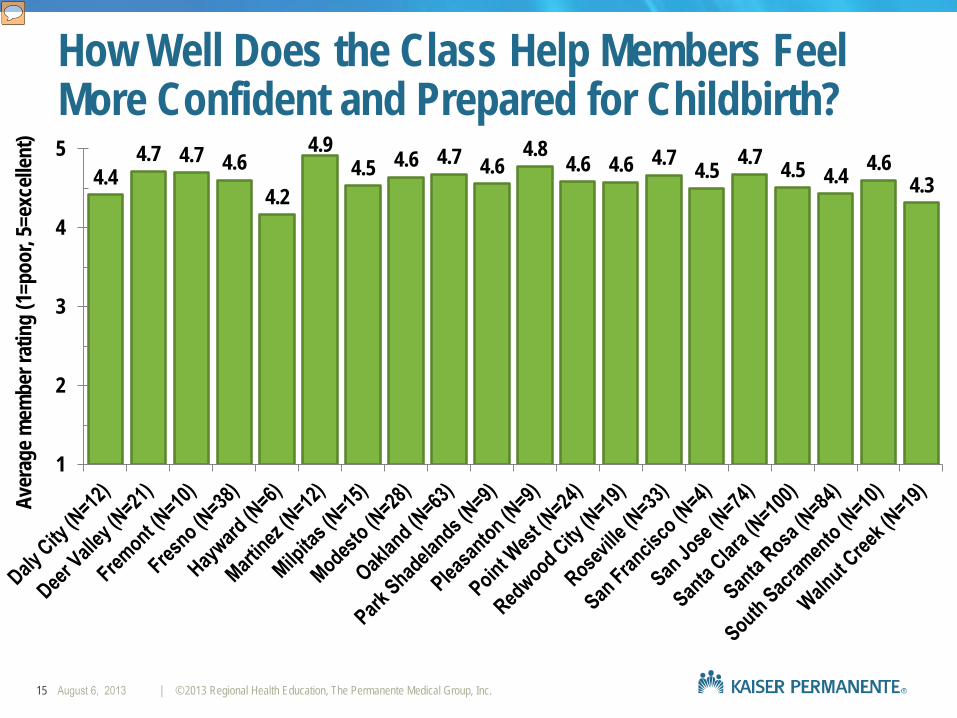
How Well Does the Class Help Members Feel More Confident and Prepared for Childbirth?
15
4.4 4.7 4.7 4.6
4.2
4.9 4.5 4.6 4.7 4.6
4.8 4.6 4.6 4.7 4.5 4.7 4.5 4.4 4.6
4.3
1
2
3
4
5
Aver
age m
embe
r rat
ing
(1=p
oor,
5=ex
celle
nt)
Presenter
Presentation Notes
Despite the diverse responses across facilities regarding member intention to improve health as a result of the class, all facilities generated very similar results in member ratings of how well the class helped them feel more confident and prepared for childbirth. Notably, we do not have data to distinguish between respondents who are first-time parents and respondents who have already experienced childbirth. This question is also prone to the “ceiling affect,” for two reasons. One, respondents who have already had children may begin the class with high feelings of confidence and preparation, and so even an excellent class may be unable to provide a significant boost. (Of course, they’re taking the class, but these are things to consider.) Two, presumably there’s a limit to how confident and prepared anyone can be for childbirth. By increasing member understanding about various potential outcomes that could occur, a member could end the class with a higher level of knowledge but a lower level of confidence than she had at the beginning.
How Does Instructor Performance Vary Across Facilities?
18
4.5 5.0
4.6 4.7 4.3
5.0 4.8 4.9 4.8 4.9 5.0 4.9 4.8 4.9 4.6
4.9 4.9 4.8 4.8 4.8
1
2
3
4
5
Aver
age m
embe
r rat
ing
(1=p
oor,
5=ex
celle
nt)
Presenter
Presentation Notes
Non-rounded instructor performance score, composite. Note: Unable to move data labels outside of bars for some reason, though it was easy to format in other graphs.
Does Instructor Performance Affect Learning and Self-Efficacy?
Average Instructor Performance (composite of 4 questions)
Average of Understand Labor ProcessAverage of Learn Relaxation and ComfortAverage of Feel Confident and Prepared
N = 3 N = 58 N = 55 N = 13 N = 458
Presenter
Presentation Notes
While the vast majority (78%) of respondents rated their instructor as “excellent” in a composite score that reflected how well the instructor answered questions, presented information, led group discussions or exercises, and held member interest, the highest scores for class objectives (self-ratings of how well the class helped them with understanding the labor process, learning relaxation techniques and comfort measures, feeling more confident and prepared for childbirth) were achieved by participants in classes taught by instructors with the highest performance ratings. This indicates that instructor performance is an important driver of childbirth self-efficacy and learning outcomes. To help members to maximize benefit, instructor performance should be evaluated and enhanced on an ongoing basis. To help instructors present information in a way that will resonate with class participants, they could consider adding about preferred learning modalities (group discussion, film, role play, reading) on the registration form so that instructors can tailor their teaching style. Additional forms of instructor evaluation, such as observation and/or structured interview, may also be worthwhile strategies to help cultivate high instructor performance.
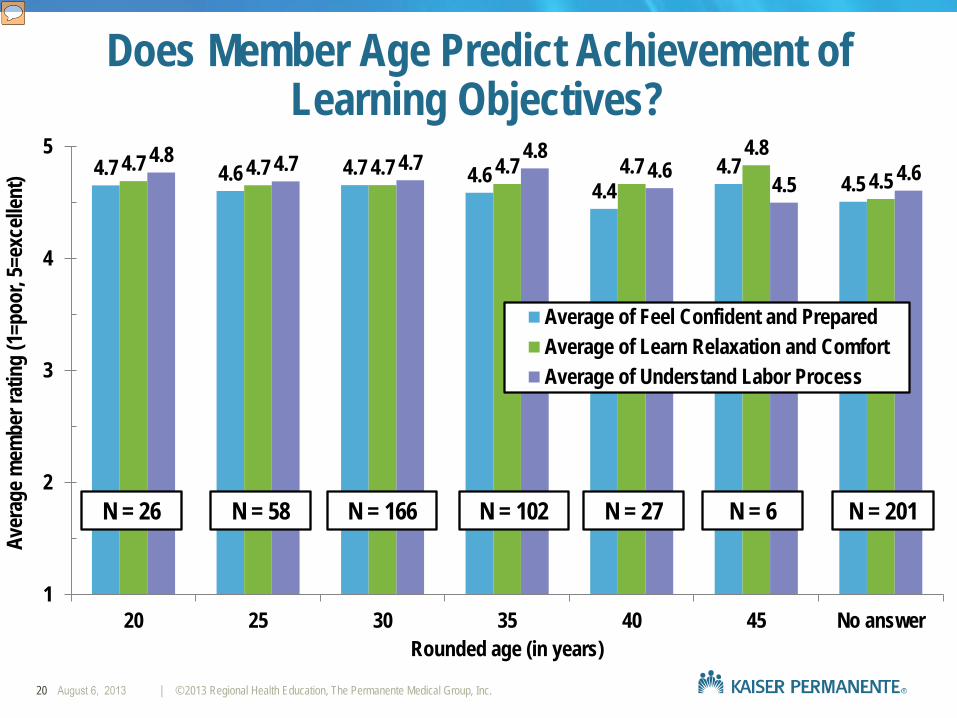
Does Member Age Predict Achievement of Learning Objectives?
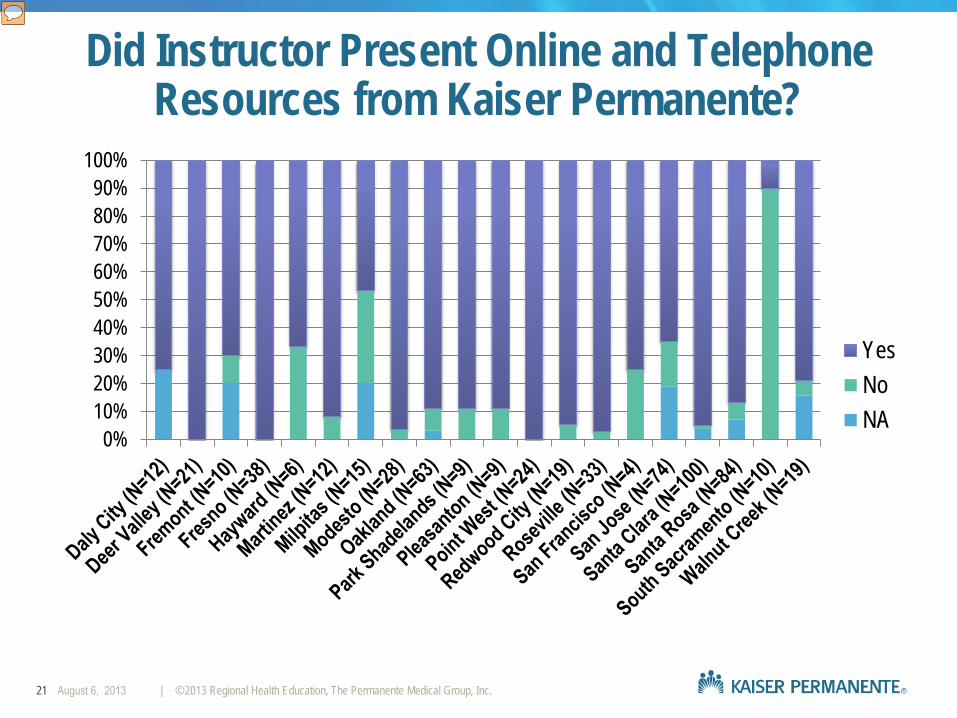
Most facilities have high rates of members who report that the instructor presented relevant online and telephone resources from KP (such as MDO, Wellness Coaching, and reminders for health screenings). However, only 3 of the 20 facilities surveyed (Deer Valley, Fresno, and Point West) boasted 100% member affirmation of presentation of KP resources. This indicates the need to remind instructors, particularly those at South Sacramento and Milpitas (given low rates of “yes” responses) of the need to present relevant KP resources to members at multiple times throughout the course.
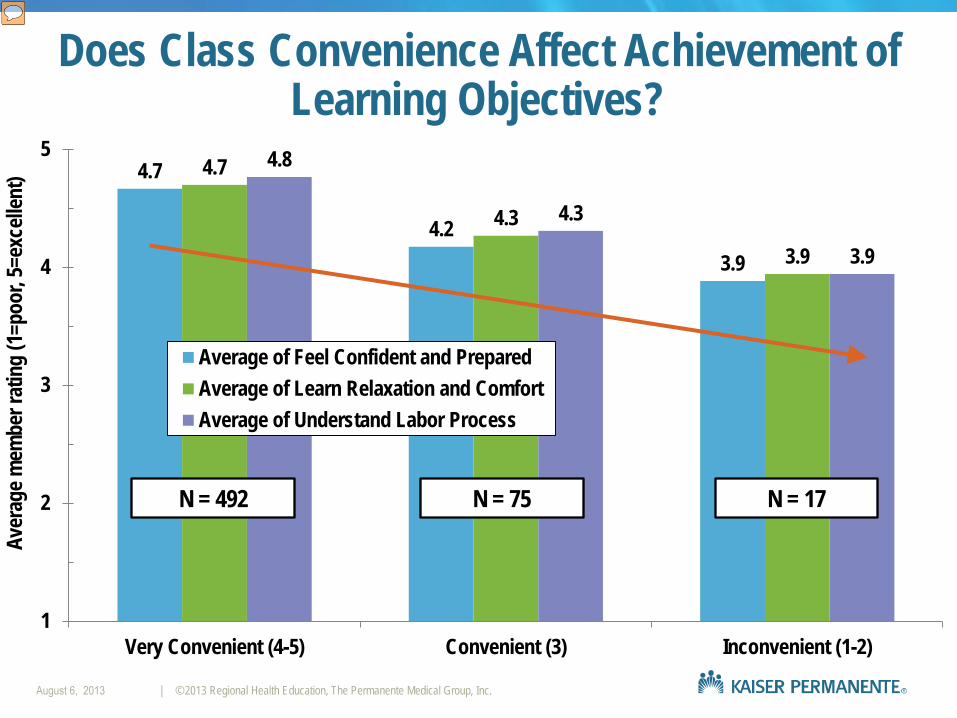
Does Class Convenience Affect Achievement of Learning Objectives?
4.7
4.2 3.9
4.7
4.3
3.9
4.8
4.3
3.9
1
2
3
4
5
Very Convenient (4-5) Convenient (3) Inconvenient (1-2)
Aver
age m
embe
r rat
ing
(1=p
oor,
5=ex
celle
nt)
Average of Feel Confident and PreparedAverage of Learn Relaxation and ComfortAverage of Understand Labor Process
N = 492 N = 75 N = 17
Presenter
Presentation Notes
Our data indicates that the more convenient members find the classes to be (in terms of date and time), the better they say the class helps with understanding the labor process, understanding relaxation techniques and comfort measures, and feeling more confident and prepared about childbirth. I don’t have attendance data, so am not able to tell whether members who found the class inconvenient attended fewer sessions. However, these findings demonstrate that perceived convenience directly correlates with learning outcome achievement. Given the importance of convenience to learning outcomes, it may benefit members to broaden class availability and/or introduce an online option. Notably, even members who rated the convenience of the class day and time as “poor” or “fair” achieved 3.9 average on learning outcomes, with 3 being “good” and 4 being “very good.” Therefore, inconvenient class days and times do not lead to poor learning outcomes.
How Does Class Convenience Predict Overall Satisfaction With the Class?
23
4.8
4.3
3.9
1
2
3
4
5
Very Convenient (4-5) Convenient (3) Inconvenient (1-2)
Aver
age m
embe
r sat
isfac
tion
(1=p
oor,
5=ex
celle
nt)
N = 492 N = 75 N = 17
Presenter
Presentation Notes
Again, we see that while all members report high levels of overall satisfaction, members with the highest levels of satisfaction are those who rated the convenience of the class day and time as “very good” or “excellent.” Members who rated the convenience of class day and time as “good” were 10% less satisfied with the class according to the average of their overall satisfaction rating, and members who rates the convenience of the class day and time as “poor” or “fair” were 18% less satisfied with the class according to the average of their overall satisfaction rating. Here, we see that members’ perceived convenience of the class day and time is an important driver of overall satisfaction with the Prepared Childbirth class. Therefore, it may behoove us to evaluate what days and times work best for members and to adjust out class offerings accordingly.
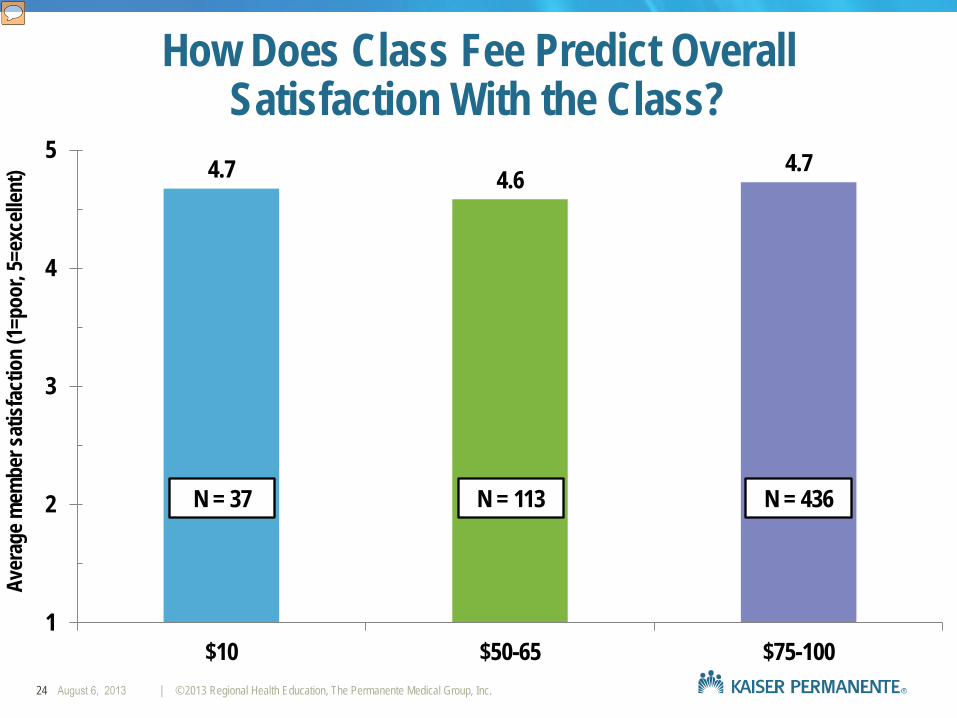
How Does Class Fee Predict Overall Satisfaction With the Class?
24
4.7 4.6 4.7
1
2
3
4
5
$10 $50-65 $75-100
Aver
age m
embe
r sat
isfac
tion
(1=p
oor,
5=ex
celle
nt)
N = 37 N = 113 N = 436
Presenter
Presentation Notes
Member satisfaction does not appear to be driven by class fee. Members who paid $75-$100 had the exact same average member rating for overall satisfaction with the class. Members who paid $50-$65 reported an overage overall satisfaction score only 2% lower than those who paid the highest and lowest amounts, which is not a significant difference. Notably, however, we were only able to survey members who could afford to take the class. Those excluded because they lived near a facility that charged more than they could afford would likely have given a very low overall satisfaction rating. While we want to ensure that the Prepared Childbirth class remains accessible to all members, lower class fees do not appear to correlate with higher levels of overall satisfaction. However, with only one facility (Fresno) charging less than $50, more data would be needed to validate these results.
The majority of participants (54%) plan to take action to improve theirhealth as a result of the Prepared Childbirth Class
Survey results suggest that the convenience of the class day and timecorrelates with achievement of learning outcomes as well as members’overall satisfaction with the class
Class fee does not predict achievement of learning outcomes ormembers’ overall satisfaction with the class
Instructor performance drives achievement of learning objectives Hispanic and African American participants report the highest levels of
intention to take action to improve their health as a result of the class; whiterespondents report the lowest
Across facilities, members report that Prepared Childbirth helps them feelmore confident and prepared for childbirth. However, the percentage ofmembers who intend to take action to improve their health as result of theclass varies significantly across facilities
Learning outcomes do not appear to trend with member age