prepared by the health and safety executive - hse.gov.uk · 4 acknowledgements . the authors would...
TRANSCRIPT

M
easuring and controlling emissions
f rom polymer filament desktop 3D printers
Prepared by the Health and Safety Executive
RR1146 Research Report

© Crown copyright 2019
Prepared 2018 First published 2019
You may reuse this information (not including logos) free of charge in any format or medium, under the terms of the Open Government Licence. To view the licence visit www.nationalarchives.gov.uk/doc/open-government-licence/, write to the Information Policy Team, The National Archives, Kew, London TW9 4DU, or email [email protected].
Some images and illustrations may not be owned by the Crown so cannot be reproduced without permission of the copyright owner. Enquiries should be sent to [email protected].
This report and the work it describes were funded by the Health and Safety Executive (HSE). Its contents, including any opinions and/or conclusions expressed, are those of the authors alone and do not necessarily reflect HSE policy.
Affordable desktop 3D printers are being widely used in businesses, schools and colleges. Some of these printers use filaments to deposit polymer through a heated nozzle to build three dimensional objects. This type of desktop printer is generally unenclosed and some published studies have raised concerns that they may release potentially harmful fumes and particles. The scientific evidence base on exposures and potential health endpoints is being developed internationally.
This report describes initial research in a laboratory setting to a) measure emissions of particulates and volatile organic compounds from desktop 3D printers and b) investigate the effectiveness of control measures to reduce these printer emissions. Two common filament materials were investigated: polylactic acid (PLA) which is generally used in schools, and acrylonitrile butadiene styrene (ABS).
The research found that the heated filaments emitted large numbers of very small particles and volatile organic chemicals which could be breathed in. However, more research is required to establish if under real use conditions these printers release sufficient concentration of emissions to cause harm. The research identified that exposures are significantly reduced by: (1) setting a lower printer nozzle temperature; (2) using a filament with a lower emission rate; (3) placing the printer in a clear enclosing hood fitted with an extraction fan and particulate filter and (4) maintaining a hood ‘clearance time’ of about 20 minutes.
These findings have informed the development of a new good practice guide for schools published by CLEAPSS in 2019. This guide provides advice about precautionary measures for safe use of desktop 3D printers and measures to minimise health risks for students and school employees.
2

Samantha Hall, Ian Pengelly, James Staff, Neil Plant and Gareth Evans Health and Safety Executive Harpur Hill Buxton Derbyshire SK17 9JN
3
M
easuring and controlling emissions f rom polymer filament desktop 3D printers

4
ACKNOWLEDGEMENTS
The authors would like to acknowledge the advice and contributions from the advisory panel
members for the CLEAPSS guide on safe use of polymer filament 3D printers. This included staff from
the Manufacturing Technology Centre; CLEAPSS who provide health and safety advice to schools and
colleges; Peritus Health Management; the British Standards Institute; and to KORA 3D who provided
technical advice and assisted the research by providing polymer filament 3D printers and a
prototype enclosing hood.

5
KEY MESSAGES
Recent published evidence has raised concerns about potential risks to health for those using
affordable polymer filament desktop 3D printers.
HSE formed a working group including experienced individuals from the education sector, a 3D
printer manufacturer, standards bodies, healthcare advisors, and HSE scientific and regulatory
staff to discuss health and safety concerns about using desktop 3D printers in schools. The
working group identified the need for evidence based advice to schools on the safe use of
desktop 3D printers.
HSE undertook laboratory tests to assess whether polymer filament desktop 3D printers released
hazardous particles and vapours which a person nearby could breathe in; they also investigated
control measures to reduce these emissions.
These printers emitted many particles of a size range that can potentially enter the airways and
lungs. Some plastic filament materials, when heated, were found to release vapours known to be
hazardous to health.
Emissions could be controlled by the following means:
using polymer filaments from reputable suppliers;
choosing filament materials with a lower emission rate;
setting a lower operating temperature for the nozzle of the printer through which the
polymer filament passes;
placing the printer inside an enclosing hood fitted with a suitable air filtration system;
waiting sufficient time for printer emissions to clear (i.e. the clearance time) before
opening the enclosing hood.
A securely locked enclosing hood also reduces the risk of incidents and injuries e.g. trapping
fingers in moving parts or sustaining burns from hot areas of the printer.
Based on the results of this research, working group members identified safe working practices
for schools using polymer filament desktop 3D printers. This information contributed to the
development by CLEAPSS (Consortium of Local Education Authorities for the Provision of Science
Services) of a good practice guide.
6
EXECUTIVE SUMMARY
Background
HSE formed an advisory panel including experienced individuals from the education sector, a 3D
printer manufacturer, standards bodies, healthcare advisors, and HSE scientific and regulatory staff
to discuss health and safety concerns about using polymer filament desktop 3D printers in schools.
When the working group was formed (8th September 2015), there was limited published research
characterising emissions from Fused Filament Fabrication (FFF) / Fused Deposition ModellingTM
(FDM) desktop 3D printers. The few published studies examining risks to health from desktop 3D
printers supported concerns about the health implications of breathing in these emissions if
exposures are not effectively controlled. The working group recognised the need for an evidence
based good practice guide for schools on safe use of these desktop 3D printers; including
recommendations on how to reduce printer emissions to minimise risks to health.
Aim and Objectives
This project aimed to investigate particulate and volatile emissions from FFF/FDMTM desktop printers
by:
1. Applying a standardised pyrolysis test to identify filament constituents.
2. Characterising the particulate and volatile emissions resulting from the FFF/FDMTM process
used by small desktop 3D printers with consideration of the range of filament material
available.
3. Investigating the effectiveness of potential exposure controls.
Methodology
Research was carried out in a laboratory setting. Three desktop 3D FFF/FDMTM printers were tested
inside a bespoke test chamber based on the design described in British Standard BS EN 1093. These
printers were used make a standard test object with a range of filament materials including
Polylactic Acid (PLA) and Acrylonitrile Butadiene Styrene (ABS). Real-time aerosol monitoring
instruments were used to characterise particulate emissions for: a combination of printers and
filament materials; a range of printer nozzle temperatures; and with and without an enclosing hood
in place. Further tests were carried out to measure the build-up of particles inside an enclosing hood
and its clearance time, i.e. the time taken for the particles to be filtered and the concentration inside
the enclosure to return to background levels.
One printer was placed inside a sealed box and sorbent tubes were used to sample the Volatile
Organic Compound (VOC) species inside the box at different 3D printer nozzle temperatures.
A standardised pyrolysis test was used to investigate the VOC species released when a wide range of
filament materials were heated to temperatures comparable to that of the 3D printer nozzle.
Transmission Electron Microscopy (TEM) and Energy Dispersive X-ray (EDX) analysis were used to
identify particulate emissions, particularly those from filament containing embedded metal.
Results
When printing with ABS filament, particle emission rates varied from 1.12 x 10¹¹ to
8.03 x 10¹¹ particles.min-1 in the nozzle temperature range 245oC to 260oC. The average particle size

7
did not increase above 10 nm, which was the lowest size detectable by any of the particle
measurement instruments used.
When printing with PLA filament, particle emission rates varied from 3.26 x 10⁹ to
8.23 x 10¹⁰ particles.min-1 and average particle sizes varied from 69 nm to 24 nm as the nozzle
temperature ranged from 220oC to 240oC (measurements made with Testo DISCmini).
Placing the desktop 3D printer inside an enclosing hood with filtered ventilation reduced particle
emission rates by 97% when exhausting the air from inside the hood and by 99% when the air was
recirculated inside the hood. Particulate and VOC emissions accumulated inside the enclosing hood
during printing and took around 20 minutes to clear to background concentrations.
Pyrolysis tests indicated that both the duration of heating, and the temperature of the filament
material, affected the products released. Some filament materials released hazardous chemicals
such as styrene and isocyanates.
TEM EDX analysis identified very small metal particles in the emissions from heated filament containing embedded metals.
Conclusions
Particle emissions:
Emitted particles were in the size range to potentially enter the airways and lungs and the
emission rates when printing with ABS were higher than for PLA.
Particle emission rates varied for different filament material on the same printer.
Particle emission rates and size distributions for the same filament materials varied for
different printers.
Particle emission rates increased and the average particle size decreased as the 3D printer
nozzle temperature increased.
Volatile emissions:
The information provided by some suppliers of filament material was found to be unreliable
and uninformative with respect to the release of hazardous volatile constituents.
Pyrolysis testing was a repeatable method to test a wide range of filament materials for VOC
emissions.
Pyrolysis tests indicated that the temperature and duration of heating the filament affected
the emissions released from each filament material.
Hazardous chemicals such as styrene and methylene diphenyl di-isocyanate (MDI) were
released from some types of polymer filament materials. It is not yet clear whether in real
use, concentrations of these chemicals are sufficient to cause harm if inhaled.
Effectiveness of enclosing hood for controlling exposure:
When a filtered enclosing hood was placed over the 3D printer this reduced particle
emissions released to the room by 97% when exhausting air from the hood and by 99% in the
recirculating air mode.
Particulate and VOC emissions accumulated inside the test enclosure during printing and took
approximately 20 minutes to clear, therefore removing the enclosing hood before this time
could result in exposure to these emissions.
8
CONTENTS
1 INTRODUCTION ......................................................................................................... 9
1.1 Background ............................................................................................................................. 9
1.2 Aim and Objectives ............................................................................................................... 11
1.3 Fused Filament Fabrication Desktop 3D Printers .................................................................. 12
1.4 Printer Filament .................................................................................................................... 13
2 METHODS .............................................................................................................. 14
2.1 Test Piece .............................................................................................................................. 14
2.2 Test Chamber ........................................................................................................................ 14
2.3 Particle Emissions .................................................................................................................. 16
2.4 Volatile Organic Compounds ................................................................................................ 18
2.5 Exposure Control ................................................................................................................... 22
3 RESULTS .............................................................................................................. 24
3.1 Particle Emissions .................................................................................................................. 24
3.2 Volatile Organic Compounds ................................................................................................ 31
3.3 Exposure Control ................................................................................................................... 34
4 DISCUSSION ............................................................................................................. 36
4.1 Emission Rates ...................................................................................................................... 36
4.2 Pyrolysis Testing .................................................................................................................... 38
4.3 Exposure Control ................................................................................................................... 39
4.4 Other Considerations ............................................................................................................ 40
4.5 Research Limitations ............................................................................................................. 41
4.6 Working Group ...................................................................................................................... 41
5 CONCLUSIONS ......................................................................................................... 42
6 REFERENCES ............................................................................................................ 43
APPENDIX A PTRAK AND DISCMINI DATA COMPARISON ............................................... 45
APPENDIX B TEM IMAGES AND EDX SPECTRA ............................................................... 46
B.1 ABS printing in the test chamber .......................................................................................... 46
B.2 Copper FLEX Filament ........................................................................................................... 50
B.3 brassFill Filament .................................................................................................................. 52
B.4 bronzeFill Filament ................................................................................................................ 54
APPENDIX C PYROLYSIS RESULTS .................................................................................. 58
9
1 INTRODUCTION
1.1 BACKGROUND
Desktop 3D printer technology and its applications: With an increasing number of industries and
businesses considering using three-dimensional (3D) printing technologies, and many already doing
so (Floyd et al, 2017), it is important that any potential exposure risks produced by these processes
in the workplace are identified and if necessary controlled. One large market for 3D printers is the
education sector, with many educational establishments purchasing the machines for use in
classrooms by staff and students including young children. As these printers are designed to be
positioned on a desktop and can take hours to complete the printing of even a simple model, it is
possible that an employee or student could be sat within close proximity for several hours.
Professional users such as designers and architects have begun to adopt the technology for concept
visualisation, and the manufacturing industry are utilising the technology for rapid prototyping.
Community spaces where members of the public and industry creatives can meet to work together
with access to 3D printers are becoming more common in the United Kingdom (UK) including in
public spaces such as cafés and libraries.
This report mostly concerns the use of Fused Filament Fabrication (FFF) desktop 3D printers. These
may also be referred to as Fused Deposition ModellingTM (FDM) desktop 3D printers. From this point
onwards, the term FFF will be used to describe the process.
Emissions from desktop 3D printers: Evidence from published research investigating both
particulate and volatile emissions from FFF desktop 3D printers demonstrated that this process may
pose an inhalation risk (Mendes et al, 2017; Stefaniak et al, 2017; Azimi et al, 2016; Yi et al, 2016 and
Stephens et al, 2013); these are discussed further in Section 4. Only Floyd investigated particle
morphology. Stefaniak et al repeated measurements with and without a ‘manufacturer-provided
cover’, but none of the published studies reviewed as part of this research included a detailed
evaluation of potential exposure control methods.
Findings from these published studies suggest that ultrafine (<100 nm diameter) particles are likely
to be emitted from the 3D printer as the filament is extruded through the nozzle. There is evidence
that inhaled ultrafine particles in polluted air initiate inflammatory responses in the airways and
lungs. Epidemiological studies into human exposure to ambient air pollution have suggested that in
addition to effects in the lungs, people inhaling air that contains high levels of ultrafine particles are
more likely to suffer from lung and cardiovascular disease (Bourdrel et al, 2017). However, the
factors that determine the severity of this response are not fully understood and the longer term
health consequences for repeated exposure are in many cases unknown
(http://www.hse.gov.uk/nanotechnology/understanding-hazards-nanomaterials.htm).
In addition to the differences in the design of the desktop printers, an extensive range of filament
material is available from a wide range of suppliers. These vary in mechanical and aesthetic
properties making them useful for different applications. With the increasing use of commercial
names, such as ‘NinjaFlex®’ and ‘BendLay’, it may be difficult to immediately identify the
constituents of the filament material. It is likely that the same printing process will create different
risks depending on the filament material used, which is important to note as new filament materials
are continuously being manufactured and these may all emit particles and VOC at different rates.

10
Printer emissions and risks to health: It was not an objective of this HSE research to determine the
long-term health effects from inhaling emissions from 3D printers. A search of published research
located some studies reporting hazardous emissions, as well as ill-health or symptoms in those
exposed. These studies included a case study, an inhalation volunteer challenge study, a small
cross-sectional survey of symptoms, and other studies that considered the hazardous properties of
these emissions.
House et al (2017) reported a case study of a twenty-eight year-old self-employed businessman who
had first developed asthma at the age of eight. This condition only recurred in later life when he
started to use an FFF 3D printer with Acrylonitrile Butadiene Styrene (ABS) filament in a small work
area (~85 m3). He experienced recurrent chest tightness, shortness of breath, and coughing. When
given a methacholine inhalation challenge at 4.0 mg.ml-1 this resulted in a 20% fall (PC20) in forced
expiratory volume in one second (FEV1) consistent with mild asthma. After three months his
workplace reduced the number of printers and introduced Polylactic Acid (PLA) filament, as well as
HEPA filtration with organic cartridges to remove organic pollutants from the air. After this
intervention his symptoms gradually improved and after a second methacholine challenge his FEV1
was normal and the PC20 value was > 16 mg.ml-1. However, he continued to occasionally use his
salbutamol inhaler.
A small volunteer challenge study (26 volunteers) analysed the effects of one-hour inhalation of
fumes from a printer either using PLA or ABS filament, and monitored the expression of nasal
inflammatory markers (cytokines, prostaglandins and exhaled nitric oxide) and self-reported
symptoms. This acute exposure did not significantly alter the expression of cytokines and other
inflammatory markers except for exhaled nitric oxide which was raised after inhalation of the ABS
fumes. The ABS fumes were also reported to cause a greater odour nuisance response from the
volunteers (Gumperlein et al, 2018).
A small cross section survey was undertaken by Chan et al (2018) who asked employees in 17
companies using FFF 3D printers to self-report health symptoms. Of the 46 surveyed, 27 (59%)
reported work related respiratory symptoms at least once per week for the previous year. Those
working more than 40 hours a week with these 3D printers were significantly more likely to have
been diagnosed with asthma or allergic rhinitis.
Zontek et al (2017) examined particulate and chemical emissions from desktop 3D polymer printers
in a ventilated laboratory, a poorly ventilated laboratory, and a ventilated ‘domestic sized’ room.
During printing >99% of the particle emissions were ultrafine. Chemical analysis demonstrated
isocyanic acid and n-decane, and microscopic and elemental analysis showed the presence of
aggregated combustion particles with metal resides. The authors concluded that the risks to health
from ‘off-gassing’ of vapour constituents from the printing were low. However, the concentrations
of ultrafine particles were more concerning given the growing evidence that ultrafine pollutant
particles cause inflammation in the airways and cardiovascular system (Bourdrel et al, 2017).
Mendes et al (2017) measured the concentration of emitted nanoparticles from 3D printing with ABS
and PLA filaments in a room. The authors concluded that considerable concentrations were possible
during long exposure periods when printing with ABS, but that this was much less likely for PLA. Only
very low concentrations of VOCs were released and were not considered likely to cause adverse
health risks. However, the concentrations were produced by one printer and caution was advised
when using multiple printers in enclosed rooms.

11
Developing good health and safety practices: Some organisations have started to produce their own
guidance to specifically address the safe use of 3D printers, for example the fact sheet produced by
Carnegie Mellon University (http://www.cmu.edu/ehs/fact-sheets/3D-Printing-Safety.pdf).
However, much of this guidance tends to focus on large industrial printers using metal source
material or broadly spans many different 3D printing technologies, and often lacks supporting
evidence. Existing health and safety information relating to more traditional practices could also be
applied to 3D printing, such as the information sheet PPIS13 ‘Controlling fume during plastics
processing’ produced by HSE (HSE, 2013), which provides guidance on how to minimise and control
plastics fume during processes including extrusion.
HSE formed a working group including experienced individuals from the education sector and 3D
printer manufacturing to share knowledge and experience. The members are:
Manufacturing Technology Centre;
KORA 3D (Secure Micro Solutions Ltd);
CLEAPSS (Consortium of Local Education Authorities for the Provision of Science Services);
Peritus Health Management;
British Standards Institute; and
Health and Safety Executive regulatory specialists and scientists.
The working group highlighted the need for practical and simple good practice guidance for schools
on the safe use of these machines and materials. It identified that in order to develop this advice
there is a need for scientific evidence, including emissions of particulates and vapours and effective
ways to control exposure to people.
CLEAPSS is an advisory service supporting science and technology teaching for a consortium of local
authorities and their schools. The Department for Education funded a pilot in 2012/13 to explore
how 3D printing could be applied to the Science Engineering Technology and Mathematics (STEM)
curriculum (DfE, 2013), since then the CLEAPSS helpline have received many requests for a model
risk assessment for the use of 3D printers. The leading concerns raised on these forums, related to
the use of 3D printing equipment were the heat of the extrusion area, the possibility of entrapment
in moving parts, and concerns about the hazardous nature of fumes released from the equipment.
CLEAPSS has highlighted that the lack of evidence on the health and safety risks associated with
using 3D printers has limited the advice they can provide to schools.
1.2 AIM AND OBJECTIVES
The aim of this project was to investigate particulate and VOC emissions from desktop FFF 3D
printers.
To achieve this aim, the following objectives were set:
1. Apply a standardised pyrolysis test to identify filament constituents.
2. Characterise the particulate and volatile emissions resulting from FFF processes used by
small desktop 3D printers with consideration of a range of filament materials.
3. Investigate the effectiveness of exposure controls.

12
1.3 FUSED FILAMENT FABRICATION DESKTOP 3D PRINTERS
1.3.1 Fused Filament Fabrication (FFF)
FFF desktop 3D printers are increasingly commonplace and using a computer aided design (CAD) file
which determines the motion of an extruder nozzle and print bed objects can be printed using a
three-axis motion system. As the extruder nozzle moves it extrudes polymer material, drawn from a
spool of filament feedstock, typically 1.75 to 3.00 mm in diameter. A drive gear engages the filament
and forces it through a thermistor-regulated heating block and the nozzle, which produces a strand
of molten plastic that deposits on the print bed and subsequently cools. This deposition builds up
layers one atop the next, as the relative distance between the extruder nozzle and print bed is
adjusted in a fixed increment to produce a 3D printed object (Steuben et al, 2015). A labelled
diagram of an FFF desktop 3D printer is shown in Figure 1.
Figure 1 Key features of an FFF desktop 3D printer
1.3.2 Desktop FFF 3D printers
The 3D printers selected for the experimental work were chosen due to their medium-range cost
and open-frame design. Each printer was easily available to purchase online and each manufacturer
actively promoted their machine for use in the education sector. The maximum build size of the
printers selected was slightly larger than that of lower cost desktop printers, making them more
suitable for business or education applications but less so for hobbyists.
The make, model and filament diameter of the FFF 3D printers tested were:
Ultimaker 2, with 3.00 mm diameter filament
KORA MIDI, with 1.75 mm diameter filament
Makerbot Replicator 2, with 1.75 mm diameter filament

13
1.4 PRINTER FILAMENT
The two most common filament materials used in commercially available desktop 3D FFF printers
are:
PLA, which is a biodegradable plastic that prints at temperatures around 220oC; and
ABS, which is non-biodegradable and prints at higher temperatures of approximately 250oC
(Ragan, 2013).
However, many different types of filaments are available for use in these printers, varying in terms
of mechanical properties, visual appearance, and physical properties, all of which determine the
filament an operator will choose.
The initial plan was to test three to four different filament materials on each of the three printers.
Four filament materials; PLA, ABS, High Impact Polystyrene (HIPS) and NinjaFlex® (thermoplastic
polyurethane); were chosen for comparison in the test chamber experiments. However, it was not
possible to collect comparable data across all printer-filament combination as some of these
filaments were incompatible with the selected printers. A wider range of filament materials,
including a range of colours and other properties, were included in the pyrolysis testing.
Only the Ultimaker 2 was successful in printing with ‘clearwater’ NinjaFlex® filament;
the Makerbot Replicator 2 could not print with ABS as it requires a heated print bed which
the Makerbot Replicator 2 does not have;
and the KORA MIDI was alone in producing repeatable prints with white HIPS.

14
2 METHODS
2.1 TEST PIECE
To standardise the tests, CAD software was used to design a cube shaped test piece with a lattice
internal structure as shown in Figure 2.
These ‘print files’ contained the dimensions of the object to be printed and the nozzle and print bed
temperatures for each filament when used in each printer. Parameters such as nozzle temperature
for each printer-filament combination were chosen to produce the best quality of printed object as
advised by an experienced user of 3D printing equipment. Print files lasting approximately one to
eight hours duration were used to produce different sized cubes. The cube shape of the printed
object was considered appropriate as Azimi et al (2016) found that the size and shape of the test
piece did not meaningfully alter the magnitude of ultrafine particle (UFP) emission rates.
Figure 2 a) Test print cube b) Internal structure of the test print
2.2 TEST CHAMBER
2.2.1 Design
A bespoke wooden test chamber was designed and built, based on BS EN 1093 (Figure 3), in which
the FFF 3D printers were tested.
The volume flow rate of air through the test chamber was 268 m3.h-1 with resulting mean air
velocities of 0.05 m.s-1 and 1.0 m.s-1 through the main chamber and the steel connecting duct
respectively. This was achieved by connecting a fan to the end of the duct to pull air through the
enclosure, as shown in Figure 3.
The airflow rate was monitored downstream of the measurement section, using a 100 mm diameter
duct Wilson Flowgrid (Airflow Instruments, TSI Inc.) and a digital micromanometer MP6KS (Air
Neotronics Ltd.). The differential pressure across the flowgrid maintained a constant pressure of
98 Pa ±1 throughout the experiment indicating excellent airflow stability.
One wall of the test chamber consisted of two 1220 mm x 610 mm high efficiency filters (99.997%
(BS 3928)). The laboratory air was filtered through this wall as it entered the test chamber resulting
a b

15
in particle background levels as close to zero as possible. Seals around the filters were also taped to
reduce the chance of air bypassing the filters.
The test chamber had a hinged access door containing glove ports to allow operation of the printers
without the need to open the chamber and a glass window to monitor the printer throughout each
test. Each printer was positioned inside the test chamber on an elevated wooden platform to raise
the printer nozzle to a central position within the chamber, as the nozzle was considered likely to be
the main particulate and VOC emissions source.
A mixing fan was suspended inside the conical section of the test chamber, level with the duct and
directing its airflow back in to the test chamber to create turbulence to aid mixing and unbiased
sampling. Background particle concentrations were measured with and without the mixing fan
switched on to confirm that the fan did not contribute to the measurements and that no correction
was required.
Measurements of the emissions from the printers were taken at a cross section of the connecting
steel duct; 2.6 m downstream from the test chamber (Section 2.3.2); in accordance with BS EN 1093.
Figure 3 Design and dimensions of the test chamber (not to scale)
2.2.2 Commissioning
Aerosol measurements made through different sampling probe positions at the measurement cross
section were uniform; simultaneous particle count measurements were made using two pTrak 8525
ultrafine particle counters (TSI Inc.). One instrument was used as a reference; sampling from a fixed
position at the centre of the duct. The second instrument sampled for ninety seconds every two
centimetres across the duct, completing both a vertical and horizontal traverse. Other conditions
such as the volume flow rate and the mixing fan were set as described in Section 2.2.1. Traverse
measurements indicated a variation in particle count measurements of <5% across the both
diameters of the duct.
16
2.3 PARTICLE EMISSIONS
2.3.1 Real-time aerosol instruments
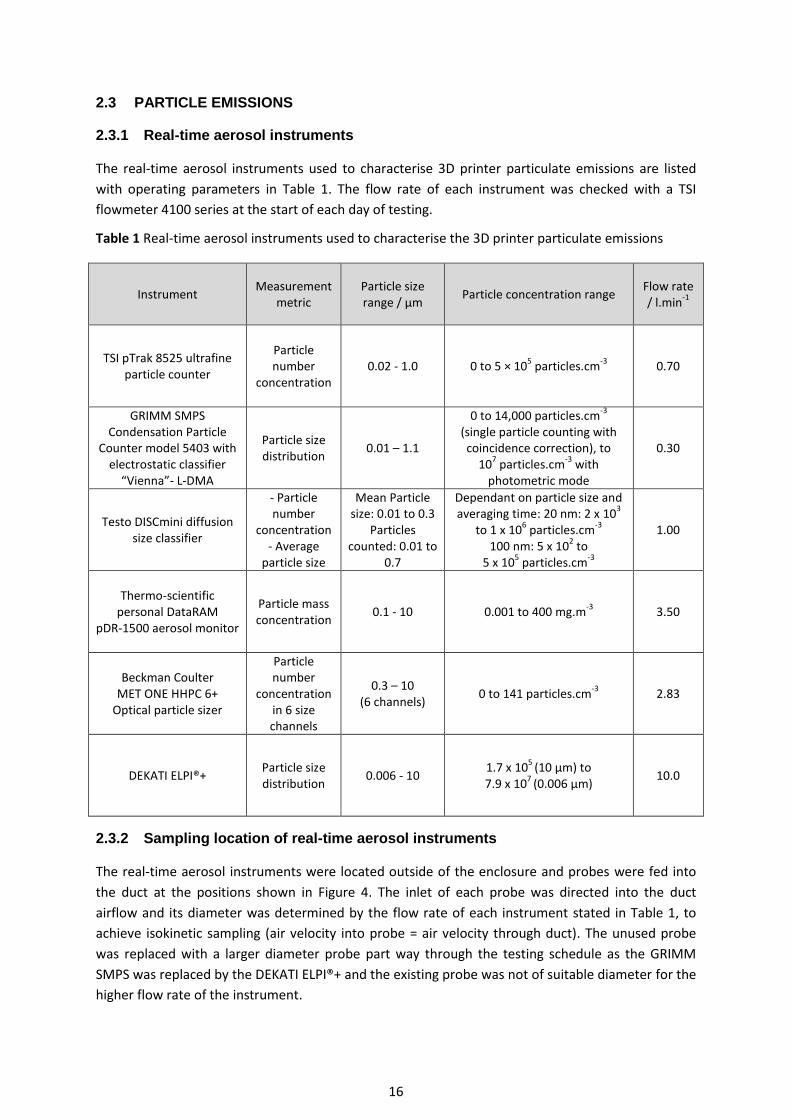
The real-time aerosol instruments used to characterise 3D printer particulate emissions are listed
with operating parameters in Table 1. The flow rate of each instrument was checked with a TSI
flowmeter 4100 series at the start of each day of testing.
Table 1 Real-time aerosol instruments used to characterise the 3D printer particulate emissions
Instrument Measurement
metric Particle size range / µm
Particle concentration range Flow rate / l.min
-1
TSI pTrak 8525 ultrafine particle counter
Particle number
concentration 0.02 - 1.0 0 to 5 × 10
5 particles.cm
-3 0.70
GRIMM SMPS Condensation Particle
Counter model 5403 with electrostatic classifier
“Vienna”- L-DMA
Particle size distribution
0.01 – 1.1
0 to 14,000 particles.cm-3
(single particle counting with coincidence correction), to
107 particles.cm
-3 with
photometric mode
0.30
Testo DISCmini diffusion size classifier
- Particle number
concentration - Average
particle size
Mean Particle size: 0.01 to 0.3
Particles counted: 0.01 to
0.7
Dependant on particle size and averaging time: 20 nm: 2 x 10
3
to 1 x 10⁶ particles.cm
-3
100 nm: 5 x 10² to
5 x 10⁵ particles.cm
-3
1.00
Thermo-scientific personal DataRAM
pDR-1500 aerosol monitor
Particle mass concentration
0.1 - 10 0.001 to 400 mg.m-3
3.50
Beckman Coulter MET ONE HHPC 6+
Optical particle sizer
Particle number
concentration in 6 size channels
0.3 – 10 (6 channels)
0 to 141 particles.cm-3
2.83
DEKATI ELPI®+ Particle size distribution
0.006 - 10 1.7 x 10
5 (10 µm) to
7.9 x 10⁷
(0.006 µm)
10.0
2.3.2 Sampling location of real-time aerosol instruments
The real-time aerosol instruments were located outside of the enclosure and probes were fed into
the duct at the positions shown in Figure 4. The inlet of each probe was directed into the duct
airflow and its diameter was determined by the flow rate of each instrument stated in Table 1, to
achieve isokinetic sampling (air velocity into probe = air velocity through duct). The unused probe
was replaced with a larger diameter probe part way through the testing schedule as the GRIMM
SMPS was replaced by the DEKATI ELPI®+ and the existing probe was not of suitable diameter for the
higher flow rate of the instrument.

17
Figure 4 Cross-sectional view of the duct showing the position of the sampling probes facing into the
airflow: labelled with corresponding real-time instruments attached
2.3.3 Characterising particle emissions with the Transmission Electron Microscope
The Ultimaker 2 3D printer was positioned inside the test chamber and printed a one-hour test print
with white ABS filament. A sample of particles emitted by the printer during the printing process was
collected as air was drawn at 1.5 l.min-1 using Gilain GilAir-5 pumps, through two 25 mm diameter
0.2 µm pore size polycarbonate filters positioned with the printer in the main section of the test
chamber (Figure 5). Three Transmission Electron Microscope (TEM) grids with holey carbon film
were affixed to each filter and particles were collected on the carbon film for observation by TEM.
Particles on the film were also analysed by Energy Dispersive X-ray (EDX) spectroscopy, and
micrographs and EDX spectra were taken to further characterise examples of each particle type.
Figure 5 Position of the TEM grids and pumps inside the test chamber

18
2.3.4 Filament containing embedded metals
The emissions from three samples of filament containing embedded metal particles were sampled to
determine whether metals were released during heating of the filament in the laboratory to
temperatures comparable to those of a 3D printer nozzle. The printer nozzle itself was not used due
to the increased difficulty in printing with this type of filament material. The three filament materials
tested were:
Copper FLEX (Reprapper Tech Ltd.)
BrassFill (colorFabb BV)
BronzeFill (colorFabb BV)
In turn, portions of filament material were heated in a 3 mm inner diameter quartz tube placed in a
SGE Pyrojector furnace (SGE International Pty. Ltd.) The furnace temperature was set to 350°C,
however the airflow through the tube resulted in an actual temperature of approximately 290°C
measured using a Digitron™ thermocouple. A flow rate of 750 ml.min-1 and a sampling time of two
minutes produced a sample volume of 1.5 litres.
As before, particulate emissions were sampled onto three TEM grids with holey carbon film affixed
to a 25 mm diameter 0.2 µm pore size polycarbonate filter. The particles caught on the carbon film
were observed by TEM and analysed by EDX spectroscopy. Micrographs and EDX spectra were taken
for examples of each particle type found.
2.4 VOLATILE ORGANIC COMPOUNDS
2.4.1 Sampling tubes
Specialist sampling tubes (inert steel tubes packed with Tenax TA) were used to collect any VOCs
generated by the printing process. Prior to use, the tubes were conditioned at 300°C for 60 minutes.
During testing, air was drawn into the sampler by a Gilian GilAir 5 pump at a flow rate of
approximately 0.1 l.min-1 allowing airborne vapours to be absorbed onto the sorbent inside the tube.
The tube was then heated in a stream of inert carrier gas, transferring a proportion of the sorbed
analytes to a capillary gas chromatograph (GC) where they were separated and detected. Initial
analysis of the collected sample was undertaken using a TurboMatrix™ TD650 and Clarus® GC with
flame ionisation detection (TD/GC/FID) system and TotalChrom™ control software
(PerkinElmer Inc.). This had the capability to split the sample flow path to allow recollection of part
of the desorbed sample back on to the original sample tube to allow the possibility of further
analysis. Further analysis of the recollected sample was undertaken using a TurboMatrix™ TD350
thermal desorption and a Clarus® GC with mass selective detection (TD/GC/MS) system and
Turbomass™ control software.
Tests were also performed without the printing process to establish background VOC quantities.
2.4.2 Sampling inside the test chamber
A sorbent tube (Section 2.4.1) was inserted into the duct of the test chamber through a hole at the
measurement cross-section during each test print.

19
When printing with PLA, specialised sampling tubes containing silica gel impregnated with
2,4-Dinitrophenylhydrazine (DNPH) a derivatising agent were also included adjacent to the other
sorbent tube at the measurement cross-section shown in Figure 3. These specialised tubes actively
sampled to collect aldehyde compounds at an approximate rate of 0.2 l.min-1.
Upon analysis of these sampling tubes, it was determined that the dilution of emissions with the
filtered inlet air inside the test chamber was too great to collect adequate sample quantities for
analysis. This was due to the high-volume flow rate required for optimum use of the particle
characterising instruments. It was determined that this was not an effective method for measuring
VOC emission rates released during 3D printing.
2.4.3 Alternative method - sampling inside an enclosed box
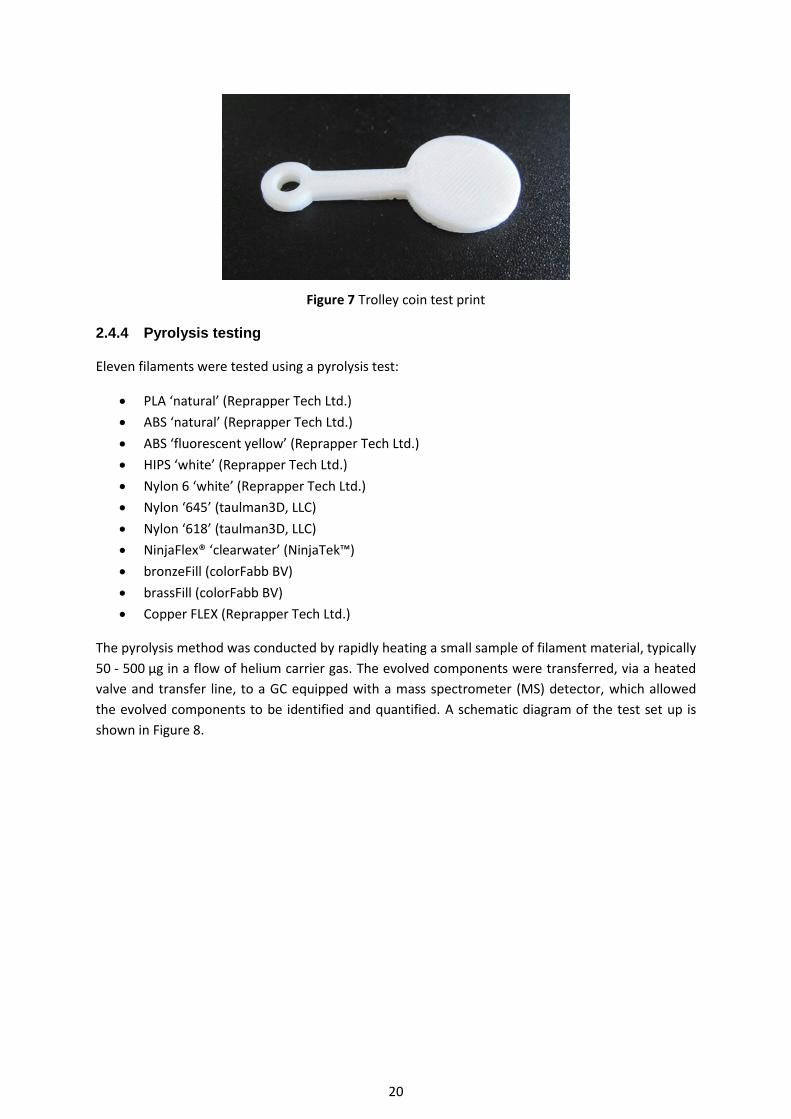
The printer was positioned inside an unventilated Perspex box atop the bench (Figure 6a). To avoid
overloading the sorbent sampling tubes, a small trolley coin (Figure 7) was printed rather than a
cube, taking just seven minutes to complete. Gilian GilAir-5 pumps were connected to four sorbent
tubes (Section 2.4.1) and actively sampled at 0.1 l.min-1 during the time the printer heated in
preparation for the print and for the duration of the printing, totalling twelve minutes. The tubes
were positioned at different points within the enclosure (Figure 6b). The test was then repeated at
printer nozzle temperatures in five-degree intervals from 220 to 235oC.
Figure 6 a) KORA MIDI 3D printer inside the enclosed Perspex box with pumps positioned outside
attached to thermal desorption tubes b) Positions and labels of thermal desorption tubes for
sampling VOCs inside the enclosed Perspex box
a
b
20
Figure 7 Trolley coin test print
2.4.4 Pyrolysis testing
Eleven filaments were tested using a pyrolysis test:
PLA ‘natural’ (Reprapper Tech Ltd.)
ABS ‘natural’ (Reprapper Tech Ltd.)
ABS ‘fluorescent yellow’ (Reprapper Tech Ltd.)
HIPS ‘white’ (Reprapper Tech Ltd.)
Nylon 6 ‘white’ (Reprapper Tech Ltd.)
Nylon ‘645’ (taulman3D, LLC)
Nylon ‘618’ (taulman3D, LLC)
NinjaFlex® ‘clearwater’ (NinjaTek™)
bronzeFill (colorFabb BV)
brassFill (colorFabb BV)
Copper FLEX (Reprapper Tech Ltd.)
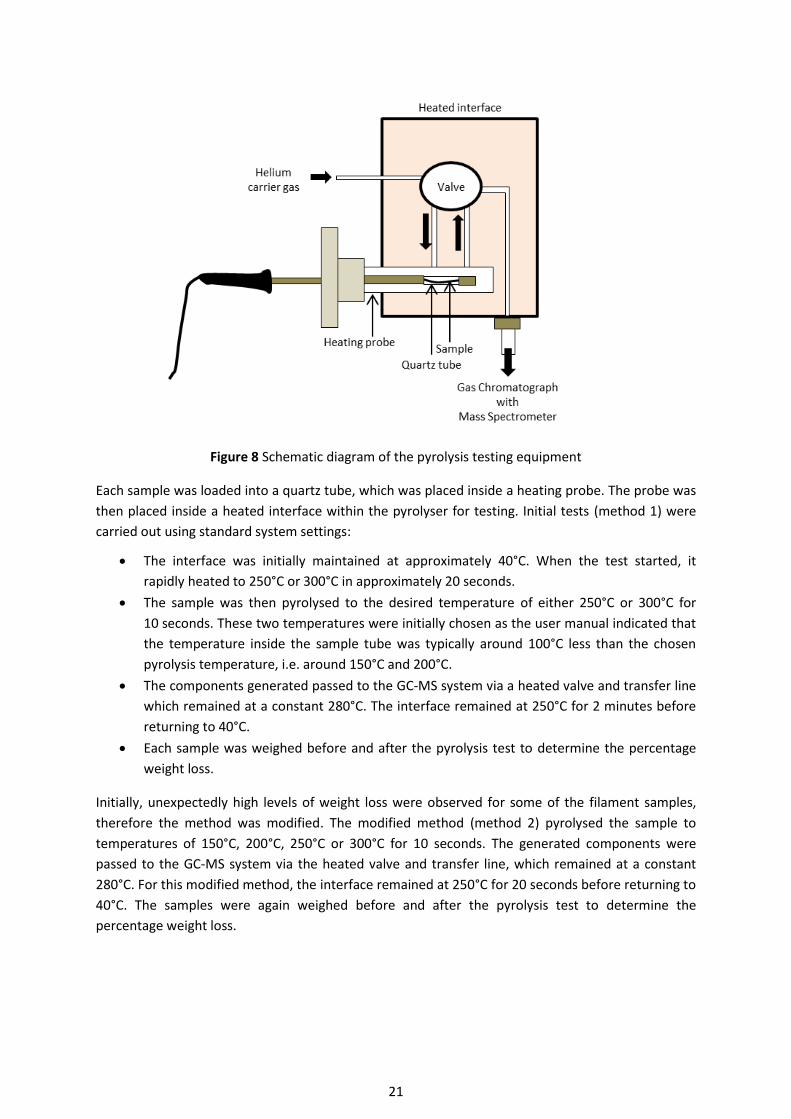
The pyrolysis method was conducted by rapidly heating a small sample of filament material, typically
50 - 500 µg in a flow of helium carrier gas. The evolved components were transferred, via a heated
valve and transfer line, to a GC equipped with a mass spectrometer (MS) detector, which allowed
the evolved components to be identified and quantified. A schematic diagram of the test set up is
shown in Figure 8.
21
Figure 8 Schematic diagram of the pyrolysis testing equipment
Each sample was loaded into a quartz tube, which was placed inside a heating probe. The probe was
then placed inside a heated interface within the pyrolyser for testing. Initial tests (method 1) were
carried out using standard system settings:
The interface was initially maintained at approximately 40°C. When the test started, it
rapidly heated to 250°C or 300°C in approximately 20 seconds.
The sample was then pyrolysed to the desired temperature of either 250°C or 300°C for
10 seconds. These two temperatures were initially chosen as the user manual indicated that
the temperature inside the sample tube was typically around 100°C less than the chosen
pyrolysis temperature, i.e. around 150°C and 200°C.
The components generated passed to the GC-MS system via a heated valve and transfer line
which remained at a constant 280°C. The interface remained at 250°C for 2 minutes before
returning to 40°C.
Each sample was weighed before and after the pyrolysis test to determine the percentage
weight loss.
Initially, unexpectedly high levels of weight loss were observed for some of the filament samples,
therefore the method was modified. The modified method (method 2) pyrolysed the sample to
temperatures of 150°C, 200°C, 250°C or 300°C for 10 seconds. The generated components were
passed to the GC-MS system via the heated valve and transfer line, which remained at a constant
280°C. For this modified method, the interface remained at 250°C for 20 seconds before returning to
40°C. The samples were again weighed before and after the pyrolysis test to determine the
percentage weight loss.

22
2.5 EXPOSURE CONTROL
2.5.1 Description of the enclosing hood
The exposure control method evaluated was an enclosing hood consisting of a Perspex box, of outer
dimensions 550 x 500 x 700 mm (length x width x height) and volume 0.1925 m3, placed over the 3D
printer. A circular access point (40 mm diameter) in the front panel allowed the 3D printer controls
to be used without the need to lift the hood. A hole in the roof of the enclosing hood allowed a
panel to be fitted, which housed a fan and a H13 High Efficiency Particulate Air (HEPA) filter with
active carbon coating on the internal filter face.
The fan could be orientated to allow the enclosing hood to function in two modes: exhausting and
recirculating. In exhausting mode, the hood was raised by 5 mm from the surface on which it rested
by slotting four Perspex feet at the corners. This allowed air from the room to enter the hood at its
base, which was then filtered as the fan exhausted it back in to the room. In recirculating mode, the
feet were removed to close the gap at the base of the hood and the filter panel was adjusted so that
the fan recirculated the air within the enclosing hood.
The airflow rate of the enclosing hood’s fan was determined using a ‘balanced pressure technique’
similar to that used by Bancroft et al (1980), and was found to equal 37 l.min-1.
2.5.2 Testing the enclosing hood in the test chamber
The printer was placed inside the enclosing hood and both were positioned inside the test chamber.
A smoke tube was used to visualise airflows around the base of the hood and to determine that the
airflow into the enclosing hood was sufficient to overcome any movement caused by airflow through
the test chamber.
Four test prints were completed using ABS filament; two tests in exhausting mode and two in
recirculating mode. The results of these tests were compared with those from the same test carried
out without the enclosing hood. During these tests, the print bed was set to 78°C and the nozzle
temperature was set to 250°C.
2.5.3 Testing the enclosing hood on an open bench
The printer was placed inside the enclosing hood on an open bench in the laboratory and printed a
one-hour test print using PLA filament. Two TSI pTrak instruments were used to compare the particle
concentration inside the hood with the particle concentration outside the hood. Both instruments
were positioned outside the enclosing hood and one was attached to tubing that passed to a
position below the filter inside the enclosing hood. Both instruments sampled for thirty seconds
every ten minutes. The temperature inside the enclosing hood was also monitored throughout the
test. Logging was not continuous to avoid influencing the particle concentration that may result as
air is removed from the enclosing hood by the pump of the TSI pTrak instrument.
The pTrak instrument was used for these tests as the average particle size was within its detectable
size range and two instruments were available.
The experimental setup is shown in Figure 9. Four tests were completed; two in exhausting mode
and two in recirculating mode.

23
Figure 9 Experimental set up for measuring the particle concentration inside and outside the
enclosing hood during a 3D print using TSI pTrak instruments

24
3 RESULTS
3.1 PARTICLE EMISSIONS
3.1.1 Printing with the same filament on different printers
The KORA MIDI printer was positioned inside the test chamber and set to print with 1.75 mm
diameter PLA filament with a nozzle temperature of 220oC and a print bed temperature of 50oC. The
filament was then transferred to the Makerbot Replicator 2 which printed a slightly longer test at
230oC nozzle temperature. The Makerbot Replicator 2 did not have a heated print bed so this
remained at the ambient temperature inside the test chamber. These tests were repeated to
produce three data sets for each printer. The average particle concentration, measured with the TSI
pTrak, for both FFF 3D printers using PLA filament is presented in Figure 10. This filament could not
be used in the Ultimaker 2 as it requires 3 mm filament.
Figure 10 Average particle concentration measured with the TSI pTrak during a print using the same
PLA filament spool on the KORA MIDI (nozzle = 220oC and print bed = 50oC) and the Makerbot
Replicator 2 (nozzle = 230oC and print bed = ambient temperature)
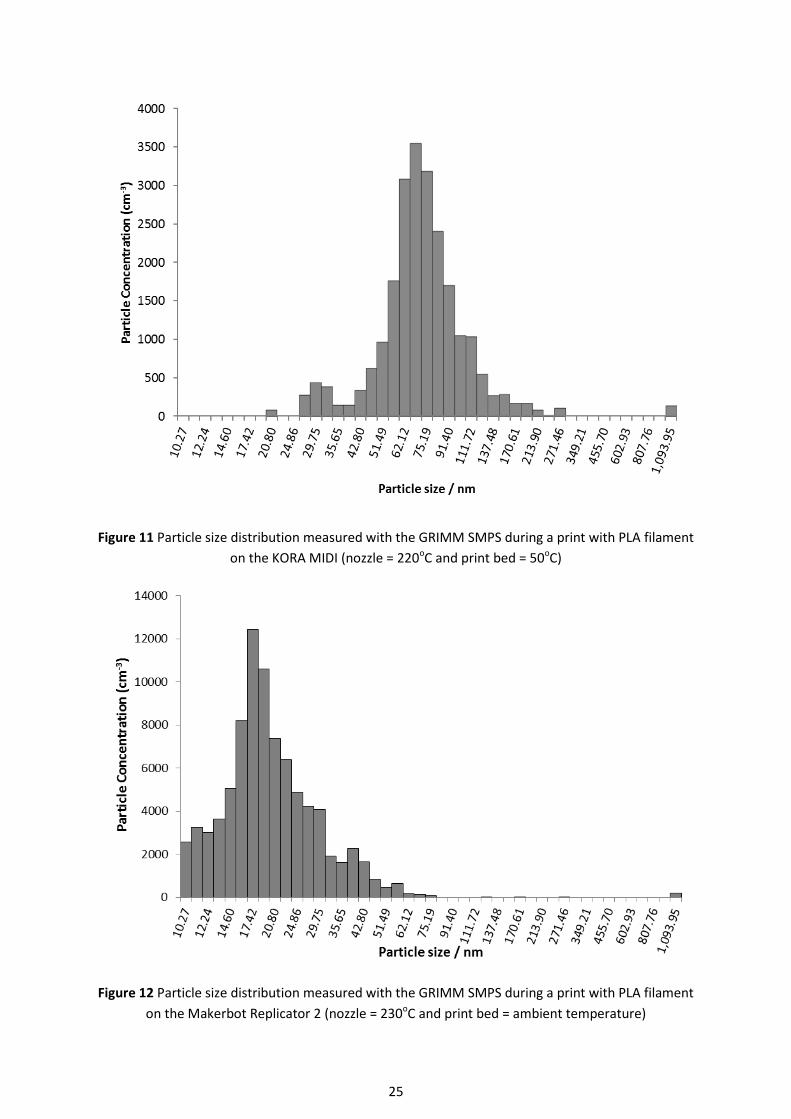
The particle size distribution was measured throughout the tests using the GRIMM SMPS
instrument. These results are presented in Figure 11 and Figure 12 respectively.
25
Figure 11 Particle size distribution measured with the GRIMM SMPS during a print with PLA filament
on the KORA MIDI (nozzle = 220oC and print bed = 50oC)
Figure 12 Particle size distribution measured with the GRIMM SMPS during a print with PLA filament
on the Makerbot Replicator 2 (nozzle = 230oC and print bed = ambient temperature)
26
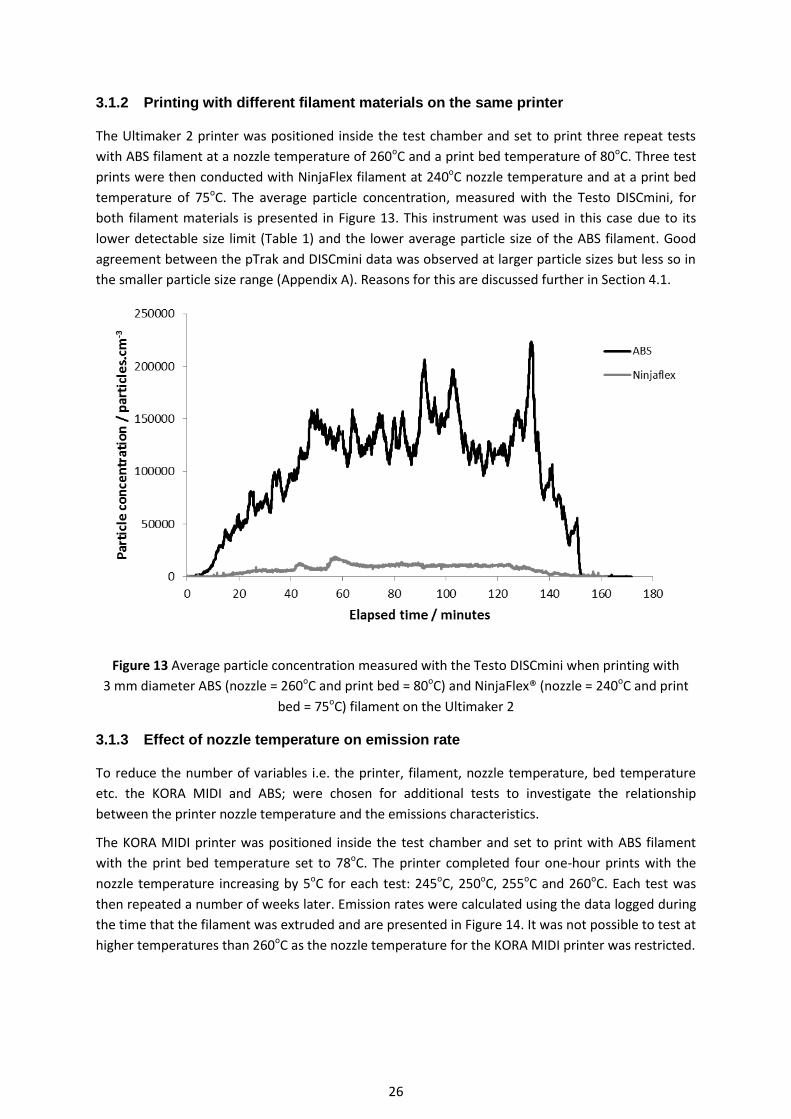
3.1.2 Printing with different filament materials on the same printer
The Ultimaker 2 printer was positioned inside the test chamber and set to print three repeat tests
with ABS filament at a nozzle temperature of 260oC and a print bed temperature of 80oC. Three test
prints were then conducted with NinjaFlex filament at 240oC nozzle temperature and at a print bed
temperature of 75oC. The average particle concentration, measured with the Testo DISCmini, for
both filament materials is presented in Figure 13. This instrument was used in this case due to its
lower detectable size limit (Table 1) and the lower average particle size of the ABS filament. Good
agreement between the pTrak and DISCmini data was observed at larger particle sizes but less so in
the smaller particle size range (Appendix A). Reasons for this are discussed further in Section 4.1.
Figure 13 Average particle concentration measured with the Testo DISCmini when printing with
3 mm diameter ABS (nozzle = 260oC and print bed = 80oC) and NinjaFlex® (nozzle = 240oC and print
bed = 75oC) filament on the Ultimaker 2
3.1.3 Effect of nozzle temperature on emission rate
To reduce the number of variables i.e. the printer, filament, nozzle temperature, bed temperature
etc. the KORA MIDI and ABS; were chosen for additional tests to investigate the relationship
between the printer nozzle temperature and the emissions characteristics.
The KORA MIDI printer was positioned inside the test chamber and set to print with ABS filament
with the print bed temperature set to 78oC. The printer completed four one-hour prints with the
nozzle temperature increasing by 5oC for each test: 245oC, 250oC, 255oC and 260oC. Each test was
then repeated a number of weeks later. Emission rates were calculated using the data logged during
the time that the filament was extruded and are presented in Figure 14. It was not possible to test at
higher temperatures than 260oC as the nozzle temperature for the KORA MIDI printer was restricted.
27
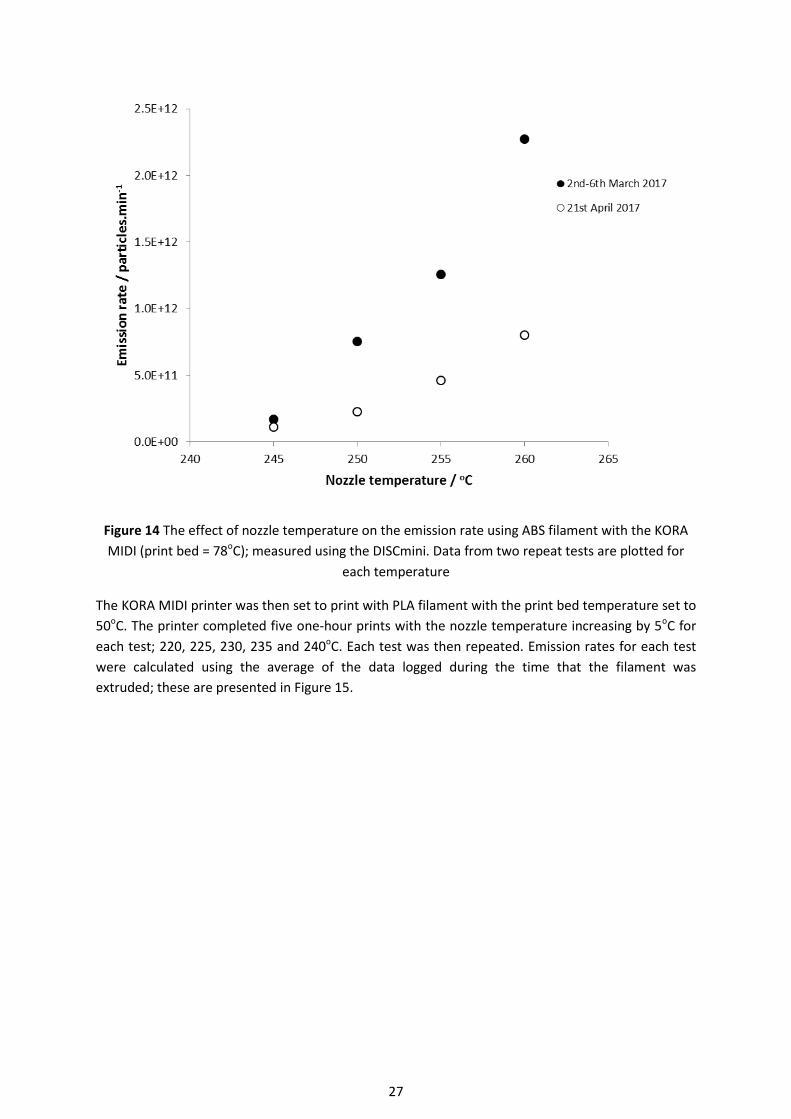
Figure 14 The effect of nozzle temperature on the emission rate using ABS filament with the KORA
MIDI (print bed = 78oC); measured using the DISCmini. Data from two repeat tests are plotted for
each temperature
The KORA MIDI printer was then set to print with PLA filament with the print bed temperature set to
50oC. The printer completed five one-hour prints with the nozzle temperature increasing by 5oC for
each test; 220, 225, 230, 235 and 240oC. Each test was then repeated. Emission rates for each test
were calculated using the average of the data logged during the time that the filament was
extruded; these are presented in Figure 15.

28
Figure 15 The effect of nozzle temperature on the emission rate using PLA filament with the KORA
MIDI; measured using the DISCmini. Two emission rates are plotted for each temperature from
repeat tests (three for 220oC)
3.1.4 Effect of nozzle temperature on particle size
Further to investigating the relationship between nozzle temperature and emission rate, the
DISCmini was also used to measure the average particle size during the tests described in
Section 3.1.3. When the KORA MIDI printed with ABS filament, the average particle size measured as
the filament was being extruded did not rise above 10 nm (Table 2), which is the lower particle size
limit for the DISCmini instrument. The average particle sizes measured for all tests with PLA were
above the lower particle size limit of the instrument. The results are presented in Figure 16.
29
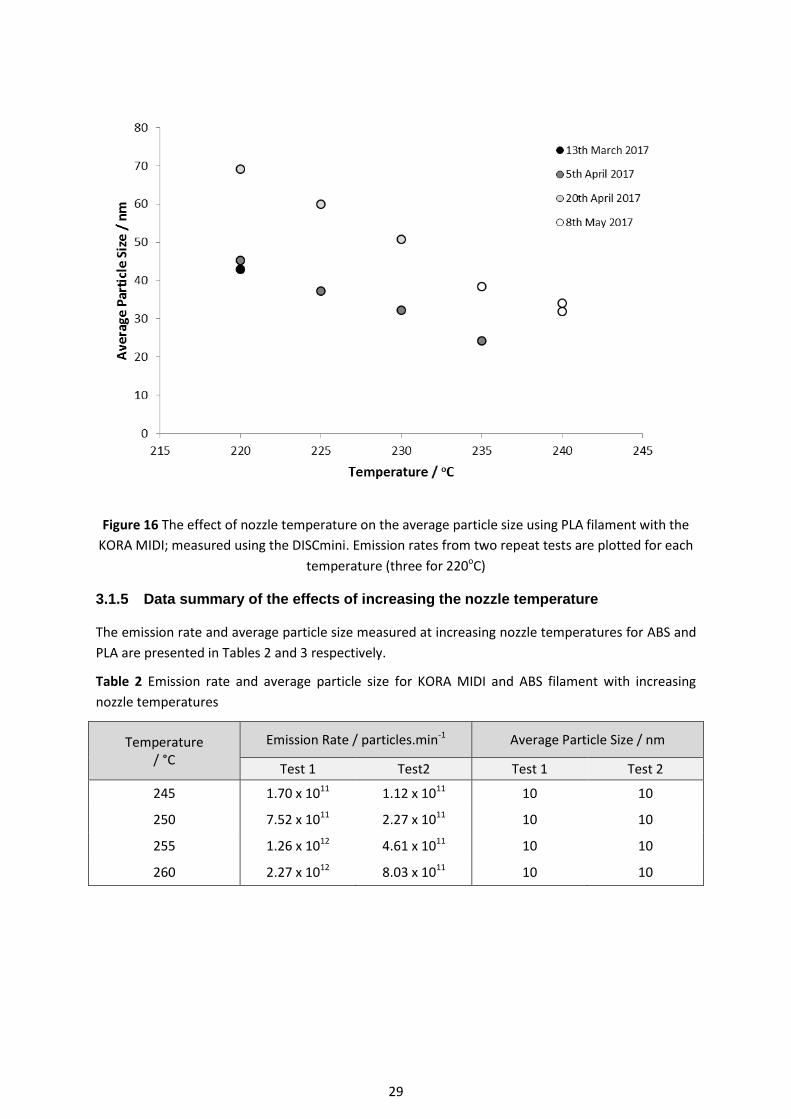
Figure 16 The effect of nozzle temperature on the average particle size using PLA filament with the
KORA MIDI; measured using the DISCmini. Emission rates from two repeat tests are plotted for each
temperature (three for 220oC)
3.1.5 Data summary of the effects of increasing the nozzle temperature
The emission rate and average particle size measured at increasing nozzle temperatures for ABS and
PLA are presented in Tables 2 and 3 respectively.
Table 2 Emission rate and average particle size for KORA MIDI and ABS filament with increasing
nozzle temperatures
Temperature / °C
Emission Rate / particles.min-1 Average Particle Size / nm
Test 1 Test2 Test 1 Test 2
245 1.70 x 10¹¹ 1.12 x 10¹¹ 10 10
250 7.52 x 10¹¹ 2.27 x 10¹¹ 10 10
255 1.26 x 10¹² 4.61 x 10¹¹ 10 10
260 2.27 x 10¹² 8.03 x 10¹¹ 10 10

30
Table 3 Emission rate and average particle size for KORA MIDI and PLA filament with increasing
nozzle temperatures
Temperature / °C Emission Rate / particles.min-1 Average Particle Size / nm
Test 1 Test2 Test 3 Test 1 Test 2
220 8.08 x 10⁹ 3.26 x 10⁹ 7.04 x 10⁹ 45 69
225 1.28 x 10¹⁰ 5.49 x 10⁹ N/A 37 60
230 2.65 x 10¹⁰ 8.85 x 10⁹ N/A 32 51
235 8.23 x 10¹⁰ 2.26 x 10¹⁰ N/A 24 38
240 5.72 x 10¹⁰ 4.64 x 10¹⁰ N/A 32 34
3.1.6 Characterising particle emissions with the TEM
Emissions from the printer were sampled in the test chamber to characterise the polymer particles
emitted. However, despite high particle concentrations measured downstream, no polymer particles
were observed by TEM on the grids. Possible reasons for this are discussed in Section 4. Some metal
particles were observed and images and EDX spectra of examples of these particles can be found in
Appendix B.1. This analysis was qualitative only, providing information on the particle types present,
but not on the concentration.
3.1.7 Filament materials containing embedded metal
Particulate emissions were sampled onto three TEM grids as samples of Copper FLEX, brassFill and
bronzeFill filament materials were heated (Section 2.3.4). The particles caught on the carbon film
were observed by TEM and analysed by EDX spectroscopy. Micrographs and EDX spectra were taken
for examples of each particle type found.
Copper FLEX
One particle type composing primarily of copper was found. These were generally in the range of
2 - 10 µm in diameter. Other particles composed primarily of iron and a few composed primarily of
calcium were also observed; these were generally smaller at approximately 50 - 500 nm.
Images and EDX spectra of the copper particles are included in Appendix B.2. The iron and calcium
particles were very similar to those found in the other samples. An example of each of these particle
types is shown in the results for the bronzeFill sample (Appendix B.4).
brassFill
One particle type, composing predominantly of copper and zinc, was found. These particles were
generally between 0.2 and 2 µm in diameter. Other particles composed primarily of iron and a few
composed primarily of calcium were also observed. These particles were generally smaller at
approximately 50-500 nm.

31
Images and EDX spectra of examples of the copper particles are included in Appendix B.3. The iron
and calcium particles were very similar to those found in the other samples. An example of each of
these particle types is shown in the results for the bronzeFill sample (Appendix B.4).
bronzeFill
One particle type composing predominantly of copper and tin; some also containing chromium;
were found. These particles varied in size from approximately 0.2 µm to 5 µm in diameter. Other
particles composed primarily of iron and a few composed primarily of calcium were also observed.
These particles were generally smaller with diameters between approximately 50 and 500 nm.
Images and EDX spectra of examples of all the particle types observed are included in Appendix B.4.
3.2 VOLATILE ORGANIC COMPOUNDS
3.2.1 Sampling inside an enclosed box over a range of nozzle temperatures
The recovered VOC species from the sampling tube positioned close to the nozzle of the KORA MIDI
printer (Figure 6b), whilst printing with PLA, inside an enclosed box are presented in Figure 17. The
concentration of each VOC detected in the sample tube can be compared to a corresponding
concentration in the ‘blank’ sample; taken from the box when printing was not taking place. These
results are also presented in Figure 17.

32
Figure 17 Recovered VOC species from a sampling tube at the nozzle of the KORA MIDI whilst printing with PLA inside an enclosed box across a range of
nozzle temperatures 200oC – 235oC.
33
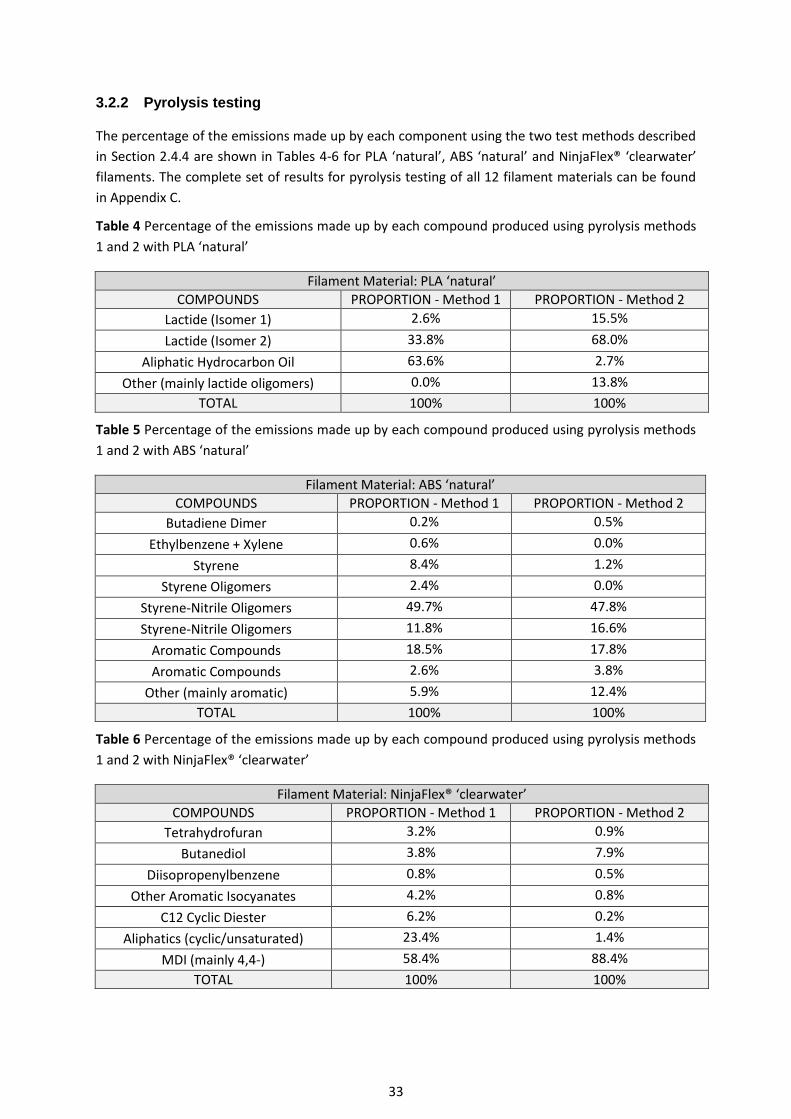
3.2.2 Pyrolysis testing
The percentage of the emissions made up by each component using the two test methods described
in Section 2.4.4 are shown in Tables 4-6 for PLA ‘natural’, ABS ‘natural’ and NinjaFlex® ‘clearwater’
filaments. The complete set of results for pyrolysis testing of all 12 filament materials can be found
in Appendix C.
Table 4 Percentage of the emissions made up by each compound produced using pyrolysis methods
1 and 2 with PLA ‘natural’
Filament Material: PLA ‘natural’
COMPOUNDS PROPORTION - Method 1 PROPORTION - Method 2
Lactide (Isomer 1) 2.6% 15.5%
Lactide (Isomer 2) 33.8% 68.0%
Aliphatic Hydrocarbon Oil 63.6% 2.7%
Other (mainly lactide oligomers) 0.0% 13.8%
TOTAL 100% 100%
Table 5 Percentage of the emissions made up by each compound produced using pyrolysis methods
1 and 2 with ABS ‘natural’
Filament Material: ABS ‘natural’
COMPOUNDS PROPORTION - Method 1 PROPORTION - Method 2
Butadiene Dimer 0.2% 0.5%
Ethylbenzene + Xylene 0.6% 0.0%
Styrene 8.4% 1.2%
Styrene Oligomers 2.4% 0.0%
Styrene-Nitrile Oligomers 49.7% 47.8%
Styrene-Nitrile Oligomers 11.8% 16.6%
Aromatic Compounds 18.5% 17.8%
Aromatic Compounds 2.6% 3.8%
Other (mainly aromatic) 5.9% 12.4%
TOTAL 100% 100%
Table 6 Percentage of the emissions made up by each compound produced using pyrolysis methods
1 and 2 with NinjaFlex® ‘clearwater’
Filament Material: NinjaFlex® ‘clearwater’
COMPOUNDS PROPORTION - Method 1 PROPORTION - Method 2
Tetrahydrofuran 3.2% 0.9%
Butanediol 3.8% 7.9%
Diisopropenylbenzene 0.8% 0.5%
Other Aromatic Isocyanates 4.2% 0.8%
C12 Cyclic Diester 6.2% 0.2%
Aliphatics (cyclic/unsaturated) 23.4% 1.4%
MDI (mainly 4,4-) 58.4% 88.4%
TOTAL 100% 100%

34
3.3 EXPOSURE CONTROL
3.3.1 Measuring emissions inside the test chamber with and without the enclosing
hood in place
The enclosing hood was used in both modes (exhausting and recirculating). Measurements made
with and without the enclosing hood in place, in both operating modes, were compared. Emission
rates were calculated from the data collected at the measurements cross-section with the DISCmini
during the time that the printer was extruding. The results are presented in Table 7.
Table 7 Emission rates of KORA MIDI printer and ABS filament (nozzle = 250oC and print bed = 78oC);
no control, exhausting mode, and recirculating mode; measured with the DISCmini. All values
presented are averaged over two repeat tests
Control Emission Rate / particles.min-1 Reduction in emission rate compared
with no control / %
No control 4.90 x 10¹¹ N/A
Exhausting 1.48 x 10¹⁰ 97.0
Recirculating 2.73 x 10⁹ 99.4
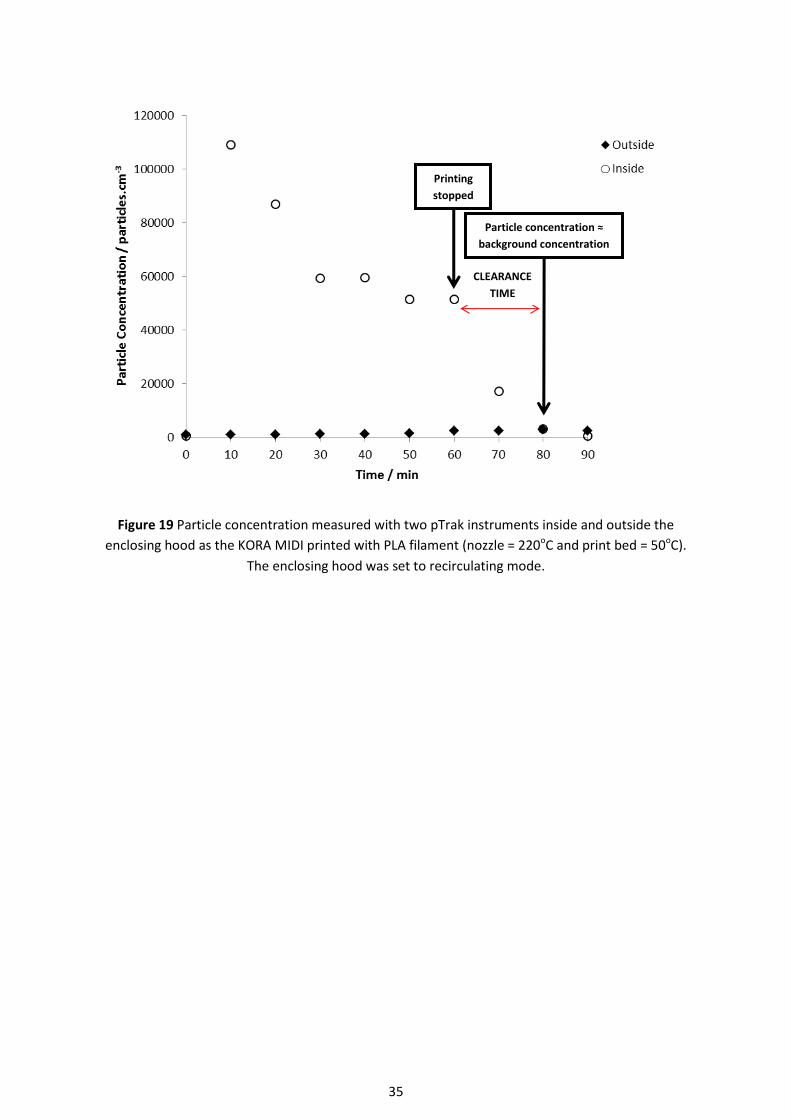
3.3.2 Measuring particle concentrations inside the enclosing hood and determining
the particle clearance time
The concentration of particles inside and outside the enclosing hood when printing with PLA
filament are presented in Figures 18 and 19 for the exhausting and recirculating modes respectively.
Figure 18 Particle concentration measured with two pTrak instruments inside and outside the
enclosing hood as the KORA MIDI printed with PLA filament (nozzle = 220oC and print bed = 50oC).
The enclosing hood was set to exhausting mode.
CLEARANCE
TIME
Printing
stopped
Particle co c a o ≈
background concentration
35
Figure 19 Particle concentration measured with two pTrak instruments inside and outside the
enclosing hood as the KORA MIDI printed with PLA filament (nozzle = 220oC and print bed = 50oC).
The enclosing hood was set to recirculating mode.
Printing
stopped
a cl co c a o ≈
background concentration
CLEARANCE
TIME

36
4 DISCUSSION
4.1 EMISSION RATES
The test method used to measure the particulate emissions from the FFF 3D printers for this project
was based on BS EN 1093. This method differs from that used in a number of other published studies
e.g. Floyd et al (2017), Azimi et al (2016), Kim et al (2015). The measurement method used here was
considered preferential to that used by others as it reduced the possibility of sampling bias through
mixing of the aerosol. The time for the aerosol to travel from the printer to the measurement
cross-section of the test chamber was calculated to be approximately 17 seconds and therefore
considered negligible in comparison to the length of each test of one to two hours.
The range of real-time instruments used enabled characterisation of the size and concentration of
particulate emissions. Data from the DataRAM and MetOne instruments are not reported here as
the measurements did not rise significantly above the background level for the duration of all tests.
This is principally because the maximum size of particles emitted from the printer was below the
detectable size range of these instruments (Table 1).
The initial plan was to test a range of three to four different filament materials (Section 1.4) on three
different printers (Section 1.3.2). However, it became apparent that this would not be possible as
some printers were not compatible with printing certain filament materials. Only the Ultimaker 2
was successful in printing with ‘clearwater’ NinjaFlex® filament and the KORA MIDI was alone in
producing repeatable prints with white HIPS. Therefore, it was not possible to collect comparable
data across all printer-filament combinations.
The KORA MIDI and the Makerbot Replicator 2 both printed with ‘natural’ PLA filament. The spool of
filament was transferred from one printer to the next for comparison. When a 3.00 mm diameter
PLA filament was used with the Ultimaker 2, it failed to feed filament to the nozzle. The results of
these tests (Figure 10) showed a significant difference in the concentration measured with the pTrak
when the same PLA filament was used in different printers. The KORA MIDI produced an average
particle concentration of approximately 1500 particles.cm-3 compared to 7500 particles.cm-3
produced with the Makerbot 2. Although the filament material was the same in both cases, the
selected printer temperatures were different. The nozzle temperatures were 220°C and 230°C and
the print bed temperatures were 50°C and ‘ambient’ on the KORA MIDI and the
Makerbot Replicator 2 respectively. These differences are likely to be the main reason for the
difference in particle concentrations observed.
The particle size distributions of the emissions were also different (Figure 11 and Figure 12). The
Makerbot Replicator 2 distribution represented a much smaller particle size. Despite the print bed
being approximately 30°C cooler than that of the KORA MIDI, the nozzle of this printer was ten
degrees hotter and this was considered the reason for this result. From this it was concluded that
the printer’s nozzle temperature was more significant in affecting the emissions than the
temperature of the print bed.
The KORA MIDI and the Ultimaker 2 both printed with transparent ABS filament. The same spool of
filament could not be used in both printers since the KORA MIDI uses a 1.75 mm diameter filament
and the Ultimaker 2 a 3.00 mm diameter filament. Both ABS spools were purchased from one
manufacturer. The Makerbot Replicator 2 was not compatible with ABS printing as it did not have a
37
heated print bed. The particle concentration measured when the Ultimaker 2 printed with ABS
(Figure 13) was less stable across the print duration than that observed when printing on the KORA
MIDI, which showed a similar pattern to that for PLA printing (Figure 10). The reason for this was
unknown but could be due to the larger diameter filament used in the Ultimaker 2.
It was determined upon review of the initial results for the different printer-filament combinations
that the number of variables i.e. the printer, filament, nozzle temperature, bed temperature etc. in
each test should be reduced. Therefore, one printer and one filament; the KORA MIDI and ABS; were
chosen for additional tests to investigate the relationship between the printer nozzle temperature
and the emissions characteristics.
At a bed temperature of 78°C, the KORA MIDI’s nozzle temperature was increased in five degree
increments between 245 – 260oC for each test. In this temperature range, the particle emission rate
increased as the nozzle temperature increased (Figure 14). This compared with results obtained by
Mendes et al (2017), who found that when increasing the nozzle temperature from 238oC to 250oC
for ABS printing, the particle emission rate increased, on average, ten times.
The DISCmini was also used by HSE to measure the average particle size however, no relationship
between the particle size and the nozzle temperature could be determined from these tests as the
value did not exceed 10 nm, which was the lower size limit of the instrument. Mendes et al (2017)
were the first to present particle size measurements smaller than 10 nm, and measured particles in
the size range 1 – 3 nm in great abundance in all the print cycles. They reported mean particle sizes
of 7.6 - 10.5 nm for PLA and ABS, which was smaller than other recent studies (Stephens et al, 2013
and Kim et al, 2015). This agreed more closely with the average size of ABS emissions measured by
HSE but was smaller than the average particle size of PLA emissions.
To investigate the relationship between the average particle size of the emissions and the nozzle
temperature of the KORA MIDI, further tests were carried out using PLA filament at a constant print
bed temperature of 50°C. The nozzle temperature was increased in 5°C increments through the
range 220 – 240oC. As the nozzle temperature increased through this range, the average particle size
decreased (Figure 16).
Despite good repeatability of tests when performed within a short timeframe (days); there were
distinct differences in the absolute emission rate values (Figures 14 and 15) and the average particle
size (Figure 16) when the period of time between tests was longer (weeks/months). However, when
considering the data taken within each shorter time frame as separate sets, i.e. 2nd - 6th March set
one and 21st April set two (Figure 14), both show a similar trend between the nozzle temperature
and emission rate. Azimi et al (2016) also found that data from two sets of duplicate tests
demonstrated some inherent variability in UFP emissions.
The emission rates measured in this research are comparable to those reported by other
researchers, such as Stephens et al (2013). They estimated that total UFP emission rates varied from
2.0 x 10¹⁰ to 1.9 x 10¹¹ particles.min-1 and depended on the filament material. The results of this
work showed that emission rates exceeding this range were possible when printing at higher printer
nozzle temperatures (Table 2).
A comparison was made between the calculated emission rates from this study and those reported
by He et al (2007) for traditional printers currently found in the office environment. He et al found
that of 62 traditional printers in an office building, 60% did not emit sub-micrometre particles.

38
Emission rates for those printers that did emit sub-micrometre particles were estimated to be in the
range of 4.0 x 10⁷ – 1.6 x 10¹¹ particles.min-1. All of the 3D FFF printers in this research emitted
sub-micrometre particles across all of the filament material tested. The highest emission rate
measured by He et al was comparable to the lowest emission rate measured for the KORA MIDI
printer printing with ABS filament (Table 2). Emission rates measured for the KORA MIDI printing
with PLA filament were lower than those for ABS and below the highest emission rates measured by
He et al. However, the lowest emission rate for PLA filament was two orders of magnitude greater
than the lowest measured for office printers (Table 3).
Data presented in Appendix A shows that there was good agreement in the particle concentration
measured with the pTrak and the DISCmini when printing with PLA. However, differences between
the data from these instruments were observed when printing with ABS, with the concentration
reading higher with the DISCmini. This would be expected due to its lower detectable size limit and
the smaller average particle size produced by ABS filament. The DISCmini is also known to
overestimate particle concentrations at particle sizes <20 nm (Todea, 2017).
When analysing the TEM grid samples from inside the test chamber whilst printing with ABS using
the Ultimaker 2 printer, polymer particles were not observed. The direct sampling method used
(Section 2.3.3), meant that there was no phase of sample preparation during which these particles
could have dissolved or interacted with a reagent. One possible reason for not observing polymer
particles could be due to the significantly reduced contrast in TEM images of this type of particle.
Another reason could be the small size of these particles relative to the pore size of the grid,
resulting in the majority of these particles bypassing the grid. Mendes et al (2017) also found that
their TEM sample analysis showed very little number or none detectable particles and did not allow
further conclusions. These tests could be repeated with a filament such as PLA that generates larger
average particle size. Some metal particles were observed and images and EDX spectra of examples
of these particles can be found in Appendix B.1.
The TEM and EDX analysis of emissions from filament containing embedded metals found that metal
particles were generated during heating to temperatures comparable with those of a 3D printer
nozzle. This test was a simulated experiment conducted inside a small heated chamber in the
laboratory (Section 2.3.4). Comparable samples were not collected during 3D printing with these
materials as this was beyond the scope of the test plan. This area may be of interest for future work.
The EDX spectra will always present a peak for the metal of which the TEM grid is composed. For the
analyses in this research, the grids were made of copper, which is why, for example, the EDX of the
iron particle also contains a copper peak. The copper peak observed in the EDX spectra of the
copper-zinc particles was much stronger than would be expected for a background peak, confirming
that copper was present in the sample.
4.2 PYROLYSIS TESTING
An advantage of applying the pyrolysis test was that it allowed the VOC emissions from a wide range
of filaments to be analysed in a short space of time compared to completing a 3D print with each
material. It was a reproducible method, which replicated temperatures comparable to those of the
3D printer nozzle.
39
The pyrolysis results indicate that for some filament material, it is not only temperature but heating
time which is critical; the polyurethane-based Ninjaflex® in particular generated significantly more
material using method 1 than with method 2 (as described in Section 2.4.4), which had total heating
times of 2 minutes and 30 seconds respectively. However, other materials, such as ABS and HIPS
appeared to give fairly similar results from the two methods. The chemical components evolved
were largely similar using both methods. It was also noted that the different nylon products, whilst
fairly similar in composition showed significantly different weight losses.
The constituents produced from the different filament materials were mostly as expected e.g. PLA
produced lactide and ABS produced styrene. However, some of the filament did produce unexpected
emissions. When heated, the Ninjaflex® filament released Methylene Diphenyl di-Isocyanate (MDI).
Over 88% of the total emissions were MDI when using method 2 of the pyrolysis testing. Inhalation
of isocyanates can irritate the eyes, nose and throat and cause occupational asthma in some
individuals.
4.3 EXPOSURE CONTROL
Emissions from FFF 3D printers are likely to be released into the general environment because many
of desktop printers have no form of control or particle capture. Many manufacturers have started to
produce structures that enclose the printing process. However, manufacturers generally provide
these enclosures to improve the quality of the print by controlling the atmosphere rather than to
reduce emissions. The level of filtration of the air leaving the enclosures, if any, is difficult to
establish as information provided by manufacturers is minimal. Azimi et al (2016) tested some
models of desktop 3D printer designed with an integral enclosure. The enclosures were not airtight
or filtered and they only moderately reduced the UFP median emission rates by approximately
∼35%; this was determined with limited data so is more of an indicative result.
However, there is a risk that if a printer is enclosed without a suitable filtration system, the operator
and bystanders could be exposed to high concentrations of particulates and VOCs when opening the
enclosure.
The exposure control method evaluated for this research was a Perspex enclosing hood, which could
be placed over the top of the printer. Any particulate emissions were filtered from the air inside the
hood in one of two ways:
‘Exhausting mode’ - Air was passed through a filter as it was exhausted from the hood and
surrounding ‘clean’ air was drawn in at the base;
‘Recirculating mode’ - Air was continually passed through a filter as it recirculated inside the
hood and no new air was introduced.
To investigate the effects of the enclosing hood, the KORA MIDI printed ABS filament inside the test
chamber: with no exposure control in place, in exhausting mode, and in recirculating mode (Table 7).
Particulate emission rates were reduced by 97% and 99% for the exhausting and recirculating modes
respectively with the enclosing hood in place compared to measurements made with no exposure
control.
The time taken for the hood to clear of particles once the emissions were no longer being produced,
i.e. the ‘clearance time’, is seen in Figures 18 and 19 to be approximately 20 minutes. A qualitative
assessment using smoke corroborated this value. It is important that the user is aware of this
40
clearance time so that they know how long to wait before accessing the enclosure. This clearance
time could be reduced by increasing the airflow rate and/or reducing the volume of the enclosure.
The particle concentration measured inside the hood, when set to recirculating mode, was also seen
to reach a lower value approaching zero compared with the laboratory air background measured
outside the hood (Figure 19). This was expected as no new air from the laboratory was being
introduced to the hood. The clearance time may vary depending on the volume flow rate, the
volume of the enclosure and the efficiency of the filtration system if recirculating the air inside the
enclosure.
Instructions should be supplied by the manufacturer of the safety cabinet or hood to include
specified ‘clearance times’ after the print has completed before opening the enclosure. This advice
should be closely followed by the printer operator to avoid risks for inhalation and ingestion of
particulates and VOC.
The instruction manuals provided by the manufacturers of some 3D printers do include health and
safety information in relation to the melting plastic material. This often advises locating the printer
in a ‘well-ventilated area’ due to the ‘plastic odours’ emitted. Independent Local Exhaust Ventilation
(LEV) systems are commercially available, which claim to be designed for the specific application of
controlling emissions from 3D printers e.g. Kora 3D SC-01 Safety Cabinet (Secure Micro Solutions)1
and 3D PrintPRO range (BOFA International Ltd.)2.
In considering the requirement for an effective enclosure to remove emissions from FFF desktop 3D
printers is it important that suitable filters are selected to remove very small particles and VOC
emissions. It is also essential that these filters are regularly replaced and this action is documented.
4.4 OTHER CONSIDERATIONS
4.4.1 Finishing techniques
The nature of 3D FFF printing can result in visible layers on the surfaces of the object produced,
which could produce an undesirable appearance. Therefore, numerous techniques can be employed
to ‘finish’ the object and smooth the surfaces. Anecdotally, this has included manual techniques,
such as sanding and polishing but also the use of solvents. Investigation of these finishing techniques
was outside of the scope of this project. However, it is important to advise users that risks to health
resulting from these processes should also be considered when risk assessing the use of 3D printing
equipment.
4.4.2 Extruding metal
A quick internet search revealed that 3D FFF printers using metal as the build material are quickly
advancing but are not as widely available as their plastic equivalent. One such example is the
Studio System™ (Desktop Metal Inc.), advertised as ‘office-friendly’ it functions by ‘extruding metal
rods’. There is established evidence from traditional industries that occupational exposure to metals,
as particles, fumes or through skin contact, can cause various respiratory diseases. As metal 3D FFF
1 Kora 3D [online] Available at http://www.kora3d.com/ (accessed 22 February 2019)
2 BOFA [online] Available at http://www.bofa.co.uk/3D-printing-fume-extraction.asp (accessed 22 February 2019)

41
printers develop it is important to consider whether these machines could present potential harmful
exposures.
4.5 RESEARCH LIMITATIONS
The emission measurements made throughout this research were carried out in controlled,
laboratory tests. Measurements and observations of 3D printing practices within a ‘real’
environment, such as an office or classroom, would enable a validation of the results presented in
this report and a better understanding how the findings could inform good exposure control
practices. The findings could be further contextualised to estimate exposure to 3D printer emissions
over a period of time where individuals are regularly working with these machines. The risks from
these exposures could then be assessed in relation to any potential adverse health effects.
4.6 WORKING GROUP
The research findings described in this report and the control measures identified were shared as
soon as they were available with the working group set up by HSE. Working group members
identified evidence based safe working practices for schools using FFF desktop 3D printers. These
findings contributed to the development by CLEAPSS of a good practice guide.

42
5 CONCLUSIONS
A working group was initiated by HSE including HSE scientific and regulatory colleagues and
representatives from an advanced manufacturing catapult centre, from industry and the education
sector. The working group shared knowledge and experience and identified the need for evidence
based advice to schools on the safe use of desktop, 3D, FFF printers. HSE undertook laboratory
experiments to characterise emissions from the printers and evaluate a potential exposure control.
Particle emissions:
Emitted particles were in the size range to potentially enter the airways and lungs, and that
emission rates when printing with ABS were higher than for PLA.
Particle emission rates varied for different filament material on the same printer.
Particle emission rates and size distributions for the same filament material varied for
different printers.
Particle emission rates increased and the average particle size decreased as the 3D printer
nozzle temperature increased.
TEM and EDX analysis identified metal particles emitted from heated filament containing
embedded metals. These tests were simulated laboratory tests and it may be useful to
investigate this further by collecting samples when printing with this type of filament.
Volatile emissions:
The information provided by some suppliers of filament material was found to be unreliable
and uninformative with respect to the release of hazardous volatile constituents.
Pyrolysis testing was a repeatable method to test a wide range of filament materials for VOC
emissions.
Pyrolysis results indicated that both the temperature and heating time can affect the
products released from filament material.
When heated, some plastic filament materials released chemicals known to be hazardous to
health and particulate and VOC emissions vary significantly between filament types.
Effectiveness of enclosing hood for controlling exposure
Placing an enclosing hood over the 3D printer reduced particle emissions released to the
room by 97% when exhausting air from the enclosing hood and by 99% in the recirculating air
mode.
Particulate and VOC emissions accumulated inside the enclosing hood during printing. The
clearance time of the enclosing hood was approximately 20 minutes, therefore removing the
hood before this time could result in personal exposure.

43
6 REFERENCES
Azimi P., Zhao D., Pouzet C., Crain N.E. & Stephens B. (2016) Emissions of ultrafine particles and
volatile organic compounds from commercially available desktop three-dimensional printers with
multiple filaments. Environmental Science & Technology, 50 (3), 1260–1268.
Bancroft B., Greenough G.K., Hodges J.P. & Whitelaw D.G. (1980) Measurement of the dust
protection and airflow of a helmet respirator. Annals of Occupational Hygiene, 23, 295-304.
Bourdrel T., Bind M.A., Bejot Y., Morel O. & Argacha J.F. (2017) Cardiovascular effects of air
pollution: Archives of Cardiovascular Disease, 110 (11), 634-642.
BS 3928 (1969) Method for sodium flame test for air filters (other than for air supply to I.C. engines
and compressors).
BS EN 1093 (2006) Safety of machinery — Evaluation of the emission of airborne hazardous
substances — Part 3: Test bench method for the measurement of the emission rate of a given
pollutant.
Carnegie Mellon University. [Online]. Available at http://www.cmu.edu/ehs/fact-sheets/3D-Printing-
Safety.pdf (Accessed 18 September 2017).
Department for Education. (2013) 3D printers in schools: uses in the curriculum. [Online]. Available
at
https://www.gov.uk/government/uploads/system/uploads/attachment_data/file/251439/3D_printe
rs_in_schools.pdf (Accessed 18 September 2017)
Desktop Metal. [Online]. Available at https://www.desktopmetal.com/products/studio/ (Accessed
14 November 2017)
Floyd E.L., Wang J., & Regens J.L. (2017) Fume emissions from a low-cost 3-D printer with various
filaments. Journal of Occupational and Environmental Hygiene, 14 (7), 523-533.
Gumperlein I., Fischer E., Dietrich-Gumperlein G., Karrasch S., Nowak D., Jorres R.A. & Schierl R.
(2018) Acute health effects of desktop 3D printing (fused deposition modelling) using acrylonitrile
butadiene styrene and polylactic acid materials: An experimental exposure study in human
volunteers. Indoor Air, 28 (4), 611-623.
He C., Morawska L. & Taplin L. (2007) Particle emission characteristics of office printers.
Environmental Science and Technology, 41, 6039-6045.
Health and Safety Executive. Understanding the hazards of nanomaterials. [Online]. Available at
http://www.hse.gov.uk/nanotechnology/understanding-hazards-nanomaterials.htm (Accessed 01
March 2018)
Health and Safety Executive. (2013) Controlling fume during plastics processing. PPIS13 (rev1).
[Online] http://www.hse.gov.uk/pubns/ppis13.htm (Accessed 18 September 2017)
House R., Rajaram N. & Tarlo S.M. (2017) Case report of asthma associated with 3D printing.
Occupational Medicine-Oxford, 67 (8), 652-654.
Kim Y., Yoon C., Ham S., Park J., Kim S., Kwon O. & Tsai PJ. (2015) Emissions of nanoparticles and
gaseous material from 3D printer operation. Environmental Science & Technology, 49, 12044−12053.
44
Mendes L., Kangas A., Kukko K., Molgaard B., Saamanen A., Kanerva T., Ituarte I.F., Huhtiniemi M.,
Stockmann-Juvala H., Partanen J., Hameri K., Eleftheriadis K. & Viitanen A.K. (2017) Characterization
of emissions from a desktop 3D printer. Journal of Industrial Ecology 21, S94-S106.
Ragan S. (2013) Plastics for 3D printing. Make, Winter 2013, 22.
Stefaniak A.B., LeBouf R.F., Yi J., Ham J., Nurkewicz T., Schwegler-Berry D.E., Chen B.T., Wells J.R.,
Duling M.G., Lawrence R.B., Martin S.B. Jr., Johnson A.R., & Virji M.A. (2017) Characterization of
chemical contaminants generated by a desktop fused deposition modelling 3-dimensional printer.
Journal of Occupational and Environmental Hygiene, 14 (7), 540-550.
Stephens B., Azimi P., El Orch Z., & Ramos T. (2013) Ultrafine particle emissions from desktop 3D
printers. Atmospheric Environment, 79, 334 – 339.
Steuben J., Van Bossuyt D.L., & Turner C. (2015) Design for fused filament fabrication additive
manufacturing. Paper presented at the ASME International Design Engineering Technical
Conferences & Computers and Information in Engineering Conference, IDETC/CIE2015, Boston, MA.
Todea A. M., Beckmann S., Kaminski H., Monz C., Dahmann D., Neumann V., Katrin Simonow B.,
Dziurowitz N., Meyer-Plath A., Fierz M., Dozol H., Clavaguera S., Lidén G., Tuinman I., Pelzer J., Bard
D., Thali P., Bau S., van der Vleuten A., Vroomen H. & Asbach C. (2017) Inter-comparison of personal
monitors for nanoparticles exposure at workplaces and in the environment. Science of the Total
Environment, 605–606, 929-945.
Yi J., LeBouf R.F., Duling M.G., Nurkiewicz T., Chen B.T., Schwegler-Berry D., Virji M.A. & Stefaniak
A.B. (2016) Emission of particulate matter from a desktop three-dimensional (3D) printer. Journal of
Toxicology and Environmental Health, Part A, 79 (11), 453-465.
Zontek T.L., Ogle B.R., Jankovic J.T. & Hollenbeck S.M. (2017) An exposure assessment of desktop 3D
printing. Journal of Chemical Health & Safety, 24 (2), 15-25.
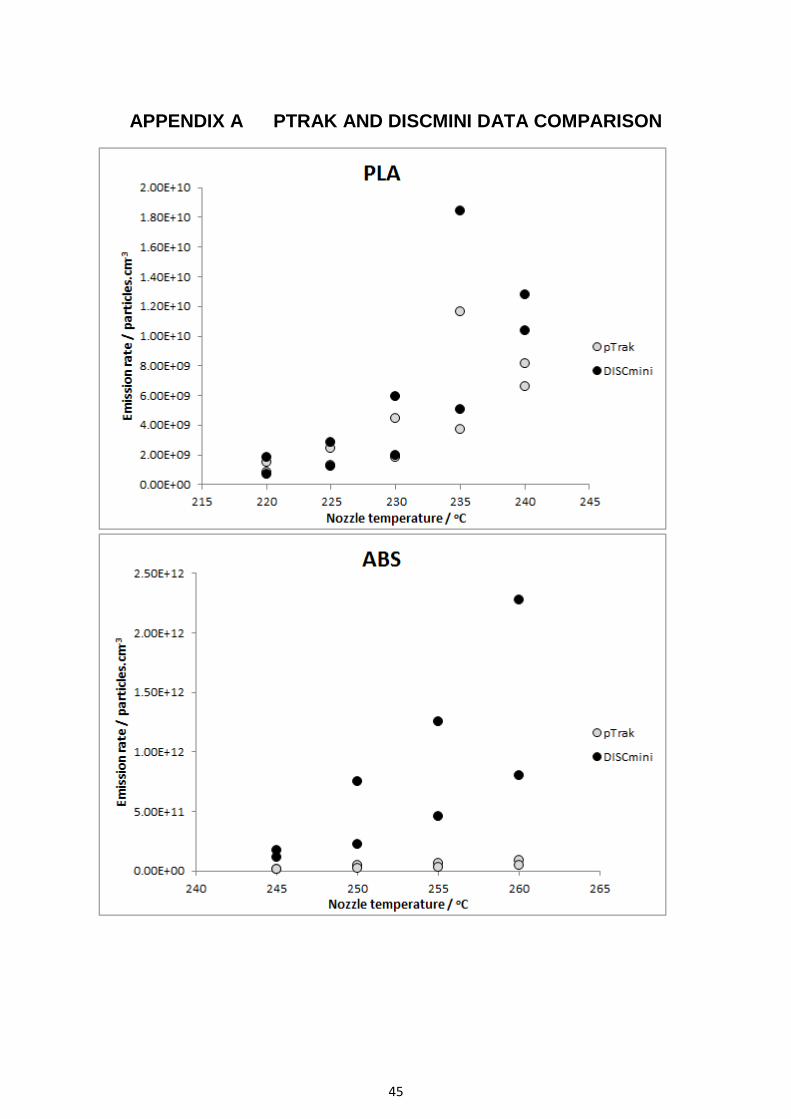
45
APPENDIX A PTRAK AND DISCMINI DATA COMPARISON
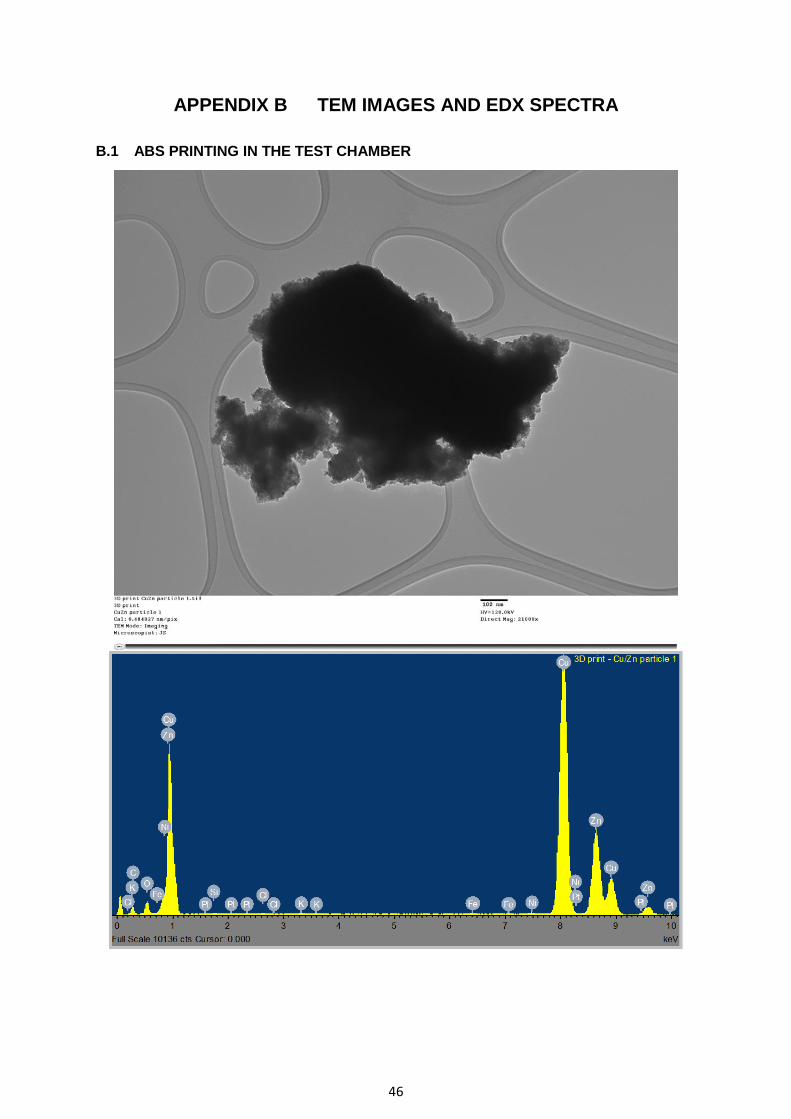
46
APPENDIX B TEM IMAGES AND EDX SPECTRA
B.1 ABS PRINTING IN THE TEST CHAMBER
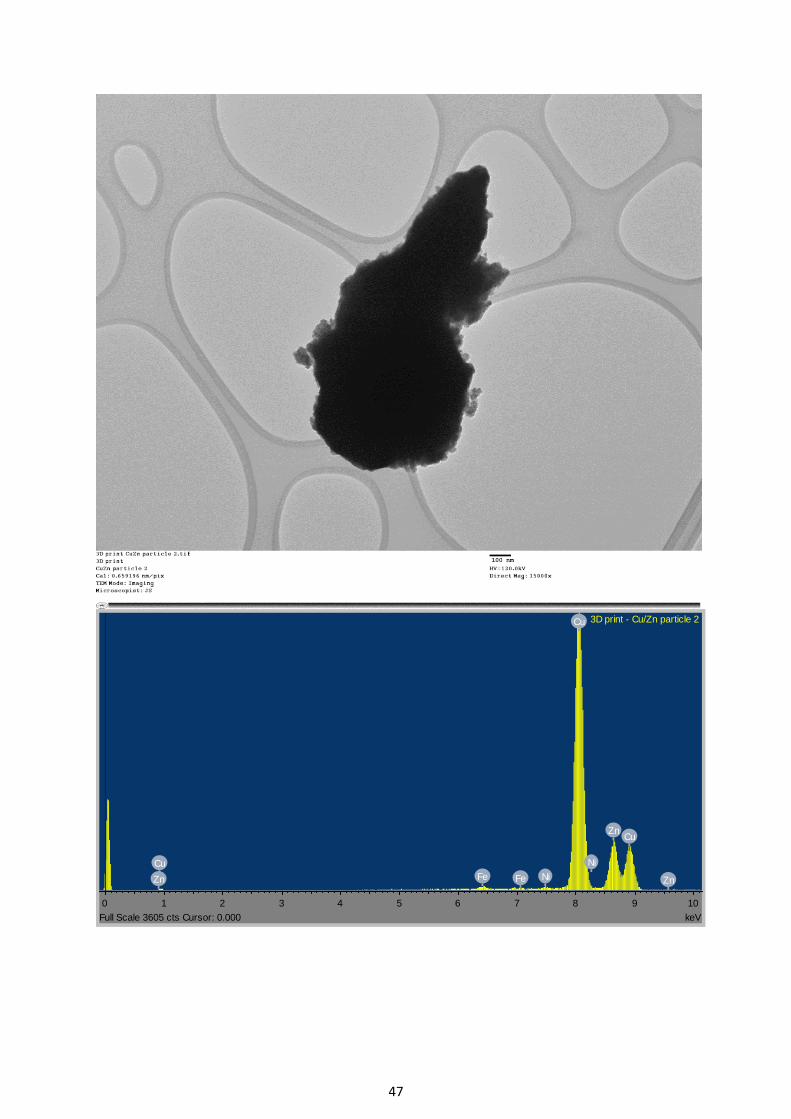
47
ZnZn
Cu
FeFe Ni
Ni
CuZn
Cu
0 1 2 3 4 5 6 7 8 9 10
keVFull Scale 3605 cts Cursor: 0.000
3D print - Cu/Zn particle 2
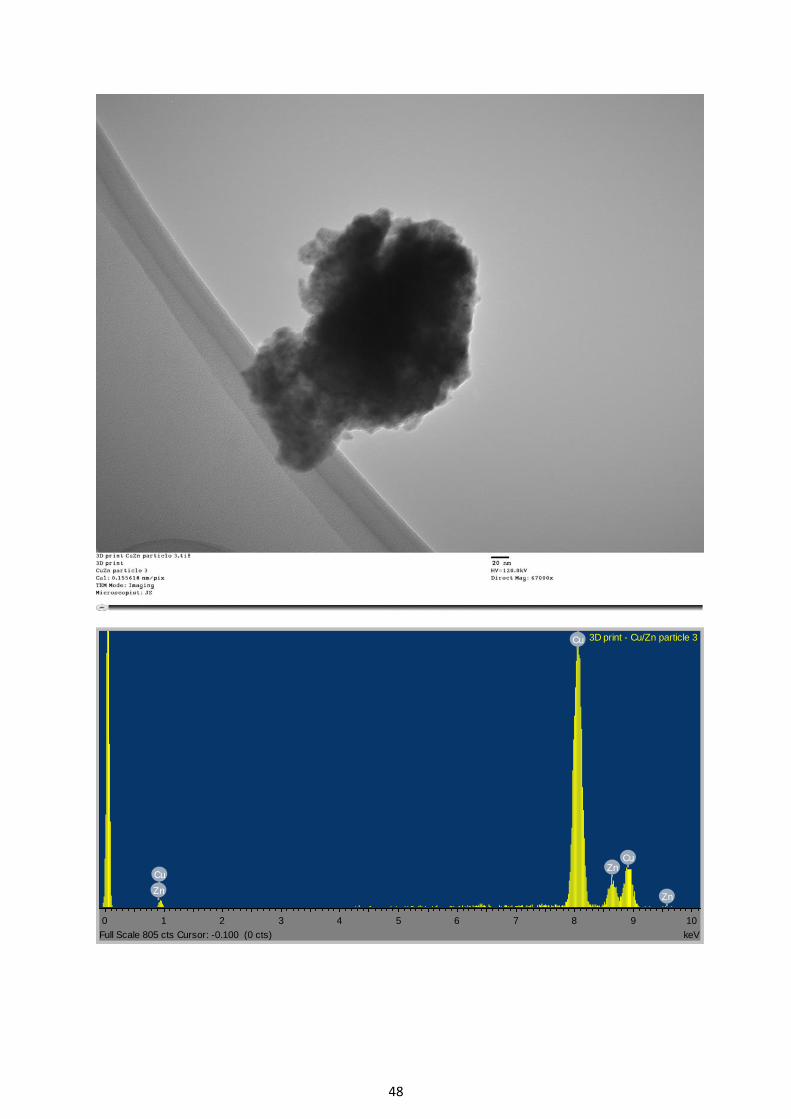
48
ZnZn
CuZn
Cu
Cu
0 1 2 3 4 5 6 7 8 9 10
keVFull Scale 805 cts Cursor: -0.100 (0 cts)
3D print - Cu/Zn particle 3
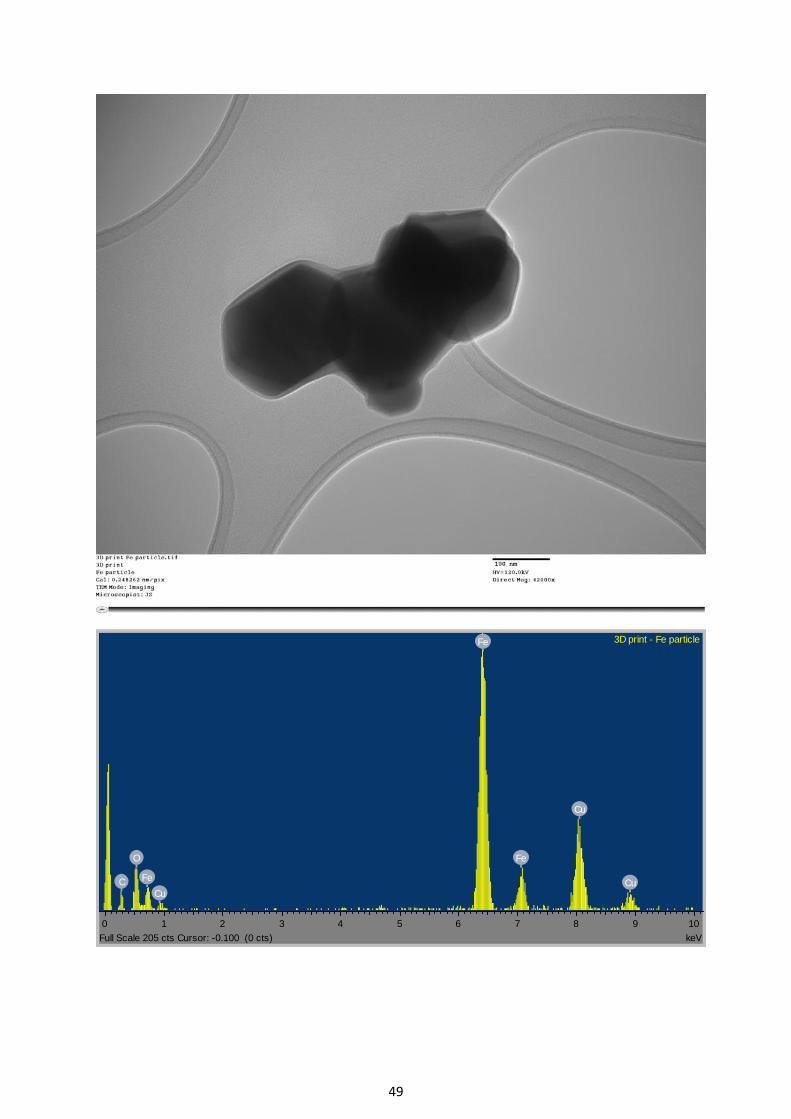
49
Cu
C CuFe
FeO
Cu
Fe
0 1 2 3 4 5 6 7 8 9 10
keVFull Scale 205 cts Cursor: -0.100 (0 cts)
3D print - Fe particle

50
B.2 COPPER FLEX FILAMENT

51

52
B.3 BRASSFILL FILAMENT
Sn Sn FeSnSn Sn
Fe
Sn
Si
Fe
Zn
Cu
Zn
C
O
Cu
Zn
Cu
0 1 2 3 4 5 6 7 8 9 10
keVFull Scale 10149 cts Cursor: 0.000
Brassfill brass particle (1)

53
Sn SnSn
Sn Fe NiNiSn
Fe
SnFeZn
C Cu
Ni
Zn
O
Cu
Zn
Cu
0 1 2 3 4 5 6 7 8 9 10
keVFull Scale 10166 cts Cursor: 0.000
Brassfill brass particle (3)

54
B.4 BRONZEFILL FILAMENT

55

56
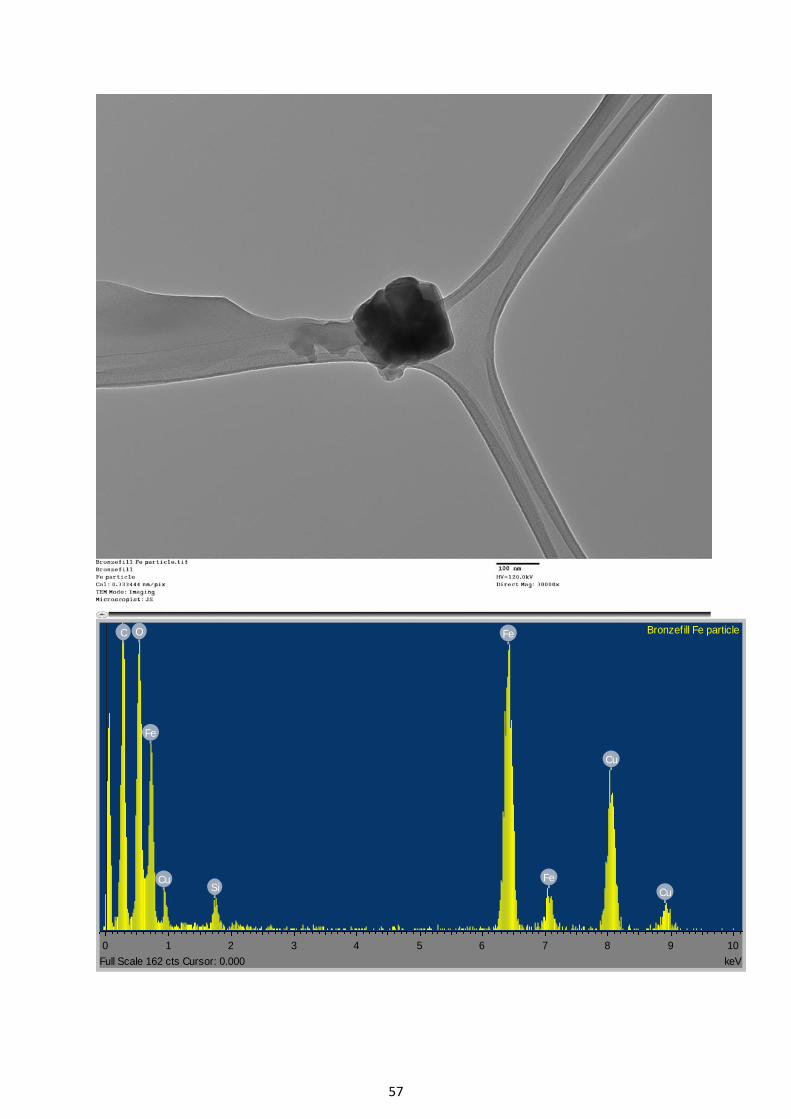
57
Si Cu
FeCu
Cu
Fe
FeC O
0 1 2 3 4 5 6 7 8 9 10
keVFull Scale 162 cts Cursor: 0.000
Bronzefill Fe particle

58
APPENDIX C PYROLYSIS RESULTS
NATURAL POLYLACTIC ACID (NAT-PLA-1.75 mm)
Tube (mg) 104.252
Mass of Sample (µg) 293
Tube + Sample (mg) 104.545
Sample Loss at 250°C (µg/%) -6 -2.05%
Tube After 250°C Test (mg) 104.551
Sample Loss at 300°C (µg/%) 22 7.51%
Tube After 300°C Test (mg) 104.529
Total Sample Loss (µg/%) 16 5.46%
COMPOUNDS RT
(min)
TEST AT 250°C (150°C) PLA-008s.D
TEST AT 300°C (200°C) PLA-009s.D
TOTAL COMBINED
TOTAL CALCULATED MASS LOSS
(mg/g) TIC PEAK AREA
PROPORTION TIC PEAK
AREA PROPORTION
TIC PEAK AREA
PROPORTION
Lactide (Isomer 1) 10.24 18700 2.6% 202500 15.5% 221200 10.9% 5.9
Lactide (Isomer 2) 10.81 245500 33.8% 887900 68.0% 1133400 55.8% 30.5
Aliphatic Hydrocarbon Oil 18 - 25 461200 63.6% 35300 2.7% 496500 24.4% 13.4
Other (mainly lactide oligomers)
- 0 0.00% 179700 13.8% 179700 8.8% 4.8
TOTAL 725400 100% 1305400 100% 2030800 100% 54.6

59
CLEAR WATER NINJAFLEX (NIN-FLX-CWA-1.75 mm)
Tube (mg) 104.260
Mass of Sample (µg) 315
Tube + Sample (mg) 104.575
Sample Loss at 250°C (µg/%) 1 0.3%
Tube After 250°C Test
(mg) 104.574
Sample Loss at 300°C (µg/%) 65 20.6%
Tube After 300°C Test
(mg) 104.509
Total Sample Loss (µg/%) 66 21.0%
COMPOUNDS RT
(min)
TEST AT 250°C (150°C) NIN-003s.D
TEST AT 300°C (200°C) NIN-004s.D
TOTAL COMBINED
TOTAL CALCULATED MASS LOSS
(mg/g) TIC PEAK AREA PROPORTION
TIC PEAK AREA
PROPORTION TIC PEAK
AREA PROPORTION
Tetrahydrofuran 2.52 21000 3.2% 86000 0.9% 107000 1.0% 2
Butanediol 7.20 25000 3.8% 775000 7.9% 800000 7.7% 16
Diisopropenylbenzene
12.42 5000 0.8% 45000 0.5% 50000 0.5% 1
Other Aromatic Isocyanates
14.9/17.0 28000 4.2% 79000 0.8% 107000 1.0% 2
C12 Cyclic Diester 16.11 41000 6.2% 18000 0.2% 59000 0.6% 1
Aliphatics (cyclic/unsaturated)
18.5/24.2/31.0 155000 23.4% 133000 1.4% 288000 2.8% 6
MDI (mainly 4,4-) 21.3/21.9 386000 58.4% 8648000 88.4% 9034000 86.5% 181
TOTAL 661000 100% 9784000 100% 10445000 100% 210

60
WHITE HIPS (SMS 1.75 mm)
Tube (mg) 104.250
Mass of Sample (µg) 423
Tube + Sample (mg) 104.673
Sample Loss at 250°C (µg/%) 9 2.13%
Tube After 250°C Test (mg)
104.664
Sample Loss at 300°C (µg/%) -4 -0.95%
Tube After 300°C Test
(mg) 104.668
Total Sample Loss (µg/%) 5 1.18%
COMPOUNDS RT
(min)
TEST AT 250°C (150°C) HIP-002s.D
TEST AT 300°C (200°C) HIP-003s.D
TOTAL COMBINED
TOTAL CALCULATED MASS LOSS
(mg/g) TIC PEAK AREA
PROPORTION TIC PEAK
AREA PROPORTION
TIC PEAK AREA
PROPORTION
Ethylbenzene 5.75 8200 0.8% 0 0.0% 8200 0.5% <0.1
Styrene 6.26 42300 4.3% 22700 3.3% 65000 3.9% 0.5
Cyanonaphthalenes 15.58/15.90 4500 0.5% 0 0.0% 4500 0.3% <0.1
Diphenylpropane 17.33 2900 0.3% 2600 0.4% 5500 0.3% <0.1
Styrene Dimers 17.8 - 18.8 124100 12.6% 3300 0.5% 127400 7.6% 0.9
Phenanthrene 18.96 19000 1.9% 0 0.0% 19000 1.1% 0.1
Phenylnaphthalenes 19.70/20.87 12700 1.3% 0 0.0% 12700 0.8% <0.1
Styrene Trimer 24.98 139100 14.2% 110400 15.9% 249500 14.9% 1.8
Styrene Oligomers 25.8 - 26.3 524600 53.4% 493500 71.2% 1018100 60.8% 7.2
Other (mainly aromatic)
- 104900 10.7% 60200 8.7% 165100 9.9% 1.2
TOTAL 982300 100% 692700 100% 1675000 100% 11.8

61
NATURAL ABS (ABS-NAT-1.75 mm)
Tube (mg) 104.251
Mass of Sample (µg) 341
Tube + Sample (mg) 104.592
Sample Loss at 250°C (µg/%) 13 3.8%
Tube After 250°C Test (mg)
104.579
Sample Loss at 300°C (µg/%) 7 2.1%
Tube After 300°C Test
(mg) 104.572
Total Sample Loss (µg/%) 20 5.9%
COMPOUNDS RT
(min)
TEST AT 250°C (150°C) ABS-006s.D
TEST AT 300°C (200°C) ABS-007s.D
TOTAL COMBINED
TOTAL CALCULATED MASS LOSS
(mg/g) TIC PEAK AREA PROPORTION
TIC PEAK AREA
PROPORTION TIC PEAK
AREA PROPORTION
Butadiene Dimer 5.27 3300 0.2% 3500 0.5% 6800 0.3% <1
Ethylbenzene + Xylene 5.75 - 5.85 11300 0.6% 0 0.0% 11300 0.4% <1
Styrene 6.26 168700 8.4% 8000 1.2% 176700 6.6% 4
Styrene Oligomers 14.5 - 18.5 48000 2.4% 0 0.0% 48000 1.8% 1
Styrene-Nitrile Oligomers
20.6 - 21.2 995300 49.7% 322900 47.8% 1318200 49.2% 29
Styrene-Nitrile Oligomers
21.5 - 22.0 236000 11.8% 112100 16.6% 348100 13.0% 8
Aromatic Compounds 23.2 - 23.7 371500 18.5% 120600 17.8% 492100 18.4% 11
Aromatic Compounds 24.0 - 24.6 52100 2.6% 25400 3.8% 77500 2.9% 2
Other (mainly aromatic)
- 117600 5.9% 83700 12.4% 201300 7.5% 4
TOTAL 2003800 100% 676200 100% 2680000 100% 59

62
FLUORESCENT YELLOW ABS (ABS-FLYEL-1.75 mm)
Tube (mg) 103.833
Mass of Sample (µg) 414
Tube + Sample (mg) 104.247
Sample Loss at 250°C (µg/%) 31 7.5%
Tube After 250°C Test (mg) 104.216
Sample Loss at 300°C (µg/%) 11 2.7%
Tube After 300°C Test (mg) 104.205
Total Sample Loss (µg/%) 42 10.1%
COMPOUNDS RT
(min)
TEST AT 250°C (150°C) ABS-009s.D
TEST AT 300°C (200°C) ABS-010s.D
TOTAL COMBINED
TOTAL CALCULATED MASS LOSS
(mg/g) TIC PEAK
AREA PROPORTION
TIC PEAK AREA
PROPORTION TIC PEAK
AREA PROPORTION
Butadiene Dimer 5.27 1300 0.2% 0 0.0% 1300 0.1% <1
Ethylbenzene + Xylene 5.75 - 5.85 7000 1.1% 0 0.0% 7000 0.7% <1
Styrene 6.26 122000 19.5% 2000 0.5% 124000 12.0% 12
Styrene Oligomers 14.5 - 18.5 21700 3.5% 0 0.0% 21700 2.1% 2
Styrene-Nitrile Oligomers
20.6 - 21.2 276600 44.2% 220300 53.6% 496900 48.0% 49
Styrene-Nitrile Oligomers
21.5 - 22.0 48500 7.8% 65700 16.0% 114200 11.0% 11
Aromatic Compounds 23.2 - 23.7 98600 15.8% 82100 20.0% 180700 17.4% 18
Aromatic Compounds 24.0 - 24.6 10500 1.7% 14800 3.6% 25300 2.4% 2
Other (mainly aromatic)
- 38900 6.2% 25800 6.3% 64700 6.2% 6
TOTAL 625100 100% 410700 100% 1035800 100% 101

63
WHITE NYLON (NYL-WHI-1.75 mm)
Tube (mg) 103.635
Mass of Sample (µg) 241
Tube + Sample (mg) 103.876
Sample Loss at 250°C (µg/%) 16 6.6%
Tube After 250°C Test (mg) 103.860
Sample Loss at 300°C (µg/%) 21 8.7%
Tube After 300°C Test (mg) 103.839
Total Sample Loss (µg/%) 37 15.4%
COMPOUNDS RT
(min)
TEST AT 250°C (150°C) NYL-009s.D
TEST AT 300°C (200°C) NYL-010s.D
TOTAL COMBINED
TOTAL CALCULATED MASS LOSS
(mg/g) TIC PEAK AREA PROPORTION TIC PEAK AREA PROPORTION TIC PEAK AREA PROPORTION
Caprolactam 2.52 34500 94.3% 47300 81.0% 81800 86.1% 132
Caprolactam Dimer
7.20 2100 5.7% 11100 19.0% 13200 13.9% 21
TOTAL 36600 100% 58400 100% 95000 100% 154
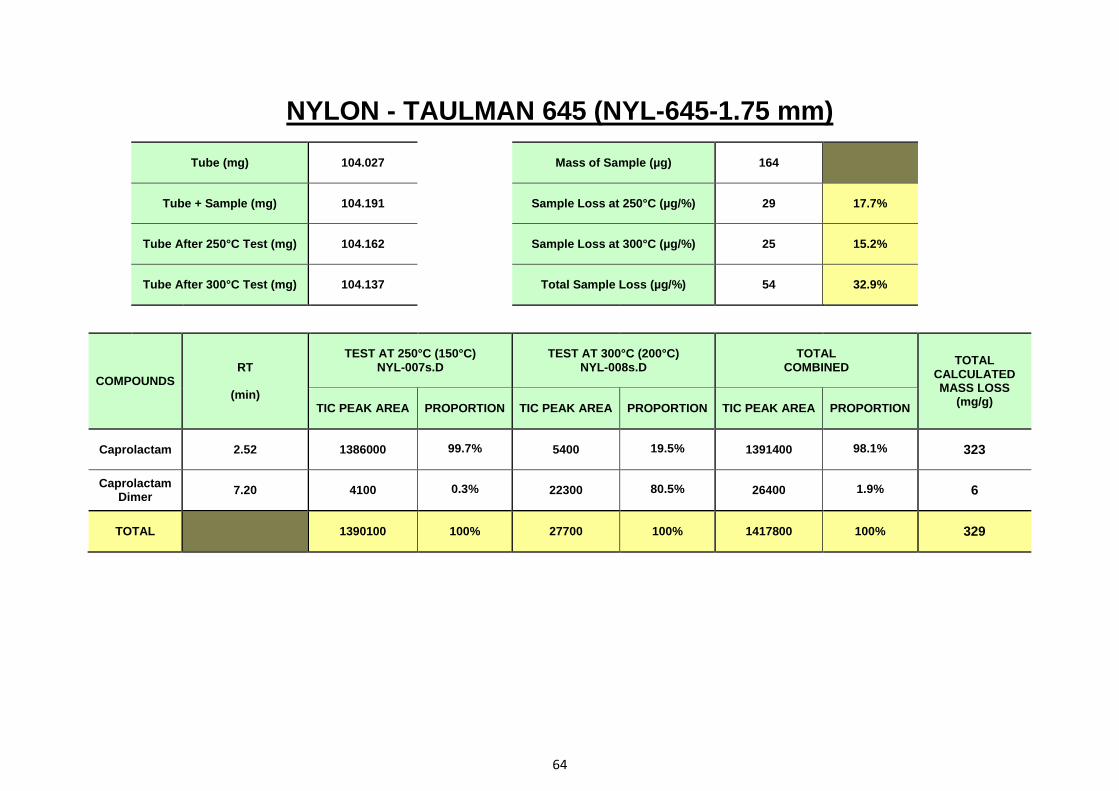
64
NYLON - TAULMAN 645 (NYL-645-1.75 mm)
Tube (mg) 104.027
Mass of Sample (µg) 164
Tube + Sample (mg) 104.191
Sample Loss at 250°C (µg/%) 29 17.7%
Tube After 250°C Test (mg) 104.162
Sample Loss at 300°C (µg/%) 25 15.2%
Tube After 300°C Test (mg) 104.137
Total Sample Loss (µg/%) 54 32.9%
COMPOUNDS RT
(min)
TEST AT 250°C (150°C) NYL-007s.D
TEST AT 300°C (200°C) NYL-008s.D
TOTAL COMBINED
TOTAL CALCULATED MASS LOSS
(mg/g) TIC PEAK AREA PROPORTION TIC PEAK AREA PROPORTION TIC PEAK AREA PROPORTION
Caprolactam 2.52 1386000 99.7% 5400 19.5% 1391400 98.1% 323
Caprolactam Dimer
7.20 4100 0.3% 22300 80.5% 26400 1.9% 6
TOTAL 1390100 100% 27700 100% 1417800 100% 329

65
NYLON - TAULMAN 618 (NYL-TAU-1.75 mm)
Tube (mg) 103.873
Mass of Sample (µg) 199
Tube + Sample (mg) 104.072
Sample Loss at 250°C (µg/%) 79 39.7%
Tube After 250°C Test (mg) 103.993
Sample Loss at 300°C (µg/%) 26 13.1%
Tube After 300°C Test (mg) 103.967
Total Sample Loss (µg/%) 105 52.8%
COMPOUNDS RT
(min)
TEST AT 250°C (150°C) NYL-011s.D
TEST AT 300°C (200°C) NYL-128s.D
TOTAL COMBINED
TOTAL CALCULATED MASS LOSS
(mg/g) TIC PEAK AREA PROPORTION TIC PEAK AREA PROPORTION TIC PEAK AREA PROPORTION
Caprolactam 2.52 2364600 99.7% 25500 46.7% 2390100 98.5% 520
Caprolactam Dimer
7.20 7300 0.3% 29100 53.3% 36400 1.5% 8
TOTAL 2371900 100% 54600 100% 2426500 100% 528
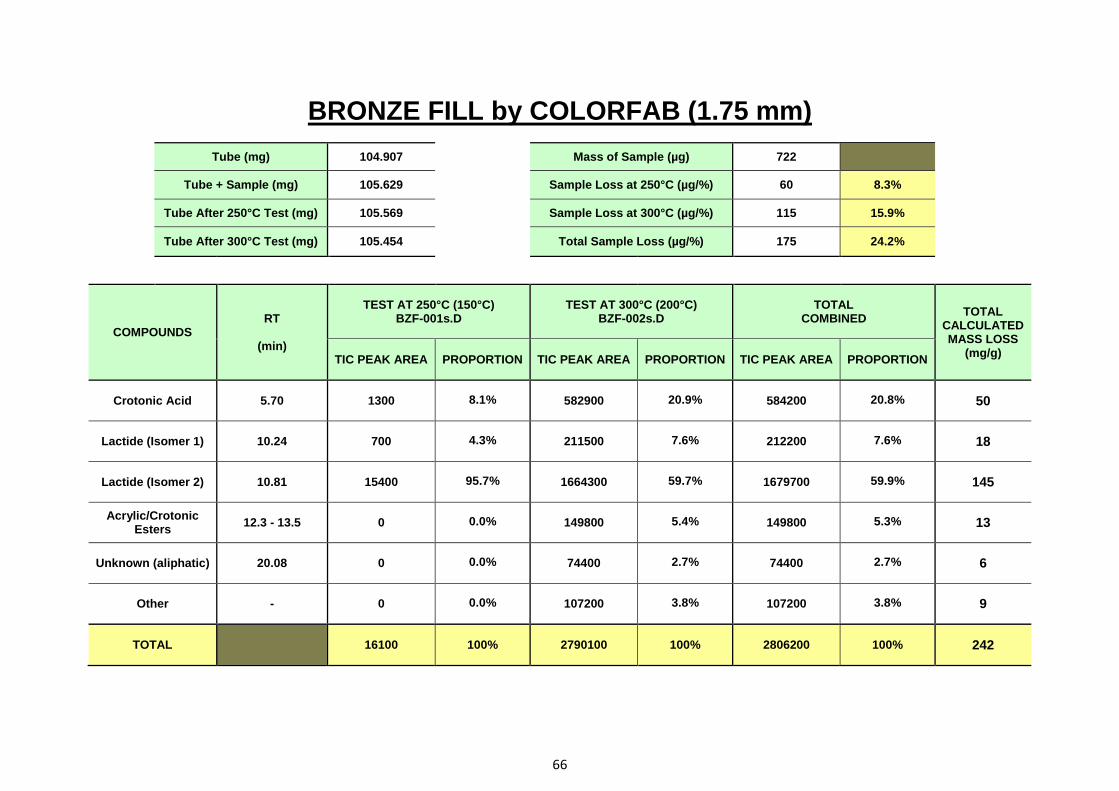
66
BRONZE FILL by COLORFAB (1.75 mm)
Tube (mg) 104.907
Mass of Sample (µg) 722
Tube + Sample (mg) 105.629
Sample Loss at 250°C (µg/%) 60 8.3%
Tube After 250°C Test (mg) 105.569
Sample Loss at 300°C (µg/%) 115 15.9%
Tube After 300°C Test (mg) 105.454
Total Sample Loss (µg/%) 175 24.2%
COMPOUNDS RT
(min)
TEST AT 250°C (150°C) BZF-001s.D
TEST AT 300°C (200°C) BZF-002s.D
TOTAL COMBINED
TOTAL CALCULATED MASS LOSS
(mg/g) TIC PEAK AREA PROPORTION TIC PEAK AREA PROPORTION TIC PEAK AREA PROPORTION
Crotonic Acid 5.70 1300 8.1% 582900 20.9% 584200 20.8% 50
Lactide (Isomer 1) 10.24 700 4.3% 211500 7.6% 212200 7.6% 18
Lactide (Isomer 2) 10.81 15400 95.7% 1664300 59.7% 1679700 59.9% 145
Acrylic/Crotonic Esters
12.3 - 13.5 0 0.0% 149800 5.4% 149800 5.3% 13
Unknown (aliphatic) 20.08 0 0.0% 74400 2.7% 74400 2.7% 6
Other - 0 0.0% 107200 3.8% 107200 3.8% 9
TOTAL 16100 100% 2790100 100% 2806200 100% 242
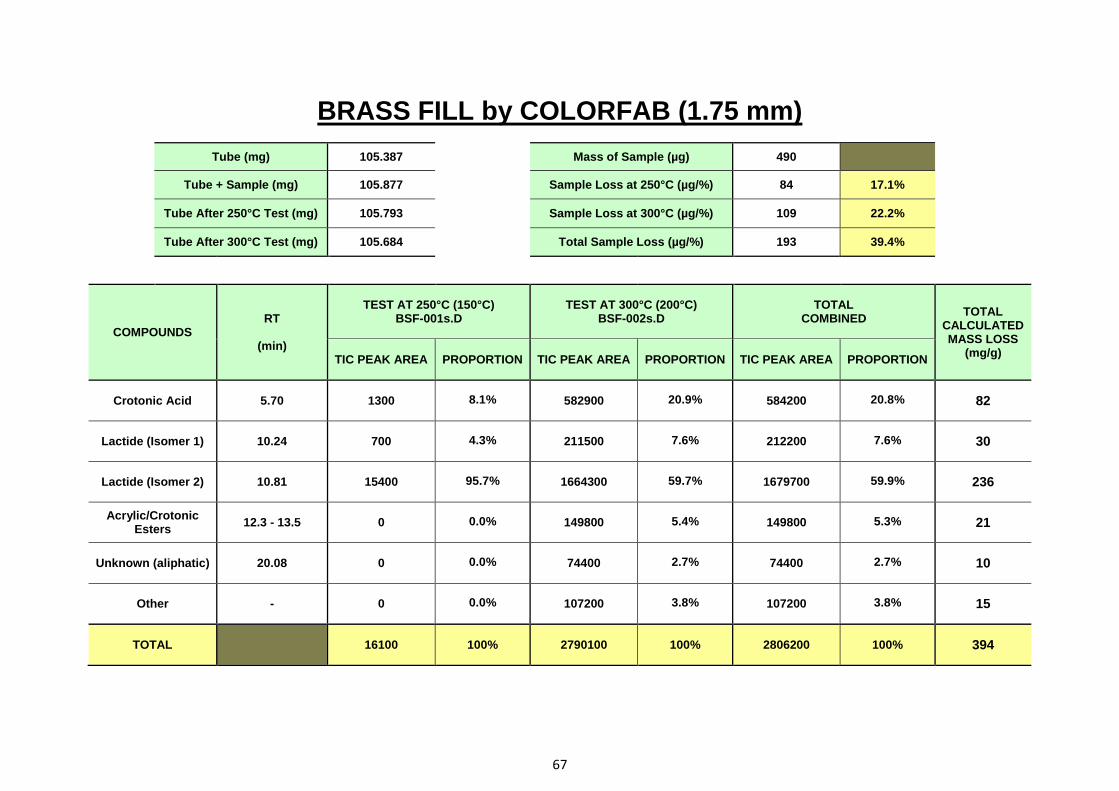
67
BRASS FILL by COLORFAB (1.75 mm)
Tube (mg) 105.387
Mass of Sample (µg) 490
Tube + Sample (mg) 105.877
Sample Loss at 250°C (µg/%) 84 17.1%
Tube After 250°C Test (mg) 105.793
Sample Loss at 300°C (µg/%) 109 22.2%
Tube After 300°C Test (mg) 105.684
Total Sample Loss (µg/%) 193 39.4%
COMPOUNDS RT
(min)
TEST AT 250°C (150°C) BSF-001s.D
TEST AT 300°C (200°C) BSF-002s.D
TOTAL COMBINED
TOTAL CALCULATED MASS LOSS
(mg/g) TIC PEAK AREA PROPORTION TIC PEAK AREA PROPORTION TIC PEAK AREA PROPORTION
Crotonic Acid 5.70 1300 8.1% 582900 20.9% 584200 20.8% 82
Lactide (Isomer 1) 10.24 700 4.3% 211500 7.6% 212200 7.6% 30
Lactide (Isomer 2) 10.81 15400 95.7% 1664300 59.7% 1679700 59.9% 236
Acrylic/Crotonic Esters
12.3 - 13.5 0 0.0% 149800 5.4% 149800 5.3% 21
Unknown (aliphatic) 20.08 0 0.0% 74400 2.7% 74400 2.7% 10
Other - 0 0.0% 107200 3.8% 107200 3.8% 15
TOTAL 16100 100% 2790100 100% 2806200 100% 394

68
COPPER FLEX by REPRAPPER TECH (1.75 mm)
Tube (mg) 104.441
Mass of Sample (µg) 366
Tube + Sample (mg) 104.807
Sample Loss at 250°C (µg/%) -986 -269.4%
Tube After 250°C Test (mg) 105.793
Sample Loss at 300°C (µg/%) 339 92.6%
Tube After 300°C Test (mg) 105.454
Total Sample Loss (µg/%) -647 -176.8%
COMPOUNDS RT
(min)
TEST AT 250°C (150°C) BSF-001s.D
TEST AT 300°C (200°C) BSF-002s.D
TOTAL COMBINED
TOTAL CALCULATED MASS LOSS
(mg/g) TIC PEAK AREA PROPORTION TIC PEAK AREA PROPORTION TIC PEAK AREA PROPORTION
Crotonic Acid 5.70 1300 8.1% 582900 20.9% 584200 20.8% <0.1
Lactide (Isomer 1) 10.24 700 4.3% 211500 7.6% 212200 7.6% <0.1
Lactide (Isomer 2) 10.81 15400 95.7% 1664300 59.7% 1679700 59.9% <0.1
Acrylic/Crotonic Esters
12.3 - 13.5 0 0.0% 149800 5.4% 149800 5.3% <0.1
Unknown (aliphatic) 20.08 0 0.0% 74400 2.7% 74400 2.7% <0.1
Other - 0 0.0% 107200 3.8% 107200 3.8% <0.1
TOTAL 16100 100% 2790100 100% 2806200 100% <1

Published by the Health & Safety Executive 02/19
RR1146
www.hse.gov.uk
Affordable desktop 3D printers are being widely used in businesses, schools and colleges. Some of these printers use filaments to deposit polymer through a heated nozzle to build three dimensional objects. This type of desktop printer is generally unenclosed and some published studies have raised concerns that they may release potentially harmful fumes and particles. The scientific evidence base on exposures and potential health endpoints is being developed internationally.
This report describes initial research in a laboratory setting to a) measure emissions of particulates and volatile organic compounds from desktop 3D printers and b) investigate the effectiveness of control measures to reduce these printer emissions. Two common filament materials were investigated: polylactic acid (PLA) which is generally used in schools, and acrylonitrile butadiene styrene (ABS).
The research found that the heated filaments emitted large numbers of very small particles and volatile organic chemicals which could be breathed in. However, more research is required to establish if under real use conditions these printers release sufficient concentration of emissions to cause harm. The research identified that exposures are significantly reduced by: (1) setting a lower printer nozzle temperature; (2) using a filament with a lower emission rate; (3) placing the printer in a clear enclosing hood fitted with an extraction fan and particulate filter and (4) maintaining a hood ‘clearance time’ of about 20 minutes.
These findings have informed the development of a new good practice guide for schools published by CLEAPSS in 2019. This guide provides advice about precautionary measures for safe use of desktop 3D printers and measures to minimise health risks for students and school employees.
This report and the work it describes were funded by the Health and Saf ety Executive (HSE). Its contents, including any opinions and/or conclusions expressed, are those of the authors alone and do not nec essarily reflect HSE policy.
M
easuring and controlling emissions
f rom polymer filament desktop 3D printers