preparatory survey report on the sewerage system
TRANSCRIPT

JAPAN INTERNATIONAL COOPERATION AGENCY
TEC INTERNATIONAL CO., LTD.
PREPARATORY SURVEY REPORTON
THE SEWERAGE SYSTEMIMPROVEMENT PROJECT
FORTHE CITY OF BELGRADE
INREPUBLIC OF SERBIA
VOLUME IIAPPENDIX-I
REPUBLIC OF SERBIATHE CITY OF BELGRADEBELGRADE LAND DEVELOPMENT PUBLIC AGENCY (LDA)BELGRADE WATERWORKS AND SEWERAGE (BVK)
MAY 2013
7R
CR(5)
13-018


JAPAN INTERNATIONAL COOPERATION AGENCY
TEC INTERNATIONAL CO., LTD.
PREPARATORY SURVEY REPORTON
THE SEWERAGE SYSTEMIMPROVEMENT PROJECT
FORTHE CITY OF BELGRADE
INREPUBLIC OF SERBIA
VOLUME IIAPPENDIX-I
REPUBLIC OF SERBIATHE CITY OF BELGRADEBELGRADE LAND DEVELOPMENT PUBLIC AGENCY (LDA)BELGRADE WATERWORKS AND SEWERAGE (BVK)
MAY 2013

EXCHANGE RATE
1 Euro 115.00 Serbian Dinar
1 Euro 105.00 Japanese Yen
as of January 2013

VOLUME I
SUMMARY & MAIN REPORT
VOLUME II
APPENDIX-I
VOLUME III
APPENDIX-II
(PRE EIA & LARAP)
VOLUME IV
DRAWINGS


i
Preparatory Survey Report
on the Sewerage System Improvement Project for the City of Belgrade
in Republic of Serbia
Volume II Appendix-I
Table of Contents
Chapter 2 Project Background and Basic Information
1. Bylaws Related to Emission Limit Values (ELV) .........................................................1
2. Bylaws Related to Limit Values of Surface Water ........................................................6
Chapter 4 Facilities Planning of Interceptor
1. Adopted unit cost for comparison of Interceptor No.1 and No.2 ..................................1
2. Brake down cost for comparison of Interceptor No.1 and No.2 ...................................3
3. Soil condition of Interceptor No.6 and No.10 ...............................................................6
Chapter 5 Facilities Planning of Pumping Station
1. Design calculation of New Usce PS ..............................................................................1
Chapter 6 Facilities Planning of Veliko Selo Wastewater Treatment Plant
1. Comparison of Sewage Treatment Process ...................................................................1
1.1 Anaerobic Anoxic Oxic Process (A2O) ........................................................................1
1.2 Step Feed Type Nitrification Denitrification Process with Coagulant (SFNDP) ........2
1.3 Carrier Added Activated Sludge Process (CAASP) ......................................................3
2. Performance Analysis of Sewage Treatment Process ....................................................4
2.1 Wastewater Treatment Plant ..........................................................................................4
2.2 Annual Average Qualities ..............................................................................................7
3. Design Calculation of Veliko Selo WWTP ................................................................. 11
3.1 Basics for Planning ...................................................................................................... 11
3.2 Design Calculation of Sewage Treatment Facilities .................................................... 11

ii
3.3 Design Calculation of Aeration Requirement .............................................................13
3.4 Design Calculation of Sludge Treatment Facilities .....................................................14
3.5 Calculations .................................................................................................................17
4. Soil Condition .............................................................................................................25
Chapter 7 Cost Estimation and Implementation Schedule
1. Estimated Project Cost of All Component ......................................................................1
2. Estimated Project Cost of Phase-1 Project ......................................................................5
Chapter 8 Financial Analysis and Economic Analysis and Institution
1. Willingness To Pay Survey Formats ...............................................................................1
2. Willingness To Pay Survey Results ...............................................................................4
Chapter 9 Current Engagement with CDM
1. Project Design Document (PDD) ....................................................................................1

Preparatory Survey on the Sewage System Improvement Project for the City of Belgrade APPENDIX-I
Chapter 2 Project Background and Basic Information
1
Chapter 2 Project Background and Basic Information 1. Bylaws Related to Emission Limit Values (ELV)
Table 1 ELV for Certain Categories of Pollutants for Process Water before Discharge to
the Public Sewer
No. Parameters Unit ELV 1 pH 6.5-9.5 2 COD mg/l 1000 (VII) 3 BOD mg/l 500 (VII) 4 Total non organic N (NH4-N, NO3-N, NO2-N) mg/l 120 5 Total N mg/l 150 6 Ammonium, expressed in N (NH4-N) mg/l 100 (I) 7 Sedimentation materials after 10 minutes mg/l 150 (II) 8 Total P mg/l 20 9 Extract organic solvents (oil, fat) mg/l 50 (III) 10 Mineral oil (IV) mg/l 30 11 Phenols mg/l 50 12 Tar mg/l 5 13 Total Fe mg/l 200 14 Total Mn mg/l 5 15 Sulphides mg/l 5 16 Sulphates mg/l 400 (IX) 17 Active chloral mg/l 30 18 Total salts mg/l 5000 (VIII, X) 19 Fluorides mg/l 50 20 Total arsenic (VI) mg/l 0.2 21 Total Ba mg/l 0.5 22 Cyanides (easy volatile) mg/l 0.1 23 Total cyanides mg/l 1 24 Total silver mg/l 0.2 25 Total Hg (VI) mg/l 0.05 26 Total Zn (VI) mg/l 2 27 Total Cd (VI) mg/l 0.1 28 Total Cobalt mg/l 1 29 Cr (VI) mg/l 0.5 30 Total Cr (VI) mg/l 1 31 Total Pb mg/l 0.2 32 Total Sn mg/l 2 33 Total Cu (VI) mg/l 2 34 Total Ni (VI) mg/l 1 35 Total Mo mg/l 0.5 36 BTEX (benzene, toluene, ethylbenzene, and xylene) 10-3m3/m3
(V) 0.1 37 Organic solvent 10-3m3/m3
(V) 0.1 38 Asbestos mg/l 30 39 Toxicity ratio of dilution LC50%
(toxicity test with fish or

Preparatory Survey on the Sewage System Improvement Project for the City of Belgrade APPENDIX-I Chapter 2 Project Background and Basic Information
2
No. Parameters Unit ELV daphnia)
40 Temperature °C 40 (I) Determined for 24h average composite sample
(II) It is determined only in the case if the volume of sediment matters, after 10 minutes of the sedimentation higher than 5x10³
m3/m3
(III) In the case of daily flow of 100m3/day for materials of biological or animal origin the value is triple and above that double
(IV) Above 10m3/day
(V) Limit value is given in 10-3 m3/m3
(VI) In the case of usage of waste water treatment residue generated in central facility, limit values can be stringent or if it is
determined that there is disturbance in work on central treatment due to the big number of connected industries, it is
necessary to reconsider given values, just in case
(VII) These values can be reconsidered taking in consideration technical, technological and economical factors that impact
selection of joint communal and industrial treatment in the city waste water treatment plant, as well as infiltration of
groundwater in the sewer resulting in the organic matters concentration in the influent to be low
(VIII) These values could be reconsidered taking in consideration technological factors that impact selection of joint treatment of
communal and industrial waste water in the city wwtp
(IX) In the case when the discharge pipes are concrete, limit value for sulphates is 200mg/l
(X) In the case when the discharge pipes are concrete, limit value for chloride is 1000mg/l
Table 2 ELV for Communal Wastewater Discharge to the Recipient
Parameter ELV The lowest reduction percentage (I)
a) ELV on the secondary treatment stage
BOD (II,VI,VII) 25mg/l O2
40mg/l O2 (III)
70-90
COD (VI) 125mg/l O2 75
Total suspended
solids (IV, VIII)
35mg/l (more than 10,000PE)
60mg/l (2,000 to 10,000 PE)
90
70
b) ELV on the tertiary treatment stage
Total P 2mg/l P (10,000 to 100,000 PE)
1mg/l P (more than 100,000 PE)
80
Total N (V) 15mg/l N (10,000 to 100,000 PE)
10mg/l N (more than 100,000 PE)
70-80
(I) Reduction in relation to the load of influent
(II) Parameter can be replaced with some other parameter: total organic carbon (TOC) or total chemical oxygen demand (COD
total) if the relation between BOD and these parameters can be determined
(III) If it is proven that discharged treated waste water will not have negative impact on the water quality
(IV) Suspended solids are not obligatory parameter
(V) Total nitrogen: organic N+NH4-N+NO3-N+NO2-N
(VI) Homogenized, non filtrated, non decanted sample
(VII) Adding inhibitor of nitrification
(VIII) By filtration of representative sample through the membrane filter 0.45µm. Drying on 105°C and weighting

Preparatory Survey on the Sewage System Improvement Project for the City of Belgrade APPENDIX-I
Chapter 2 Project Background and Basic Information
3
Table 3 ELV (I) for Communal Wastewater According to the WWTP Capacity (VI)
WWTP
capacity PE
COD (III) BOD (II, III) Total SS (III) Total P Total N mg/l
mg/l % mg/l % mg/l % mg/l % 1.V-
15.IX
16.XI-
30.IV
<600 (IV)
70 80 (IV) 75 100 - (IV) (IV) (IV) (IV)
601-2000 (IV) 75 50 (IV) 80 75 -
(IV) (IV) (IV) (IV)
2001-10000 125 75 25 70-90 60 70 (IV) (IV) (IV) (IV)
10001-100000 125 75 25 70-90 35 90 2 (V) 80 15
(V) 25 (V)
>100000 125 75 25 70-90 35 90 1 (V) 80 10
(V) 20 (V)
(I) It is necessary to comply with either limit value for (average daily) concentration (mg/l) or reduction percentage (%)
(II) Parameter can be replaced by other parameter; total organic carbon TOC or total COD if the relation between BOD and these
parameters can be determined
(III) In the case of determine effluent from lagoons COD and BOD should be determined in filtrated sample, but total content of
suspended solids cannot exceed 150mg/l
(IV) If needed,(water with small capability for self treatment) responsible authority can determine the values for that particular
case, that can be more stringent than the given value
(V) These limit values need to be secured for the sensitive area for nitrate, when capacity of the plant is above 10000PE
(VI) In the case of mixed discharge and treatment of communal and industry water, by the public sewerage system, it is needed to
ass ELV for hazardous materials, from industry, agriculture and other activities by using the given limit values for each
industry analyzed in the EIA study
Table 4 ELV of the Treated Communal Wastewater Discharge to the Surface Water, Used
for Bath and Recreation, Water Supply and Irrigation
Parameters Units ELV
Coliform bacteria number in 100ml 10,000
Coliform bacteria from feces number in 100ml 2,000
Streptococcus from feces number in 100ml 400
Table 5 Minimum Number of Samples of Treated Communal Wastewater Dependent of
Plant Capacity
Plant size Annual sample numbers (I)
2,000-9,999 PE 12
If in the first year is proved that quality of treated waste water does not exceed
the ELV given in this regulation, next year only 4 is needed.
If during the one of the following years, one of the 4 samples does not fulfill
ELV for pollutants listed in this regulation, it returns to the 12 annual samples.
10,000-49,999PE 12
>50,000 PE 24
(I) 24h average value composite samplers are analyzed proportional flow or time are analyzed

Preparatory Survey on the Sewage System Improvement Project for the City of Belgrade APPENDIX-I Chapter 2 Project Background and Basic Information
4
Table 6 Max Number of Samples That Can Divert from the ELV for the Treated
Communal Wastewater Depending of Total Sample Number (I)
Number of samples
taken during one year Max sample number exceeding ELV (II,III)
Number of samples taken during one year
Max sample number exceeding ELV (II,III)
4-7 1 172-1887 14
8-16 2 188-203 15
17-28 3 204-219 16
29-40 4 220-235 17
41-53 5 236-251 18
54-67 6 252-268 19
68-81 7 269-284 20
82-95 8 285-300 21
96-110 9 301-317 22
111-125 10 318-334 23
126-140 11 335-350 24
141-155 12 351-365 25
156-171 13
(I) In the given evaluation of the results, the extreme values that occur a result of extraordinary circumstances (for example
heavy rain above average are not taken into consideration)
(II) under the normal conditions, content of organic matters expressed by BOD5 and COD in any case cannot exceed required
value by 100%, for suspended solids by 150%
(III) annual mean value concentration of N and P cannot exceed required value
Table 7 ELV for Residues of Wastewater Treatment
Parameter Unit (I) ELV
Agriculture use (II) Other use (III)
<Non organic material>
Pb mg/kg 120 1,200
Cd mg/kg 2.5 40
Cr mg/kg 100 1,000
Ni mg/kg 60 400
Hg mg/kg 1.6 25
Cu mg/kg 700 1,750
Zn mg/kg 1,500 4,000
As mg/kg 15 75
<Organic material>
Adsorbing organic halogens (V) mg/kg 400 500
PCB (VI) mg/kg 0.1 (per congener) 0.2 (per congener)
PCCD/F (VII) ng/kg DS 30 30

Preparatory Survey on the Sewage System Improvement Project for the City of Belgrade APPENDIX-I
Chapter 2 Project Background and Basic Information
5
Parameter Unit (I) ELV
Agriculture use (II) Other use (III)
<Pathogens (IV)>
Salmonella MPN/10g DS (VIII) 0-10
Enterovirus MPCN/10g DS (IX) 3
(I) Related to the dry residue from treatment DS
(II) If used in agriculture, particular attention should be on plant seasons, where pH of soil is between 6 and7. If the residues
are used on the soil with pH lower than 6, it should be taken in consideration capability the increasing mobility of metals
and of plants to absorb metals, thus lower limit values should be taken in that case. Residues from the treatment are used in
that way to consider plant needs for nutrients, soil quality and not to pollute surface water and ground water
(III) Residues from the treatment process can be used to cover landfill, green area in parks, improvement of soil quality when
the soil will not at least one year be used for planting and cattle feeding, for landscaping. For all these cases soil pH value
should be between 6 or 7
(IV) By specific use of the soil, used for example for vegetables or cattle, limitation are due to the health risk from remained
pathogens. In that case residues are treated before use in order to reduce pathogens on the acceptable level.
(V) Adsorbing organic halogen AOH
(VI) PCB, each of 6 individual PCB (28,52,101,138,153 and 180) according to IUPAC nomenclature 2,4,4’Trichlorobiphenyl,
2,2’5,5’-Tetrachlorobiphenyl, 2,2’4,5,5’-Pentachlorobiphenyl, 2,2’3,4,4’,5’-Hexachlorobiphenyl,
2,2,4,4’,5,5’-Hexachlorobiphenyl, 2,2’,3,4,4’,5,5’-Heptachlorobiphenyl,
(VII) PCCD/F- polychlorinated 2benzo dioxin and furan
(VIII) MPN –most probable number
(IX) MPCN- most probable number causing cytopathogenic effect

Preparatory Survey on the Sewage System Improvement Project for the City of Belgrade APPENDIX-I Chapter 2 Project Background and Basic Information
6
2. Bylaws Related to Limit Values of Surface Water
Table 8 Limit Values of Pollutant for Surface Water
Parameter Unit Limit Values (1)
Class I (2) Class II (3) Class III
(4) Class IV
(5) Class V (6)
<General> pH (12) 6.5-8.5 6.5-8.5 6.5-8.5 6.5-8.5 <6.5 or <8.5Suspended solids (9) (12) mg/l 25 25 - - - <Oxygen regime> Dissolved oxygen mg O2/l - (8) (or PN) - (8) 5 4 <4 Oxygen saturation % Epilimnion 90-110 70-90 50-70 30-50 <30 Hipolimnion 70-90 70-50 30-50 10-30 <10 Nonstrati 70-90 50-70 30-50 10-30 <10 BOD5 mg O2/l - (8) (or PN) - (8) 7 25 >25 COD (bichromate method)
mg O2/l 10 (or PN) 15 30 125 >125
COD (permanganate method)
mg O2/l 5 (or PN) 10 20 50 >50
Total organic carbon (TOC)
mg/l -(8) (or PN) - (8) 15 50 >50
<Nutrients> Total N mg N/l 1 (or PN) 2 8 15 >15 Nitrate mg N/l - (8) (or PN) - (8) 6 15 >15 Nitrite mg N/l 0.01 (or PN) 0.03 0.12 0.3 >0.3 Ammonium ion mg N/l - (8) (or PN) - (8) 0.6 1.5 >1.5 Non ionised ammonium (9)
mg/l NH3 0.005 0.025 - - -
Total P (7) mg P/l - (8) (or PN) - (8) 0.4 1 >1 Orthophosphate mg P/l - (8) (or PN) - (8) 0.2 0.5 >0.5 <Salinity> Chlorides mg/l 50 (or PN) - (8) 150 250 >250 Total residue chlor (9) mg/l HOCl 0.005 0.005 - - - Sulphates mg/l 50 (or PN) 100 200 300 >300 Total mineralization mg/l <1,000 (or PN) 1,000 1,300 1,500 >1,500 Conductivity on 20°C µS/cm <1,000 (or PN) 1,000 1,500 3,000 >3,000 <Metals> Arsen µg/l <5 (or PN) 10 50 100 >100 Bor µg/l 300 (or PN) 1,000 1,000 2,500 >2,500 Cu µg/l 5 (T=10)
22 (T=50) 40 (T=100) 112 (T=300)
5 (T=10) 22 (T=50) 40 (T=100) 112 (T=300)
500 1,000 >1,000
Zn µg/l 30 (T=10) 200 (T=50)
300 (T=100) 500 (T=300)
300 (T=10) 700 (T=50)
1,000 (T=100) 2,000 (T=300)
2,000 5,000 >5,000
Cr(total) µg/l 25 (or PN) 50 100 250 >250 Fe(total) µg/l 200 500 1,000 2,000 >2,000 Mn(total) µg/l 50 100 300 1,000 >1,000 <Organic materials> Phenol compounds (such as C2H5OH)
µg/l <1 1 20 50 >50
Oil carbohydrates (9) (10) (10) - - - Surface active materials (such as lauryl sulphate)
µg/l 100 200 300 500 >500

Preparatory Survey on the Sewage System Improvement Project for the City of Belgrade APPENDIX-I
Chapter 2 Project Background and Basic Information
7
Parameter Unit Limit Values (1)
Class I (2) Class II (3) Class III
(4) Class IV
(5) Class V (6)
AOH (ascorbic organic halogens)
µg/l 10 20 100 250 >250
<Microbiological parameters>
Fecal Coliforms cfu/100ml 100 1,000 10,000 100,000 >100,000 Total Coliforms cfu/100ml 500 (11) 10,000 100,000 1,000,000 >1,000,000 Itestinal enterococci cfu/100ml 200 400 4,000 40,000 >40,000 Number of aerobic heterotrophs (method Kohl)
cfu/100ml 500 10,000 100,000 750,000 >750,000
T: hardness of the water (mg/l CaCO3)
PN: natural level
(1) If not otherwise stated, values are given as total concentration in taken sample
(2) Description of the class corresponds excellent ecological status according to the classification given in the regulation on
determination of parameters of ecological and chemical status of surface water. Surface water that belongs to this class ensure
on the basis of limit values of elements qualitative conditions for functioning of ecosystem, life and fish protection
(salmonidae and cyprinids) and can be used in the following purpose: potable water supply with prior treatment by filtration
and disinfection, bathing and recreation, watering, industrial purpose (process and cooling water)
(3) Class description corresponds to good ecological status according to the classification given in the regulation that determine
parameters of ecological and chemical status for surface water. Surface water that belongs to this class determine on the basis
of limit values of elements qualitative conditions for functioning of ecosystem, life and fish protection (cyprinids) and can be
used for the same purpose and under same conditions as surface water that belongs to the class i
(4) Class description corresponds to moderate ecological status according to the classification given in the regulation that
determine parameters of ecological and chemical status for surface water. Surface water that belongs to this class provide on
the basis of limit values of qualitative elements conditions for life and Cyprinidae protection and can be used for following
purposes: potable water supply with prior pre-treatment by coagulation, flocculation, filtration and disinfection, bath and
recreation, watering, industrial purpose (process and cooling water).
(5) Class description corresponds to weak ecological status according to the classification given in the regulation that determine
parameters of ecological and chemical status for surface water. Surface water that belong to this class on the basis of limit
values of elements quality can be used in following purposes: potable water supply with combination of the prior stated
treatments and advances treatments methods, watering, industrial purpose (process and cooling water)
(6) Class description corresponds to bad ecological status according to the classification given in the regulation that determine
parameters of ecological and chemical status for surface water. Surface water that belongs to this class cannot be used for any
other purpose.
(7) Total phosphate is analysed from filtrate, eg from diluted phase that is given by filtration through 0,45µm filter
(8) Please look at the annex 1, table 2 and table 3, in which are given limit values of pollutants for I and II class of surface water
(9) Parameters are monitored only in water surface that are defined as salmonidae and cyprinid.
(10) Oil products cannot be present in the water in such quantity to:
- form visible film layer on surface water or layers on the river and lake banks
- give the distinctive “hydrocarbon” taste to fishes
- cause damages to fishes
(11) Based on 95% estimation
(12) Allowed deviation of the limit values in the case of special geographical conditions

Preparatory Survey on the Sew
age System Im
provement P
roject for the City of B
elgrade A
PP
EN
DIX
-I C
hapter 2 Project B
ackground and Basic Inform
ation
8 T
able 9 L
imit V
alues of P
ollutan
t for Class I
(1) of Su
rface Water

Preparatory Survey on the Sewage System Improvement Project for the City of Belgrade APPENDIX-I
Chapter 2 Project Background and Basic Information
9
Table 10 Limit Values of Pollutant for Class II(1) of Surface Water
Types of surface water
pH DO
(mg/l)BOD (mg/l)
Total organic carbon (mg/l)
Ammonium ion
(NH4-N) (mg/l)
Nitrates (NO3-N) (mg/l)
Orthophosphates (PO4 3-) (mg/l)
Total phosphate (P) (mg/l)
Chlorides (Cl)
(mg/l)
Big river in low areas, dominated fine sediment (type 1)
6.5-8.5 7.0 5.0 5.0 0.30 3.0 0.10 0.20 100
Big rivers, dominated middle sediment, exception river in Pannonia basin (type 2)
6.5-8.5 7.0 4.5 5.0 0.10 3.0 0.10 0.20 100
Small and middle water courses, level above sea up to 500m, dominated big ground base (type 3)
6.5-8.5 7.0 5.0 6.0 0.10 3.0 0.10 0.20 100
Small and middle water courses, level above sea above 500m, dominated big ground base (type 4)
6.5-8.5 7.0 4.0 5.0 0.30 3.0 0.05 0.10 100
Water courses in Pannonia basin except those that are under type 1 (type 5)
6.5-8.5 6.0 5.0 6.0 0.40 3.0 0.20 0.30 100
Small water courses out of Pannonia basin that are not under type 3 and type 4, as well as water courses that are not determined by the Regulation on determination of water bodies of surface and ground water (Official Gazette 96/10) (type 6)
6.5-8.5 7.0 4.0 5.0 0.10 3.0 0.10 0.15 100
Lakes above the sea level up to 200 m asl, all shallow lakes (up to 10m), all paddle and swamp ecosystems
6.5-8.5 7.0 5.0 6.0 0.30 3.0 0.10 0.20 100
Lakes above the sea level up to 200 m asl, medium depth (up to 10-30m) and deep (depth>30m)
6.5-8.5 7.0 5.0 6.0 0.10 3.0 0.10 0.20 100
Accumulations formed on water body type 1
6.5-8.5 7.0 5.0 6.0 0.30 3.0 0.10 0.20 100
Accumulations formed on water body type 2 6.5-8.5 7.0 4.5 5.0 0.10 3.0 0.10 0.20 100
Preparatory Survey on the Sewage System Improvement Project for the City of Belgrade APPENDIX-I Chapter 2 Project Background and Basic Information
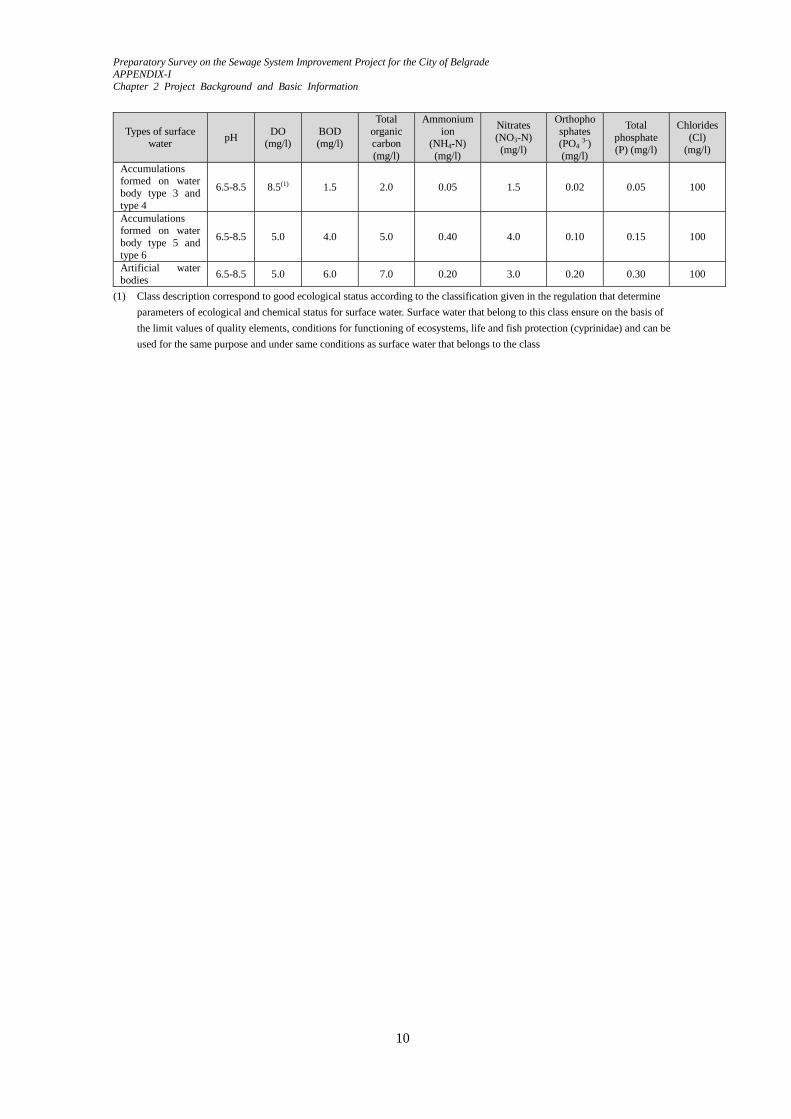
10
Types of surface water
pH DO
(mg/l)BOD (mg/l)
Total organic carbon (mg/l)
Ammonium ion
(NH4-N) (mg/l)
Nitrates (NO3-N) (mg/l)
Orthophosphates (PO4 3-) (mg/l)
Total phosphate (P) (mg/l)
Chlorides (Cl)
(mg/l)
Accumulations formed on water body type 3 and type 4
6.5-8.5 8.5(1) 1.5 2.0 0.05 1.5 0.02 0.05 100
Accumulations formed on water body type 5 and type 6
6.5-8.5 5.0 4.0 5.0 0.40 4.0 0.10 0.15 100
Artificial water bodies
6.5-8.5 5.0 6.0 7.0 0.20 3.0 0.20 0.30 100
(1) Class description correspond to good ecological status according to the classification given in the regulation that determine
parameters of ecological and chemical status for surface water. Surface water that belong to this class ensure on the basis of
the limit values of quality elements, conditions for functioning of ecosystems, life and fish protection (cyprinidae) and can be
used for the same purpose and under same conditions as surface water that belongs to the class

Preparatory Survey on the Sewage System Improvement Project for the City of Belgrade APPENDIX-I
Chapter 4 Facilities Planning of Interceptor
1
Chapter 4 Facilities Planning of Interceptor 1. Adopted unit cost for comparison of Interceptor No.1 and No.2
(1) Micro-tunneling Cost
Costs are decided by the Actual cost at Belgrade and estimated cost by Preliminary design of New
Usce PS in 2009.
Shape Estimated Cost
(Euro/m) Remarks
Dia 1500mm 5,000 1.2times in case of Arc-line
Dia 2800mm 8,000340euro/m extra in case of mortar filling inside casing
Dia 3500mm 9,500
Dia 4000mm 11,000
0
2000
4000
6000
8000
10000
12000
0 1000 2000 3000 4000 5000
Euro
/m
Diameter
Actual cost at Belgrade
Preliminary Design
Applicable Cost
(2) Jacking Cost for pipe protection by iron outer pipe
Costs are considered by the hearing of LDA
Shape Estimated Cost
(Euro/m) Remarks
Dia 1500mm 1,700 Including iron pipe and jagging work
Dia 2000mm 2,300 ditto
(3) Horizontal Direction Drilling Cost
Cost estimated by Preliminary design is adopted. 275,0000euro (in 2009) x 1.3 =3,575,000 Euro.

Preparatory Survey on the Sewage System Improvement Project for the City of Belgrade APPENDIX-I Chapter 4 Facilities Planning of Interceptor
2
(4) Pipe lying cost inside Casing pipe or Pipe gallery
Shape Construction Cost
(Euro/m) Remarks
Dia 1000mm x 2Line
640 Including two pipes and fixing material
(5) Pipe lying cost at road
Shape Construction Cost
(Euro/m) Remarks
Dia 1400mm x 1Line 1,350
Including a pipe material, asphalt demolition, excavation and backfilling, paving, earth retaining, and pumping work.
(6) Maintenance cost
Cost (Euro/time)
Inspection 20,000Including sewer discharge and ventilation inside pipe. Inspection by Human or TV camera.
Preparatory Survey on the Sew
age System Im
provement P
roject for the City of B
elgrade A
PP
EN
DIX
-I C
hapter 4 Facilities P
lanning of Interceptor
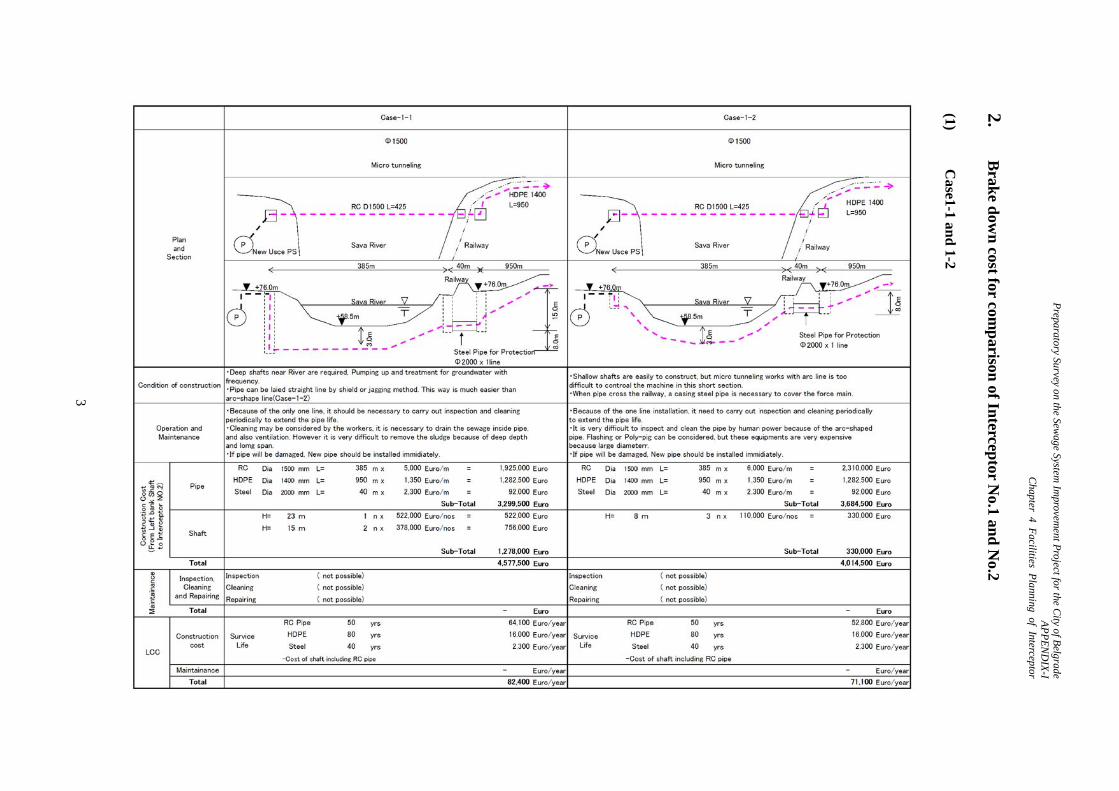
3 2.
Brak
e dow
n cost for com
parison
of Intercep
tor No.1 an
d N
o.2 (1)
Case1-1 an
d 1-2

Preparatory Survey on the Sew
age System Im
provement P
roject for the City of B
elgrade A
PP
EN
DIX
-I C
hapter 4 Facilities P
lanning of Interceptor
4 (2)
Case2-1 an
d 2-2

Preparatory Survey on the Sew
age System Im
provement P
roject for the City of B
elgrade A
PP
EN
DIX
-I C
hapter 4 Facilities P
lanning of Interceptor
5 (3)
Case2-3 an
d 2-4

Preparatory Survey on the Sewage System Improvement Project for the City of Belgrade APPENDIX-I Chapter 4 Facilities Planning of Interceptor
6
3. Soil condition of Interceptor No.6 and No.10
(1) Interceptor No.6
R-9
K-13
R-18
K-14
R-14
K-15
R-10
Begging of Interceptor No.6
End of Interceptor No.6

Preparatory Survey on the Sew
age System Im
provement P
roject for the City of B
elgrade A
PP
EN
DIX
-I C
hapter 4 Facilities P
lanning of Interceptor
7

Preparatory Survey on the Sew
age System Im
provement P
roject for the City of B
elgrade A
PP
EN
DIX
-I C
hapter 4 Facilities P
lanning of Interceptor
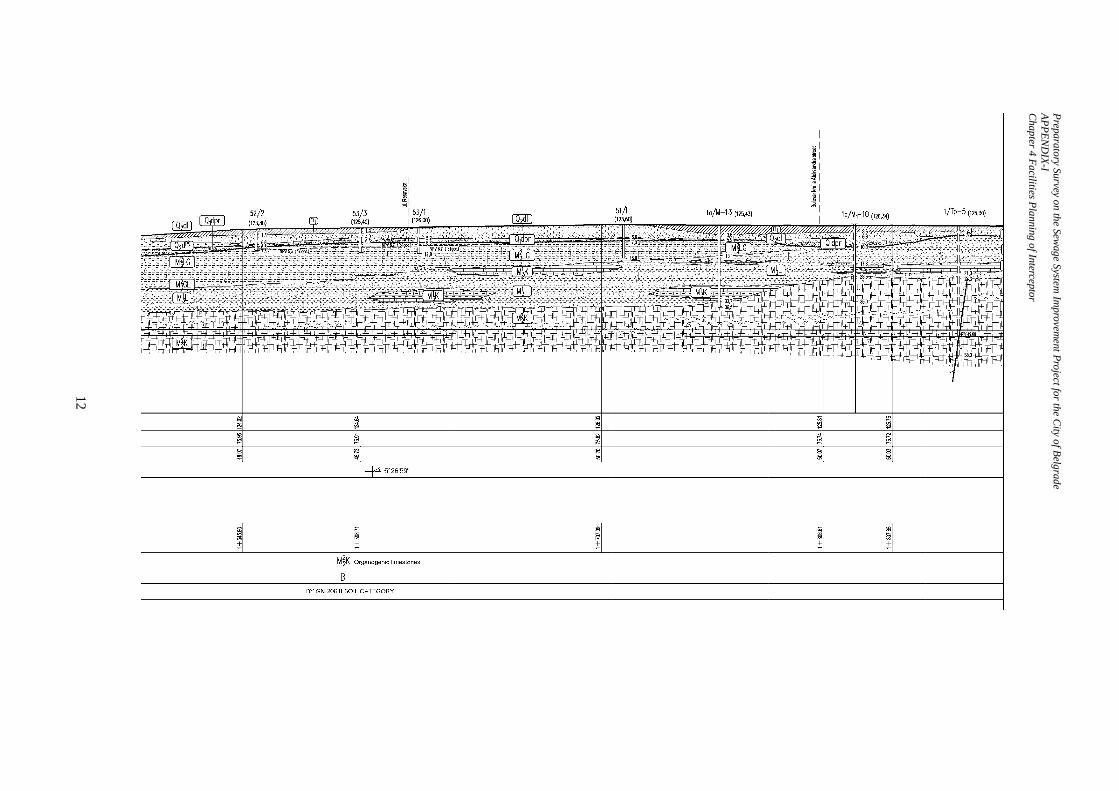
8 (2)
Intercep
tor No.10
The sum
mary of current survey docum
ents “Soil characteristic of Interceptor N
o.10 in Detailed
design” (Information only)

Preparatory Survey on the Sew
age System Im
provement P
roject for the City of B
elgrade A
PP
EN
DIX
-I C
hapter 4 Facilities P
lanning of Interceptor
9

Preparatory Survey on the Sew
age System Im
provement P
roject for the City of B
elgrade A
PP
EN
DIX
-I C
hapter 4 Facilities P
lanning of Interceptor
10

Preparatory Survey on the Sew
age System Im
provement P
roject for the City of B
elgrade A
PP
EN
DIX
-I C
hapter 4 Facilities P
lanning of Interceptor
11
Preparatory Survey on the Sew
age System Im
provement P
roject for the City of B
elgrade A
PP
EN
DIX
-I C
hapter 4 Facilities P
lanning of Interceptor
12

Preparatory Survey on the Sew
age System Im
provement P
roject for the City of B
elgrade A
PP
EN
DIX
-I C
hapter 4 Facilities P
lanning of Interceptor
13

Preparatory Survey on the Sew
age System Im
provement P
roject for the City of B
elgrade A
PP
EN
DIX
-I C
hapter 4 Facilities P
lanning of Interceptor
14

Preparatory Survey on the Sew
age System Im
provement P
roject for the City of B
elgrade A
PP
EN
DIX
-I C
hapter 4 Facilities P
lanning of Interceptor
15

Preparatory Survey on the Sewage System Improvement Project for the City of Belgrade APPENDIX-I Chapter 4 Facilities Planning of Interceptor
16
The categorization for defining the geotechnical conditions of tunneling (categories A, B, C, D, E
and F), was performed according to the data obtained on the basis of available research, which can
be evaluated differently. It is the entire categorization was conducted for the excavation by the
method of mechanized shield.
The characteristics of these categories are given in the following table:
Environment Chainage
The appearance of water in excavation (m3/dan/m ')
JA
strength
(MPa)
cracked-
dividity
swelling
(KPa)
GT
Categ.
category
by
GN-200
M31
(K,BR,BL)
0+033,00
0+300,00
+
-
2,05;
35,3-38,2+++ - E
III-IV;
V-VI
K14,5(K,BR) 0+300,00
0+680,00
0+420,00
0+680,00
(0,35-1,20)
17,0-52,0 ++ - A1 V, VI,
VII
M22K
M31L
0+680,00
1+210,00-
(2,2-10)
K
(2,5-3,2)
L
++ - C III-IV
M22K 1+210,00
2+000,00
1+210,00
1+285,00
(0,65-0,85)
1,9-2,6 ++ - B III-IV
M22K 2+000,00
2+230,00(245.00) 5,2-8,9 ++ - A3 III-IV
M31K 2+230,00
2+340,00
(255,00-325,
00) 11,2-23,5 + - A2 V-VI
M32GL,
M32 L
2+340,00
2+470,00- 1,8 - 107 C III-IV
dpr
M32GL
2+470,00
2+755,00(0.10) <1,8 - 100-295 F III
M32L 2+755,00
2+820,00- 1,8 - - F III-IV
t1 2+820,00
3+020,00
(0,05-0,10)
For sands
(,00-10,00)
- - - F II

Preparatory Survey on the Sewage System Improvement Project for the City of Belgrade APPENDIX-I
Chapter 4 Facilities Planning of Interceptor
17
Geotechnical category “A”
The section with chainages 0 +300-0 +680 - A1
g= 21,7-27,7 kN/m3
f1 = 35 – 49
c1 = 3028- 8034kN/m2
sS=17 000 -52 000 kN/m2
Vp = 2650 – 5360 m/s Vs = 1700 – 2700 m/s
Edyn = 16,8 – 52,7 GN/m2
The section with chainages 2 +000-2 +230 - A3
g = 19,6-21,2 kN/m3
f1 = 31 – 33
c = 834 - 1545 kN/m2
sS=5 289 -8 957 kN/m2
Vp = 1900 – 2160 m/s Vs = 890 – 1000 m/s
Edyn = 4,27 – 6,64 GN/m2
n = 0,34 -0,36
The section with chainages 2 +230-2+340 -A2
g = 23,1 - 25,8 kN/m3
f1= 33-37º
c1= 3027-4572 kN/m2
sS=11 178 -23 550 kN/m2
Vp = 3160 – 3960 m/s Vs = 1000 – 2250 m/s
Edyn = 16,02 – 34,61 GN/m2
n = 0,28 -0,35
The geotechnical category „b“
The section of chainages 1+210-2+000,00
g = 17,5-20,25 kN/m3
f = 30 – 33
c = 329- 405 kN/m2
sS=1 953 -2 663 kN/m2
Vp = 1780 – 2840 m/s Vs = 820 – 1340 m/s
Edyn = 3,6 – 9,1 GN/m2
n = 0,34 -0,40
Geotechnical category „C“
The section with chainages 0 +680-1 +210.00
g = 17,2-19,5 kN/m3

Preparatory Survey on the Sewage System Improvement Project for the City of Belgrade APPENDIX-I Chapter 4 Facilities Planning of Interceptor
18
In the presence of water Residual In naturally moist condition
Shear strength test = 10-14
c = 13-15 kN/m2
rez= 7
crez=0 kN/m2
1 = 14-16
с1 = 325-380 kN/m2
Triaxial test u = 19-20
Cu = 18-29 kN/m2 - -
sB= 66 kN/m2
sC=2524 - 3221 kN/m2
Vp = 1400 – 1560 m/s Vs = 650 – 730 m/s
Edyn = 2,37 – 2,85 GN/m2
n = 0,36 -0,38
Geotechnical category „D“
The section with chainages 2+340-2 +470.00
g = 18,5-20,5 kN/m3
In the presence of water Residual
Shear strength test = 13-19
c =15-30 kN/m2
rez= 5-9
crez= 0 kN/m2
By GN-200 standards, the environment belongs to II-III category. According to GN-206
classification the entire complex belongs to II-III category.
Marls M32L- dusty, sporadically clayey. They are gray in color, tabular to massive, hard and brittle.
With the loss of humidity they are divided into 2-5cm thick tables. Along the tables, limonite in the
form of scum is deposited. In the mass, sub-vertical cracks, rough and of uneven surfaces are present.
The environment is virtually incompressible, waterproof.
The values of physical and mechanical parameters are in the following range:
g= 17,9-20,8 kN/m3
In the presence of water In naturally moist
condition
Shear strength test = 10-20
c = 25-35 kN/m2
= 13
c = 326 kN/m2
Triaxial test u = 18
Cu = 28 kN/m2 -
sB= 107 kN/m2
sc= 1800 kN/m2

Preparatory Survey on the Sewage System Improvement Project for the City of Belgrade APPENDIX-I
Chapter 4 Facilities Planning of Interceptor
19
Vp = 1640 – 1650 m/s Vs = 740 – 800 m/s
Edyn = 3,13 – 3,42 GN/m2
g = 0,35 -0,37
Geotechnical category „E“
The section with chainages 0 +033-0+300.00
g= 17,5-21,0 kN/m3
Shear strength test
In the presence of water In naturally moist condition
= 21
c = 4kN/m2
1= 21
с1= 4 kN/m2
sc=2 050 kN/m2
Vp = 1830 m/s Vs = 870 m/s
Edyn = 4,35 GN/m2
n = 0,35
Geotechnical category „F“
The section with chainages 2 +470-2 +740 - F2
g = 18,4-19,8 kN/m3
In the presence of water Residual
Shear strength test = 11-12
c=14-16 kN/m2
rez= 7-10
crez= 0-7 kN/m2
Triaxial test - -
Ms = 7.000-12.000 kN/m2
sB = 100-145 kN/m2
The section with chainages 2 +740-2 +820 - F1
g= 17,9-20,8 kN/m3
In the presence of water In naturally moist condition
Shear strength test = 10-20
c = 25-35 kN/m2
= 13
c = 326 kN/m2
Triaxial test u = 18
Cu = 28 kN/m2 -
sB= 107 kN/m2
sc= 1800 kN/m2

Preparatory Survey on the Sewage System Improvement Project for the City of Belgrade APPENDIX-I Chapter 4 Facilities Planning of Interceptor
20
Vp = 1640 – 1650 m/s Vs = 740 – 800 m/s
Edyn = 3,13 – 3,42 GN/m2
n = 0,35 -0,37
The section with chainages 2 +820-3 +020 - F3
g= 18.0-19.0 kN/m3
In the presence of water Rezidualno
Shear strength test = 10-20
c=8-12 kN/m2
rez= 8-11
crez=0-5 kN/m2
Triaxial test = 22
c= 25 kN/m2 -
Ms= 3.500-8.000 kN/m2
sB= 110 kN/m2

Appendix Chapter 5 Facilities Planning of Pumping Station
1
Chapter 5 Facilities Planning of Pumping Station 1. Design calculation of New Usce PS
(1) Capacity Calculation
1)Inlet
Unit 2031
Flow (m3/s) 3.345
Water depth (m) 1.06
Width of Channel (m) 2.00
Hydraulic velocity (m/s) 1.60
2)Screen channel
Unit 2031
Flow(Q) (m3/s) 3.345
Number of Channel (N)
(nos) 2
Width and Depth (B×H)
(m) 3.0×0.98
Area(a) (m2) 5.10
Velocity (v)=Q/a
(m/s) 0.57
3)Sand pit The target diameter of sand removal is above 1.0mm in this pumping station.
Unit 2031
Flow(q) (m3/s) 3.345
Number of Channel(N)
(Line) 2
Size of Channel (B×L×H)
(m) 4.0×13.0×1.2
Area(a) (m2) 9.60
Surface Area(A) (m2) 104.0
Volume(Vo) (m3) 61.2
Load of Surface (r)=Q/A
(m3/m2・day) 2,780
Velicoty (v)=Q/a
(m/s) 0.35
Retention time (T)=Vo/Q
(sec) 18.3
Diameter of sand (mm) 1.0
Sink speed(vo) (m/s) 0.1
Settling time (t)=H/vo
(sec) 12
Ratio of sand removal d=1-(1/(1+T/t))
(%) 60

Preparatory Survey on the Sewage System Improvement Project for the City of Belgrade APPENDIX-I Chapter 4 Facilities Planning of Interceptor
2
4)Pump
Unit 2031
Flow(Q) (m3/s) 3.350
Number of Pump (N) (nos) 4Duty +1Stand-by
Flow per pump(q) (m3/min) 50.2
Pump Diameter (D) (mm) 600
146×(50.2/1.5~3.0)0.5
Water level of Pump pit (m) +69.800
Water level of Outlet MH (m) +78.700
Actual head loss (m) 8.90
Total head loss
Design criteria is listed as below
① BOP at Inflow pipe:+69.80m
② Planned suction level:+69.80m
③ Water level of Outlet MH:+78.70m
④ Length and Diameter of Pressured pipe:Dia1000 x 2line L=500m,
Dia1400 x 1 line L=950m
⑤ Total head loss
Actual head loss ha=8.90m
Pipe loss
hf=10.666×130-1.85
×1.00-4.87×100.41.85
×500m=3.31m
hf=10.666×110-1.85
×1.40-4.87×(200.8)1.85
×950m=4.40m
Total 7.71m
Pump loss hp=2.0m
Confluent loss ho=1.0m
Total head loss H=8.90+7.71+2.0+1.0 = 19.61m ≒20.0m

Preparatory Survey on the Sewage System Improvement Project for the City of Belgrade APPENDIX-I
Chapter 6 Facilities Planning of Veliko Selo Wastewater Treatment Plant
1
Chapter 6 Facilities Planning of Veliko Selo WWTP
1. Comparison of Sewage Treatment Process
1.1 Anaerobic Anoxic Oxic Process (A2O)
(1) Design Calculation of Bioreactor
Bioreactor Anaerobic anoxic oxic process
Number of bioreactor tank 48 tanks
Design flow 448,700 m3/day
MLSS concentration 3,000 mg/l
Dissolved oxygen 2.5 mg/l
Lowest monthly sewage temperature 10 degree Celsius
ASRT (aerobic solid retention time) 10.7 day
HRT (hydraulic retention time) 21.3 hour
Solid concentration of return sludge 0.9 %
Return sludge ratio 50 %
Circulation ratio 80 %
Dimension of anaerobic tank 10 mW x 9.7 mL x 6 mD
Dimension of anoxic tank 10 mW x 68.0 mL x 6 mD
Dimension of oxic tank 10 mW x 60.8 mL x 6 mD
Diffuser of oixc tank Ultrafine bubble diffuser
Mixer of anoxic tank Top-entry agitator
Circulation pump Low head pump
(2) Design Calculation of Aeration Requirement
Oxygen for oxidation of organic substance 25,398 kg-O2/day
Oxygen for nitrification of NH4 48,803 kg-O2/day
Oxygen for endogenous respiration of MLSS 42,035 kg-O2/day
Oxygen for maintaining dissolved oxygen 2,580 kg-O2/day
Total actual oxygen requirement (AOR) 118,816 kg-O2/day
Standard oxygen requirement (SOR) 190,643 kg-O2/day
Oxygen transfer efficiency 32.2 %
Aeration requirement 1,475 m3/min
Blower Multi-stage centrifugal
Specification of blower 270 m3/min x 70 kPa x 420 kW
Number of blower 8 nos. (2 standby)

Preparatory Survey on the Sewage System Improvement Project for the City of Belgrade APPENDIX-I Chapter 6 Facilities Planning of Veliko Selo Wastewater Treatment Plant
2
1.2 Step Feed Type Nitrification Denitrification Process with Coagulant (SFNDP)
(1) Design Calculation of Bioreactor
Bioreactor Step feeding nitrification denitrification process
Number of bioreactor tank 48 tanks
Design flow 448,700 m3/day
MLSS concentration 3,000 mg/l
Dissolved oxygen 2.5 mg/l
Lowest monthly sewage temperature 10 degree Celsius
ASRT (aerobic solid retention time) 10.7 day
HRT (hydraulic retention time) 17.7 hour
Solid concentration of return sludge 0.9 %
Return sludge ratio 50 %
Circulation ratio 0 %
Dimension of anoxic tank (1st stage) 10 mW x 13.7 mL x 6 mD
Dimension of oxic tank (1st stage) 10 mW x 13.7 mL x 6 mD
Dimension of anoxic tank (2nd stage) 10 mW x 19.2 mL x 6 mD
Dimension of oxic tank (2nd stage) 10 mW x 19.2 mL x 6 mD
Dimension of anoxic tank (3rd stage) 10 mW x 25.7 mL x 6 mD
Dimension of oxic tank (3rd stage) 10 mW x 25.7 mL x 6 mD
Diffuser of oixc tank Ultrafine bubble diffuser
Mixer of anoxic tank Top-entry agitator
(2) Design Calculation of Aeration Requirement
Oxygen for oxidation of organic substance 23,692 kg-O2/day
Oxygen for nitrification of NH4 42,036 kg-O2/day
Oxygen for endogenous respiration of MLSS 51,255 kg-O2/day
Oxygen for maintaining dissolved oxygen 1,683 kg-O2/day
Total actual oxygen requirement (AOR) 118,666 kg-O2/day
Standard oxygen requirement (SOR) 190,402 kg-O2/day
Oxygen transfer efficiency 32.2 %
Aeration requirement 1,473 m3/min
Blower Multi-stage centrifugal
Specification of blower 270 m3/min x 70 kPa x 420 kW
Number of blower 8 nos. (2 standby)

Preparatory Survey on the Sewage System Improvement Project for the City of Belgrade APPENDIX-I
Chapter 6 Facilities Planning of Veliko Selo Wastewater Treatment Plant
3
1.3 Carrier Added Activated Sludge Process (CAASP)
(1) Design Calculation of Bioreactor
Bioreactor Carrier added activated sludge process
Number of bioreactor tank 48 tanks
Design flow 448,700 m3/day
MLSS concentration 3,000 mg/l
Dissolved oxygen 3.0 mg/l
Lowest monthly sewage temperature 10 degree Celsius
HRT (hydraulic retention time) 8.0 hour
Solid concentration of return sludge 0.9 %
Return sludge ratio 50 %
Circulation ratio 80 %
Dimension of anaerobic tank 10 mW x 9.7 mL x 6 mD
Dimension of anoxic tank 10 mW x 22.5 mL x 6 mD
Dimension of oxic tank 10 mW x 19.5 mL x 6 mD
Inlet screen Fine screen
Diffuser of oixc tank Fine bubble diffuser
Mixer of anoxic tank Top-entry agitator
Circulation pump Air lift pump
Outlet screen Bar screen
(2) Design Calculation of Aeration Requirement
Oxygen for oxidation of organic substance 26,168 kg-O2/day
Oxygen for nitrification of NH4 48,803 kg-O2/day
Oxygen for endogenous respiration of MLSS 13,461 kg-O2/day
Oxygen for maintaining dissolved oxygen 3,051 kg-O2/day
Oxygen for carrier 7,507 kg-O2/day
Total actual oxygen requirement (AOR) 98,990 kg-O2/day
Standard oxygen requirement (SOR) 166,590 kg-O2/day
Oxygen transfer efficiency 16.4 %
Aeration requirement 2,531 m3/min
Aeration requirement for screen 236 m3/min
Total aeration requirement 2,766 m3/min
Blower Multi-stage centrifugal
Specification of blower 510 m3/min x 64 kPa x 720 kW
Number of blower 8 nos. (2 standby)

Preparatory Survey on the Sewage System Improvement Project for the City of Belgrade APPENDIX-I Chapter 6 Facilities Planning of Veliko Selo Wastewater Treatment Plant
4
2. Performance Analysis of Sewage Treatment Process
2.1 Wastewater Treatment Plant
The WWTPs of each process are listed together with the design capacities in Table 1 and Table 2,
respectively.
Table 1 Wastewater Treatment Plants of SFNDP
Code Prefecture Name Design capacity
S01 Hokkaido Fushikogawa WWTP 61,000 m3/day
S02 Hokkaido Toubu WWTP 160,000 m3/day
S03 Miyagi Hirosegawa WWTP 22,500 m3/day
S04 Chiba Nishiura WWTP 81,000 m3/day
S05 Fukui Tezutsu WWTP 40,925 m3/day
S06 Gifu Kakamigahara WWTP 214,414 m3/day
S07 Gifu Ogakishi WWTP 114,300 m3/day
S08 Gifu Tokishi WWTP 25,200 m3/day
S09 Aichi Yahagigawa WWTP 383,000 m3/day
S10 Aichi Kinuura toubu WWTP 51,500 m3/day
S11 Aichi Toyogawa WWTP 141,500 m3/day
S12 Aichi Gojogawa sagan WWTP 127,975 m3/day
S13 Aichi Nikkogawa jouryuu WWTP 117,250 m3/day
S14 Aichi Gojogawa ugan WWTP 66,800 m3/day
S15 Aichi Gamagorishi WWTP 46,100 m3/day
S16 Aichi Nanbu WWTP 32,000 m3/day
S17 Mie Nagashima WWTP 10,000 m3/day
S18 Mie Chuuou WWTP 15,000 m3/day
S19 Shiga Konan Chuubu WWTP 346,500 m3/day
S20 Shiga Kosai WWTP 75,000 m3/day
S21 Shiga Touhokubu WWTP 149,625 m3/day
S22 Shiga Takashima WWTP 25,200 m3/day
S23 Kyoto Rakusai WWTP 208,000 m3/day
S24 Kyoto Kisshoin WWTP 114,000 m3/day
S25 Kyoto Toba WWTP 805,000 m3/day
S26 Kyoto Ishida WWTP 149,900 m3/day
S27 Osaka Ryuge WWTP 138,000 m3/day
S28 Osaka Takatsuki WWTP 182,610 m3/day
S29 Osaka Harada WWTP 425,500 m3/day

Preparatory Survey on the Sewage System Improvement Project for the City of Belgrade APPENDIX-I
Chapter 6 Facilities Planning of Veliko Selo Wastewater Treatment Plant
5
Code Prefecture Name Design capacity
S30 Osaka Sanbo WWTP 120,200 m3/day
S31 Hyogo Mukogawa Karyuu WWTP 375,300 m3/day
S32 Wakayama Ito WWTP 34,000 m3/day
S33 Wakayama Naga WWTP 18,150 m3/day
S34 Shimane Toubu WWTP 81,000 m3/day
S35 Okayama Kojima WWTP 41,900 m3/day
S36 Okayama Mizushima WWTP 57,900 m3/day
S37 Okayama Tamashima WWTP 43,920 m3/day
S38 Okayama Sanyo WWTP 16,990 m3/day
S39 Hiroshima Takehara WWTP 1,880 m3/day
S40 Yamaguchi Sanin WWTP 63,400 m3/day
S41 Yamaguchi Yamaguchishi WWTP 53,080 m3/day
S42 Yamaguchi Iwakuni minami WWTP 11,500 m3/day
S43 Yamaguchi Sanyo WWTP 6.200 m3/day
S44 Tokushima Hokubu WWTP 38,200 m3/day
S45 Ehime Seibu WWTP 52,850 m3/day
S46 Ehime Hokubu WWTP 11,400 m3/day
S47 Ehime Hokubu WWTP 7,125 m3/day
S48 Kochi Takasu WWTP 28,260 m3/day
S49 Kochi Geji WWTP 78,800 m3/day
S50 Fukuoka Fukuma WWTP 2,100 m3/day
S51 Kumamoto Kumamoto hokubu WWTP 113,500 m3/day
Table 2 Wastewater Treatment Plants of A2O
Code Prefecture Name Capacity
A01 Hokkaido Abashiri WWTP 20,265 m3/day
A02 Miyagi Senshio WWTP 222,000 m3/day
A03 Ibaragi Kasumigaura WWTP 152,000 m3/day
A04 Ibaragi Yasato WWTP 6,480 m3/day
A05 Chiba Nanbu WWTP 261,000 m3/day
A06 Chiba Takase WWTP 102,900 m3/day
A07 Chiba Kisarazu WWTP 57,000 m3/day
A08 Chiba Matsugoshima WWTP 53,200 m3/day
A09 Tokyo Mimamitama WWTP 162,450 m3/day
A10 Tokyo Kitatama No.1 WWTP 260,700 m3/day
A11 Tokyo Tamagawa jouryuu WWTP 261,900 m3/day
Preparatory Survey on the Sewage System Improvement Project for the City of Belgrade APPENDIX-I Chapter 6 Facilities Planning of Veliko Selo Wastewater Treatment Plant
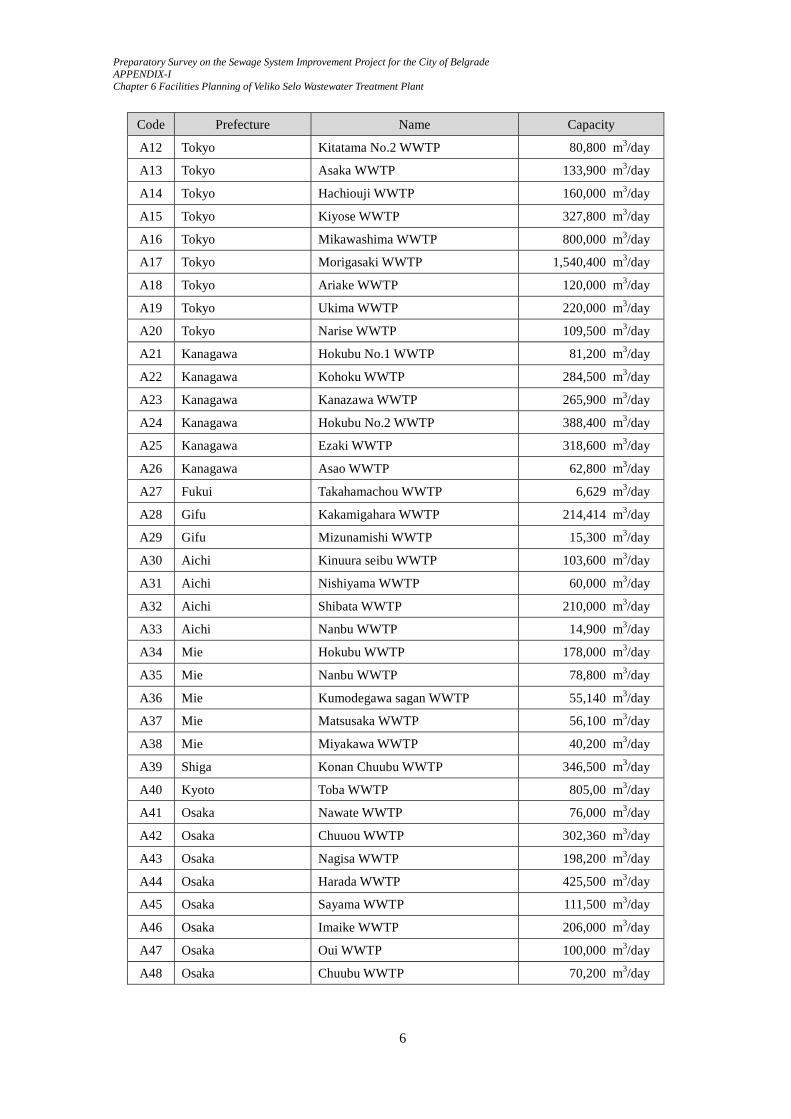
6
Code Prefecture Name Capacity
A12 Tokyo Kitatama No.2 WWTP 80,800 m3/day
A13 Tokyo Asaka WWTP 133,900 m3/day
A14 Tokyo Hachiouji WWTP 160,000 m3/day
A15 Tokyo Kiyose WWTP 327,800 m3/day
A16 Tokyo Mikawashima WWTP 800,000 m3/day
A17 Tokyo Morigasaki WWTP 1,540,400 m3/day
A18 Tokyo Ariake WWTP 120,000 m3/day
A19 Tokyo Ukima WWTP 220,000 m3/day
A20 Tokyo Narise WWTP 109,500 m3/day
A21 Kanagawa Hokubu No.1 WWTP 81,200 m3/day
A22 Kanagawa Kohoku WWTP 284,500 m3/day
A23 Kanagawa Kanazawa WWTP 265,900 m3/day
A24 Kanagawa Hokubu No.2 WWTP 388,400 m3/day
A25 Kanagawa Ezaki WWTP 318,600 m3/day
A26 Kanagawa Asao WWTP 62,800 m3/day
A27 Fukui Takahamachou WWTP 6,629 m3/day
A28 Gifu Kakamigahara WWTP 214,414 m3/day
A29 Gifu Mizunamishi WWTP 15,300 m3/day
A30 Aichi Kinuura seibu WWTP 103,600 m3/day
A31 Aichi Nishiyama WWTP 60,000 m3/day
A32 Aichi Shibata WWTP 210,000 m3/day
A33 Aichi Nanbu WWTP 14,900 m3/day
A34 Mie Hokubu WWTP 178,000 m3/day
A35 Mie Nanbu WWTP 78,800 m3/day
A36 Mie Kumodegawa sagan WWTP 55,140 m3/day
A37 Mie Matsusaka WWTP 56,100 m3/day
A38 Mie Miyakawa WWTP 40,200 m3/day
A39 Shiga Konan Chuubu WWTP 346,500 m3/day
A40 Kyoto Toba WWTP 805,00 m3/day
A41 Osaka Nawate WWTP 76,000 m3/day
A42 Osaka Chuuou WWTP 302,360 m3/day
A43 Osaka Nagisa WWTP 198,200 m3/day
A44 Osaka Harada WWTP 425,500 m3/day
A45 Osaka Sayama WWTP 111,500 m3/day
A46 Osaka Imaike WWTP 206,000 m3/day
A47 Osaka Oui WWTP 100,000 m3/day
A48 Osaka Chuubu WWTP 70,200 m3/day

Preparatory Survey on the Sewage System Improvement Project for the City of Belgrade APPENDIX-I
Chapter 6 Facilities Planning of Veliko Selo Wastewater Treatment Plant
7
Code Prefecture Name Capacity
A49 Osaka Nanbu WWTP 38,100 m3/day
A50 Osaka Senboku WWTP 145,900 m3/day
A51 Hyogo Tamazu WWTP 122,750 m3/day
A52 Nara Yamatogawa No.1 WWTP 370,200 m3/day
A53 Nara Yamatogawa No.2 WWTP 174,200 m3/day
A54 Nara Udagawa WWTP 12,100 m3/day
A55 Okayama Yoshiigawa WWTP 7,000 m3/day
A56 Tokushima Yoshinogawa WWTP 11,000 m3/day
A57 Fukuoka Mikasagawa WWTP 283,600 m3/day
A58 Fukuoka Tataragawa WWTP 67,100 m3/day
A59 Fukuoka Fukudou WWTP 27,000 m3/day
A60 Fukuoka Yabegawa WWTP 19,200 m3/day
A61 Fukuoka Onogawa chuuryuu WWTP 37,600 m3/day
A62 Fukuoka Toubu WWTP 195,300 m3/day
A63 Fukuoka Seibu WWTP 296,800 m3/day
2.2 Annual Average Qualities
Annual average values of influent and effluent qualities of the WWTPs are summarized in Table
3 and Table 4, respectively.
Table 3 Annual Average Qualities of SFNDP
Code BOD5 [mg/l] CODMn [mg/l] SS [mg/l] TN [mg/l] TP [mg/l]
In Out In Out In Out In Out In Out
S01 170 3.4 NA NA 140 ND 26.0 7.8 2.8 0.2
S02 270 3.0 NA NA 200 ND 36.0 8.4 8.4 3.0
S03 210 1.1 130 5.3 220 ND 37.0 1.8 4.7 1.8
S04 249 1.1 150 5.8 378 2.7 43.9 7.2 8.8 0.5
S05 193 2.7 142 8.5 150 2.5 29.1 4.8 5.8 0.5
S06 140 ND 92 5.4 180 ND 32.0 6.4 3.9 0.8
S07 82 1.8 60.4 5.4 121 1.9 20.1 6.7 3.0 1.0
S08 143 5.4 88 9.5 147 4.3 23.4 6.2 3.1 1.0
S09 190 ND 95 6.8 180 1.5 28.0 6.3 4.4 0.3
S10 270 2.8 140 9.5 200 3.1 50.0 6.1 10.0 0.2
S11 230 ND 110 7.9 170 1.1 37.0 6.8 5.3 0.3
S12 190 1.6 110 7.4 200 ND 38.0 6.5 4.1 0.3
S13 170 ND 100 7.1 160 2.1 41.0 6.7 4.5 ND

Preparatory Survey on the Sewage System Improvement Project for the City of Belgrade APPENDIX-I Chapter 6 Facilities Planning of Veliko Selo Wastewater Treatment Plant
8
S14 320 1.8 160 7.7 290 2.7 44.0 6.2 5.3 0.2
S15 166 1.1 85 7.8 77.0 1.1 42.5 7.6 4.2 0.2
S16 165 12.6 99.2 8.1 108 2.4 42.0 9.0 4.5 0.2
S17 130 3.0 79 8.0 134 3.0 36.0 5.7 3.8 0.4
S18 132 2.4 111.7 8.8 168 3.9 27.5 2.3 3.6 0.6
S19 170 0.9 88.9 5.2 179 0.6 29.9 5.5 3.2 0.1
S20 150 1.0 85.0 5.7 147 ND 25.6 3.9 3.0 0.1
S21 130 0.6 77.3 4.8 146 0.6 26.8 2.2 2.6 0.1
S22 160 1.0 77.5 5.7 118 ND 26.1 3.6 2.6 0.0
S23 101 1.9 61.6 9.5 86 ND 19.2 10.0 2.2 1.2
S24 89 3.9 54 6.6 73 2.0 16.0 7.8 1.6 0.6
S25 115 2.9 67.5 6.5 129 1.7 16.5 7.4 2.1 0.4
S26 190 3.7 94 8.0 214 5.0 21.0 8.5 2.9 0.9
S27 100 1.0 55 6.2 55 1.0 25.0 5.9 2.4 0.1
S28 361 5.0 146 8.0 280 2.0 30.0 8.4 6.5 1.0
S29 182 2.7 94 11.0 205 2.0 28.0 12.0 3.7 0.4
S30 123 2.7 80 16.9 92 2.0 23.0 6.7 3.1 0.4
S31 110 2.0 54 6.6 130 1.5 22.0 6.8 3.1 0.5
S32 143 1.9 82.5 7.3 138 1.1 30.5 4.2 3.0 0.5
S33 67 1.2 42 4.6 22 1.0 26.1 3.1 2.1 0.3
S34 154 1.5 100 8.6 203 1.2 33.1 6.2 3.8 0.2
S35 136 3.0 57 7.2 102 1.0 36.0 7.4 3.3 0.2
S36 145 2.6 56.8 8.3 62 2.0 30.2 6.0 2.9 0.2
S37 229 3.5 102 8.5 151 2.2 49.6 5.6 4.7 0.4
S38 234 0.5 132 6.6 232 ND 41.0 3.5 5.4 0.5
S39 102 5.2 73 7.5 84 5.0 32.5 4.0 3.3 0.3
S40 200 4.3 120 11.5 180 3.0 56.5 16.0 5.6 1.0
S41 133 3.0 83.6 9.3 115 1.6 25.0 17.0 2.5 1.2
S42 170 3.0 168 10.0 192 4.0 23.0 4.0 4.0 1.0
S43 115 2.1 64 6.5 113 1.9 34.0 6.0 3.3 0.9
S44 150 3.4 65.3 5.7 141 1.9 20.0 5.3 3.6 0.8
S45 244 1.8 184.2 8.8 247 1.0 57.8 12.0 6.4 0.6
S46 160 1.0 110 8.0 150 1.0 36.6 3.5 4.1 0.2
S47 207 5.1 101.2 8.9 175 4.4 43.5 11.9 4.1 1.9
S48 204 1.1 111.8 7.9 259 1.5 26.0 5.8 3.6 0.7
S49 129 3.6 63.9 7.1 108 3.3 21.9 7.4 2.6 0.7
S50 208 0.6 120 6.3 108 3.3 21.9 7.4 2.6 0.7
S51 133 4.8 74 7.5 169 2.6 30.0 18.0 3.0 0.8

Preparatory Survey on the Sewage System Improvement Project for the City of Belgrade APPENDIX-I
Chapter 6 Facilities Planning of Veliko Selo Wastewater Treatment Plant
9
Table 4 Annual Average Qualities of A2O
Code BOD5 [mg/l] CODMn [mg/l] SS [mg/l] TN [mg/l] TP [mg/l]
In Out In Out In Out In Out In Out
A01 310 6.0 170 17.0 230 6.0 42.0 23.0 4.8 2.7
A02 180 1.9 130 11.0 190 2.0 46.0 15.0 5.6 2.0
A03 153 0.7 95.1 6.1 173 NA 31.7 5.3 3.3 0.1
A04 90 0.9 58.2 6.0 83 2.0 20.0 8.2 2.7 0.2
A05 166 0.9 107 8.3 165 0.8 39.0 8.0 3.9 1.0
A06 235 1.3 133 7.2 213 1.8 39.4 6.8 5.8 0.4
A07 110 1.5 56.2 6.2 61 1.5 21.2 6.8 2.3 0.1
A08 230 3.2 117 10.1 144 2.1 40.7 10.4 7.7 0.5
A09 185 1.0 89 9.0 145 1.0 34.0 11.0 3.4 0.9
A10 160 1.0 90 8.0 140 1.0 30.0 10.0 3.5 0.6
A11 210 2.0 97 8.0 150 2.0 23.0 0.4 3.3 1.0
A12 140 2.0 85 8.0 120 2.0 30.0 0.4 3.0 0.4
A13 230 2.0 110 9.0 190 2.0 31.0 13.0 3.9 0.7
A14 260 2.0 110 9.0 250 1.0 29.0 10.0 3.9 1.1
A15 180 1.0 100 8.0 150 1.0 33.0 9.3 3.5 0.3
A16 183 2.5 82 9.5 122 2.0 31.2 13.4 3.4 0.4
A17 115 4.5 74 9.5 105 2.5 28.6 13.5 3.0 1.5
A18 110 ND 92 9.0 110 ND 33.8 10.4 4.0 0.3
A19 95 2.0 66 9.0 57 1.0 25.0 10.6 2.8 0.1
A20 200 1.8 120 7.6 200 2.2 38.3 11.7 4.4 0.8
A21 121 3.5 63 7.3 97 1.0 18.2 6.9 2.5 0.6
A22 160 2.8 72 7.0 129 2.0 25.2 7.0 3.7 0.5
A23 145 3.7 84.2 9.3 130 3.0 27.1 9.7 4.1 1.9
A24 114 4.0 67.2 11.0 110 3.0 25.1 15.2 4.2 3.3
A25 225 4.9 90 8.7 175 3.5 30.0 9.6 7.4 1.7
A26 220 4.5 110 8.9 190 3.0 35.0 8.2 3.9 1.0
A27 173 1.2 29.5 6.3 103 0.2 40.0 3.3 2.8 0.7
A28 140 ND 92 5.4 180 ND 32.0 6.4 3.9 0.8
A29 190 17.1 104.4 9.3 266 4.0 32.3 10.5 6.9 0.5
A30 270 2.5 120 7.8 170 2.5 42.0 6.8 5.1 0.3
A31 130 1.7 75 6.0 133 ND 31.8 7.1 3.0 0.2
A32 94 2.6 64 11.0 109 3.0 23.9 10.7 2.9 2.0
A33 191 5.8 70.6 7.4 131 3.0 31.6 13.7 2.8 0.3
A34 170 1.7 96 7.0 180 2.0 27.0 6.9 3.2 0.5

Preparatory Survey on the Sewage System Improvement Project for the City of Belgrade APPENDIX-I Chapter 6 Facilities Planning of Veliko Selo Wastewater Treatment Plant
10
Code BOD5 [mg/l] CODMn [mg/l] SS [mg/l] TN [mg/l] TP [mg/l]
In Out In Out In Out In Out In Out
A35 127 2.2 79 7.6 108 2.0 29.0 4.8 3.2 0.4
A36 168 1.3 109.7 7.2 203 ND 31.8 7.5 4.4 0.4
A37 170 0.8 98 6.2 150 ND 33.0 7.6 3.7 ND
A38 130 0.8 110 6.7 190 ND 36.0 6.7 4.1 0.1
A39 170 0.9 88.9 5.2 179 0.6 29.9 5.5 3.2 0.1
A40 115 2.9 68 6.5 129 1.7 16.5 7.4 2.1 0.4
A41 170 0.9 110 9.0 158 ND 36.0 8.7 4.0 0.3
A42 150 ND 75 6.9 166 ND 25.0 7.1 4.9 0.8
A43 160 1.0 97 6.7 178 1.0 30.0 7.3 3.5 0.6
A44 182 2.7 94 11.0 205 2.0 28.0 12.0 3.7 1.1
A45 175 1.4 110 8.2 183 1.5 33.5 10.4 3.8 0.6
A46 170 2.7 130 11.5 179 1.5 34.0 15.4 3.8 0.3
A47 190 1.1 120 8.0 200 ND 38.0 7.4 4.8 0.3
A48 130 1.0 100 10.0 139 1.0 27.0 7.9 4.0 0.2
A49 230 2.1 95 7.0 198 ND 29.0 5.9 3.3 0.3
A50 235 2.9 155 10.0 220 2.0 37.0 14.3 4.2 0.4
A51 190 1.5 93 8.2 150 ND 31.0 16.0 3.4 0.5
A52 178 4.7 43.2 8.1 186 7.0 34.4 7.1 4.3 0.8
A53 258 2.5 87.2 8.6 150 1.0 33.5 7.8 5.6 0.7
A54 141 0.6 65.4 5.6 147 ND 29.1 8.0 2.8 ND
A55 280 1.5 140 5.6 190 ND 40.0 4.7 4.4 0.1
A56 69 2.8 50.9 8.6 75 2.0 32.2 7.0 3.4 0.3
A57 215 1.9 99 7.7 175 2.0 37.5 9.5 4.6 0.8
A58 250 0.4 140 7.4 250 0.0 38.0 9.0 4.6 0.4
A59 210 1.0 100 6.3 140 ND 36.0 6.2 3.4 0.6
A60 210 0.6 100 4.8 170 ND 34.0 8.1 3.1 0.6
A61 306 3.0 125 9.7 290 1.7 47.0 5.1 3.9 1.0
A62 180 3.0 120 11.0 190 3.0 38.4 15.4 5.6 0.3
A63 190 4.6 140 11.0 200 2.0 37.0 17.5 4.9 0.6

Preparatory Survey on the Sewage System Improvement Project for the City of Belgrade APPENDIX-I
Chapter 6 Facilities Planning of Veliko Selo Wastewater Treatment Plant
11
3. Design Calculation of Veliko Selo WWTP
3.1 Basics for Planning
(1) Design Flow
Year 2015 2021 2031
Daily average flow 394,000 m3/day 409,000 m3/day 448,700 m3/day
Daily maximum flow 464,000 m3/day 474,000m3/day 521,200 m3/day
Hourly maximum flow 696,000m3/day 717,100 m3/day 788,800 m3/day
Wet weather flow 1,209,600m3/day 1,252,800m3/day 1,341,100 m3/day
(2) Design Water Quality
Item Influent characteristic Effluent standard
BOD5 192 mg/l 25 mg/l
CODCr 385 mg/l 125 mg/l
SS 224 mg/l 35 mg/l
T-nitrogen 35 mg/l 10 mg/l
T-phosphorus 8 mg/l 1 mg/l
(3) Design Water Temperature
Temperature
Maximum 24 degree Celsius
Average 17 degree Celsius
Minimum 10 degree Celsius
3.2 Design Calculation of Sewage Treatment Facilities
(1) Lift Pumping Station
Lift pump Submersible pump (dry installation)
Design flow in rainy weather day 1,341,800 m3/day
Design flow in dry weather day 788,800 m3/day
Specification of lift pump 94 m3/min x 18 mH x 400 kW
Number of pump 12 nos. (2 standby)
Coarse screen Mechanical screen
Specification of coarse screen Channel: 4.5 m / Opening: 100 mm

Preparatory Survey on the Sewage System Improvement Project for the City of Belgrade APPENDIX-I Chapter 6 Facilities Planning of Veliko Selo Wastewater Treatment Plant
12
Number of screen 3 nos.
(2) Pretreatment Facility
Grit chamber Aerated grit chamber
Design flow in rainy weather day 1,341,800 m3/day
Design flow in dry weather day 788,800 m3/day
Hydraulic overflow rate (rainy) 3,600 m3/m2/day
Hydraulic overflow rate (dry) 1,800 m3/m2/day
Dimension of grit chamber 3.5 mW x 18 mL
Number of grit chamber 6 channels
Fine screen Mechanical screen
Specification of fine screen Channel: 2.5m / Opening: 20mm
Number of screen 6 nos.
(3) Primary Settling Tank
Primary settling tank Circular settling tank
Daily average flow 448,700 m3/day
Daily maximum flow 521,200 m3/day
Hourly maximum flow 788,800 m3/day
Hydraulic surface loading 50 m3/m2/day
Weir overflow rate 250 m3/m/day
Dimension of primary settling tank Diameter 34 m x 3.5 mD
Number of primary settling tank 12 tanks
Sludge collector Circular sludge scraper
Raw sludge production 68,782 DS-kg/day
Solid concentration of raw sludge 2.0 %
(4) Bioreactor
Bioreactor Step feeding nitrification denitrification process
Number of bioreactor tank 48 tanks
Design flow 448,700 m3/day
MLSS concentration 3,000 mg/l
Dissolved oxygen 2.5 mg/l
Lowest monthly sewage temperature 10 degree Celsius
ASRT (aerobic solid retention time) 10.7 day
HRT (hydraulic retention time) 17.7 hour

Preparatory Survey on the Sewage System Improvement Project for the City of Belgrade APPENDIX-I
Chapter 6 Facilities Planning of Veliko Selo Wastewater Treatment Plant
13
Solid concentration of return sludge 0.9 %
Return sludge ratio 50 %
Circulation ratio 0 %
Dimension of anoxic tank (1st stage) 10 mW x 13.7 mL x 6 mD
Dimension of oxic tank (1st stage) 10 mW x 13.7 mL x 6 mD
Dimension of anoxic tank (2nd stage) 10 mW x 19.2 mL x 6 mD
Dimension of oxic tank (2nd stage) 10 mW x 19.2 mL x 6 mD
Dimension of anoxic tank (3rd stage) 10 mW x 25.7 mL x 6 mD
Dimension of oxic tank (3rd stage) 10 mW x 25.7 mL x 6 mD
Diffuser of oixc tank Ultrafine bubble diffuser
Mixer of anoxic tank Top-entry agitator
(5) Secondary Settling Tank
Secondary settling tank Circular settling tank
Daily average flow 448,700 m3/day
Daily maximum flow 521,200 m3/day
Hourly maximum flow 788,800 m3/day
Hydraulic surface loading 20 m3/m2/day
Weir overflow rate 150 m3/m/day
Dimension of primary settling tank Diameter 49 m x 4.0 mD
Number of primary settling tank 12 tanks
Sludge collector Circular sludge scraper
Excess sludge production 49,069 DS-kg/day
Solid concentration of excess sludge 0.9 %
Return sludge pump Submersible pump (dry installation)
Specification of lift pump 16.5 m3/min x 8 mH x 37 kW
Number of pump 24 nos.
(6) Filtration
Filtration Disc filter
Design flow 788,800 m3/day
Filtration speed 500 m/day
Filtration area 114 m2
Number of disc filter 16 nos. (2 standby)

Preparatory Survey on the Sewage System Improvement Project for the City of Belgrade APPENDIX-I Chapter 6 Facilities Planning of Veliko Selo Wastewater Treatment Plant
14
3.3 Design Calculation of Aeration Requirement
Oxygen for oxidation of organic substance 23,692 kg-O2/day
Oxygen for nitrification of NH4 42,036 kg-O2/day
Oxygen for endogenous respiration of MLSS 51,255 kg-O2/day
Oxygen for maintaining dissolved oxygen 1,683 kg-O2/day
Total actual oxygen requirement (AOR) 118,666 kg-O2/day
Standard oxygen requirement (SOR) 190,402 kg-O2/day
Oxygen transfer efficiency 32.2 %
Aeration requirement 1,473 m3/min
Blower Multi-stage centrifugal
Specification of blower 270 m3/min x 70 kPa x 420 kW
Number of blower 8 nos. (2 standby)
3.4 Design Calculation of Sludge Treatment Facilities
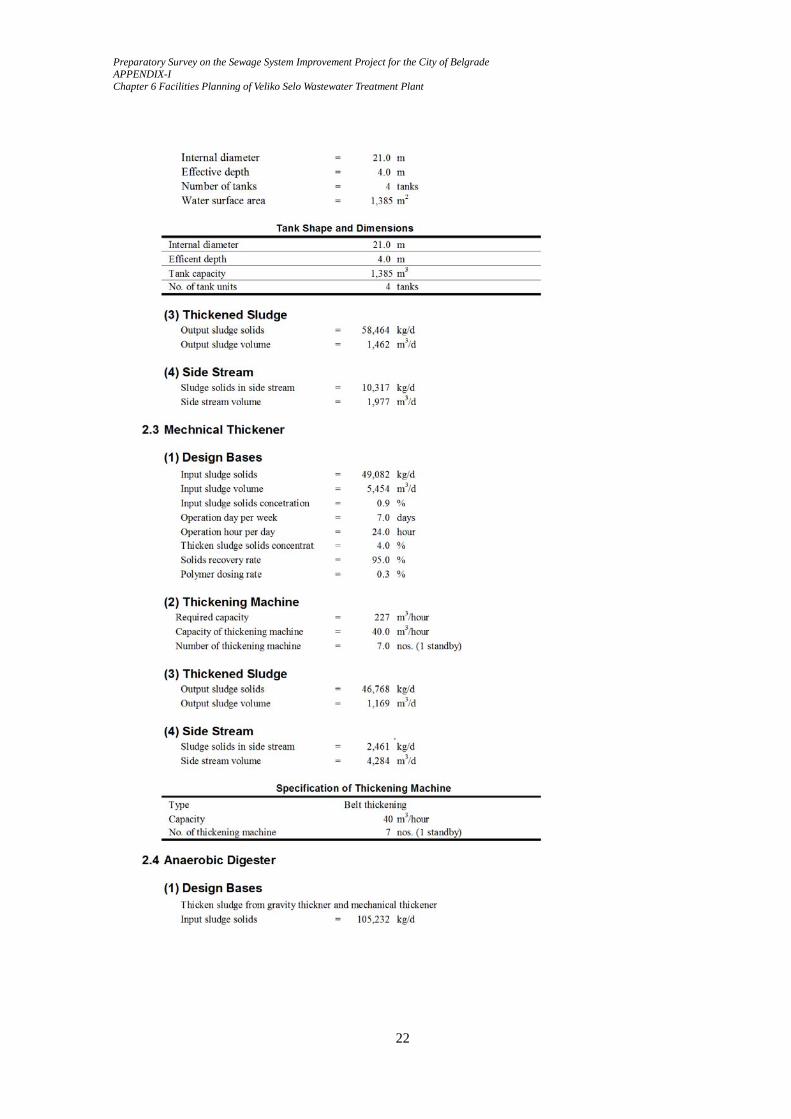
(1) Gravity Thickener
Gravity thickener Gravity sludge thickener
Solid content of raw sludge 68,782 kg-DS/day
Volume of raw sludge 3,439 m3/day
Solid concentration of raw sludge 2.0 %
Solid surface loading 50 kg/m2/day
Solid recovery rate 85 %
Dimension of primary settling tank Diameter 21 m x 4.0 mD
Number of primary settling tank 4 tanks
Sludge collector Circular sludge scraper
Solid content of thickened sludge 58,464 kg-DS/day
Volume of thickened sludge 1,462 m3/day
Solid concentration of excess sludge 4.0 %
(2) Mechanical Thickener
Mechanical thickener Belt thickener
Solid content of excess sludge 49,069 kg-DS/day
Volume of excess sludge 5,452 m3/day
Solid concentration of excess sludge 0.9 %
Solid recovery rate 95 %
Polymer dosing rate 0.3 %

Preparatory Survey on the Sewage System Improvement Project for the City of Belgrade APPENDIX-I
Chapter 6 Facilities Planning of Veliko Selo Wastewater Treatment Plant
15
Operation hour 24 hour
Specification of mechanical thickener Capacity: 40 m3/hour
Number of mechanical thickener 7 nos. (1 standby)
Solid content of thickened sludge 46,755 kg-DS/day
Volume of thickened sludge 1,169 m3/day
Solid concentration of thickened sludge 4.0 %
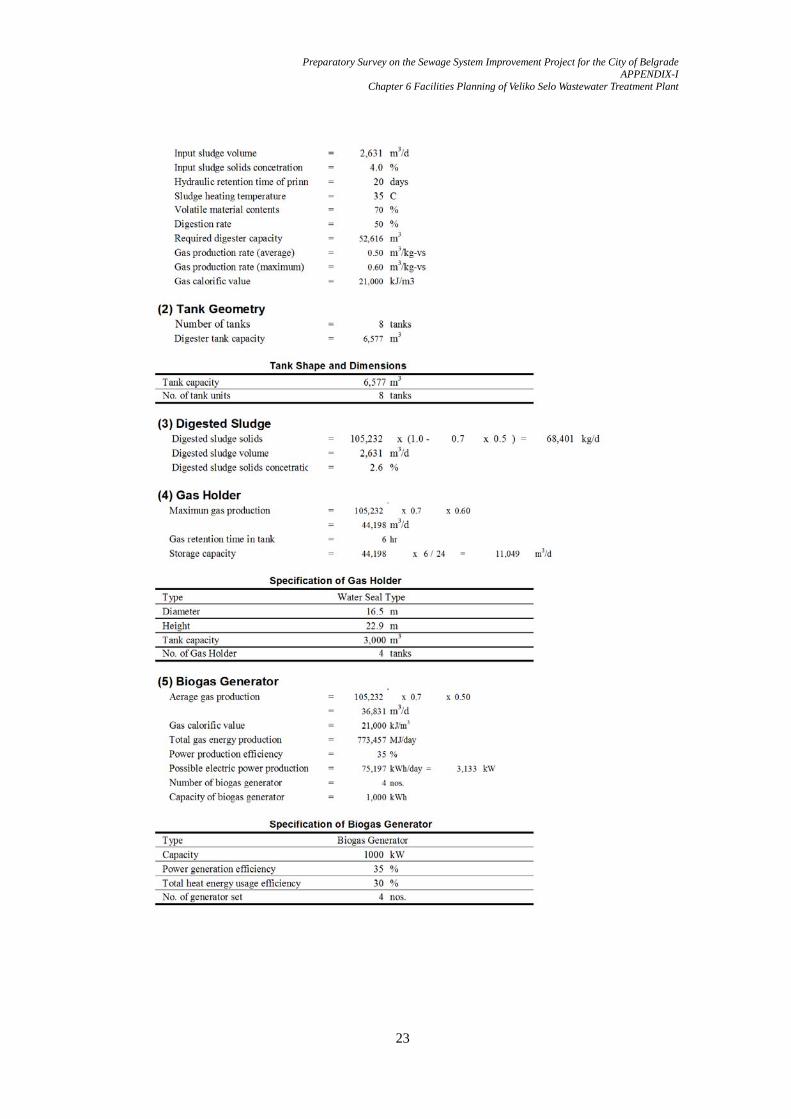
(3) Anaerobic Digestion
Anaerobic digestion Heated sludge digester
Solid content of thickened sludge 105,219 kg-DS/day
Volume of thickened sludge 2,630 m3/day
Solid concentration of thickened sludge 4.0 %
HRT (hydraulic retention time) 20 day
Sludge heating temperature 35 degree Celsius
Volatile total solid 70 %
Digestion rate 50 %
Volume of sludge digester 6,600 m3
Number of sludge digester 8 tanks
Digester mixer Top-entry agitator
Gas calorific value 21,000 kJ/m3
Gas production rate 0.50 m3/kg
Volume of gas holder 3,000 m3
Number of gas holder 4 nos.
Cogeneration system Combined heat and power system
Specification of cogeneration system 1,000 kVA
Number of mechanical thickener 4 nos.
Solid content of digested sludge 68,393 kg-DS/day
Volume of digested sludge 2,630 m3/day
Solid concentration of digested sludge 2.6 %
(4) Mechanical Dewatering
Mechanical dewatering Screw press dewatering
Solid content of digested sludge 68,393 kg-DS/day
Volume of digested sludge 2,630 m3/day
Solid concentration of digested sludge 2.6 %
Solid recovery rate 95 %
Polymer dosing rate 1.5 %

Preparatory Survey on the Sewage System Improvement Project for the City of Belgrade APPENDIX-I Chapter 6 Facilities Planning of Veliko Selo Wastewater Treatment Plant
16
Operation hour 24 hour
Specification of mechanical dewatering Diameter: 1,000 mm / 836 kg-DS/hour
Number of mechanical thickener 5 nos. (1 standby)
Solid content of sludge cake 65,948 kg-DS/day
Volume of sludge cake 314 m3/day
Moisture content of sludge cake 79 %

Preparatory Survey on the Sewage System Improvement Project for the City of Belgrade APPENDIX-I
Chapter 6 Facilities Planning of Veliko Selo Wastewater Treatment Plant
17
3.5 Calculations

Preparatory Survey on the Sewage System Improvement Project for the City of Belgrade APPENDIX-I Chapter 6 Facilities Planning of Veliko Selo Wastewater Treatment Plant
18

Preparatory Survey on the Sewage System Improvement Project for the City of Belgrade APPENDIX-I
Chapter 6 Facilities Planning of Veliko Selo Wastewater Treatment Plant
19

Preparatory Survey on the Sewage System Improvement Project for the City of Belgrade APPENDIX-I Chapter 6 Facilities Planning of Veliko Selo Wastewater Treatment Plant
20

Preparatory Survey on the Sewage System Improvement Project for the City of Belgrade APPENDIX-I
Chapter 6 Facilities Planning of Veliko Selo Wastewater Treatment Plant
21
Preparatory Survey on the Sewage System Improvement Project for the City of Belgrade APPENDIX-I Chapter 6 Facilities Planning of Veliko Selo Wastewater Treatment Plant
22
Preparatory Survey on the Sewage System Improvement Project for the City of Belgrade APPENDIX-I
Chapter 6 Facilities Planning of Veliko Selo Wastewater Treatment Plant
23

Preparatory Survey on the Sewage System Improvement Project for the City of Belgrade APPENDIX-I Chapter 6 Facilities Planning of Veliko Selo Wastewater Treatment Plant
24
Preparatory Survey on the Sewage System Improvement Project for the City of Belgrade APPENDIX-I
Chapter 6 Facilities Planning of Veliko Selo Wastewater Treatment Plant
25
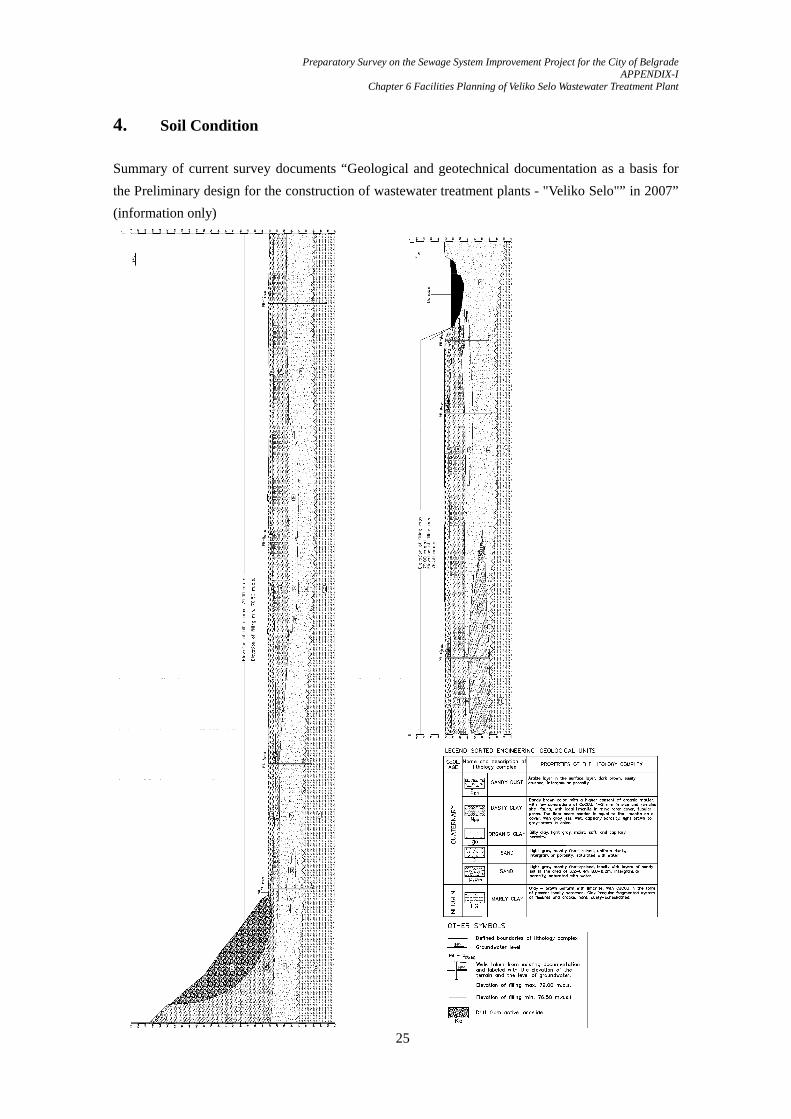
4. Soil Condition
Summary of current survey documents “Geological and geotechnical documentation as a basis for
the Preliminary design for the construction of wastewater treatment plants - "Veliko Selo"” in 2007”
(information only)

Preparatory Survey on the Sewage System Improvement Project for the City of Belgrade APPENDIX-I Chapter 6 Facilities Planning of Veliko Selo Wastewater Treatment Plant
26
Silty sand) (gph), the highly humidified near to surface part of the terrain (arable layer), where the
participation of the roots of and venation of plants in the different stages of decomposition, is intense.
The determined thickness of the layer was from 0.8 to 2.1 m. This layer is of heterogeneous
lithological composition, with irregular ratio of clay, dust and sand fractions (in the zone closer to
Dunavac is dominant the share fine sand fraction). Dust is easily crushed, of pseudo fracture porosity,
with the local participation of residual small, tubular, porosity, and in the part where the share of the
sandy fraction is dominant, the intergranular type of porosity is represented.
Newly performed laboratory tests
Bulk density
naturally moist ................................................................. g = 20.6 kN/m3
dry............................................................................... gd = 16.3 kN / m3
Shearing strength
angle of internal friction ............................................................ f = 24
cohesion ............................................................................... c .. = 7kN/m2
Static penetration test ............................................... Ckd = 2 - 2.5 Mpa
Silty clay (GPP), of heterogeneous lithological composition, with irregular and uneven participation
and clay and silty components, with locally higher content of sandy fraction and muddy clay in the
form of irregular interlayers or layers whose presence is significantly in the area of the old still
waters and swamps. Clay is determined directly under a layer of silty sand (dust) (gph) at a depth of
0.8 to 2.1 m, with determined thickness of 1.8 to 4.8 set m. Clay is of massive structure, with local,
poorly-defined, layering, in the zone of oscilating of groundwater of significant pseudo fracture
porosity along which it crumbles easily under your fingers into small monoliths, mostly middle
plastic, easy to difficult to squash, unconsolidated to poorly consolidated, more compressible, of
relatively uniform resistance characteristics.
By geomechanical laboratory testing were determined the following values of physical and
mechanical sediment parameters of this facies:
Previously performed laboratory tests
Bulk weight
naturally moist ......................................................... g = 19.0 to 19.5 kN/m3
dry ........................................................................ gd = 13.0 to 15.6 kN/m3
Shear strength
angle of internal friction ......................................................... f=18-24
cohesion ......................................................................... c= 12 - 18kN/m2
Oedometer compressibility test
compressibility modulus for the specified range of load
• naturally moist
Ms (100-200) = 4 000-7 000kN/m2

Preparatory Survey on the Sewage System Improvement Project for the City of Belgrade APPENDIX-I
Chapter 6 Facilities Planning of Veliko Selo Wastewater Treatment Plant
27
• underwater
Ms (100-200) = 3 000-5 500kN/m2
Filtration coefficient ................................................ kf=10-4-10-6cm/sec
The newly performed laboratory tests
Bulk weight
naturally moist ......................................................... g = 15.1 to 16.6 kN/m3
dry ......................................................................... gd = 12.4 to 13, 4kN/m3
Shearing strength
angle of internal friction ............................................................ f= 18-19
cohesion ............................................................................. c = 10kN/m2
Filtration coefficient ................................................ kf= 10-6-10-7cm/sec
Dynamic penetration test
Number of strokes ....................................................................... N = 5-14
Static penetration tests ............................................ CKD = 0,5- 7 MPa;
Riverbed facies (ak)
Riverbed facies (ak) is represented by close-grained sand to silty sand (pp), close-grained sand to
medium-grained (p) and gravel sand (Psh).
Close-grained to silty sand (pp), build the highest parts of trough facies, immediately below the flood
facies. Sand is mostly poorly granulated, locally inconsistently mud silted (pm), unbound,
intergranulary porous, of gray-blue color, constantly saturated with water.
By geomechanical laboratory testing the following values of physical and mechanical sediment
parameters of this facies were determined:
Previously performed laboratory tests
Bulk density
naturally moist ......................................................... g = 18,5 -19,7 kN/m3
dry ........................................................................ gd = 13,2 -15,0 kN/m3
Shear strength
angle of internal friction ............................................................ f= 18-22
cohesion .............................................................................. c = 0-5kN/m2
Oedometer compressibility test
compressibility modules for the specified range of load
• naturally moist
Ms (100-200) = 5 500-7 000kN/m2
Filtration coefficient
kf = 10-3cm/sec

Preparatory Survey on the Sewage System Improvement Project for the City of Belgrade APPENDIX-I Chapter 6 Facilities Planning of Veliko Selo Wastewater Treatment Plant
28
The newly performed laboratory tests
Bulk weight
naturally moist ......................................................... g = 15,1 – 16,6 kN/m3
dry ......................................................................... gd = 12,4 - 13, 4kN/m3
Shear strength
angle of internal friction ............................................................ f=18-19
cohesion ............................................................................. c = 10kN/m2
Oedometar compressibility test
compressibility modules for the specified range of load
• naturally moist
Ms(100-200) = 5 500-7 000kN/m2
Filtration coefficient ................................................. kf= 10-5-10-6cm/sec
Dynamic penetration test
Number of strokes ...................................................................... N = 12-14
Static penetration test ............................................... Ckd = 1,5-3MPa
Note: for the needs of higher levels of design (main construction project) is necessary to conduct
vulnerability assessment of this layer to suffosion and liquefaction.
Sand (p), close to medium grained, with depth the participation of coarse grained fractions is
increasing. The sand is poorly clayed (up to 5% clay), sharp under fingers, of intergranular porosity,
loose, well-compacted, more water permeable, permanently saturated with water.
By geomechanical laboratory testing the following values of physical and mechanical sediment
parameters of this facies are determined:
Previously performed laboratory tests
Bulk weight
naturally moist ......................................................... g = 18,7 to 19,7 kN/m3
Shear strength
angle of internal friction ............................................................ f= 26-30
cohesion
c = 0 -10kN/m2
Oedometer compressibility test
compressibility modules for the specified range of load
• naturally moist
Ms(100-200) = 8 000-12 000kN/m2
Filtration coefficient
kf = 10-2cm/sec

Preparatory Survey on the Sewage System Improvement Project for the City of Belgrade APPENDIX-I
Chapter 6 Facilities Planning of Veliko Selo Wastewater Treatment Plant
29
The newly performed laboratory tests
Bulk weight
naturally moist ......................................................... g = 15,1 to 16,6 kN/m3
dry ......................................................................... gd = 12,4 to 13, 4kN/m3
Shear strength
angle of internal friction ............................................................ f= 18-19
cohesion ............................................................................. c = 10kN/m2
Oedometer compressibility test
compressibility modules for the specified range of load
• naturally moist
Ms(100-200) = 5 500-7 000kN/m2
Filtration coefficient ................................................. kf= 10-2-10-6cm/sec
Dynamic penetration test
Number of strokes ...................................................................... N = 12-28
Static penetration tests ............................................... Ckd = 3-11MPa
Gravelly sand (psh), builds the lowest parts of the alluvial sediments, as determined in previous
research in the immediate surroundings of the investigated space, while in the latest research this
layer was not determined. The sand is medium grained to coarse, well granulated, with uneven and
irregular participation of gravel components (participation of gravel component ranges up to 65%).
Gravel is well rounded, up to 2 cm (rarely up to 5 cm), of heterogeneous petrographic composition
mainly of limestone. The soil is unbouned, more water permeable, and is suitable as a building
material.
By geomechanical laboratory testing the following values of physical and mechanical sediment
parameters of this facies were determined:
Previously performed laboratory tests
Bulk weight
naturally moist ......................................................... g = 19,5 to 21,0 kN/m3
Shear strength
angle of internal friction ............................................................ f= 28-33
cohesion ................................................................................ c = 0kN/m2
Oedmeter compressibility test
compressibility module for the specified range of load
• naturally moist
Ms(100-200) = 10 000-18 000kN/m2
Filtration coefficient
kf = 10-2cm/sec

Preparatory Survey on the Sewage System Improvement Project for the City of Belgrade APPENDIX-I Chapter 6 Facilities Planning of Veliko Selo Wastewater Treatment Plant
30
Tertiary age sediments
Tertiary age sediments build the geological terrain in the area designated for the construction of
wastewater treatment plant – Veliko selo and they are presented by marl-clay sediments, which are
characterized by heterogeneous composition and irregular and frequent changes of lithological
members in horizontal and vertical directions. The newly performed tests in exploratory holes
B-and-B, as well as the static penetration tests confirmed the presence of marl clay at a depth of.....
m.
Marly clay (LG), determined on the depth of 9.5 to 13.9 m, intensive physical-chemically and
mechanically modified in near to surface part of the layer ("weathering crust"), lowered values of
shear strength parameters. In this part of the layer fissure-crack system is presented, along which the
CaCO3 powder is precipitated in the form of accumulation, locally hardened due to groundwater
circulation. Along this system is the extensively precipitation of Fe and Mn in the form of spots
and films, and in the zone of significant limonitization in the form of small oolites. Determined
thickness of the zone change is up to 2m. The main mass is hard, preconsolidated ,of favorable
physical and mechanical characteristics.

Preparatory Survey on the Sewage System Improvement Project for the City of Belgrade APPENDIX-I
Chapter 7 Cost Estimation and Implementation Schedule
1
Chapter 7 Cost Estimation and Implementation Schedule
1. Estimated Project Cost of All Components
Item Description Amount (Euro) Total Amount
(Euro) L.C F.C 1 Construction Cost A Veliko Selo WWTP -A1 Site preparation work Civil & Architecture works 15,386,000 0 15,386,000 Sub Total of -A1 15,386,000 0 15,386,000 -A2 Lift pump facility Civil works 1,278,000 0 1,278,000 Architecture works 71,000 0 71,000 Mechanical works 858,000 4,455,000 5,313,000 Electrical works 317,000 1,645,000 1,962,000 Sub Total of -A2 2,524,000 6,100,000 8,624,000 -A3 Pretreatment facility Civil works 1,892,000 0 1,892,000 Architecture works 92,000 0 92,000 Mechanical works 237,000 1.231,000 1,468,000 Electrical works 33,000 171,000 204,000 Sub Total of -A3 2,254,000 1,402,000 3,656,000 -A4 Primary settling tank Civil works 5,537,000 0 5,537,000 Mechanical works 236,000 1,226,000 1,462,000 Electrical works 74,000 386,000 460,000 Sub Total of -A4 5,847,000 1,612,000 7,459,000 -A5 Bioreactor Civil works 25,674,000 0 25,674,000 Mechanical works 1,912,000 9,925,000 11,837,000 Electrical works 166,000 861,000 1,027,000 Sub Total of -A5 27,725,000 10,786,000 38,511,000 -A6 Blower facility Civil works 857,000 0 857,000 Architecture works 179,000 0 179,000 Mechanical works 428,000 2,221,000 2,649,000 Electrical works 380,000 1,973,000 2,353,000 Sub Total of -A6 1,844,000 4,194,000 6,038,000 -A7 Secondary settling tank Civil works 8,307,000 0 8,307,000 Architecture works 116,000 0 116,000 Mechanical works 575,000 2,985,000 3,560,000 Electrical works 83,000 429,000 512,000 Sub Total of -A7 9,081,000 3,414,000 12,495,000 -A8 Filtration Civil works 964,000 0 964,000 Architecture works 56,000 0 56,000 Mechanical works 1,226,000 6,363,000 7,589,000 Electrical works 105,000 550,000 655,000 Sub Total of -A8 2,351,000 6,913,000 9,264,000 -A9 Gravity thickener Civil works 759,000 0 759,000 Mechanical works 72,000 372,000 444,000

Preparatory Survey on the Sewage System Improvement Project for the City of Belgrade APPENDIX-I Chapter 7 Cost Estimation and Implementation Schedule
2
Item Description Amount (Euro) Total Amount
(Euro) L.C F.C Electrical works 11,000 55,000 66,000 Sub Total of -A9 842,000 427,000 1,269,000 -A10 Anaerobic digester Civil works 23,410,000 0 23,410,0000 Architecture works 814,000 0 814,000 Mechanical works 2,131,000 11,059,000 13,190,000 Electrical works 67,000 349,000 416,000 Sub Total of -A10 26,422,000 11,408,000 37,830,000 -A11 Sludge treatment facility Civil works 31,000 0 31,0000 Architecture works 1,297,000 0 1,297,000 Mechanical works 740,000 3,842,000 4,582,000 Electrical works 209,000 1,083,000 1,292,000 Sub Total of -A11 2,277,000 4,925,000 7,202,000 -A12 Pipe work Civil works 6,418,000 14,386,000 20,804,000 Sub Total of -A12 6,418,000 14,386,000 20,804,000 -A13 Administration building Architecture works 1,626,000 0 1,626,000 Electrical works 260,000 3,937,000 4,197,000 Sub Total of -A13 1,886,000 3,937,000 5,823,000 -A14 Substation and generator building Architecture works 844,000 0 844,000 Electrical works 781,000 5,275,000 6,056,000 Sub Total of -A14 1,625,000 5,275,000 6,900,000 -A15 Cogeneration building Architecture works 316,000 0 316,000 Electrical works 357,000 1,853,000 2,210,000 Sub Total of -A15 673,000 1,853,000 2,526,000 -A16 Landscaping work Civil works 2,015,000 0 2,015,000 Sub Total of -A16 2,015,000 0 2,015,000 Sub Total of A 109,170,000 76,632,000 185,802,000 Civil works 92,501,000 14,386,000 106,887,000 Architecture works 5,411,000 0 5,411,000 Mechanical works 8,415,000 43,679,000 52,094,000 Electrical works 2,843,000 18,567,000 21,410,000 B Interceptor -B1 Interceptor No.1 Civil works 6,416,000 4,623,000 11,039,000 Sub Total of -B1 6,416,000 4,623,000 11,039,000 -B2 Interceptor No.2 Civil works 3,981,000 351,000 4,332,000 Sub Total of -B2 3,981,000 351,000 4,332,000 -B3 Interceptor No.3 Civil works 7,752,000 0 7,752,000 Sub Total of -B3 7,752,000 0 7,752,000 -B4 Interceptor No.4 Civil works 9,752,000 0 9,752,000 Sub Total of -B4 9,752,000 0 9,752,000 -B5 Interceptor No.6 Civil works 3,874,000 10,587,000 14,461,000 Sub Total of -B5 3,874,000 10,587,000 14,461,000

Preparatory Survey on the Sewage System Improvement Project for the City of Belgrade APPENDIX-I
Chapter 7 Cost Estimation and Implementation Schedule
3
Item Description Amount (Euro) Total Amount
(Euro) L.C F.C -B6 Interceptor No.10 included collector Civil works 5,957,000 18,906,000 24,863,000 Sub Total of -B6 5,957,000 18,906,000 24,863,000 Sub Total of B 37,732,000 34,467,000 72,199,000 Civil Works 37,732,000 34,467,000 72,199,000 C Pumping station -C1 Usce pumping station Civil works 2,216,000 149,000 2,365,000 Architecture works 503,000 0 503,000 Mechanical works 261,000 1,354,000 1,615,000 Electrical works 228,000 1,303,000 1,531,000 Sub Total of -C1 3,208,000 2,806,000 6,014,000 -C2 Mostar pumping station Civil works 490,000 0 490,000 Architecture works 242,000 0 242,000 Mechanical works 206,000 1,068,000 1,274,000 Electrical works 214,000 1,232,000 1,446,000 Sub Total of -C2 1,152,000 2,300,000 3,452,000 Sub Total of C 4,360,000 5,106,000 9,466,000 Civil works 2,706,000 149,000 2,855,000 Architecture works 745,000 0 745,000 Mechanical works 467,000 2,422,000 2,889,000 Electrical works 442,000 2,535,000 2,977,000 Sub Total of Construction Cost 151,262,000 116,205,000 267,467,000 Civil works 132,939,000 49,002,000 181,941,000 Architecture works 6,156,000 0 6,156,000 Mechanical works 8,882,000 46,101,000 54,983,000 Electrical works 3,285,000 21,102,000 24,387,000 2 Administration Cost Administration Cost 16,799,000 0 16,799,000 Sub-Total 16,799,000 0 16,799,000 3 Consulting Cost Base cost 6,334,000 7,669,000 14,003,000 Price escalation 601,000 712,000 1,313,000 Physical contingency 347,000 419,000 766,000 Sub-Total 7,282,000 8,800,000 16,082,000 4 Physical Contingency for construction
Physical contingency 8,456,000 6,562,000 15,018,000
Sub-Total 8,456,000 6,562,000 15,018,000 5 Price Escalation for construction Price escalation 16,726,000 13,522,000 30,248,000 Sub-Total 16,726,000 13,522,000 30,248,000 6 Land Acquisition Base cost 6,816,000 0 6,816,000 Price escalation 136,000 0 136,000 Physical contingency 348,000 0 348,000 Sub-Total 7,300,000 0 7,300,000 7 Interest During Construction Interest during construction (const) 0 14,109,000 14,109,000 Interest during construction (consul) 0 7,000 7,000 Sub-Total 0 14,116,000 14,116,0008 Commitment Charge Commitment Charge 0 2,742,000 2,742,000

Preparatory Survey on the Sewage System Improvement Project for the City of Belgrade APPENDIX-I Chapter 7 Cost Estimation and Implementation Schedule
4
Item Description Amount (Euro) Total Amount
(Euro) L.C F.C Sub-Total 0 2,742,000 2,742,000 9 Tax VAT 67,198,000 0 67,198,000 Sub-Total 67,198,000 0 67,198,000 Total of 1+2+3+4+5+6+7+8+9 275,023,000 161,947,000 436,970,000 (including TAX) Total of 1+2+3+4+5+6+7+8 207,825,000 161,947,000 369,772,000 (excluding TAX)

Preparatory Survey on the Sewage System Improvement Project for the City of Belgrade APPENDIX-I
Chapter 7 Cost Estimation and Implementation Schedule
5
2. Estimated Project Cost of Phase-1 Project
Item Description Amount (Euro) Total Amount
(Euro) L.C F.C 1 Construction Cost A Veliko Selo WWTP -A1 Site preparation work Civil & Architecture works 12,163,000 0 12,163,000 Sub Total of -A1 12,163,000 0 12,163,000 -A2 Lift pump facility Civil works 1,287,000 0 1,287,000 Architecture works 71,000 0 71,000 Mechanical works 467,000 2,424,000 2,891,000 Electrical works 158,000 822,000 980,000 Sub Total of -A2 1,983,000 3,246,000 5,229,000 -A3 Pretreatment facility Civil works 1,923,000 0 1,923,000 Architecture works 92,000 0 92,000 Mechanical works 181,000 939,000 1,120,000 Electrical works 16,000 86,000 102,000 Sub Total of -A3 2,212,000 1,025,000 3,237,000 -A4 Primary settling tank Civil works 2,872,000 0 2,872,000 Mechanical works 118,000 613,000 731,000 Electrical works 37,000 193,000 230,000 Sub Total of -A4 3,027,000 806,000 3,833,000 -A5 Bioreactor Civil works 13,459,000 0 13,459,000 Mechanical works 956,000 4,962,000 5,918,000 Electrical works 83,000 431,000 514,000 Sub Total of -A5 14,498,000 5,393,000 19,891,000 -A6 Blower facility Civil works 444,000 0 444,000 Architecture works 89,000 0 89,000 Mechanical works 214,000 1,110,000 1,324,000 Electrical works 190,000 986,000 1,176,000 Sub Total of -A6 937,000 2,096,000 3,033,000 -A7 Secondary settling tank Civil works 4,416,000 0 4,416,000 Architecture works 58,000 0 58,000 Mechanical works 288,000 1,493,000 1,781,000 Electrical works 41,000 215,000 256,000 Sub Total of -A7 4,803,000 1,708,000 6,511,000 -A8 Filtration Civil works 1,014,000 0 1,014,000 Architecture works 56,000 0 56,000 Mechanical works 618,000 3,206,000 3,824,000 Electrical works 95,000 493,000 588,000 Sub Total of -A8 1,783,000 3,699,000 5,482,000 -A9 Gravity thickener Civil works 394,000 0 394,000 Mechanical works 38,000 197,000 235,000 Electrical works 5,000 27,000 32,000 Sub Total of -A9 437,000 224,000 661,000 -A10 Anaerobic digester

Preparatory Survey on the Sewage System Improvement Project for the City of Belgrade APPENDIX-I Chapter 7 Cost Estimation and Implementation Schedule
6
Item Description Amount (Euro) Total Amount
(Euro) L.C F.C Civil works 11,817,000 0 11,817,000 Architecture works 407,000 0 407,000 Mechanical works 1,065,000 5,530,000 6,595,000 Electrical works 34,000 174,000 208,000 Sub Total of -A10 13,323,000 5,704,000 19,027,000 -A11 Sludge treatment facility Civil works 75,000 0 75,000 Architecture works 1,297,000 0 1,297,000 Mechanical works 484,000 2,514,000 2,998,000 Electrical works 177,000 918,000 1,095,000 Sub Total of -A11 2,033,000 3,432,000 5,465,000 -A12 Pipe work Civil works 4,601,000 7,119,000 11,720,000 Sub Total of -A12 4,601,000 7,119,000 11,720,000 -A13 Administration building Architecture works 1,626,000 0 1,626,000 Electrical works 205,000 2,745,000 2,950,000 Sub Total of -A13 1,831,000 2,745,000 4,576,000 -A14 Substation and generator building Architecture works 844,000 0 844,000 Electrical works 427,000 3,438,000 3,865,000 Sub Total of -A14 1,271,000 3,438,000 4,709,000 -A15 Cogeneration building Architecture works 316,000 0 316,000 Electrical works 179,000 927,000 1,106,000 Sub Total of -A15 495,000 927,000 1,422,000 -A16 Landscaping work Civil works 2,015,000 0 2,015,000 Sub Total of -A16 2,015,000 0 2,015,000 Sub Total of A 67,412,000 41,562,000 108,974,000 Civil works 56,480,000 7,119,000 63,599,000 Architecture works 4,856,000 0 4,856,000 Mechanical works 4,429,000 22,988,000 27,417,000 Electrical works 1,647,000 11,455,000 13,102,000 B Interceptor -B1 Interceptor No.4 Civil works 9,752,000 0 9,752,000 Sub Total of -B1 9,752,000 0 9,752,000 -B2 Interceptor No.6 Civil works 3,874,000 10,587,000 14,461,000 Sub Total of -B2 3,874,000 10,587,000 14,461,000 -B3 Interceptor No.10 included collector Civil works 5,957,000 18,906,000 24,863,000 Sub Total of -B3 5,957,000 18,906,000 24,863,000 Sub Total of B 19,583,000 29,493,000 49,076,000 Civil Works 19,583,000 29,493,000 49,076,000 C Pumping station -C1 Mostar pumping station Civil works 490,000 0 490,000 Architecture works 242,000 0 242,000 Mechanical works 206,000 1,068,000 1,274,000 Electrical works 214,000 1,232,000 1,446,000 Sub Total of -C1 1,152,000 2,300,000 3,452,000

Preparatory Survey on the Sewage System Improvement Project for the City of Belgrade APPENDIX-I
Chapter 7 Cost Estimation and Implementation Schedule
7
Item Description Amount (Euro) Total Amount
(Euro) L.C F.C Sub Total of C 1,152,000 2,300,000 3,452,000 Civil works 490,000 0 490,000 Architecture works 242,000 0 242,000 Mechanical works 206,000 1,068,000 1,274,000 Electrical works 214,000 1,232,000 1,446,000 Sub Total of Construction Cost 88,147,000 73,355,000 161,502,000 Civil works 76,553,000 36,612,000 113,165,000 Architecture works 5,098,000 0 5,098,000 Mechanical works 4,635,000 24,056,000 28,691,000 Electrical works 1,861,000 12,687,000 14,548,000 2 Administration Cost Administration Cost 10,608,000 0 10,608,000 Sub-Total 10,608,000 0 10,608,000 3 Consulting Cost Base cost 6,344,000 7,669,000 14,003,000 Price escalation 601,000 712,000 1,313,000 Physical contingency 347,000 419,000 766,000 Sub-Total 7,282,000 8,800,000 16,082,000 4 Physical Contingency for construction
Physical contingency 4,895,000 4,095,000 8,990,000
Sub-Total 4,895,000 4,095,000 8,990,000 5 Price Escalation for construction Price escalation 9,747,000 8,536,000 18,283,000 Sub-Total 9,747,000 8,536,000 18,283,000 6 Land Acquisition Base cost 6,816,000 0 6,816,000 Price escalation 136,000 0 136,000 Physical contingency 348,000 0 348,000 Sub-Total 7,300,000 0 7,300,000 7 Interest During Construction Interest during construction (const) 0 8,516,000 8,516,000 Interest during construction (consul) 0 7,000 7,000 Sub-Total 0 8,523,000 8,523,0008 Commitment Charge Commitment Charge 0 1,707,000 1,707,000 Sub-Total 0 1,707,000 1,707,000 9 Tax VAT 42,430,000 0 42,430,000 Sub-Total 42,430,000 0 42,430,000 Total of 1+2+3+4+5+6+7+8+9 170,409,000 105,016,000 275,425,000 (including TAX) Total of 1+2+3+4+5+6+7+8 127,979,000 105,016,000 232,995,000 (excluding TAX)


Preparatory Survey on the Sewage System Improvement Project for the City of Belgrade APPENDIX-I
Chapter 8 Financial Analysis and Economic Analysis and Institution
1
Chapter 8 Financial Analysis and Economic Analysis and Institution
1. Willingness To Pay Survey Formats
(1) English Version
Interviewer will explain the purpose the survey as follows;
“This interview is to ask the residents of the city of Beograd to measure their person
value for the proposed new project of a sewerage treatment plan, Veliko Selo. The
interviewer will tell the respondent, “The interview will take about ten minutes or less. If
you spare the time, your answers will greatly support accurate social evaluation of the
project. The information you will provide us will be treated anonymous and confidential
and will be used only for project evaluation purpose”
Q 0. Is your house connected to sewer system now? 1. Yes 2. No
Q 1. Do you know how much your family pays per month for water and sewerage service
from the city? 1. Yes 2. No
Q2. If “yes ” in Q1, How much is it ? RSD
Q3. How do you perceive the current tariff? 1. Appropriate, 2. Very Affordable, 3.
Expensive,
Q4. At present, all the collected sewage is directly discharged to the Danube River. The
proposed project is aimed at cleaning the effluent and to discharge to the river. Naturally,
if the project is implemented the cost of sewage treatment will increase. Would you accept
the increase of 50% to the current tariff of water and sewage combined? 1 Yes 2. No
- If Yes, then would you accept 75% increase?
- If No, then would you accept 25% increase?
Q5.
Q6. The establishment of sewerage treatment capacity has another social importance in
terms of accession to EU. The environmental compliance to EC directives is a prerequisite
to the accession. Acknowledging this fact, what would be your final answer to your
acceptable increases in terms of percentage?
%
Please give us your brief profile:
Occupation
Age
Number of family members sharing the same water source
Date: Signature

Preparatory Survey on the Sewage System Improvement Project for the City of Belgrade APPENDIX-I Chapter 8 Financial Analysis and Economic Analysis and Institution
2
(2) Serbian Version
Spremnost na plaćanje za projekat postrojenja Veliko Selo
Anketar će objasniti svrhu ankete prema sledećem;
“Ovaj upitnik je namenjen stanovnicima grada Beograda da oceni ličnu vrednost
predloženog projekta za postrojenje za tretman otpadnih voda Veliko Selo. Anketa traje
10 minuta ili kraće. Ukoliko imate slobodno vreme, vaši odgovori će biti važna podrška
preciznoj sociološkoj proceni projekta. Informacije koje ćete nam dati biće tretirane kao
anonimne i poverljive i biće korišćene samo za svrhu evaluacije projekta”
Q 0. Da li je vaše domaćinstvo priključeno na kanalizacionu mrežu? 1. Da 2. Ne
Q 1. Da li ste upoznati sa tim koliko vaša porodica plaća mesečno za usluge vode i
kanalizaciju gradu? 1. Da 2. Ne
Q 2. Ukoliko “da ” u Q1, koliko iznosi ? RSD/mesecno
Q 3. Kako Vi vidite trenutne tarife? 1. odgovarajuće, 2. povoljne, 3. skupe
Q 4. Trenutno, sva otpadna voda se direktno ispušta u reku Dunav bez tretmana.
Predloženi projekat ima za cilj tretiranje otpadne vode i ispuštanje prečišćene vode u reku.
Naravno, ukoliko se projekat sprovede, troškovi tretiranja otpadne vode iz kanalizacije će
se povećati.
a Da li ste upoznati sa činjenicom da se otpadne vode iz gradske kanalizacije ispuštaju bez
bilo kakve prerade u reku Dunav? 1. Da 2. Ne
b. Da li bi ste bili spremni da prihvatite povećanje od 50% na trenutnu tarifu koju plaćate
za vodu i kanalizaciju kombinovano? 1 Da 2. Ne
b1. Ukoliko da, da li bi ste prihvatili 75% uvećanja? 1 Da 2. Ne
b2. Ukoliko ne, da li bi ste prihvatili 25% uvećanja? 1 Da 2. Ne
Q 5. Uspostavljanje tretmana otpadnih voda iz kanalizacionog sistema ima još jedan
društveni aspekt u smislu podrške pridruživanja EU. Uspostavljanje standarda zaštite
životne sredine u skladu sa zakonodavstvom EU je jedan od preduslova pristupanju EU.
Imavši na umu ovu činjenicu, koji bi bio Vaš konačni odgovor za prihvatljivo povećanje
cene u smislu procenta,? %
Q 6. Molimo Vas samo osnovne podatke o Vama:
a) zanimanje

Preparatory Survey on the Sewage System Improvement Project for the City of Belgrade APPENDIX-I
Chapter 8 Financial Analysis and Economic Analysis and Institution
3
b) godište
c) broj članova istog domaćinstva koja koristi usluge vode i kanalizacije
d) lokacija stanovanja

Preparatory Survey on the Sewage System Improvement Project for the City of Belgrade APPENDIX-I Chapter 8 Financial Analysis and Economic Analysis and Institution
4
2. Willingness To Pay Survey Results
(1) The Results of Willingness To Pay
The results of the willingness to pay are shown in Table 1.
The question is asked after explaining the current sewage disposal into the rivers and positive
environmental impacts to be brought out by the Project, “How much are you willing to pay more in
addition to the current payment for water and sewerage services?”
Table shows the distribution of the responses which are listed in the descending order. The
cumulative distribution shows the share of the responses with WTP values equal or higher to the
particular WTP. For example, the benchmark of 25% more WTP bracket has a cumulative
distribution of 79.4%. It means that 79.4% of the respondents are willing to pay no less than 25% for
the Project benefits.
Table 1 Results of Willingness to Pay For Project
WTP Number of Share of Total Cumulative
100% 36 10% 10%
90% 1 0% 10%
80% 5 1% 11%
75% 56 15% 26%
65% 1 0% 26%
60% 8 2% 29%
50% 131 35% 64%
35% 2 1% 64%
30% 9 2% 67%
27% 1 0% 67%
25% 47 13% 79.4%
20% 3 1% 80%
15% 5 1% 82%
10% 15 4% 86%
5% 5 1% 87%
2% 3 1% 88%
1% 3 1% 89%
0% 43 11% 100%
Total 374 100% 100%
Source: WTP Survey by JICA Study Team

Preparatory Survey on the Sewage System Improvement Project for the City of Belgrade APPENDIX-I
Chapter 8 Financial Analysis and Economic Analysis and Institution
5
(2) Profile of Respondents
Age Distribution
The age distribution of the respondent in Figure 1 shows relative wide coverage of age groups for
the survey.
Source: WTP Survey by JICA Study Team
Figure 1 Age Distribution of Respondents
Employment Situation
Table 2 shows the job retention situation of the respondents. 27% of the respondents do not have
jobs, being unemployed, students or retired.
Table 2 Employment Situation of Respondents
No job 102 27%
Job 269 73%
Total 371 100%
Source: WTP Survey by JICA Study Team
Sewer Connections
The distribution of the respondent in Table 3 shows the connection to sewers. 95% connection is
slightly higher the average connection rate.

Preparatory Survey on the Sewage System Improvement Project for the City of Belgrade APPENDIX-I Chapter 8 Financial Analysis and Economic Analysis and Institution
6
Table 3 Sewer Connection Distribution of Respondents
Sewer Connection 286 95%
No Connection 15 5%
Total 301 100%
Source: WTP Survey by JICA Study Team
Family Size
Table 4 shows the distribution of family size of the respondents. The average size of the family is 3.2
persons per family.
Table 4 Family Size Distribution of Respondents
1 30 8%
2 97 27%
3 86 24%
4 96 27%
5 33 9%
6 11 3%
7 4 1%
8 1 0%
9 2 1%
Total 360 100% Source: WTP Survey by JICA Study Team
Perception of Current Water/Sewerage Tariff
Table 5 shows the respondents’ perception of the current tariff. 71% of the respondents feel are
satisfied with the current tariff level, feeling either “acceptable”, or “inexpensive.”
Table 5 Perception of Current Water/Sewerage Tariff
Acceptable 154 42%
Inexpensive 106 29%
Expensive 108 29%
Total 368 368
Source: WTP Survey by JICA Study Team
Current Average Payment
The average pay for water and sewerage service by the respondents is RSD 1102 per month per
family.

Preparatory Survey on the Sewage System Improvement Project for the City of Belgrade APPENDIX-I
Chapter 9 Current Engagement with CDM
1
Chapter 9 Current Engagement with CDM
1. Project Design Document (PDD)
PROJECT DESIGN DOCUMENT FORM
FOR SMALL-SCALE CDM PROJECT ACTIVITIES (F-CDM-SSC-PDD)
Version 04.1
Provisional
PROJECT DESIGN DOCUMENT (PDD)
Title of the project activity Methane Gas Capture and Electricity and Heat
Production at Veliko Selo Wastewater Treatment
Plant, Serbia
Version number of the PDD Version 0
Completion date of the PDD xx December 2012
Project participant(s) Belgrade Land Development Public Agency (LDA)
Belgrade Waterworks and Sewerage (BVK)
Host Party(ies) Government of the City of Belgrade, Serbia
Sectoral scope(s) and selected
methodology(ies)
Type I.- Renewable Energy Projects
Category I.C “Thermal energy production with or
without electricity” Version 19 (provisional)
Estimated amount of annual average
GHG emission reductions
17,095 tCO2/yr

Preparatory Survey on the Sewage System Improvement Project for the City of Belgrade APPENDIX-I Chapter 9 Current Engagement with CDM
2
SECTION A. Description of project activity
A.1. Purpose and general description of project activity
The project deals with methane capture, GHG emission reduction and electricity production at the
Veliko Selo Wastewater Treatment Plant, Serbia.
Sewage from the City of Belgrade, with which is stocked into the Danube and the Sava River as
untreated at the moment will be treated in the newly-built Veliko Selo Wastewater Treatment Plant
including advanced treatment which treated water is planned to be released into the Danube.
Sewage treatment system is a usual premium treatment with addition of the advanced treatment,
which has functions of phosphorus and nitrogen removal. Wastewater treatment consists of three
parts, which are primary settling tank, bioreactor and final settling tank.
Exce
ss
Slud
ge
Figure1. Diagram of Wastewater Treatment Process
Sludge is produced in both two settling tanks, joined to one and sent to the sludge treatment process.
The sludge process, originally consisting of mechanical dehydration which can dehydrate the sludge
to approximately 80% moisture content and disposal by landfill of waste disposal facility is
introduced anaerobic digestion and the produced biogas from digester is used for warming the
injection sludge to the digester and the surplus biogas is treated by flare facility (stack). (see below
figure) In these sludge warming and flare treatment, CO2 emissions are not counted as burning
carbon-neutral methane.
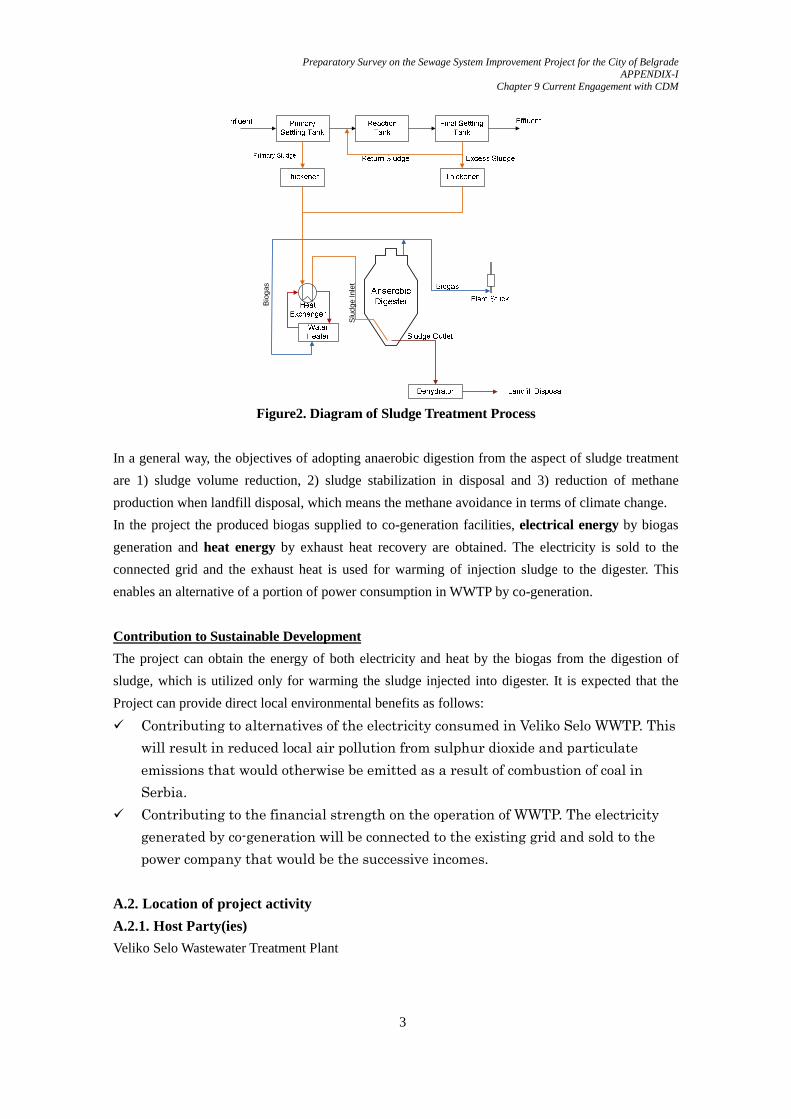
Preparatory Survey on the Sewage System Improvement Project for the City of Belgrade APPENDIX-I
Chapter 9 Current Engagement with CDM
3
Bio
gas
Slu
dge
Inle
t
Figure2. Diagram of Sludge Treatment Process
In a general way, the objectives of adopting anaerobic digestion from the aspect of sludge treatment
are 1) sludge volume reduction, 2) sludge stabilization in disposal and 3) reduction of methane
production when landfill disposal, which means the methane avoidance in terms of climate change.
In the project the produced biogas supplied to co-generation facilities, electrical energy by biogas
generation and heat energy by exhaust heat recovery are obtained. The electricity is sold to the
connected grid and the exhaust heat is used for warming of injection sludge to the digester. This
enables an alternative of a portion of power consumption in WWTP by co-generation.
Contribution to Sustainable Development
The project can obtain the energy of both electricity and heat by the biogas from the digestion of
sludge, which is utilized only for warming the sludge injected into digester. It is expected that the
Project can provide direct local environmental benefits as follows:
Contributing to alternatives of the electricity consumed in Veliko Selo WWTP. This
will result in reduced local air pollution from sulphur dioxide and particulate
emissions that would otherwise be emitted as a result of combustion of coal in
Serbia.
Contributing to the financial strength on the operation of WWTP. The electricity
generated by co-generation will be connected to the existing grid and sold to the
power company that would be the successive incomes.
A.2. Location of project activity
A.2.1. Host Party(ies)
Veliko Selo Wastewater Treatment Plant
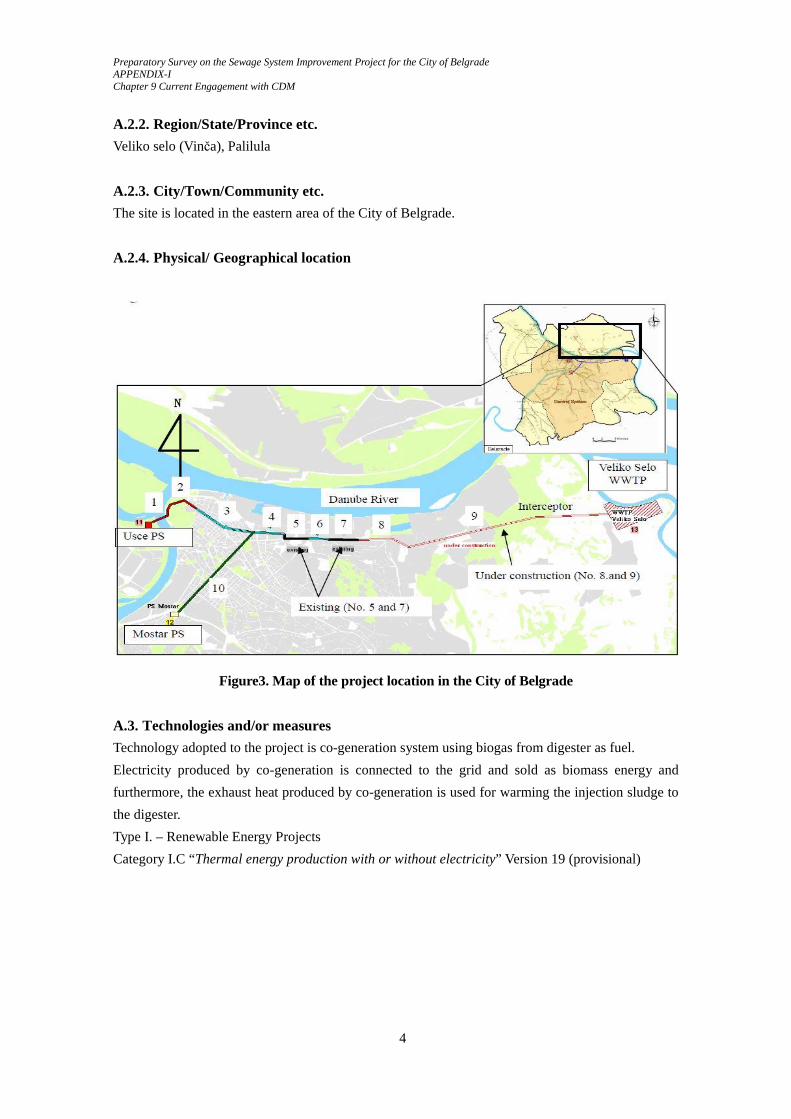
Preparatory Survey on the Sewage System Improvement Project for the City of Belgrade APPENDIX-I Chapter 9 Current Engagement with CDM
4
A.2.2. Region/State/Province etc.
Veliko selo (Vinča), Palilula
A.2.3. City/Town/Community etc.
The site is located in the eastern area of the City of Belgrade.
A.2.4. Physical/ Geographical location
Figure3. Map of the project location in the City of Belgrade
A.3. Technologies and/or measures
Technology adopted to the project is co-generation system using biogas from digester as fuel.
Electricity produced by co-generation is connected to the grid and sold as biomass energy and
furthermore, the exhaust heat produced by co-generation is used for warming the injection sludge to
the digester.
Type I. – Renewable Energy Projects
Category I.C “Thermal energy production with or without electricity” Version 19 (provisional)

Preparatory Survey on the Sewage System Improvement Project for the City of Belgrade APPENDIX-I
Chapter 9 Current Engagement with CDM
5
A.4. Parties and project participants
Party involved
(host) indicates a host
Party
Private and/or public
entity(ies) project
participants
(as applicable)
Indicate if the Party
involved wishes to be
considered as project
participant (Yes/No)
Government of the City of
Belgrade, Serbia (host)
Belgrade Land Development
Public Agency (LDA)
No
Government of the City of
Belgrade, Serbia (host)
Belgrade Waterworks and
Sewerage (BVK)
No
Government of the City of
Belgrade, Serbia (host)
Veliko Selo Wastewater
Treatment Plant
No
Japan
A.5. Public funding of project activity
Acquire the letter of telling that the project fund is not diverted from ODA fund from MOFA
Sample:
A.6. Debundling for project activity
The proposed project activity is not a debundled component of a large project activity. According to
Appendix C of the Simplified Modalities and Procedures for Small-Scale CDM Project Activities, a
proposed small-scale project activity is considered a debundled component of a large scale project
activity if there is a registered small-scale CDM project activity or an application to register another
small-scale project activity:
With the same project participants;
In the same project category and technology/measure; and
Registered within the previous 2 years; and
whose project boundary is within 1 km of the project boundary of the proposed small-scale
activity at the closest point

Preparatory Survey on the Sewage System Improvement Project for the City of Belgrade APPENDIX-I Chapter 9 Current Engagement with CDM
6
Since none of the above is true for the proposed CDM project activity, it is not a debundled
component of a large project activity.

Preparatory Survey on the Sewage System Improvement Project for the City of Belgrade APPENDIX-I
Chapter 9 Current Engagement with CDM
7
SECTION B. Application of selected approved baseline and monitoring methodology
B.1. Reference of methodology
The baseline and monitoring methodologies applied for the project is based on the most recent list of
the small-scale CDM project activity categories contained in Appendix B of the Simplified
Modalities and Procedures for Small-Scale CDM Project Activities.
The project falls under,
Type I – Renewable Energy Projects
Category I. C. – “Thermal energy production with or without electricity” Version 19 (provisional)
The approved baseline and monitoring methodology, given in Appendix B of the Simplified Modalities
and Procedures for Small-Scale CDM Project Activities, relevant to this project are available at:
http://cdm.unfccc.int/filestorage/G/U/9/GU9MEH14PBSNCKJIOV3L7W82RTZY06/EB61_repan16
_Revision_AMS-I%20C_ver19.pdf?t=VUl8bWVtM2xlfDCCImT5vTBKnja9mLh4Ic-c
B.2. Project activity eligibility
According to Appendix B of the Simplified Modalities and Procedures for Small-Scale CDM Project
Activities, Category I. C. “Thermal energy for the user” comprises “renewable energy technologies
that supply individual households or users with thermal energy that displaces fossil fuels.
Biomass-based co-generating systems that produce heat and electricity for use on-site are included in
this category. For co-generation systems and/or co-fired systems to qualify under this category, the
energy output shall not exceed 45 MWthermal.
B.3. Project boundary
According to the baseline methodology for project category I.C., “The physical, geographical site of
the renewable energy generation delineates the project boundary” The physical project boundary
selected for the project activity is the sludge treatment process centered on the anaerobic digester of
the Veliko Selo WWTP before the dehydration process.
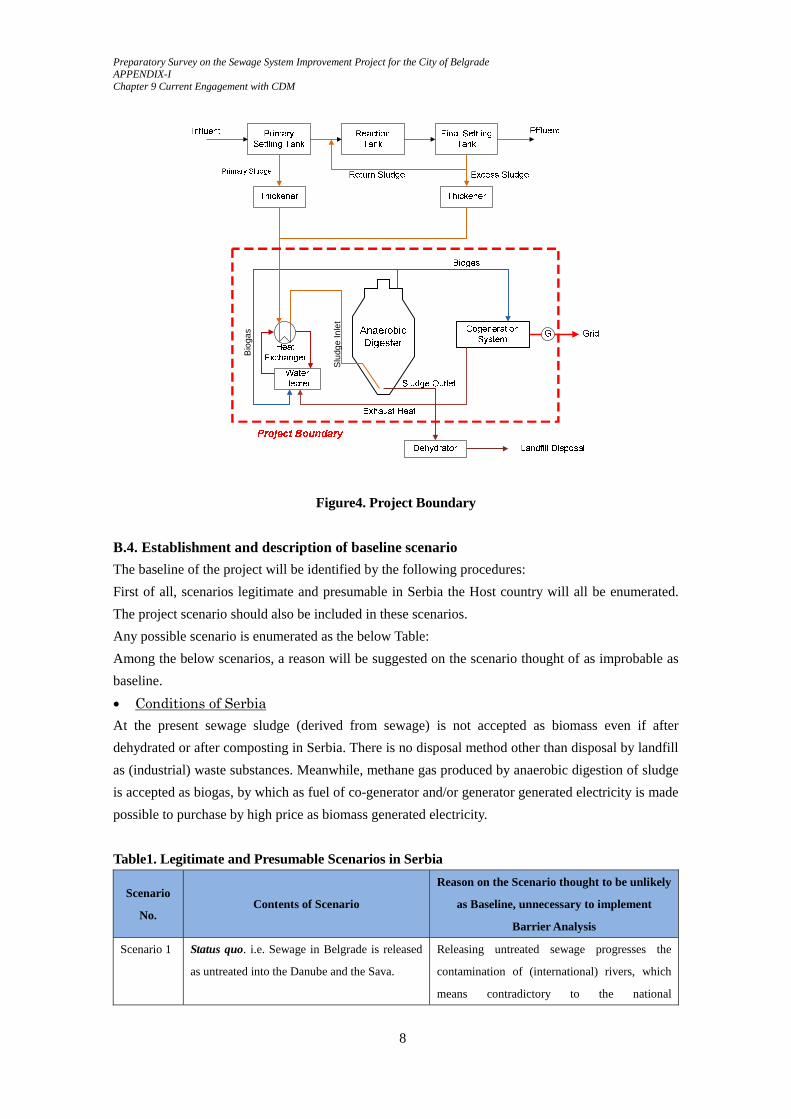
Preparatory Survey on the Sewage System Improvement Project for the City of Belgrade APPENDIX-I Chapter 9 Current Engagement with CDM
8
Slu
dge
Inle
t
Bio
gas
Figure4. Project Boundary
B.4. Establishment and description of baseline scenario
The baseline of the project will be identified by the following procedures:
First of all, scenarios legitimate and presumable in Serbia the Host country will all be enumerated.
The project scenario should also be included in these scenarios.
Any possible scenario is enumerated as the below Table:
Among the below scenarios, a reason will be suggested on the scenario thought of as improbable as
baseline.
Conditions of Serbia
At the present sewage sludge (derived from sewage) is not accepted as biomass even if after
dehydrated or after composting in Serbia. There is no disposal method other than disposal by landfill
as (industrial) waste substances. Meanwhile, methane gas produced by anaerobic digestion of sludge
is accepted as biogas, by which as fuel of co-generator and/or generator generated electricity is made
possible to purchase by high price as biomass generated electricity.
Table1. Legitimate and Presumable Scenarios in Serbia
Scenario
No. Contents of Scenario
Reason on the Scenario thought to be unlikely
as Baseline, unnecessary to implement
Barrier Analysis
Scenario 1 Status quo. i.e. Sewage in Belgrade is released
as untreated into the Danube and the Sava.
Releasing untreated sewage progresses the
contamination of (international) rivers, which
means contradictory to the national

Preparatory Survey on the Sewage System Improvement Project for the City of Belgrade APPENDIX-I
Chapter 9 Current Engagement with CDM
9
environmental policy. Unlikely as baseline.
Scenario 2 M/P scheme. i.e. Sewage is treated by
secondary biological treatment with advanced
treatment and sludge is treated by anaerobic
digestion after thickening and disposed by
landfill after dehydration. Biogas produced
from digester is utilized for warming sludge
injected into digester and/or combusted by flare
treatment.
(presumable as baseline, it is necessary to
examine in next step)
Scenario 3
(this
project)
Co-generation introduction scheme. i.e.
Sewage is treated by secondary biological
treatment with advanced treatment and sludge is
treated by anaerobic digestion after thickening
and disposed by landfill after dehydration.
Biogas from digester produces electricity and
heat by introduced co-generator and the
electricity is connected to the existing grid and
the exhaust heat is utilized for warming sludge
injected into digester.
(presumable as baseline, it is necessary to
examine in next step)
Scenario 4 Composting introduction scheme. i.e. Sewage
is treated by secondary biological treatment
with advanced treatment and sludge is
dehydrated after thickening and dehydrated
sludge cake is treated by composting. Biogas
produced from digester is utilized for warming
sludge injected into digester and/or combusted
by flare treatment.
(presumable as baseline, it is necessary to
examine in next step)
Scenario 5 Drying process (sludge fuel conversion)
introduction scheme. i.e. Sewage is treated by
secondary biological treatment with advanced
treatment and sludge is dehydrated after
thickening and dehydrated sludge cake is dried
by newly-introduced sludge drying equipment.
Biogas produced from digester is utilized for
warming sludge injected into digester and/or
combusted by flare treatment.
The product of dried sludge has no application
as fuel. Unlikely as baseline by reason of no
economic benefit even if dried.
Next, the barrier analysis of reckoned scenarios will be implemented. Investment analysis of ones
having the least barrier will be implemented and the one of the highest investment efficiency will be
baseline scenario. The result of barrier analysis is shown as follows:

Preparatory Survey on the Sewage System Improvement Project for the City of Belgrade APPENDIX-I Chapter 9 Current Engagement with CDM
10
Table2. Barrier Analysis of Scenarios
Scenario
No. Contents of Scenario Presumable Barrier
Scenario 2 M/P scheme. i.e. Sewage is treated by
secondary biological treatment with advanced
treatment and sludge is treated by anaerobic
digestion after thickening and disposed by
landfill after dehydration. Biogas produced
from digester is utilized for warming sludge
injected into digester and/or combusted by flare
treatment.
No technical barrier. Making a study of whether
the project is formed economically or not is
required.
Scenario 3
(this project)
Co-generation introduction scheme. i.e.
Sewage is treated by secondary biological
treatment with advanced treatment and sludge is
treated by anaerobic digestion after thickening
and disposed by landfill after dehydration.
Biogas from digester produces electricity and
heat by introduced co-generator and the
electricity is connected to the existing grid and
the exhaust heat is utilized for warming sludge
injected into digester.
No technical barrier. Making a study of whether
the project is formed economically or not is
required.
Scenario 4 Composting introduction scheme. i.e. Sewage
is treated by secondary biological treatment
with advanced treatment and sludge is
dehydrated after thickening and dehydrated
sludge cake is treated by composting. Biogas
produced from digester is utilized for warming
sludge injected into digester and/or combusted
by flare treatment.
The barrier is existing. Sludge derived from
sewage or wastewater treatment is not biomass in
Serbia and no sludge composting is implemented.
The reason is nonexistence of composting
technology and social system.
The result of investment analysis on scenario 2 and 3 is shown as follows:
Table3. Investment Analysis of Scenarios
Scenario
No. Contents of Scenario
Additional
Expense
Additional
Revenue
Post-tax IRR
Scenario 2 M/P scheme. i.e. Sewage is treated by
secondary biological treatment with
advanced treatment and sludge is
Initial
Construction Cost
300,000 k
NA IRR calculation is
incapable.
Preparatory Survey on the Sewage System Improvement Project for the City of Belgrade APPENDIX-I
Chapter 9 Current Engagement with CDM
11
treated by anaerobic digestion after
thickening and disposed by landfill
after dehydration. Biogas produced
from digester is utilized for warming
sludge injected into digester and/or
combusted by flare treatment.
Scenario 3
(this project)
Co-generation introduction scheme.
i.e. Sewage is treated by secondary
biological treatment with advanced
treatment and sludge is treated by
anaerobic digestion after thickening
and disposed by landfill after
dehydration. Biogas from digester
produces electricity and heat by
introduced co-generator and the
electricity is connected to the existing
grid and the exhaust heat is utilized
for warming sludge injected into
digester.
Initial
Construction Cost
302,000 k
Power purchase
cost and cost of
fuel for warming
sludge are
reduced by the
efficient use of
biogas.
Revenue of
electrical power
selling;
1,212 k /yr
(0.067 /kWh)
IRR calculation is
incapable.
The study mentioned above concluded the baseline scenario was the M/P scheme.
B.5. Demonstration of additionality
Secondly, the additionality will be demonstrated. The project is scenario 3. As it became clear that
the scenario 3 was not the baseline scenario, it has already been confirmed that the project was
additionality, however, “GHG emissions can be reduced additionally” will be demonstrated through
the scenario 3.
Mathematically, if the following formula become clear, the additionality can be verified.
Baseline Emissions + Baseline Leakage > Project Emissions + Project Leakage
(1)
where
Baseline Emissions (tCO2/yr) BEi,y = EGi,y * EFBL,i,FC = 0
(2)
Baseline Leakage (tCO2/yr) BLy = Py * EFgrid,y
(3)
Project Emissions (tCO2/yr) PEi,y = EGj,y * EFBL,i,FC = 0
(4)

Preparatory Survey on the Sewage System Improvement Project for the City of Belgrade APPENDIX-I Chapter 9 Current Engagement with CDM
12
Project Leakage (tCO2/yr) PLy = 0
(5)
As described above, it is obvious that Py * EFgrid,y > 0 leads to the additionality.
where
BEi,y = Baseline emissions from electricity and thermal energy displaced by the project
activity during the year y (tCO2)
EGi,y = Amount of fuel i of water heater used for warming sludge (mass or volume
unit/yr)
EFBL,i,FC= Emission factor of fuel i (tCO2/mass or volume unit/yr)
Emission factor of biogas fuel is 0
BLy = Baseline leakage during the year y (tCO2/yr)
Py = Net supplied power by the project co-generation system in the year y
(MWh/yr)
EFgrid,y = Emission factor of the baseline grid during the year y (tCO2/MWh)
PEi,y = Project emissions in the year y (tCO2/yr)
EGj,y = Amount of exhaust heat energy j in the year y (mass or volume unit/yr)
PLy = Project leakage during the year y (tCO2/yr) = 0
In the baseline, anaerobic digestion implemented with the purpose of sludge stabilization, the
produced biogas is used for warming sludge injected into digester and its surplus is treated by flare
combustion. On the other hand, in the project, the produced biogas is supplied to the co-generation
system, and the power energy generated by biomass generation and the heat energy by recovered
exhaust heat are obtained. Electricity is connected to the existing grid and sold, and exhaust heat is
used for warming the sludge injected into digester. Herewith, a part of power consumption is
substituted by co-generation. Consequently, the project is additionality.
B.6. Emission reductions
B.6.1. Explanation of methodological choices
According to Appendix B of the Simplified Modalities and Procedures for Small-Scale CDM Project
Activities, Category I-C. “Thermal energy production with or without electricity” comprises
“renewable energy technologies that supply users with thermal energy that displaces fossil fuel use.
These units include technologies such as solar thermal water heaters and dryers, solar cookers,
energy derived from renewable biomass and other technologies that provide thermal energy that
displaces fossil fuel.
The applicability is limited to biomass co-generation units that the total installed energy capacity
(thermal and electrical) of the project shall not exceed 45 MW thermal. Incidentally, for the purpose
of calculating this capacity limit the conversion factor of 1:3 shall be used for converting electrical
energy to thermal energy (i.e. for renewable energy project activities, the maximal limit of 15

Preparatory Survey on the Sewage System Improvement Project for the City of Belgrade APPENDIX-I
Chapter 9 Current Engagement with CDM
13
MW(e) is equivalent to 45 MW thermal output of the equipment or the plant).
The proposed project activity involves 4 (four) units of 1 MW co-generation equipment. Then the
total capacity of the project activity is 4 MW(e). As such this project qualifies under Category I.C. of
Appendix B of the small-scale guidelines.
B.6.2. Data and parameters fixed ex ante
Data / Parameter EFBL,i,FC
Unit tCO2/mass or volume unit
Description CO2 emission factor of fuel type i
Source of data AMS-I.C.
Value(s) applied 0
Choice of data or
Measurement methods
and procedures
Since fuel for warming the sludge injected into digester is biogas,
no CO2 emission factor is to be considered.
Purpose of data Calculation of baseline and project emissions
Additional comment
Data / Parameter EFgrid,y
Unit tCO2/MWh
Description Emission factor of Serbian power grid during the year y
Source of data Technical Assistance of the Revision of Project Design
Documents (PDDs). Calculation of the Carbon Emission Factor
for the Serbian Power Grid; Rev.0 - JUNE 2011, Serbian Ministry
of Environment, Mining and Spatial Planning Belgrade, Serbia
(i.e. Ministry of Energy Development and Environmental
Protection of the Republic of Serbia at present)
Value(s) applied 0.945
Choice of data or
Measurement methods
and procedures
This item should be decided based on the method mentioned in
the Baseline Methodology.
Purpose of data Calculation of emission reduction of the project
Additional comment
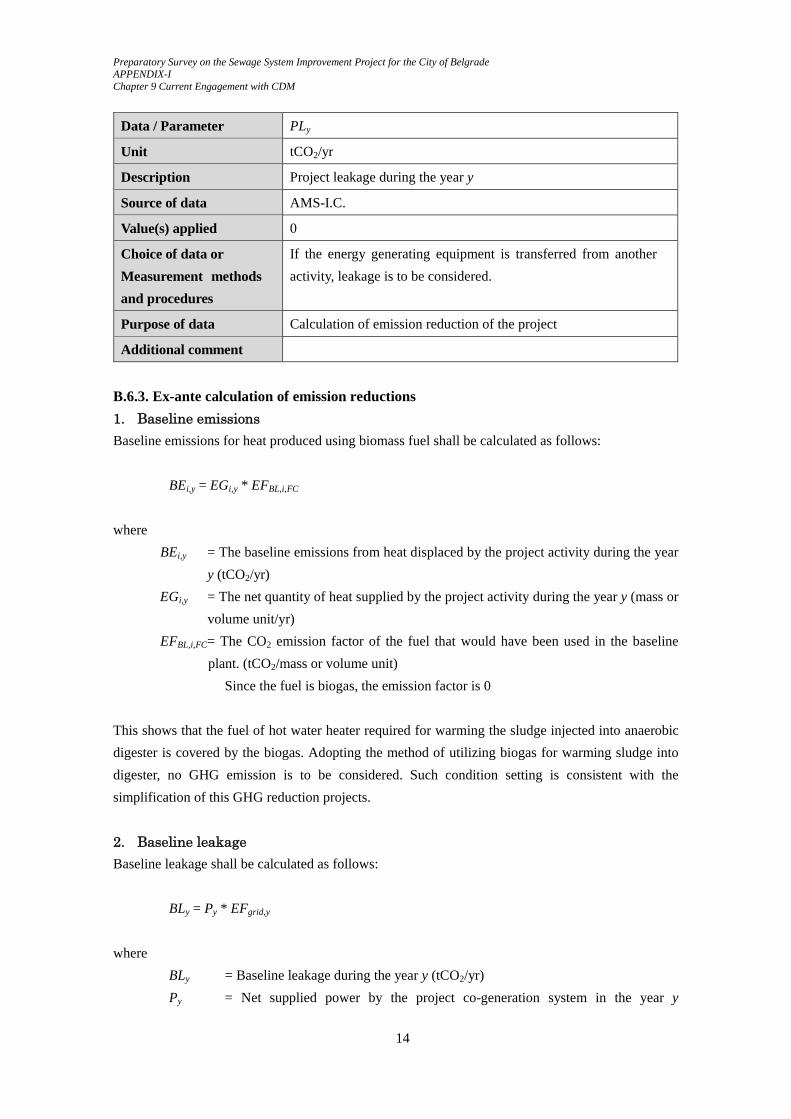
Preparatory Survey on the Sewage System Improvement Project for the City of Belgrade APPENDIX-I Chapter 9 Current Engagement with CDM
14
Data / Parameter PLy
Unit tCO2/yr
Description Project leakage during the year y
Source of data AMS-I.C.
Value(s) applied 0
Choice of data or
Measurement methods
and procedures
If the energy generating equipment is transferred from another
activity, leakage is to be considered.
Purpose of data Calculation of emission reduction of the project
Additional comment
B.6.3. Ex-ante calculation of emission reductions
1. Baseline emissions
Baseline emissions for heat produced using biomass fuel shall be calculated as follows:
BEi,y = EGi,y * EFBL,i,FC
where
BEi,y = The baseline emissions from heat displaced by the project activity during the year
y (tCO2/yr)
EGi,y = The net quantity of heat supplied by the project activity during the year y (mass or
volume unit/yr)
EFBL,i,FC= The CO2 emission factor of the fuel that would have been used in the baseline
plant. (tCO2/mass or volume unit)
Since the fuel is biogas, the emission factor is 0
This shows that the fuel of hot water heater required for warming the sludge injected into anaerobic
digester is covered by the biogas. Adopting the method of utilizing biogas for warming sludge into
digester, no GHG emission is to be considered. Such condition setting is consistent with the
simplification of this GHG reduction projects.
2. Baseline leakage
Baseline leakage shall be calculated as follows:
BLy = Py * EFgrid,y
where
BLy = Baseline leakage during the year y (tCO2/yr)
Py = Net supplied power by the project co-generation system in the year y

Preparatory Survey on the Sewage System Improvement Project for the City of Belgrade APPENDIX-I
Chapter 9 Current Engagement with CDM
15
(MWh/yr)
EFgrid,y = Emission factor of Serbian power grid during the year y (tCO2/MWh)
Regarding Py:
The capacity of co-generation system planned in the main project (Veliko Selo WWTP Project) is as
follows:
1,000 kW x 4 units total 4,000 kW (at peak time)
When assuming the generation capacity is 2,500 kW in normal operation, the annual operating time
is 8,040 hrs (335-day running) and the self-consumption ratio is 10 %;
2,500 kW x 8,040 hrs x (1-0.1) = 18,090 MWh/yr
And the emission factor of Serbian power grid EFgrid,y is;
EFgrid,y = 0.945 tCO2/MWh1
thus
BLy = 17,095 tCO2/yr
3. Project emissions
Project emissions shall be calculated as follows:
PEi,y = EGj,y * EFBL,i,FC = 0
Thus no project emission is to be considered.
4. Project leakage
If the energy generating equipment is transferred from another activity, leakage is to be considered.
Thus no project leakage is to be considered.
PLy = 0
5. Emission reduction
1 Technical Assistance of the Revision of Project Design Documents (PDDs), Calculation of the Carbon Emission Factor for the Serbian Power Grid; Rev.0 – JUNE 2011, Serbian Ministry of Environment, Mining and Spatial Planning Belgrade, Serbia

Preparatory Survey on the Sewage System Improvement Project for the City of Belgrade APPENDIX-I Chapter 9 Current Engagement with CDM
16
GHG emission reduction shall be calculated as follows:
Emission reduction = (Baseline emissions + Baseline leakage) – (Project emissions + Project
leakage)
thus
GHG emission reduction ERCO2 = 17,095 tCO2/yr
B.6.4. Summary of ex-ante estimates of emission reductions
Year Baseline emissions
(tCO2 e)
Project emissions
(tCO2 e)
Leakage
(tCO2 e)
Emission
reductions
(tCO2 e)
2019 0 0 17,095 17,095
2020 0 0 17,095 17,095
2021 0 0 17,095 17,095
2022 0 0 17,095 17,095
2023 0 0 17,095 17,095
2024 0 0 17,095 17,095
2025 0 0 17,095 17,095
Total 119,665
Total number of
crediting years
7 years
Annual
average over the
crediting period
17,095
B.7. Monitoring plan
B.7.1. Data and parameters to be monitored

Preparatory Survey on the Sewage System Improvement Project for the City of Belgrade APPENDIX-I
Chapter 9 Current Engagement with CDM
17
Data / Parameter Py
Unit MWh/yr
Description Net supplied power by the project co-generation system in the year y
Source of data Indicated value of sold electric power meter
Value(s) applied 18,090
Measurement
methods and
procedures
Measurement data should be stored as electronic data and kept them
for two years after the crediting period.
Monitoring
frequency
Once a year
QA/QC procedures Instrument should be corrected proofs periodically.
Purpose of data Calculation of emission reduction of the project
Additional comment
Data / Parameter EFgrid,y
Unit tCO2/MWh
Description Emission factor of Serbian power grid during the year y
Source of data Technical Assistance of the Revision of Project Design Documents
(PDDs). Calculation of the Carbon Emission Factor for the Serbian
Power Grid; Rev.0 - JUNE 2011, Serbian Ministry of Environment,
Mining and Spatial Planning Belgrade, Serbia (i.e. Ministry of
Energy Development and Environmental Protection of the Republic
of Serbia at present)
Value(s) applied 0.945
Measurement
methods and
procedures
This item should be decided based on the method mentioned in the
Baseline Methodology. Measurement data should be stored as
electronic data and kept them for two years after the crediting
period.
Monitoring
frequency
Once a year
QA/QC procedures Calculating based on the Baseline Methodology
Purpose of data Calculation of emission reduction of the project
Additional comment
B.7.2. Sampling plan
The framework of quality control and quality assurance on the monitoring are as follows:
Where “Administrator” means the administration division of Belgrade Waterworks and Sewerage

Preparatory Survey on the Sewage System Improvement Project for the City of Belgrade APPENDIX-I Chapter 9 Current Engagement with CDM
18
(BVK) and “Operator” means operators of Veliko Selo WWTP those who implement the monitoring
under the directions of the administration division of BVK.
Project implement bodies consist of the operator and the administrator.
Administrator develops a procedure for facility operation.
In the procedure, daily work contents, maintenance methods and various types of
criteria for judgement are described and formatted appropriately.
The operator should be assured of chances for receiving training and education
periodically to take every available step to work in accordance with the above
procedure.
Operator should carry out the daily works and report the results to the administrator
in accordance with the procedure.
Administrator should check the report from the operator and make judgements
whether having problems with or not in accordance with the procedure, and as a
result of checking, develop an appropriate response at an appropriate time in the
event of problems.
Administrator should file the report from the operator daily and store them in
accordance with the procedure.
Administrator should take a tour of the sites, visit the site at an appropriate time and
audit whether the operator’s works properly in accordance with the procedure. As a
result of auditing, the administrator should develop an appropriate response at an
appropriate time in the event of problems.
When an accident occurs (including unexpected GHG discharge), administrator
should find out the cause and give the operator the direction of countermeasure and
implementation.
If an emergency arises (including unexpected GHG discharge), operator should take
emergency measures and implement the countermeasures under the administrator’s
direction.
Instrument should properly be corrected proofs periodically in accordance with the
procedure. A period and a method of the proofreading should accordance with the
monitoring plan.
B.7.3. Other elements of monitoring plan
NA

Preparatory Survey on the Sewage System Improvement Project for the City of Belgrade APPENDIX-I
Chapter 9 Current Engagement with CDM
19
SECTION C. Duration and crediting period
C.1. Duration of project activity
C.1.1. Start date of project activity
xx / 01 / 2019
C.1.2. Expected operational lifetime of project activity
7 years
C.2. Crediting period of project activity
C.2.1. Type of crediting period
CER
C.2.2. Start date of crediting period
dd / 01 / 2019
C.2.3. Length of crediting period
7 years
SECTION D. Environmental impacts
D.1. Analysis of environmental impacts
NA
SECTION E. Local stakeholder consultation
E.1. Solicitation of comments from local stakeholders
NA
E.2. Summary of comments received
NA
E.3. Report on consideration of comments received
NA
SECTION F. Approval and authorization
NA
- - - - -

Preparatory Survey on the Sewage System Improvement Project for the City of Belgrade APPENDIX-I Chapter 9 Current Engagement with CDM
20
Appendix 1: Contact information of project participants
Organization
Street/P.O. Box
Building
City
State/Region
Postcode
Country
Telephone
Fax
Website
Contact person
Title
Salutation Ms.
Last name
Middle name
First name
Department
Mobile
Direct fax
Direct tel.
Personal e-mail
Appendix 2: Affirmation regarding public funding
NA
Appendix 3: Applicability of selected methodology
NA

Preparatory Survey on the Sewage System Improvement Project for the City of Belgrade APPENDIX-I
Chapter 9 Current Engagement with CDM
21
Appendix 4: Further background information on ex ante calculation of emission reductions
NA
Appendix 5: Further background information on monitoring plan
NA
Appendix 6: Summary of post registration changes
NA
- - - - -
History of the document
Version Date Nature of revision
04.1 11 April 2012 Editorial revision to change history box by adding EB meeting and
annex numbers in the Date column.
04.0 EB 66
13 March 2012
Revision required to ensure consistency with the “Guidelines for
completing the project design document form for small-scale CDM
project activities” (EB 66, Annex 9). 03 EB 28, Annex 34
15 December 2006
The Board agreed to revise the CDM project design
document for small-scale activities (CDM-SSC-PDD),
taking into account CDM-PDD and CDM-NM. 02 EB 20, Annex 14
08 July 2005
The Board agreed to revise the CDM SSC PDD to reflect
guidance and clarifications provided by the Board since
version 01 of this document.
As a consequence, the guidelines for completing CDM
SSC PDD have been revised accordingly to version 2. The
latest version can be found at
<http://cdm.unfccc.int/Reference/Documents>. 01 EB 07, Annex 05
21 January 2003
Initial adoption.
Decision Class: Regulatory
Document Type: Form
Business Function: Registration