preparatory survey for bangkok wastewater …open_jicareport.jica.go.jp/pdf/12034542.pdf · for...
TRANSCRIPT

JAPAN INTERNATIONAL COOPERATION AGENCY (JICA)
TOKYO ENGINEERING CONSULTANTS CO., LTD. (TEC)NIPPON KOEI CO., LTD. (NK)
PREPARATORY SURVEYFOR
BANGKOK WASTEWATERTREATMENT PROJECT
INTHAILAND
FINAL REPORT (I) CONCEPTUAL MASTER PLAN
VOL. 1 SUMMARY
BANGKOK METROPOLITANADMINISTRATION (BMA)
JULY 2011
SAP
JR
11-015

as of October 1, 2010 1 Baht = 0.0330 US dollar 1 Baht = 2.76 yen

i
TABLE OF CONTENTS
1. INTRODUCTION ................................................................................................................1 1.1 Objectives and Scope of the Survey .....................................................................................1 1.2 Area under the Survey ..........................................................................................................1 1.3 Implementing Organizations in Thailand..............................................................................1
2. WORK SCHEDULE AND IMPLEMENTATION OF PHASE 1 WORK............................2 2.1 Work Schedule for the Entire Survey....................................................................................2 2.2 Basic Policies for the Survey................................................................................................2 2.3 Survey Organization .............................................................................................................2
3. ISSUES OF SEWERAGE WORKS IN BMA......................................................................4 3.1 Sewerage System in Thailand...............................................................................................4 3.2 Current Sewerage Implementation Plan ...............................................................................5 3.3 Exiting Sewerage Facilities...................................................................................................6 3.4 Water Pollution Situation in BMA........................................................................................8 3.5 Issues for Improvement of Water Environment and Sewerage System ..............................13
3.5.1 Technical Issues .......................................................................................................14 3.5.2 Management and Institutional Issues .......................................................................15
4. SOLUTIONS AND STRATEGY FOR SEWERAGE SYSTEM DEVELOPMENT IN BANGKOK ........................................................................................................................17
4.1 Solutions for the Problems .......................................................................................17 4.2 Strategy for Sewerage System Development ...........................................................18 Strategy 1: Improve the Water Environment by Improving the Sewerage System ...............18 Strategy 2: Improve the Water Environment by Expansion of the Sewerage System...........25 Strategy 3: Enhance the Level of Sewage Services for the Society ......................................26 Strategy 4: Improve the Management of the Sewerage Works..............................................27
5. CONCEPTUAL SEWERAGE MASTER PLAN ........................................................................37 5.1 Target Year and Treatment Area..........................................................................................37 5.2 Population Projection..........................................................................................................37 5.3 Water Supply Plan of MWA................................................................................................38 5.4 Proposal on Treatment Areas ..............................................................................................39 5.5 Population by Proposed Temporary Treatment Areas.........................................................39 5.6 Wastewater Generation.......................................................................................................40
5.6.1 Present Wastewater Generation................................................................................40 5.6.2 Estimated Flow at WWTP in 2040...........................................................................41

ii
5.7 Rearrangement of Treatment Areas.....................................................................................45 5.8 Construction Cost ...............................................................................................................47 5.9 Simple Analysis of Water Pollution ....................................................................................48 5.10 Selection of Priority Project................................................................................................51
5.10.1 Candidate Treatment Areas for Priority Project .......................................................51 5.10.2 Selection of Priority Project Area.............................................................................54 5.10.3 Outlines of Nong Bon Treatment Area.....................................................................57
5.11 Strategy for Sewerage System Development......................................................................59
Report Structure
Final Report (I) Conceptual Master Plan
Volume 1 Summary Volume 2 Main Report
CD-R
Final Report (II) Feasibility Study
Volume 1 Summary Volume 2 Main Report
Volume 3 Drawings CD-R
1
1. INTRODUCTION 1.1 Objectives and Scope of the Survey The Survey was implemented based on the S/W agreed between JICA and BMA. The objectives of the Survey are listed below. (1) To confirm plans in the sewerage sector; to review the existing Master Plan; to study the
status of sewerage system development and strategies; and to grasp the status of the organization system, etc.; in order to suggest strategy for developing the sewerage system and to select priority project.
(2) To conduct F/S for the project considered to be urgent based on the findings coming from the studies mentioned above.
1.2 Area under the Survey The Survey area covers the entire BMA jurisdiction of Thailand.
1.3 Implementing Organizations in Thailand The direct counterpart of this Survey is the BMA Drainage and Sewerage Department (DDS), and the division in charge within the DDS is the "Water Quality Management Office (WQMO)".
2
2. WORK SCHEDULE AND IMPLEMENTATION OF PHASE 1 WORK
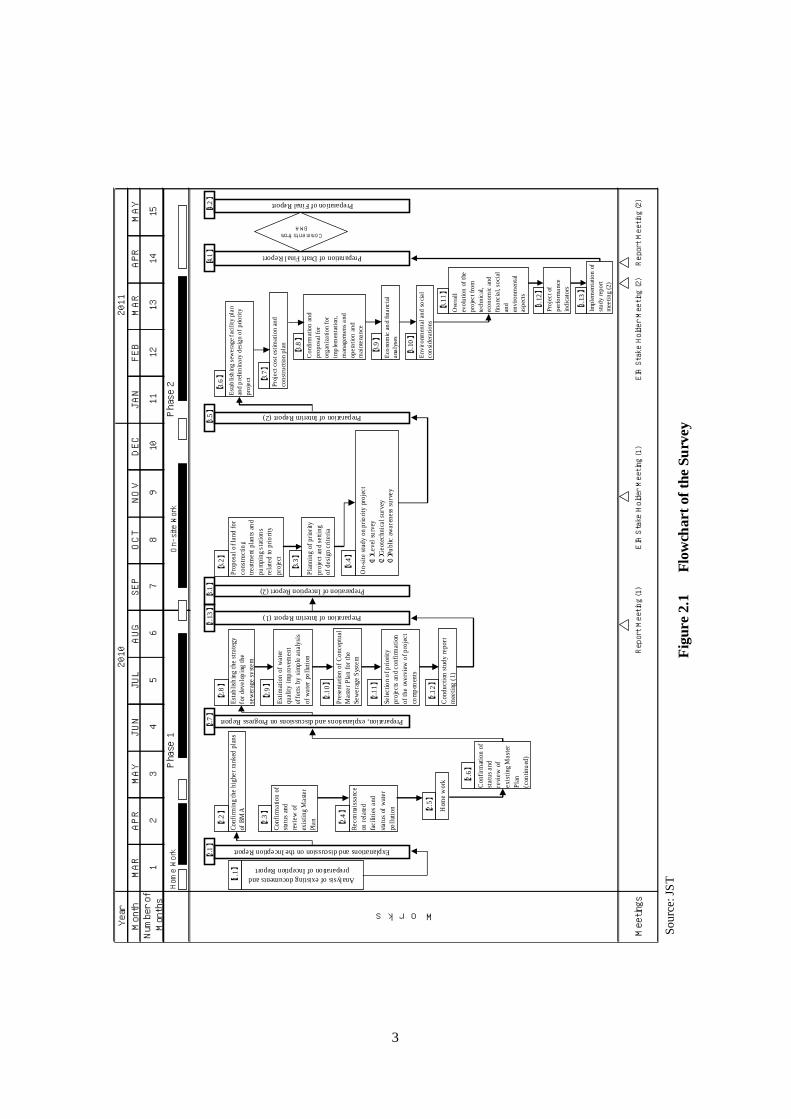
2.1 Work Schedule for the Entire Survey The Survey period (approx. 15 months) is divided into two phases as given below. The Survey flow chart is as shown in Figure 2.1. Phase 1: Confirm plans in the sewerage sector; review the existing Master Plan; study the
status of sewerage system development and strategies, grasp the status of the organization system, etc., in order to suggest strategy for developing the sewerage system. Also, select the priority project and confirm the essence of the plans. (About 6 months)
Phase 2: Implement the feasibility study (F/S) of the priority project. (About 9 months) “Interim Report (I)” in Figure 2.1 was changed to “Final Report (I)” and “Final Report” was changed “Final Report (II)”. Date of EIA Stakeholder Meeting (1) was changed from November 2010 to February 2011. Report Meeting (2) was cancelled. 2.2 Basic Policies for the Survey The Survey is implemented based on the basic policies described in the Inception Report. During the implementation of the Survey, the importance of points mentioned in JICA’s TOR is taken into account. 2.3 Survey Organization BMA established a Steering Committee chaired by Deputy Permanent Secretary to monitor the progress and to give suggestions for the implementation of the Survey. A group of twelve (12) persons were designated as counterparts from members of Water Quality Management Office of DDS to support JICA Survey Team. Consultant Survey Team is composed of 4 persons from Tokyo Engineering Consultants Co Ltd. and 3 persons from Nippon Koei Co., Ltd.
3
Figu
re 2
.1
Flo
wch
art o
f the
Sur
vey
Sour
ce: J
ST
Year
Month
MAR
APR
MAY
JUN
JUL
AUG
SEP
OCT
NOV
DEC
JAN
FEB
MAR
APR
MAY
Number of
Months
12
34
56
78
910
11
12
13
14
15
Phase 2
2011
2010
Meetings
W o r k s
Phase 1
Explanations and discussion on the Inception Report
Preparation of Draft Final Report
Preparation, explanations and discussions on Progress Report
Preparation of Inception Report (2)
Preparation of Interim Report (2)
Conf
irmin
g th
e hi
gher
rank
ed p
lans
of B
MA
【2.2】
Conf
irmat
ion
ofsta
tus
and
revi
ew o
fex
istin
g M
aste
rPl
an【2.3】
Esta
blish
ing
the
stra
tegy
for d
evel
opin
g th
ese
wer
age
syste
m
【2.
8 】
Sele
ctio
n of
prio
rity
proj
ects
and
conf
irmat
ion
of th
e ov
ervi
ew o
f pro
ject
com
pone
nts
【2.1
1 】
Prop
osal
of l
and
for
cons
truct
ing
treat
men
t pla
nts
and
pum
ping
sta
tions
rela
ted
to p
riorit
ypr
ojec
t
On-
site
stu
dy o
n pr
iorit
y pr
ojec
t (1)L
evel
surv
ey (2)G
eote
chni
cal s
urve
y (3)P
ublic
aw
aren
ess
surv
ey
【3.4】
Estab
lishi
ng se
wer
age f
acili
ty p
lan
and
prel
imin
ary
desig
n of
prio
rity
proj
ect
Proj
ect c
ost e
stim
atio
n an
dco
nstru
ctio
n pl
an
Con
firm
atio
n an
dpr
opos
al fo
ror
gani
zatio
n fo
rim
plem
enta
tion,
man
agem
ens a
ndop
erat
ion
and
mai
nten
ance
Ove
rall
evol
utio
n of
the
proj
ect f
rom
tech
nica
l,ec
onom
ic an
dfin
anci
al, s
ocia
lan
den
viro
nmen
tal
aspe
cts
Report Meeting (1)
EIA Stake Holder Meeting (1)
Report Meeting (2)
EIA Stake Holder Meeting (2)
【2.1】
【1.1】
Analysis of existing documents andpreparation of Inception Report
Reco
nnai
ssan
ceon
rela
ted
faci
litie
s an
dsta
tus
of w
ater
pollu
tion
【2.
4】
Hom
e w
ork
【2.5】
Con
firm
atio
n of
stat
us a
ndre
view
of
exis
ting
Mas
ter
Plan
(con
tinue
d)
【2.6】
Preparation of Interim Report (1)
Estim
atio
n of
wat
erqu
ality
impr
ovem
ent
effe
cts
by s
impl
e an
alys
isof
wat
er p
ollu
tion
【2.
9】
Pres
enta
tion
of C
once
ptua
lM
aste
r Pla
n fo
r the
Sew
erag
e Sy
stem
【2.1
0】
Con
duct
ion
stud
y re
port
mee
ting
(1)
【2.1
2】
Plan
ning
of p
riorit
ypr
ojec
t and
setti
ngo f
des
ign
crite
ria
【3.
3 】
【3.
2 】【
3.6】 【3.
7 】
【3.
8 】
Econ
omic
and
finan
cial
anal
yses
【3.
9 】
Envi
ronm
enta
l and
socia
lco
nsid
erat
ions
【3.1
0 】
【3.1
1 】
Proj
ect o
fpe
rform
ance
indi
cato
rs
【3.1
2】
Preparation of Final Report
【2.7】
【2.1
3 】【3
.1】
【3.5】
【4.
1 】【4
.2】
Impl
emen
tatio
n of
study
repo
rtm
eetin
g (2
)
【3.1
3】
Comments fromBMA
On-site Work
Home Work
4
3. ISSUES OF SEWERAGE WORKS IN BMA 3.1 Sewerage System in Thailand
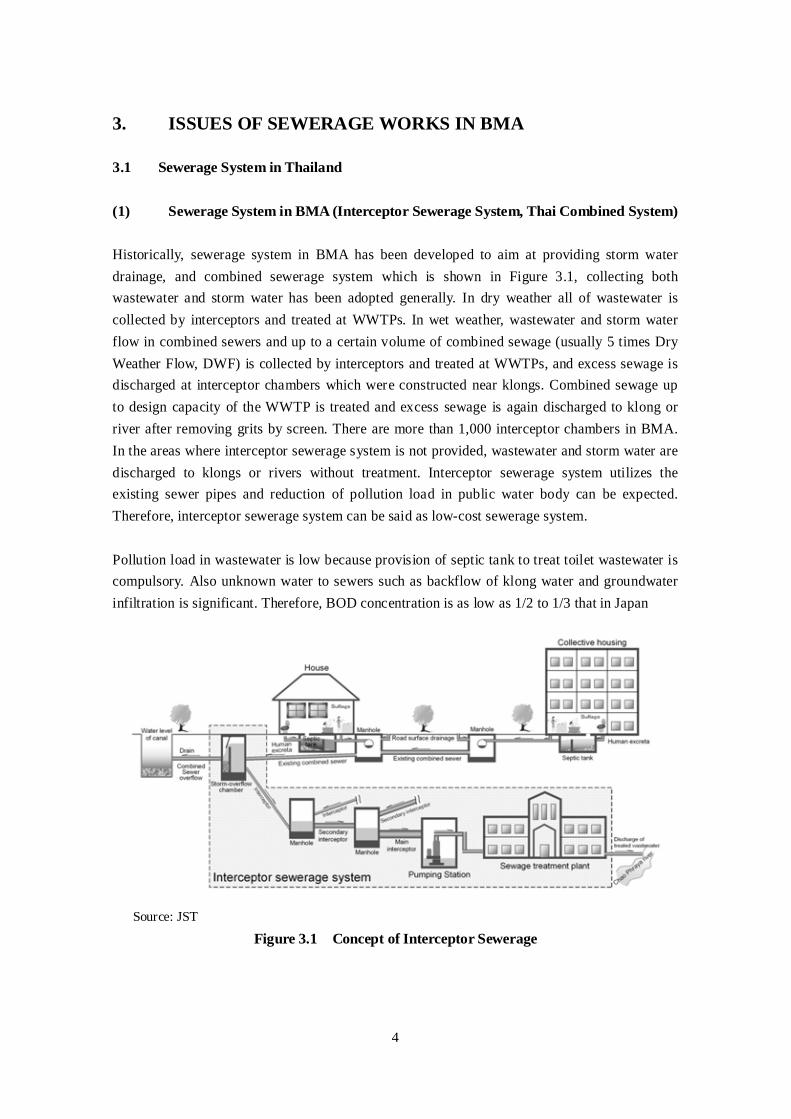
(1) Sewerage System in BMA (Interceptor Sewerage System, Thai Combined System) Historically, sewerage system in BMA has been developed to aim at providing storm water drainage, and combined sewerage system which is shown in Figure 3.1, collecting both wastewater and storm water has been adopted generally. In dry weather all of wastewater is collected by interceptors and treated at WWTPs. In wet weather, wastewater and storm water flow in combined sewers and up to a certain volume of combined sewage (usually 5 times Dry Weather Flow, DWF) is collected by interceptors and treated at WWTPs, and excess sewage is discharged at interceptor chambers which were constructed near klongs. Combined sewage up to design capacity of the WWTP is treated and excess sewage is again discharged to klong or river after removing grits by screen. There are more than 1,000 interceptor chambers in BMA. In the areas where interceptor sewerage system is not provided, wastewater and storm water are discharged to klongs or rivers without treatment. Interceptor sewerage system utilizes the existing sewer pipes and reduction of pollution load in public water body can be expected. Therefore, interceptor sewerage system can be said as low-cost sewerage system. Pollution load in wastewater is low because provision of septic tank to treat toilet wastewater is compulsory. Also unknown water to sewers such as backflow of klong water and groundwater infiltration is significant. Therefore, BOD concentration is as low as 1/2 to 1/3 that in Japan
Source: JST
Figure 3.1 Concept of Interceptor Sewerage

5
(2) Current Situation about Sewerage Project Thai government published its cabinet resolution in 1998, according to stipulations of Environmental Conservation Act of 1992, to enable BMA implement sewerage projects in the central core district of 100 km2 area with subsidy. Thai government agreed that it would give subsidy at 75:25 ratio to BMA. Since then five (5) WWTPs and more than 220 km interceptors have been constructed.
Currently, DDS operates seven (7) WWTPs (total design capacity 992,000 m3/d ) shown in Table 3.1. A total of 675,000 m3/d of wastewater which is generated from the treatment areas of 192 km2 is treated. Also DDS operates 12 small scale wastewater treatment plants transferred from NHA, and three small treatment facilities including purification plants of Makkason Pond and Rama IX Pond.
Table 3.1 Funds for Construction of Sewerage Facilities in BMA
Treatment Area Area (km2)
Population Capacity
(m3/d) Start
Operation Source of Fund (BMA. : GOV)
Cost (Million Baht)
1. Si Phraya 2.7 120,000 30,000 1994 BMA 100 % 464 2. Rattanakosin 4.1 70,000 40,000 2000 GOV. 100% 883 3. Din Daeng 37.0 1,080,000 350,000 2004 25 : 75 6,382 4. Chong Nonsi 28.5 580,000 200,000 2000 40 : 60 4,552 5. Nong Khaem 44.0 520,000 157,000 2002 40 : 60 2,348 6. Thung Khru 42.0 177,000 65,000 2002 40 : 60 1,760 7. Chatuchak 33.4 432,000 150,000 2005 60 : 40 3,482 8. 12-Community Plant 25,700
Total 191.7 2,979,000 1,017,700 19,871 Planned BMA Wastewater Treatment Project (F/S basis) 1. Bang Sue 21.0 250,000 120,000 2012 BMA 100 % 4,732 2. Klong Toei 56.0 485,000 360,000 60 : 40 11,046 3. Thon Buri 59.0 704,000 305,000 11,561
Total 136.0 1,439,000 785,000 27,339 Note: Cost includes those for WWTPs and interceptors
Source: JST
3.2 Current Sewerage Implementation Plan In “Master Plan on Sewage Sludge Treatment and Reclaimed Wastewater Reuse” prepared by JICA in 1999, 13 new treatment areas are proposed together with reuse of sludge and reclaimed wastewater. BMA established sewerage implementation plan up to 2020 based on the Master Plan in which 20 treatment areas are planed. BMA has been implementing sewerage projects based on the 1999 master plan, and seven (7) WWTPs are now in operation, Bang Sue WWTP is under construction, Klong Toei WWTP and

6
Thon Buri WWTP are in process of planning. Total design capacity of the existing WWTPs together is approximately 1 million m3/d which accounts for 40 % of wastewater generated. On the other hand, there is BMA Action Plan prepared in 2008 as higher ranked plan in which service ratio in 2012 is targeted to be 42 % and that of long term in 2020 is targeted to be 60 %. DDS is considering implementation program to realize these targets. According to the program, after completion of construction of Bang Sue WWTP, construction of Klong Toei WWTP and Thong Buri WWTP is planned and further construction of Nong Bon WWTP is expected. In addition, DDS secured next year budget to carry out F/S for Min Buri treatment area. For the remaining 8 treatment areas among 20 treatment areas in the existing M/P, there is no concrete implementation plan due to non-availability of site. DDS should consider ways to materialize these projects. In addition, improvement and strengthening of function to intercept more wastewater for treatment, and expansion and modification of the existing WWTPs are required.
3.3 Exiting Sewerage Facilities
(1) Outline of Seven WWTPs Seven existing wastewater treatment plants are in operation, of which two plants (Si Praya and Rattanakosin) are operated and maintained by DDS own staff and the other five plants are by O&M companies entrusted by DDS. Outline of seven wastewater treatment plants and interceptors are shown in Table 3.2.

Table 3.2 Outlines of Existing Seven WWTP and Interceptors
Si Praya Rattanakosin Din Daeng Chong Nonsi Nong Khaem Tung Khru Chatuchak
1. Start of Operation 1994 2000 2004 2000 2002 2002 2006 2. Treatment Area 2.7 km2 4.142 km2 37 km2 28.5 km2 44 km2 42 km2 33.4 km2 3. Served Population 120,000 70,000 1,080,000 580,000 520,000 177,000 432,500
4. Treatment Process Contact Stabilization
Activated Sludge
Two stage activated sludge
N&P Removal
Activated Sludge with Nutrient N&P Removal
Cyclic Activated Sludge System N&P Removal
Vertical Loop Reactor Activated
Sludge N&P Removal
Vertical Loop Reactor Activated Sludge (VLR-AS)
N&P Removal
Cyclic Activated Sludge System
(CASS) N&P Removal
5. Site 0.28 ha 0.6683 ha 2.72 ha 3.2 ha 8.64 ha 0.48 ha 1.12 ha 6. Construction Cost 464 M Baht 883 M Baht 6,382 M Baht 4,552 M Baht 2,348 M Baht 1,760 M Baht 3,482 M Baht 7. Length of Sewer Pipe 2.3 km 16.25 km 66 km 55 km 46 km 26 km 37.5 km 8. Treatment Capacity 30,000 m3/d 40,000 m3/d 350,000 m3/d 200,000 m3/d 157,000 m3/d 65,000 m3/d 150,000 m3/d 9. Flow (Avearge in 2009)
18,213 m3/d 28,791 m3/d 204,931 m3/d 124,282 m3/d 132,605 m3/d 63,980 m3/d 120,470 m3/d
10. O&M by DDS DDS Private Company Private Company Private Company Private Company Private Company 11. Design Criteria for Influent Wastewater
(1) BOD 150 mg/l 200 mg/l 150 mg/l 150 mg/l 150 mg/l 150 mg/l 150 mg/l (2) COD - 500 mg/l - - - - - (3) T-N 30 mg/l 40 mg/l 30 mg/l 30 mg/l 30 mg/l 30 mg/l 30 mg/l (4) T-P 8 mg/l 10 mg/l 8 mg/l 8 mg/l 8 mg/l 8 mg/l 8 mg/l (5) SS 150 mg/l 200 mg/l 150 mg/l 150 mg/l 150 mg/l 150 mg/l 150 mg/l 12. Design Criteria for Effluent (1) SS < 30 mg/l < 30 mg/l < 30 mg/l < 30 mg/l < 30 mg/l < 30 mg/l < 30 mg/l (2) BOD < 20 mg/l < 20 mg/l < 20 mg/l < 20 mg/l < 20 mg/l < 20 mg/l < 20 mg/l (3) T-N < 10 mg/l < 10 mg/l < 10 mg/l < 10 mg/l < 10 mg/l < 10 mg/l < 10 mg/l (4) NH3-N < 5 mg/l < 5 mg/l < 5 mg/l < 5 mg/l < 5 mg/l < 5 mg/l < 5 mg/l (5) T-P < 2 mg/l < 2 mg/l < 2 mg/l < 2 mg/l < 2 mg/l < 2 mg/l < 2 mg/l (6) DO > 5 mg/l > 5 mg/l > 5 mg/l > 5 mg/l > 5 mg/l > 5 mg/l > 5 mg/l
Remarks: Flow data of 2007 is shown for Chong Nonsi WWTP. Because some data of 2008 and 2009 are missing Source: DDS
7
8
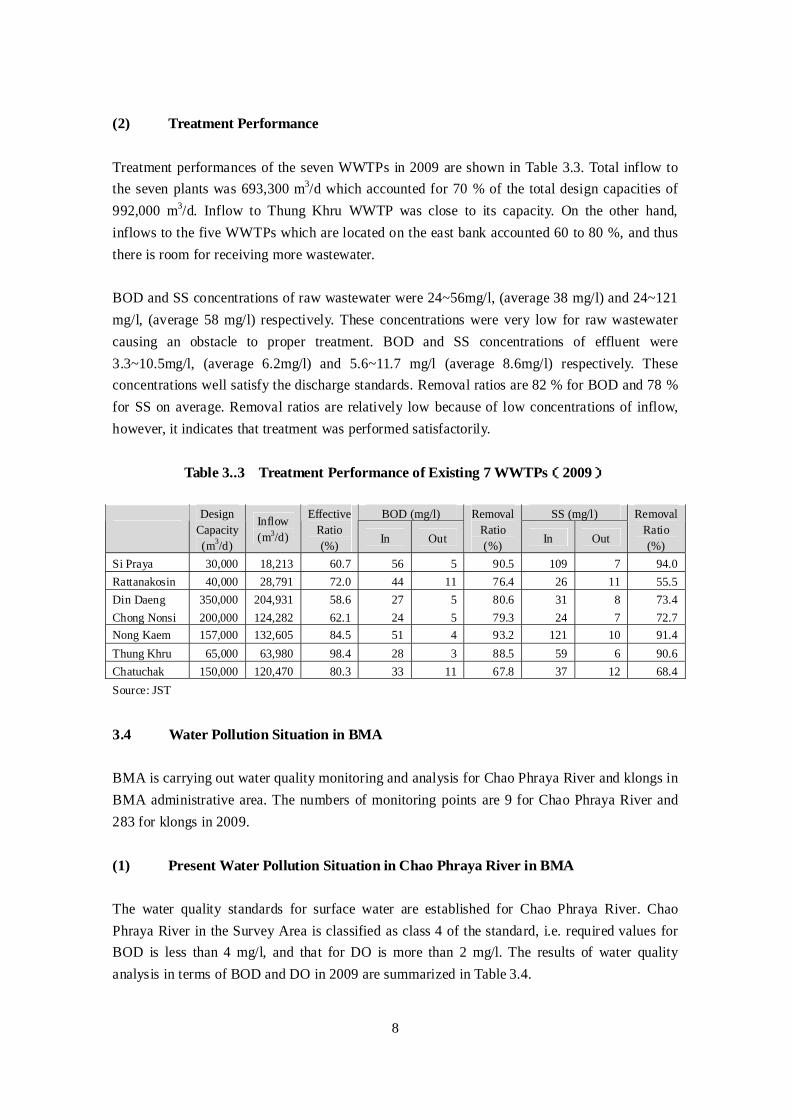
(2) Treatment Performance Treatment performances of the seven WWTPs in 2009 are shown in Table 3.3. Total inflow to the seven plants was 693,300 m3/d which accounted for 70 % of the total design capacities of 992,000 m3/d. Inflow to Thung Khru WWTP was close to its capacity. On the other hand, inflows to the five WWTPs which are located on the east bank accounted 60 to 80 %, and thus there is room for receiving more wastewater. BOD and SS concentrations of raw wastewater were 24~56mg/l, (average 38 mg/l) and 24~121 mg/l, (average 58 mg/l) respectively. These concentrations were very low for raw wastewater causing an obstacle to proper treatment. BOD and SS concentrations of effluent were 3.3~10.5mg/l, (average 6.2mg/l) and 5.6~11.7 mg/l (average 8.6mg/l) respectively. These concentrations well satisfy the discharge standards. Removal ratios are 82 % for BOD and 78 % for SS on average. Removal ratios are relatively low because of low concentrations of inflow, however, it indicates that treatment was performed satisfactorily.
Table 3..3 Treatment Performance of Existing 7 WWTPs(2009)
BOD (mg/l) SS (mg/l)
Design Capacity (m3/d)
Inflow (m3/d)
Effective Ratio (%) In Out
Removal Ratio (%) In Out
Removal Ratio (%)
Si Praya 30,000 18,213 60.7 56 5 90.5 109 7 94.0 Rattanakosin 40,000 28,791 72.0 44 11 76.4 26 11 55.5 Din Daeng 350,000 204,931 58.6 27 5 80.6 31 8 73.4 Chong Nonsi 200,000 124,282 62.1 24 5 79.3 24 7 72.7 Nong Kaem 157,000 132,605 84.5 51 4 93.2 121 10 91.4 Thung Khru 65,000 63,980 98.4 28 3 88.5 59 6 90.6 Chatuchak 150,000 120,470 80.3 33 11 67.8 37 12 68.4 Source: JST
3.4 Water Pollution Situation in BMA BMA is carrying out water quality monitoring and analysis for Chao Phraya River and klongs in BMA administrative area. The numbers of monitoring points are 9 for Chao Phraya River and 283 for klongs in 2009. (1) Present Water Pollution Situation in Chao Phraya River in BMA The water quality standards for surface water are established for Chao Phraya River. Chao Phraya River in the Survey Area is classified as class 4 of the standard, i.e. required values for BOD is less than 4 mg/l, and that for DO is more than 2 mg/l. The results of water quality analysis in terms of BOD and DO in 2009 are summarized in Table 3.4.

9
Table 3.4 Water Quality of Chao Phraya River
Point BOD (mg/l)
DO (mg/l)
R01 4 2.1 R02 4 1.9 R03 4 1.7 R04 5 1.7 R05 6 1.6 R06 6 1.9 R07 6 2.1 R08 6 1.8 R09 5 1.9
Source:BMA
Source: JST
Figure 3.2 Location of Water Quality Monitoring Points in Chao Phraya River
Profile of BOD concentrations along the river is drawn as shown in Figure 3.3. It can be seen that water pollution gradually increases from R02 to R04. The ranges of fluctuation (difference between the minimum and the maximum) become wide from R05. The tendency which shows this large range of fluctuation is continued up to R09 point which is the most downstream monitoring point in the Survey Area. It is thought that this water pollution situation is caused by both the amount of pollution load from the river basin through klongs and flow and tidal conditions of Chao Phraya River.
Source: JST
Figure 3.3 Profile of BOD Concentrations along Chao Phraya River
: Sampling point
R0 1
R05
R04
R03
R02
R06R07
R08
R09
N
0 1 2 3 4 5 km
0
5
10
15
20
25
30
35
0 5 10 15 20 25 30 35 40 45 50
(km)
BOD
(mg/
l)
Max
Min
Ave
R01
R09
R08
R07
R06
R05
R04
R03
R02

10
(2) Present Water Pollution Situation in Klongs in BMA As for klongs in the Survey Area, the classification of the surface water quality standards is not specified. BMA has set up the target values in their Performance Plan as shown in Table 3.5 for water quality improvement. BOD concentrations are specified for treated effluent and DO concentrations are specified for receiving klongs. It is thought that BOD 10 – 15 mg/l and DO 1.0 – 2.5 mg/l are desirable as targeted values for water quality improvement of klongs.
Table 3.5 Target by Performance Plan (BMA)
Current Situation
2009 2012 2020
2. Recovered water quality in the target canals.
2.1 Enhancing the quality of effluent from the BMA’s wastewater treatment plants (BOD mg/l)
Less than 15 Less
than 15 Less
than 10 Less
than 10
2.2 Recovered water quality (DO mg/l) More than 1 More than 1
More than 1.5
More than 2
2.3 Maintained water quality (DO mg/l) More than 2 More than 2
More than 2
More than 2.5
Source: Performance Plan of Bangkok Metropolitan Administration, 2009-2012
The numbers of monitoring points for klongs in 2009 are 283 points. The points at which BOD concentrations exceeding 15 mg/l (assumed as a provisional target of water quality improvement) out of all monitoring points are 55 on the east bank of Chao Phraya River (Bangkok side area), and three (3) on the west bank (Thon Buri side area). Among them twenty seven (27) points are in existing treatment areas (refer to Figures 3.4). Correlations between BOD and DO is not significant (coefficient of correlation: r = -0.388). It is obvious that DO concentrations are influenced by other factors than BOD. However, negative correlation implies that reduction of BOD leads to improvement of DO level.
Table 3.6 Correlation of the BOD and DO in Klongs Number of Data
Classification of Water Quality (BOD) Total
Less than DO 1 mg/l
DO 1mg/l or More
Average DO (mg/l)
10 mg/l and below 2,236 596 27% 1,640 73% 1.9 From 11 mg/l to 15 mg/l 524 275 52% 249 48% 1.3 From 16 mg/l to 20 mg/l 247 205 83% 42 17% 0.6 From 21 mg/l to 30 mg/l 208 206 99% 2 1% 0.1 More than 31 mg/l 177 177 100% 0 0% 0.0
Whole 3,392 1,459 43% 1,933 57% - Source: JST

Source: JST
Figure 3.4 (1) BOD Concentration in Klong (1/2)
72
144
145
143132
131
621
661
1371
1381
1391
1411
1412
1401 1421
1431
1491
1501
1471
146
141
1461
1441
142
31
41
51
12
52
53
6121
15
14
43
42
76
75 117
74
62
73
63
721
722
98
801
13
81
82
83
85
LEGENDmore than 20 mg/lfrom 16 mg/l to 20 mg/lfrom 11 mg/l to 15 mg/l10 mg/l and below
N
0 1 2 3 km
441
471
434
473451
472
392
292
431
391
6711663
1662
152
341
672
311
4221672
1661
1671
151
161
433
192
191
432
291
312
342321
332 322
331
211 201
212
761
202
762
222
641642
791221
631
162
421
423
841
851
265
264
263
401
402
551
241
522
541
491
561
531523
262
521
251
261
16821681
411
831
252
821393
394
811
395 771
N
0 5 10 km
LEGENDmore than 20
from 16 mg/l to 20from 11 mg/l to 1510 mg/l and below
11

Source: JST
Figure 3.4 (2) BOD Concentration in Klong (2/2)
12

13
3.5 Issues for Improvement of Water Environment and Sewerage System Issues for sewerage projects have been identified from the examination of present situation of sewerage system and water pollution in Chao Phraya River and klongs in BMA area and are summarized below.
Although measures for improving water quality have been implemented, the water quality improvement effects for Chao Phraya River and klongs are not noticeable. Expansion, speeding up of the measures, and making them more efficient are necessary.
From the 20 planned treatment areas, WWTPs are being operated only in 7 areas, and the sewage collection rate is low. The sewage treatment rate has reached only about 40%.
The main reasons for lacking progress are the limited availability of candidate sites for WWTPs and insufficient budget.
The sewage collection system is a combined system; during rains, sewage together with storm water enters into the klongs and rivers.
Even in current treatment areas, sewage that cannot be captured flows into the klongs. Because of the inadequate construction of interceptor chamber or the lack of maintenance,
the klong water flows in the opposite direction in the interceptor pipes, or the sewage collected in the combined sewers flows into the klongs.
Control over pollution source is not sufficient because of inadequate or cross connection from house connection to drainage pipes.
Monitoring related to regulations, such as monitoring of business wastewater, is inadequate.
Because of the above mentioned reasons, pollution concentrations in WWTP inflow are extremely low.
Coordination between implementation measures against storm water flooding/inundation and countermeasures to improve water quality is inadequate.
Sewerage service charge is not collected. Sewerage laws and ordinances related to compulsory connection to the sewerage system,
discharge standards, maintenance and management of facilities, and so on, are inadequate.
Service level of the sewerage system in BMA is still low because of such reasons as inadequate interception of untreated wastewater by intercepting sewerage system, double burden of residents to install septic tanks and house connections, (as installation of septic tank is compulsory), higher priority of storm water runoff drainage for prevention of flooding and traffic congestion, and water pollution in so called “East Venice”.
In institutional aspect, sewerage system is not managed in a unified manner, and Public Works Department and Pollution Control Department are involved in sewerage management in addition to DDS. Regarding control of water quality, cooperation between implementing agency,

14
i.e. DDS and regulating agency, i.e. PCD is not enough. The current situation is described in the following Sub-Sections. 3.5.1 Technical Issues (1) Untreated Wastewater Discharge In the existing treatment areas, collected wastewater is discharged from interceptors resulting in water pollution in nearby klongs. Untreated wastewater is discharged from many existing drainage sewers in non-treatment areas, and flows into klong networks resulting in water pollution in treatment areas. (2) Situation about Infiltration from Klongs In many places, storm water drainage pipes are located near the surface of klongs. Necessary water head to flow cannot be obtained in these constructions. As a result, klong water infiltrates into sewer pipes causing problems. Thus, wastewater inside the interceptor is diluted. This is one of the reasons for very low BOD concentrations in inflow to WWTPs, as low as less than 50 mg/l. Low BOD concentrations are caused not only by decomposition of organic materials in septic tank, but also by dilution with infiltration of klong water. Low BOD concentrations of inflow affect operation cost because of additional flow caused by infiltration and result in low efficiency of treatment process due to lack of nutrition for activated sludge. (3) Water Pollution Caused by the Existing Treatment Facilities Septic tank which treats only excreta functions as anaerobic process with hydraulic retention time (HRT) of 10 days to a few months. Reduction of pollutant load in septic tank is assumed to be 50 % as same as for anaerobic digester; a half pollution load of excreta is discharged as supernatant to public water body. As a result, 84.5% of pollutant load including sullage is discharged to public water body. Therefore, it is indispensable for conservation of water quality of public water body to collect and properly treat sullage which is currently discharged without treatment. For newly constructed buildings or new developments, it is compulsory to obtain permission according to Building Control Act and to construct on-site treatment facility in accordance with provisions of Land Development Act to satisfy effluent standards (BOD 20 to 50 mg/l) stipulated depending on types of building. Responsibility to issue permission is assumed by Public Works Department through District Offices. Therefore, countermeasures against water pollution can be expected to a certain extent. For detached houses, provision of septic tanks is compulsory but sullage is discharged through only screen and oil trap without further treatment.

15
Sources of domestic pollution load can be classified as shown in Table 3.7. It can be said that it is very difficult to improve water environment without provision of treatment of sullage in the existing urban areas.
Table 3.7 Classification of Domestic Pollution Load Sources
Area Status of Building Treatment Facility
Detached House Excreta: Septic Tank Sullage: No Treatment
Existing Urban Building
Insufficient treatment for excreta and sullage depending on type of building
Detached House Appropriate treatment for excreta and sullage, for development more than 10 houses
New Urban Building
Appropriate treatment for excreta and sullage depending on type of building
Source: JST 3.5.2 Management and Institutional Issues (1) Legal Framework Currently there is no direct sewerage ordinance for sewerage services in BMA. As explained earlier, both the Enhancement and Conservation of National Environmental Quality Act, 1992 and Environmental Quality Promotion and Prevention Act, 1992 specifies that the wastewater must be treated, but these are national level policy acts and do not explain specific operation procedure for Bangkok sewerage. Though BMA Service Administration Regulations Act, 1985 prescribed that BMA should provide sewerage service, it fall short to provide specific business model for sewerage service. (2) Fragmented Responsibilities The sewerage system is not managed by one single agency. Septic tank de-sludging and septage treatment are looked after by DOE. Septic tank, house connection and branch sewers are responsibility of PWD while planning and operation of interceptors, interceptor chambers, and WWTP is under DDS. This fragmented jurisdiction is shown in Figure 3.5. Even within the DDS’s scope, WWTPs are managed by WQMO and sewers are managed by Sewerage System Division. And these 2 divisions of DDS are under separate administrative chain. Such fragmentation hinders close cooperation and efficient operation.

16
Source: JST
Figure 3.5 Management Responsibilities in Sewerage Service

17
Figu
re 4
.1
Step
-Wis
e Sew
erag
e D
evel
opm
ent
Sour
ce: J
ST
4. SOLUTIONS AND STRATEGY FOR SEWERAGE SYSTEM DEVELOPMENT IN BANGKOK
4.1 Solutions for the Problems

18
4.2 Strategy for Sewerage System Development Strategy 1: Improve the Water Environment by Improving the Sewerage System Strategy 1.1: Improvement of the Interceptor Sewerage System (Thai Combined Type
Sewerage System) Improvement measures for CSO in combined system, existing drainage facilities, and structures and operation of interceptor chamber will be proposed taking into account of the current situation of the interceptor sewerage system in BMA. (1) Countermeasures for CSO in BMA Interceptor sewerage system which collects wastewater together with storm water from combined sewers is adopted in BMA. Land is flat and it is difficult to secure enough head of water level from Chao Phraya River because of topography. Thus interceptors can not be operated to have free flow. Countermeasures to prevent backflow from klongs and to collect wastewater properly are considered to be effective for sewerage system in BMA. Economical countermeasures include storm water infiltration facility which can be provided in conjunction with urban development project and use of deep tunnel as storage tank for storm water. (2) Improvement of Storm Water Drainage in Parallel with Improvement of Water
Quality in Klongs Aim of improvement of combined sewerage system (Thai combined sewerage system) is to improve water quality in klongs. It is not too much to say that improvement of water quality in klongs depends on making concentrations of inflow to WWTPs higher than those which are very low at present. The reasons for very low concentrations of inflow are i) back flow into interceptor chamber from klong, ii) infiltration of groundwater into sewers, iii) reduction of pollutants in septic tanks, and iv) decomposition of pollutants in sewers, as shown in Figure 4.2. Conversion to pump drainage and reduction of interceptor chamber which are described in the next Section are considered to be countermeasures for prevention of back water from klong.

19
Low Influent Concentration Inflow from Klong Water
Infiltration of Ground Water
Septic Tank
Pump Drainage System
Reduction of IC Chamber
Adjustable Weir
Source: JST
Figure 4.2 Improvement of Low Concentrations of Inflow Concept of storm water drainage system proposed herewith is described below and introduction of pump drainage system is consistent with urban flood control.
i) Close interceptor chambers as much as possible to prevent back flow from klongs. ii) Transfer 2 to 5 DWF from existing interceptors to WWTPs. iii) Storm water which is currently discharged from interceptor chamber is collected by
new drainage pipes and pumped to klong. (3) Countermeasures for Untreated Wastewater Discharge, Combination of
Interceptor Chambers Countermeasures for untreated wastewater discharge are described below. In addition, long term solutions are presented in this Section. Main Reasons for Untreated Wastewater Discharge Because of the following reasons, water level in interceptor chamber is high even in dry weather.
High water level caused by operation of sewerage pump located at downstream end Opening of orifice is clogged with garbage
Main reasons for untreated wastewater discharge are not structure of interceptor but are operation of pumps and maintenance of interceptor chamber. Temporary Countermeasures Three countermeasures are proposed as follows.
Lower water level in pump pit not to influence water level in interceptor Clean interceptor chamber periodically to prevent clogging with garbage Raise level of weir in interceptor chamber which discharges untreated wastewater in dry

20
weather Main reasons for wastewater discharge are not structures of interceptor chambers, but operation of pumping stations and maintenance of interceptor chambers. For the moment, pumps should be operated to lower water level in pump pit and periodical cleaning of interceptor chamber should be carried out to prevent untreated wastewater flow in dry weather. Also investigation of structure of interceptor chamber should be carried out. If weir level is too low to cause discharge before flow reaches to 5DWF, weir should be raised. Solutions for O&M Issues (and Long Term Countermeasures) DDS carries out periodical cleaning of interceptor chambers. However, according to “Water Quality Management Office – Annual Report 2551 (2008)”, Cleaning can not be carried out smoothly due to the following obstacles.
Heavy traffic in day time, most work is carried out in night time Number of vehicles passing and parking prevent opening of manhole
There are more than 1,000 interceptor chambers in BMA. Significant labor and time are required for cleaning of them. For effective operation and maintenance of interceptor chambers, number of them should be reduced in future.
(4) Countermeasures for Backwater from Klong, Change to Discharge by Pump Countermeasures for backwater from klong are described below. In addition, long term solutions are presented. Main Reasons for Backwater from Klong
Controlled water level in klong is higher than that of weir in interceptor chamber Flap gate is not completely closed.
Temporary Countermeasures
Lower water level in klong than weir level in interceptor chamber Clean interceptor chamber periodically to prevent clogging with garbage
Controlled water level in klong is to be lowered in dry season than that of weir in interceptor chamber to prevent backflow from klong. Backwater can be prevented if water level is controlled below the recommended level. However, for 29 interceptor chambers investigated (1 in Chatuchak, 1 in Din Daeng, and 27 in Chong Nonsi), it is difficult to prevent backflow by only lowering water level, periodica l cleaning of interceptor chamber is also necessary to make flap gate function properly.

21
Long-Term Countermeasures Controlled water level is higher than those of weirs in all interceptor chambers in Chong Nonsi treatment area, prevention of backwater is very difficult. In long-term, it is necessary to demolish all interceptor chambers and to change the drainage system in this treatment area to pump drainage system. At five interceptor chambers in Rattanakosin treatment area, controlled water level in klong is higher than those of weirs in dry season. This treatment area includes main tourism area, and it is difficult to lower water level in klong because of aesthetic reasons. For this treatment area, demolishing of interceptor chambers and change of drainage system to pump drainage system will be necessary in future as proposed for Chong Nonsi treatment area. (5) Collection of Untreated Wastewater and Investigation of Existing Drain Pipes for
Improvement Wastewater generated from households generally flows through drain pipes installed along the roads and is intercepted in interceptor chambers and conveyed to WWTPs in treatment areas or discharged to klongs directly in non-treatment areas in BMA. However, it was observed at many places that wastewater does not flow in drainage pipes, but is discharged directly to klongs where houses and buildings are located next to klongs. Also stagnation of wastewater in low lands is observed in some places. It is very important to collect untreated wastewater and to connect to the sewerage system securely in treatment areas to improve living environment and water quality in public water bodies. Therefore, it is necessary to realize complete collection (100 %) of wastewater in the future by conpalsory connection to the sewerage system by law and subsidiary from BMA or district office for plumbing works inside houses. (6) Short Term and Medium- and Long-Term Improvement Measures Short term and medium- and long-term improvement measures for interceptor sewerage system are proposed as mentioned in Table 4.1 and showed in Figure 4.3.
Table 4.1 Short-Term and Medium- and Long-Term Improvement Measures
Treatment Area
Short-Term Medium- and Long-Term
Existing
(Interceptor Sewerage System) Hard ・ Lower water level in pump pit at WWTP ・ Periodical cleaning of interceptor chamber
(orifice and flap gate in particular) ・ Investigation of all interceptor chambers, and
(Conventional Sewerage System) ・ Demolishing or reducing of interceptor
chambers ・ Separation of natural drainage area and pump
drainage area (change to pump drainage area if water level in discharging water body is

22
Treatment Area
Short-Term Medium- and Long-Term
modification of level of weirs if overflow in dry weather occurs
・ Lower water level in klong in dry season Soft ・ Establishment of organization to discuss
collection of untreated wastewater ・ Investigation of the existing drainage pipe
networks for improvement
high) ・ Effective use of drainage facilities (e.g. use of
deep tunnel in small rain fall)
New
・ Combine outlets of interceptor chambers as much as possible
・ Raise level of interceptor chambers higher than controlled water level in klong
・ Modify structure of interceptor chamber not to cause overflow in dry weather
・ Introduce separate system in a part of treatment area
Ditto as above
Source: JST
Strategy 1.2: Appropriate Treatment of Human Excreta and Septage (1) Treatment at WWTP and Disposal of Septage Septage can not be treated properly by activated sludge process and characteristics of effluent are not good as can be seen at On Nuch treatment plant. Combination of nitrogen removal and advanced treatment (coagulation, sand filtration, followed by activated carbon adsorption, or ultrafiltration) is adopted for septage treatment plant which discharges to a river. In large cities in Japan where sewerage system are provided, septage is usually received at WWTP and treated with wastewater. Received septage is diluted with wastewater and treated. Sludge is received at the following three points: Sewer network (manhole) Wastewater treatment (grit chamber) Sludge treatment (digester)

23
Figu
re 4
.3 C
once
pt o
f Sho
rt T
erm
and
Med
ium
- and
Lon
g-Te
rm I
mpr
ovem
ent C
ount
erm
easu
res
Sour
ce: J
ST

24
(2) Effects of Receiving Septage Following effects can be expected if septage is received at WWTP.
Characteristics of treated effluent will be improved because of proper septage treatment compared to effluent from the existing On Nuch treatment plant.
Renewal of deteriorated and suspended facilities at present i.e. sand filtration and ozone treatment will not be needed.
Double investment for common treatment facilities to septage and wastewater treatment can be avoided.
Transfer of septage from smaller lorry (2 m3、3 m3)to large one (10 m3) become unnecessary resulting in more efficient operation. Total running distance of lorries can be shortened because larger number of WWTPs are scattered than two existing septage treatment plants.
Higher BOD and SS concentrations of inflow are expected at receiving WWTP, and design capacity of the existing WWTP can be utilized.
Strategy 1.3: Measures for Business Wastewater There are many restaurants, food markets, hospitals, gasoline stands, cleaning shops and other business entities within sewerage treatment areas. Some of them discharge wastewater into sewers with high concentrations of organic matters, oils and grease, heavy metals and high water temperature which are difficult to be treated by biological treatment. These cause clogging of pipes, corrosion of concrete structures, and lowering of treatment function. If effluent from WWTP does not satisfy Effluent Standards (published in June, 2010) due to these factors, administrator of the sewerage system is to blame. All business entities should be investigated regarding their production processes, characteristics of wastewater, existence of pre-treatment facility. In this regard, application and registration to sewerage administration authority, responsibility of installation of pre-treatment facility, and wastewater standards for discharging to sewerage system should be formulated. Sewerage ordinance in which wastewater standards, responsibility of installation of pre-treatment facility and its registration, inspection on the spot, management of wastewater are stipulated will authorize administration authority to assume its responsibility.

25
Strategy 2: Improve the Water Environment by Expansion of the Sewerage System Strategy 2.1 Expansion of the Sewerage System (1) Rearrangement of the Existing Treatment Areas Investigation of existing treatment areas was carried out to grasp marginal treatment capacity and possibility of expansion of the existing WWTPs by reviewing current wastewater flow, design capacities and future wastewater flow. If a certain existing WWTP has marginal design capacity to accommodate wastewater flow from neighboring treatment areas, wastewater would be re-distributed so that construction cost of new WWTPs would be reduced. Utilization of marginal treatment capacity of Din Daeng WWTP and other WWTPs would be investigated. (2) Adoption of Compact and Energy Saving Treatment System DDS has difficulty to secure sites for construction of WWTP in urbanized areas. Acquisition of land for WWTP is the key factor for successful implementation of the sewerage project. Under the circumstances multi-storied or underground WWTPs have been constructed in BMA neglecting efficient use of energy. Comprehensive coordination with relevant authorities is required regarding acquisition of land for WWTPs. Also planned and effective use of publicly owned land should be considered. Prior investment for land acquisition should be investigated. At the same time, compact treatment system, enhancement of operation and maintenance and energy saving technology to utilize limited land should be investigated.
Strategy 2.2: Separate Sewerage System Pilot Project Separate sewerage system is a potential technique to improve the interceptor sewerage system (Thai combined type sewerage system). It is easier to develop the separate sewerage system in new urban development area, where a pilot project of separate sewerage system will be proposed. The pilot project is to be a model case technically and institutionally for BMA. Project site should be selected among the following areas to evaluate the effects of pilot project easily.
New urban development area with residential/commercial area, (Individual WWTP) On going new urban development area and existing treatment area where it is possible to
receive wastewater in public sewerage system (Flow into exiting interceptor)
26
New urban development area close to existing interceptor where it is possible to improve interceptor chambers
Exemplary area where people fully understand role/function of sewerage system, do not discharge garbage/oil into sewer and pay sewerage tariff
Strategy 3: Enhance the Level of Sewage Services for the Society Sewerage system has a role of not only the improvement of public sanitation, water quality preservation and storm water drainage but also circulatory function to put back contaminant (organic matter) discharged by city activities to the natural environment. Using treated wastewater and sewage sludge which are generated every day in cities can contribute as resources to recycling society and prevention of global warming. Understanding of inhabitants is indispensable for not releasing oil to sewers and using treated wastewater as one of countermeasures against CSO. The following are suggestions to improve various roles and services of sewerage. (1) Reuse of Treated Wastewater In Bangkok, treated wastewater is used in a positive manner as sprinkling water for roadside trees and landscape water. In the dry season it is utilized as the water source of green area and parks of BMA, since excessive drawing of groundwater is regulated. Treated wastewater is used for not only irrigation but also for cooling water of air conditioner and replacement of groundwater, and reclaimed water supply to new urban areas. Reuse for cooling water by hygienic operation will contribute to mitigate global warming because water has higher heat exchange rate than that of air. (2) Use of Sewage Sludge At the Nong Khaem WWTP, all of sewage sludge are transported from other six WWTPs and digested and dewatered. Experiment to use digestion gas for low cost generator with automobile engine is carried out. In addition, sewage sludge is used as soil conditioner for trees lining a streets and parks. All of the composted sewage sludge is taken over from composing site. The following problems are expected along with expansion of sewerage system
i) Increase of sewage sludge volume ii) Toxic substance contained in sewage sludge iii) Composting of urban waste

27
The following uses of sewage sludge as resources are considered , i) use as biogas and solid fuel, paying attention to fuel value of sewage sludge, ii) increasing biogas by mixing treatment with urban waste, and iii) use as solid fuel, dry sewage sludge and send to factories having a coal boiler and/or the biomass boiler. (3) Countermeasures for Global Warming Mitigation In Action Plan on Global Warming Mitigation 2007-2012, construction of wastewater treatment plants to control emission of methane gas, and campaign for citizens not to dump wastes to klongs are planned. Comprehensive effects of global warming mitigation measures are expected directly from improvement of wastewater treatment and sewerage system and indirectly from utilization of sewerage resources and cooperation with other authorities such as DOE which is responsible for septage treatment. Countermeasures in sewerage system are described in Table 4.2.
Table 4.2 Countermeasures on Global Warming Mitigation in Bangkok
Sewerage Facility Effective Examples of the Countermeasures Sewer System Considering warming coefficient (CH4 / CO2 =21), reducing CH4 generation in
klong by means of collecting wastewater discharged into klong. Energy saving design by setting lift head of lifting pump adequately Adoption of the energy saving machinery Energy saving operation like air control of reaction tank
Treatment Facility
Prevention of N2O generation by setting anaerobic and aerobic operation adequately in the reaction tank Reduction of water supply by using treated wastewater Reuse of Treated
Wastewater Reduction of heat exchange energy by using treated wastewater for cooling water Energy creation by digestion gas Reduction of fuel by using sewage sludge as solid fuel
Use of Sewage Sludge
Considering warming coefficient (CH4 / CO2 =21), replacing CH4 generation at sludge disposal site to CO2 of solid fuel . Energy consumption efficiency difference between septage treatment facility and wastewater treatment plant
Acceptance of Septage
Reduction of the mileage of septage transportation tank car Public Information and Public Hearing
Reduction of energy/electricity consumption by campaign to public to reduce environmental load such as edible oil or discharged wastewater
Source: JST
Strategy 4: Improve the Management of the Sewerage Works Strategy 4.1: Management Improvement in Sewerage Services
Sewerage system needs a large amount of fund for construction and operation and maintenance of facilities. The most important thing is financial sustainability for continuing the sewage

28
project. In order to keep sustainable sewerage management, it is required to grasp about construction costs, operation/maintenance costs and future renewal costs, to reduce construction and operation and maintenance costs, and to collect sewerage charge from users. Understanding of sewerage users can be acquired when they understand their contribution and effects of sewerage system for improvement of environment. (1) Capital Cost Financing The magnitude of required financing to implement the sewerage M/P is significant. Until now, all WWTPs and sewers were constructed on the basis of Central Government grant and BMA own budget. To expedite the implementation, it is important to secure alternate financial source. Some of these options are explained here.
i) Central Government Allocations: ii) BMA Allocations: iii) Environmental Fund: iv) International Financing Institutes: v) ODA from Development Partners:
(2) Sewerage Tariff On the other hand, operation cost recovery is essential for business sustainability. Until now, BMA has not introduced sewerage tariff. It is strongly recommended to introduce sewerage tariff as soon as possible. In 2004, BMA obtained approval of “BMA Ordinance: Collection of Wastewater Tariff, 2004” from BMA Council and Minister of Interior. This ordinance mentions that whenever BMA set up a sewerage treatment area, BMA can ask anybody living within the area to pay the sewerage tariff. The charge volume is equal to the water consumption. Even in case of not using supply water, sewerage tariff has to be paid. The proposed tariff is shown in the following Table 4.3. It is proposed, 1 Baht/m3 is applied for residence for the first 3 years and then increase by 0.25 Baht/m3 every 6 months reaching to 2 Baht/m3 by 5 years. Though BMA had an intention to introduce the sewerage tariff from 2004, it has not been implemented yet. Level of tariff rates, i.e. rates for residence, government agencies, small scale commercial establishments and restaurants, are equal to operation and maintenance cost, and those for large commercial/business establishments, multi functioning buildings, industries and so on are equal to operation and maintenance cost plus a portion of initial cost recovery. The rates were proposed in 2004, hence it is required to review to reflect price escalations. It is recommended that tariff rates should be reviewed every 3 years.

29
It is expected that the sewerage tariff will be collected together with the MWA bills. However, according to Database and Tariff Office of WQMO, no MOU has been signed with MWA yet. It may be noted here that there are only 2 user type defined for water tariff, residential and non residential. On the other hand, proposed sewerage tariff has many user categories. To solve this problem, Database and Tariff Collection Section under WQMO should carry out exercise to develop customer database similar to proposed sewerage tariff categories.
Table 4.3 Rates of Proposed Sewerage Tariff
User Category Sewerage Tariff Rate
(Baht/m3) Residence with water use over 10 m3/month 2 Govt. agency, state enterprises, office 2 Religious places, educational institute, foundations 2 Hospitals 4 Hotels 4 Shopping Malls, Department Stores 4 Fresh Markets 4 Restaurants Space less than 100 m2 Space more than 100 m2
2 4
Massage Parlous and spa 4 Commercial/ Business Space less than 100 m2 Space more than 100 m2
2 4
Multi function building 4 Industry Wastewater less than 200 m3 Wastewater between 200 and 500 m3 Wastewater more than 500 m3
4 6 8
Others 4
Source: Wastewater Tariff Code of Law, BMA, 2004
Affordability In order to develop and operate effective sewerage system, sizeable amount of funds are required. From a viewpoint of ‘polluter pays principle’, all residents should share the cost of proper wastewater treatment to mitigate environmental impacts on downstream areas. It was found that within Bang Sue WWTP area, only 60% of interviewees have a willingness to pay wastewater fee at 1.1 Baht/m3 (Bang Sue Environmental Education and Conservation Project, Vol. 2, 2006). This is about half of the tariff proposed in 2004. A more recent WTP study was carried out by Database and Tariff Collection Section of WQMO from 18th January to 12th February 2010 in 20 districts of existing sewerage area on 2,300 samples. According to results of the survey, only 56% of interviewees have a willingness to pay wastewater fee. Then a new interview on suitable tariff shows 2,186 interviewees (95%) have a willingness to pay a certain rate. However about 80% of the respondents mentioned that the rate should be between 0.5 and 1.0 Baht/m3.

30
(3) Renewal and Rehabilitation Works for WWTPs It is said that expected life time of machinery/electric facilities is about 20 years, and renewal and rehabilitation of facilities is repeated continuously. Si Praya WWTP starts operation in 1990, and 20 years has passed. The deterioration of pump and screen facilities, dewatering machine, etc. is progressing, and the time of renewal/rehabilitation will come soon. Then for the other WWTPs the renewal time will come in sequence.
(4) Performance Indicators (PIs) for Enhancement of Sewerage Service Performance indicators (PIs) can be considered as a management tool to evaluate the degree of undertaking’s efficiency and effectiveness. Efficiency is the extent to which the resources of an undertaking are utilized to provide the services, e.g. maximizing services delivery by the minimum use of available resources. Effectiveness is the extent to which declared or imposed objectives, such as levels of services, are achieved. PIs can also be used for quantitative comparative assessment of performance. This quantitative comparison can be conducted between undertakings, or historically within an undertaking comparing the past and present or actual performance against pre-defined target. Performance of an undertaking can be evaluated from various aspects and wastewater services are composed of numerous complicated activities. Therefore, a number of PIs have been developed and made available. Wastewater services in different countries have different histories, and they have different roles. Therefore, selection of proper PIs for each undertaking is most desirable. Strategy 4.2: Private Sector Cooperation Public-private cooperation in following field is effective to reduce both initial cost and O&M cost of sewerage facilities. (1) Cooperation with Urban Development Project Building Law and Regulation 2001 and Land Development Act 2000 require urban development project to install sewerage facilities in project site. Layout and capacity of sewer pipes, connection to public sewerage system, use of rain water and treated wastewater should be enforced on or discussed with developer in order to harmonize the facilities with public sewerage system. This will also benefit developer, and win-win relation will be established.
(2) Promotion of Registered Plumbers

31
Installation of house connection is carried out with closest attention in Japan, because inadequate house connection cause breakdown of pipe, increasing of infiltration flow, and cross connection of wastewater pipes and storm water pipes. Only registered plumbers are permitted to undertake house connection exclusively in Japan. Registered plumbers are requested to employ skilled engineers and workers, to have employee attend scheduled training sessions to obtain necessary qualifications, and to possess adequate equipments for work. Registered plumbers are expected to resolve minor troubles such as clogging of sewers in collaboration with public sector. As mentioned above, it is important to promote registered plumbers in BMA since plumbers assume important role. (3) Consignment of Operation and Maintenance Works to Private Company Wastewater treatment plants, pumping stations and interceptor sewers of Si Praya and Rattanakosin treatment areas are operated and maintained by DDS own staff and facilities in other five treatment areas are by O&M companies which DDS entrusts to. The contract period of operation and maintenance works of the facility is five years. Operation and maintenance costs are categorized into fixed cost (personnel cost) and variable cost (power costs for pumping and wastewater treatment and sludge treatment). Variable costs are calculated and paid for based on volume of treated wastewater and sludge. Operation and maintenance know-how gained by DDS own staffs are disclosed to O&M company staffs for effective operation and maintenance. Strategy 4.3: Improvement of Institution of Sewerage Works Countermeasures to resolve these issues are presented below. (1) Bringing of Fragmented Responsibilities of Sewerage Services into One Agency To introduce one stop service for the entire sewerage sector, it is recommended to bring entire sewerage related services under the umbrella of one responsible agency. Relevant tasks currently undertaken by PWD are proposed to be transferred to WQMO of DDS. To bring the entire sewerage service under one roof, modification in DDS organogram is recommended. The proposed organogram is shown below. Also, legal instruments are needed to shift sewerage related responsibilities of PWD to DDS. In this proposal, divisions are streamlined on the basis of similar work responsibility. Also, names of some sections are updated to reflect their actual tasks. A new Public Relations Division is proposed to maintain customer satisfaction. PWD’s responsibility to maintain house

32
connections and small sewers is proposed to transfer to Sewer System Division. There should be certain numbers of branch offices or sections of WQMO located conveniently throughout the service area. This should also act as a claim section or customer service office. This will be a necessary arrangement when WQMO assume entire service from the household to the treatment and disposal.
General Administration Water Quality Analysis Project and Sludge Management Database and Tariff Collection Wasterwater Treatment DevelopmentMaintenance Operation 1 (Dindaeng WWTP)Operation 2 (Chong Nongsi WWTP)Operation 3 (Nong Khaem WWTP)
Administration Maintenance 1Maintenance 2Sewer Engineering
Director General
Public Relations Division
Deputy Director General (Administration &
Technical)
Deputy Director General (Sewerage)
Secretarial Division
Deputy Director General (Drainage)
Drainage Control-Structure System Division
Mechanical Division
Wastewater Management Division
Information System Division
Sewer System Division
Canal System Division
Main Drainage System Development Division
Source: JST
Figure 4.4 Proposed Organogram of DDS
(3) Public Private Partnerships (PPP) Public-private partnership (PPP) describes a service or business venture which is funded and operated through a partnership of government and one or more private sector companies. Currently, 5 of the BMA’s 7 treatment scheme are operated by private companies through 5 year management contracts. To increase the functional efficiency, it is proposed to consider the use of

33
private firms for specialized operation like periodic inspection of large diameter sewers. This will reduce the need of BMA permanent staff and also ensure higher quality. However, the agreement should be made very carefully to tap the maximum benefit. For example, in a management contract for a WWTP, there should be performance indicator (PI); that is, if the effluent quality exceeds a certain limit, there should be penalty clause. Various forms of PPP as shown in Table 4.4.
Table 4.4 PPP Forms and Their Features
PPP Form Main Features
Service Contract Specific tasks only in return to fixed and variable fee. For example, installing meter, meter reading, sampling, repair, staff training, etc.
Management Contract Operation and maintenance of a facility with management decisions made by private firm. The utility finances both capital and working funds. For example, WWTP, pumping station, routine sewer cleaning, etc.
Lease Agreement O&M, but private firm mobilizes working fund. The lease holder usually retains a part of tariff and assumes assets of limited life time.
Concession Agreement O&M, but private firm mobilizes both working fund and capital fund. Assumes fee collection rights. More suitable for water supply.
Built-Operate-Transfer (BOT)
Public sector finances, operates with fee collection rights, transfers to public sector. Possible for sewerage sector.
Built-Operate-Own (BOO) Public sector finances, operates with fee collection rights, but never transfers to public sector. Not suitable for sewerage sector.
Alliance Public sector, constructor, and operator assume equity of a ‘special purpose vehicle’ on profit risk sharing basis. Not suitable for sewerage sector.
Public Finance Initiative (PFI)
Private investment, private ownership. Public sector operates by taking lease. More costly than commercial bank financing but no public sector risk for asset.
Source: JST For complete implementation of this M/P, it is thus proposed to investigate the potential of PPP in the form of Lease agreement for O&M, and BOT for new plant. Some of simple and repetitive tasks should be out-sourced. Strategy 4.4: Stipulation of Sewerage Ordinance Currently there is no direct sewerage ordinance for sewerage services in BMA. To implement this master plan and sewerage woks, necessary legal envelope is a must. It is indispensable to set Sewerage Ordinance of BMA which is fundamentals of sewerage management. Thus it will be possible to impose duty, regulation and user charge for inhabitants and an enterprise for usage of sewer system. The ordinance should cover, at least:
Sewerage service connection, Status of onsite treatment,

34
Sewerage treatment, Sewerage tariff, and Authority of DDS
In addition, it is desirable that the Sewerage Law of Thailand will be established through MONRE as jurisdiction ministry, because it becomes the higher rule of the sewerage ordinance of the local government. Individual strategies classified by the above categories are summarized in Table 4.5 together with responsible agencies.
Table 4.5 Strategy for Sewerage System Development and Responsible Agency
Individual Strategy for Sewerage System
Development Responsible
Agency Issues and Requirements
1) Countermeasures for CSO DDS Coordination with Related Drainage Development Division, DDS
2) Improvement of storm water drainage in parallel with improvement of water quality in klongs
DDS Coordination with Related Drainage Development Division, DDS
3) Countermeasures for untreated wastewater discharge, combination of interceptor chambers
DDS Coordination with Related Drainage Development Division, DDS
4) Countermeasures for backwater from klong, change to discharge by pump
DDS, BMA Secure budget Coordination with Related Drainage Development Division, DDS
5) Intercepting rate DDS Coordination with Related Drainage Development Division, DDS
6) Collection of untreated wastewater and investigation of existing drain pipes for improvement
DDS, PWD Coordination with Related Drainage Development Division, DDS Coordination with other concerned departments of BMA
Strategy 1.1
7) Short term and medium- and long-term Improvement measures
DDS, PWD, BMA
Secure budget Coordination with Related Drainage Development Division, DDS Coordination with other concerned departments of BMA
1) Strengthening of human excreta treatment DOE, DDS Coordination with other concerned departments of BMA Strategy
1.2 2) Reception of septage to WWTP DOE, DDS Coordination with other concerned departments of BMA
Strategy 1.3
1) Measures for business wastewater DOE, DDS, PCD
Coordination with other concerned departments of BMA Coordination with government authorities concerned Establishment of new institutions or amendments regulations
1) Rearrangement of the existing treatment areas
DDS Strategy
2.1 2) Compact and energy saving treatment system
DDS

35
Individual Strategy for Sewerage System
Development Responsible
Agency Issues and Requirements
Strategy 2.2
1) Verification of separate sewerage system pilot project
DDS, PWD, PCD
Coordination with other concerned departments of BMA Coordination with government authorities concerned Establishment of new institutions or amendments of regulations
1) Reuse of treated wastewater
DDS, PWD
Coordination with other concerned departments of BMA
2) Use of sewage sludge
DDS, PWD
Coordination with other concerned departments of BMA Strategy
3 3) Global warming mitigation DDS, BMA,
MONRE Coordination with other concerned departments of BMA Coordination with government authorities concerned
1) Capital cost financing DDS, BMA, MOF
Secure budget Coordination with government authorities concerned
2) Sewerage tariff DDS, BMA, MWA, MONRE
Coordination with government authorities concerned
3) O&M cost projection DDS, BMA, Secure budget 4) Renewal and Rehabilitation Works for WWTPs
DDS, BMA, MOF, MONRE
Coordination with government authorities concerned
Strategy 4.1
5) PIs for enhancement of sewerage service DDS, BMA, Secure budget Coordination with government authorities concerned
1) Cooperation of urban development project DDS, PWD, BMA
Coordination with other concerned departments of BMA
2) Promotion of registered plumbers DDS, PWD, PCD
Coordination with other concerned departments of BMA Coordination with government authorities concerned
Strategy 4.2
3) Consignment of O&M works to private company
DDS
1) Integration of fragmented responsibilities DDS, PWD, DOE
Coordination with other concerned departments of BMA Coordination with government authorities concerned
2) Onsite treatment standard DDS, PWD, DOE
Coordination with other concerned departments of BMA Coordination with government authorities concerned
3) PPP DDS, BMA Coordination with other concerned departments of BMA
4) Public participation DDS, BMA Coordination with other concerned departments of BMA
Strategy 4.3
5) Staff and human resource development DDS
36
Individual Strategy for Sewerage System
Development Responsible
Agency Issues and Requirements
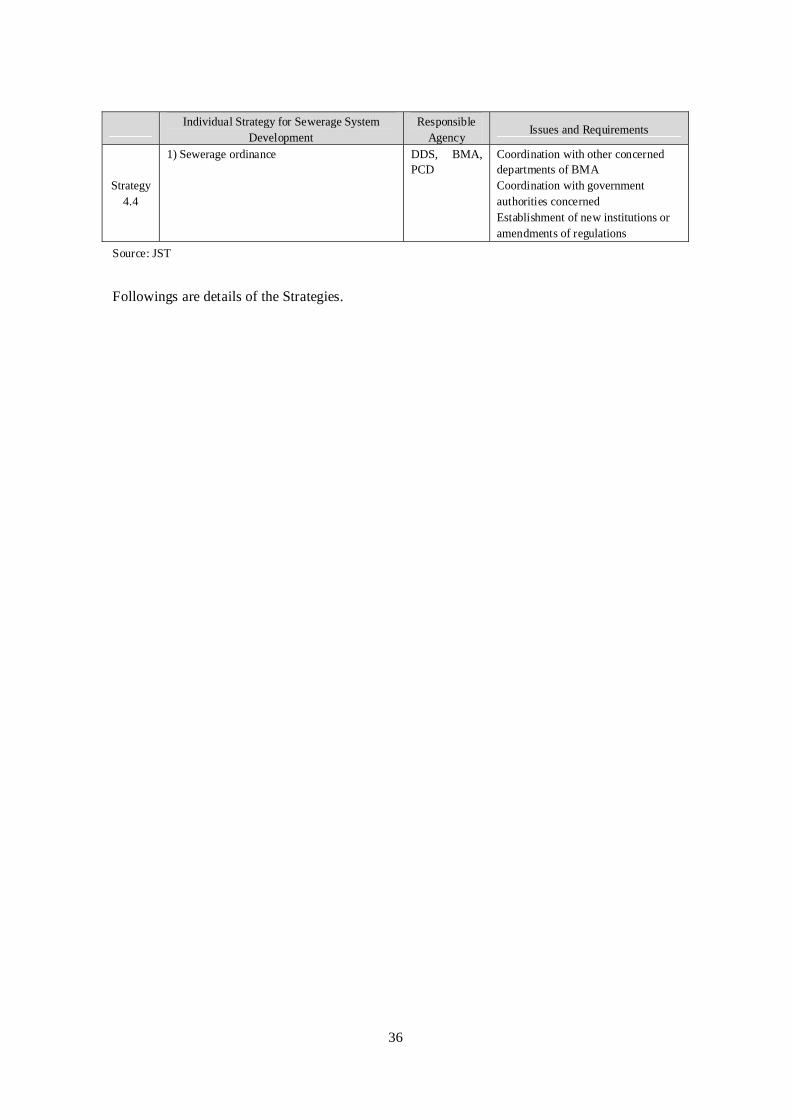
Strategy 4.4
1) Sewerage ordinance DDS, BMA, PCD
Coordination with other concerned departments of BMA Coordination with government authorities concerned Establishment of new institutions or amendments of regulations
Source: JST
Followings are details of the Strategies.

37
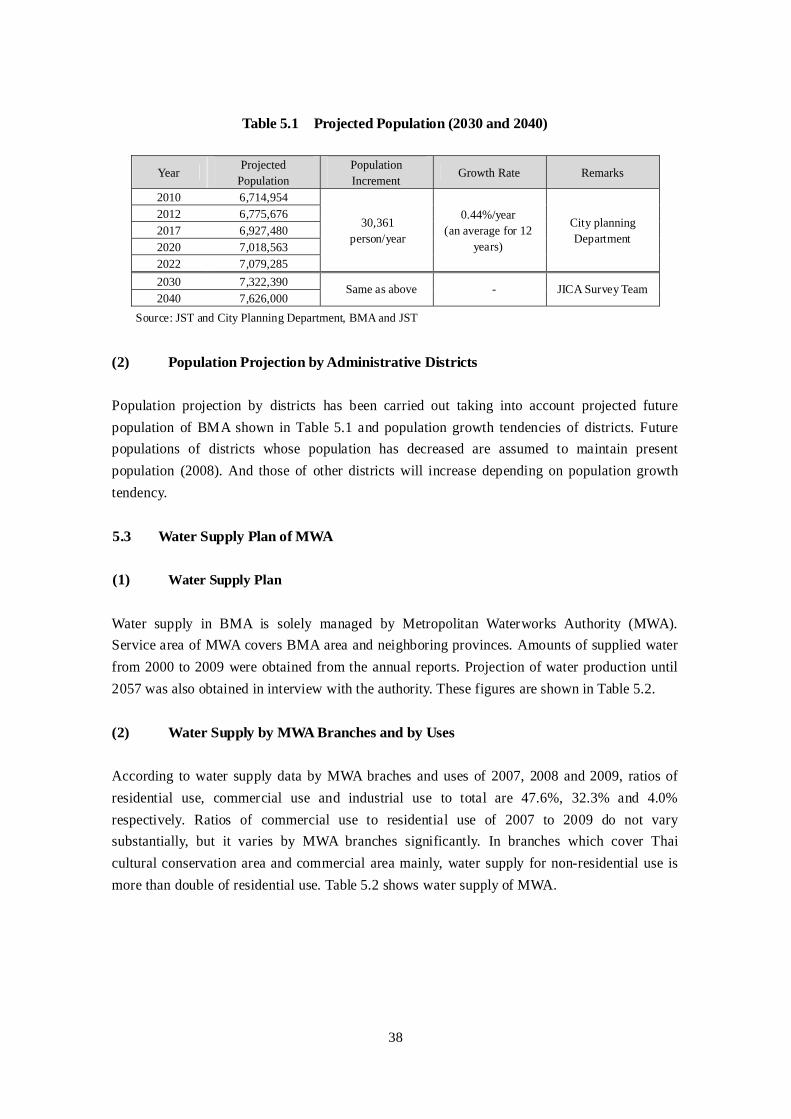
5. CONCEPTUAL SEWERAGE MASTER PLAN 5.1 Target Year and Treatment Area According to Performance Plan of Bangkok Metropolitan Administration 2009 – 2012, prepared in 2008, treatment ratio of wastewater was targeted to be 60 % in 2020. In this Conceptual Master Plan, target years of long term master plan and medium term are set at 2040 and 2020 respectively. Treatment ratio is considered to be raised gradually and objective treatment ratio in 2040 is targeted to be 80 % . To achieve this objective, entire urbanized area will be included in the treatment area principally. Although, some isolated industrial areas surrounded by agricultural area are the exceptions. 5.2 Population Projection (1) Population of BMA City Planning Department estimated future population of BMA up to 2022 based on the census data. Their population projection is shown in Figure 5.1 and Table 5.1. According to the projection annual increase of approximately 30,400 people was estimated from 2010 to 2022. Population in 2030 and 2040 was estimated by extrapolation on the assumption that this tendency would continue until 2040. Population projection up to 2040 is shown in Figure 5.1 and Table 5.1, since population growth was stabilized from 1990 after rapid increase during 70s’ and 80s’.
Source: JST and City Planning Department, BMA and JST
Figure 5.1 Population Projection by City Planning Department and JST
0
1,000,000
2,000,000
3,000,000
4,000,000
5,000,000
6,000,000
7,000,000
8,000,000
9,000,000
1950 1970 1990 2010 2030 2050
Projected by CPD by JST
38
Table 5.1 Projected Population (2030 and 2040)
Year Projected
Population Population Increment
Growth Rate Remarks
2010 6,714,954 2012 6,775,676 2017 6,927,480 2020 7,018,563 2022 7,079,285
30,361 person/year
0.44%/year (an average for 12
years)
City planning Department
2030 7,322,390 2040 7,626,000
Same as above - JICA Survey Team
Source: JST and City Planning Department, BMA and JST
(2) Population Projection by Administrative Districts Population projection by districts has been carried out taking into account projected future population of BMA shown in Table 5.1 and population growth tendencies of districts. Future populations of districts whose population has decreased are assumed to maintain present population (2008). And those of other districts will increase depending on population growth tendency.
5.3 Water Supply Plan of MWA (1) Water Supply Plan Water supply in BMA is solely managed by Metropolitan Waterworks Authority (MWA). Service area of MWA covers BMA area and neighboring provinces. Amounts of supplied water from 2000 to 2009 were obtained from the annual reports. Projection of water production until 2057 was also obtained in interview with the authority. These figures are shown in Table 5.2. (2) Water Supply by MWA Branches and by Uses According to water supply data by MWA braches and uses of 2007, 2008 and 2009, ratios of residential use, commercial use and industrial use to total are 47.6%, 32.3% and 4.0% respectively. Ratios of commercial use to residential use of 2007 to 2009 do not vary substantially, but it varies by MWA branches significantly. In branches which cover Thai cultural conservation area and commercial area mainly, water supply for non-residential use is more than double of residential use. Table 5.2 shows water supply of MWA.

39
Table 5.2 Water Supply of MWA
Source: MWA
5.4 Proposal on Treatment Areas At present seven (7) WWTPs are in operation and Bang Sue WWTP is under construction. Feasibility study on Klong Toei and Thong Buri Sewerage Projects were completed. In addition to these WWTPs, other ten (10) WWTPs were proposed in mater plan prepared in 1999. In this conceptual Master Plan, first additional nine (9) new treatment areas are proposed to cover urbanized area of BMA in addition to dividing Thon Buri area into two. These newly proposed treatment areas are set as temporary ones for case study on treatment area rearrangement. These will be checked against wastewater generation and current plants capacity before concluding new treatment areas. Proposed temporary treatment areas are shown in Figure 5.2.
5.5 Population by Proposed Temporary Treatment Areas Population by proposed treatment area is calculated based on population by administrative districts considering land use plan and estimated population density of land use categories set by city planning department.
(person) (Mm3/y) (%) (Mm3/y) (m3/d) (lpcd)2000 7,535,825 1,438.6 61.2 880.3 2,411,781 3202001 7,621,972 1,481.6 62.7 929.5 2,546,575 3342002 7,715,075 1,505.0 64.4 969.4 2,655,890 3442003 7,815,347 1,516.2 66.9 1,013.9 2,777,808 3552004 7,625,840 1,538.4 69.9 1,076.0 2,947,945 3872005 7,708,756 1,628.0 69.5 1,131.0 3,098,630 4022006 7,802,639 1,699.7 69.0 1,173.0 3,213,699 4122007 7,867,379 1,739.4 70.4 1,224.0 3,353,425 4262008 7,910,699 1,765.7 70.8 1,250.6 3,426,301 4332009 7,958,163 1,736.4 72.0 1,250.3 3,425,479 4302010 8,253,151 1,800.8 72.1 1,299.2 3,559,485 4312020 8,799,507 2,184.1 73.6 1,607.0 4,402,692 5002030 9,382,031 2,350.4 75.0 1,762.8 4,829,517 5152040 10,003,118 2,500.5 75.0 1,875.4 5,138,018 514
YearSupply/
Product RatioServed
PopulationWater
ProductionWaterSupply
Unit WaterSupply Remarks
Actual
Planned
WaterSupply

40
Source: JST
Figure 5.2 Proposed Treatment Areas 5.6 Wastewater Generation 5.6.1 Present Wastewater Generation (1) Water Supply by Proposed Treatment Areas Water supply by proposed treatment areas are calculated based on that by MWA branches. Ratios of non-residential use to residential use vary by treatment areas significantly depending on commercial activity of each treatment area. Maximum aggregate unit water supply is 572 lpcd of Rattanakosin treatment area and minimum one is 284 lpcd of Sai Mai and some other treatment areas. (2) Wastewater Generation Based on Water Supply Amount Table 5.3 shows wastewater generation and estimated flow at existing seven WWTP. Sewage return ratio from water supply is assumed to be 0.80. Sewer coverage ratio is assumed to be 0.80 in this Survey considering actual condition that some wastewater is discharging into Klong even in an area where interceptors are installed. Here “Sewer Coverage Ratio” is difined as a ratio of wastewater collected by sewer to wastewater generated.

41
Table 5.3 Wastewater Generation and Estimated Flow at WWTP
Source: JST (3) Ground Water and Infiltration Flow from Klong Inflow to WWTP includes flow from Klong through interceptor chambers in addition to ground water infiltration in Bangkok. Therefore infiltration in this M/P includes ground water and klong water. Average infiltration ratios are around 10 m3/d/ha against treatment area or 40% of wastewater inflow at WWTP respectively. These ratios vary significantly by treatment areas. 5.6.2 Estimated Flow at WWTP in 2040 (1) Population by Treatment areas Population by treatment areas in 2040 is shown in Table 5.5. (2) Unit Per Capita Water Supply Unit per capita water supply for residential use is assumed to be 200 lpcd. Non-residential unit water supply is divided into four levels based on degree of commercial activity in treatment areas shown in Table 5.4.
Table 5.4 Unit Water Supply by Category (2040) (lpcd)
Non-R
/Residential Ratio
Residential Non-
Residential Total Particular Treatment Area
A 2.5 200 500 700 Si Praya, Rattanakosin, Chong Nonsi, B 2.0 200 400 600 Dig Daeng, Klong Toei C 1.5 200 300 500 Refer to Table 5.5 D 1.0 200 200 400 Refer to Table 5.5
Source: JST
(ha) (person) (m3/d) (m3/d) (m3/d)1 Si Praya 270.0 57,466 31,106 0.80 24,885 0.80 19,6782 Rattanakosin 414.2 49,457 28,303 0.80 22,642 0.80 18,2703 DinDaeng 2,700.0 498,402 265,731 0.80 212,585 0.80 171,4804 ChongNonsi 2,850.0 372,765 172,803 0.80 138,242 0.80 109,4475 Nong Khaem 4,400.0 335,240 117,343 0.80 93,874 0.80 66,9516 ThungKhru 4,200.0 240,207 74,534 0.80 59,627 0.80 54,1877 Chatuchak 3,340.0 209,055 96,323 0.80 77,058 0.80 62,101
18,174.2 1,762,592 786,143 628,913 502,114
WastewaterGeneration
SewerCoverage
RecordedFlowTreatment Area
ReturnRate
Total
WaterSupplyPopulationArea Estimated Sewer
Coverage Ratio Ratio

42
(3) Return Ratio Sewage return ratio from water supply in 2040 is set to be 0.80 same as present condition. (4) Sewer Coverage Ratio Sewer coverage ratio in 2040 is set to be 0.90. (5) Infiltration Flow Infiltration flow is assumed to be principally proportional to area of each treatment area and infiltration ratio is set to be 10 m3/d/ha considering present condition of existing seven WWTPs. However, there are many vacant spots in new treatment areas, and infiltration flow calculated based on the above rule may be excessively high. Thus infiltration flow should be calculated based on effective treatment area excluding park, open space, water surface and so on. Therefore, limit for infiltration flow is set to be 40% of wastewater flow to avoid excessively high infiltration flow in this M/P. (6) Estimated Flow at WWTP in 2040 Figure 5.3 shows proposed treatment area and estimated flows at WWTP in 2040 by treatment areas are shown in Table 5.5.

43
Sour
ce: J
ST
Figu
re 5
.3
Prop
osed
Tre
atm
ent A
rea
Arr
ange
men
t (B
ased
on
Exis
ting
Trea
tmen
t are
a)

44
Tabl
e 5.
5 E
stim
ated
Flo
w a
t WW
TP
by T
reat
men
t Are
as in
204
0
Sour
ce: J
ST
Resi
dent
ial
Com
mer
cial
Tota
l
(ha)
lpcd
lpcd
lpcd
lpcd
(m3 /d
)(m
3 /d)
(m3 /d
)(m
3 /d/h
a)(m
3 /d)
(m3 /d
)(m
3 /d)
(m3 /d
)1
226
57,4
95A
2.50
200
500
700
560
40,2
4732
,197
28,9
775
1,13
011
,591
1,13
030
,107
2
Ratta
nako
sin
367
49,4
80A
2.50
200
500
700
560
34,6
3627
,709
24,9
3810
3,67
09,
975
3,67
028
,608
3D
in D
aeng
3,92
351
3,14
5B
2.00
200
400
600
480
307,
887
246,
310
221,
679
1039
,230
88,6
7239
,230
260,
909
4Ch
ong
Non
si2,
872
372,
960
A2.
5020
050
070
056
026
1,07
220
8,85
818
7,97
25
14,3
6075
,189
14,3
6020
2,33
25
Non
g K
haem
4,38
440
5,48
7D
1.00
200
200
400
320
162,
195
129,
756
116,
780
1043
,840
46,7
1243
,840
160,
620
6Th
ung
Khr
u4,
447
256,
033
C1.
5020
030
050
040
012
8,01
710
2,41
392
,172
522
,235
36,8
6922
,235
114,
407
7Ch
atuc
hak
3,07
320
9,57
5B
2.00
200
400
600
480
125,
745
100,
596
90,5
3610
30,7
3036
,214
30,7
3012
1,26
68
7,30
957
9,67
0B
2.00
200
400
600
480
347,
802
278,
242
250,
418
1073
,090
100,
167
73,0
9032
3,50
89
2,09
522
9,06
3C
1.50
200
300
500
400
114,
532
91,6
2582
,463
1020
,950
32,9
8520
,950
103,
413
10Th
on B
uri N
orth
2,92
235
9,54
2C
1.50
200
300
500
400
179,
771
143,
817
129,
435
1029
,220
51,7
7429
,220
158,
655
11Th
on B
uri S
outh
2,08
733
3,70
7C
1.50
200
300
500
400
166,
854
133,
483
120,
135
1020
,870
48,0
5420
,870
141,
005
12H
uayk
wan
g1,
333
109,
358
B2.
0020
040
060
048
065
,615
52,4
9247
,243
1013
,330
18,8
9713
,330
60,5
7313
2,26
313
3,31
0C
1.50
200
300
500
400
66,6
5553
,324
47,9
9210
22,6
3019
,197
19,1
9767
,189
14
Wan
gtho
nlan
g3,
547
313,
296
C1.
5020
030
050
040
015
6,64
812
5,31
811
2,78
610
35,4
7045
,114
35,4
7014
8,25
615
5,63
934
0,43
0D
1.00
200
200
400
320
136,
172
108,
938
98,0
4410
56,3
9039
,218
39,2
1813
7,26
216
Don
Mue
ang
3,25
028
0,74
9D
1.00
200
200
400
320
112,
300
89,8
4080
,856
1032
,500
32,3
4232
,342
113,
198
17N
ong
Bon
6,38
526
4,88
3C
1.50
200
300
500
400
132,
442
105,
953
95,3
5810
63,8
5038
,143
38,1
4313
3,50
118
4,16
527
4,18
2C
1.50
200
300
500
400
137,
091
109,
673
98,7
0610
41,6
5039
,482
39,4
8213
8,18
819
La
t Kra
bang
-11,
258
59,5
02C
1.50
200
300
500
400
29,7
5123
,801
21,4
2110
12,5
808,
568
8,56
829
,989
20
Non
g Ch
ok-1
2,10
920
8,63
4C
1.50
200
300
500
400
104,
317
83,4
5475
,109
1021
,090
30,0
4421
,090
96,1
9921
5,81
645
3,93
8C
1.50
200
300
500
400
226,
969
181,
575
163,
418
1058
,160
65,3
6758
,160
221,
578
22La
t Phr
ao6,
206
475,
384
D1.
0020
020
040
032
019
0,15
415
2,12
313
6,91
110
62,0
6054
,764
54,7
6419
1,67
523
2,95
815
8,18
8D
1.00
200
200
400
320
63,2
7550
,620
45,5
5810
29,5
8018
,223
18,2
2363
,781
24K
long
Sam
Wa
5,01
531
0,73
8C
1.50
200
300
500
400
155,
369
124,
295
111,
866
1050
,150
44,7
4644
,746
156,
612
25
Lat K
raba
ng-2
4,95
921
1,45
7C
1.50
200
300
500
400
105,
729
84,5
8376
,125
1049
,590
30,4
5030
,450
106,
575
26
Lat K
raba
ng-3
988
28,1
29C
1.50
200
300
500
400
14,0
6511
,252
10,1
2710
9,88
04,
051
4,05
114
,178
27
Non
g Ch
ok-2
309
20,9
08C
1.50
200
300
500
400
10,4
548,
363
7,52
710
3,09
03,
011
3,01
110
,538
28Ta
ling
Chan
759
149,
866
D1.
0020
020
040
032
059
,946
47,9
5743
,161
107,
590
17,2
647,
590
50,7
5129
Non
g K
haem
Nor
th20
817
,374
C1.
5020
030
050
040
08,
687
6,95
06,
255
102,
080
2,50
22,
080
8,33
530
Non
g K
haem
Sou
th1,
647
167,
622
D1.
0020
020
040
032
067
,049
53,6
3948
,275
1016
,470
19,3
1016
,470
64,7
4592
,519
7,34
4,10
53,
711,
446
2,96
9,15
62,
672,
243
785,
710
3,45
7,95
3
Out
ofS
ervi
ce A
rea
62,9
3928
1,89
5D
1.00
200
200
400
320
112,
758
90,2
0681
,185
1062
9,39
032
,474
32,4
7411
3,65
915
5,45
87,
626,
000
3,82
4,20
43,
059,
362
2,75
3,42
881
8,18
43,
571,
612
Klo
ng T
oei
Tota
l / A
vera
ge
Min
Bur
i
Jom
thon
g
Sai M
ai
Sub-
tota
l
Si P
raya
Bang
Sue
Lak
Si
Bunk
hum
Sr. N
o.U
KF1
UKF2
(Lim
it)U
KF
Ado
pted
Tota
lIn
flow
Are
aU
nit W
ater
Sup
ply
Uni
tSe
wag
eG
ener
atio
nRa
tioCa
tego
ry
Com
mer
cial
/ Re
siden
tial
Rat
io
Pers
on in
Sew
er
Dist
rict
Tratm
ent A
rea
Wate
r Su
pply
Am
ount
Sewa
geG
ener
ated
Flow
at
WW
TPU
KF1
Ratio

45
5.7 Rearrangement of Treatment Areas In Din Daeng and Chatuchak treatments areas treatment capacities have some margins. On the contrary, there are shortage of treatment capacities in Thung Khru and Nong Khaem treatment areas. Rearrangement of treatment areas is considered to mitigate this unbalance. Si Praya, Rattanakosin, Chong Nonsi, Klong Toei and Bang Sue in which design treatment capacities in 2040 are judged to be appropriate are excluded from rearrangement of treatment areas. F/S for Thon Buri treatment area was completed, however, site for WWTP could not be secured and updating of F/S is currently underway by dividing the area into two treatment areas, viz. Thon Buri North and Thon Buri South.
Table 5.6 shows outlines of proposed rearrangement.
Table 5.6 Summary of Treatment Area Rearrangement
Original Rearranged Remarks
Din Daeng Din Daeng Divert to Chong Nonsi partly Integrate whole Huaykwang and part of Wangthonlang
Chong Nonsi Chon Nonsi Integrate part of Din Daeng Huaykwang - Divert to Din Daeng totally
1
Wangthonlang Wangthonlang Divert to Din Daeng partly Chatuchak Chatuchak Integrate part of Lak Si Lak Si - Divert to Chatuchak and Don Mueang totally 2 Don Muaeng Chatuchak Integrate part of Lak Si Thung Khru Thung Khru Divert to Jomthong partly Thon Buri South - Divert to Jomthong totally 3 Jomthong Jomthong Integrate whole Thon Buri South and part of Thug Khru Nong Khem Nong Khaem Integrate whole Nong Khaem North and South Nong Khaem North - Divert to Nong Khaem totally 4 Nong Khaem South - Divert to Nong Khaem totally
Source: JST
Rearranged treatment area and wastewater flow are shown in Figure 5.4 and Table 5.7.
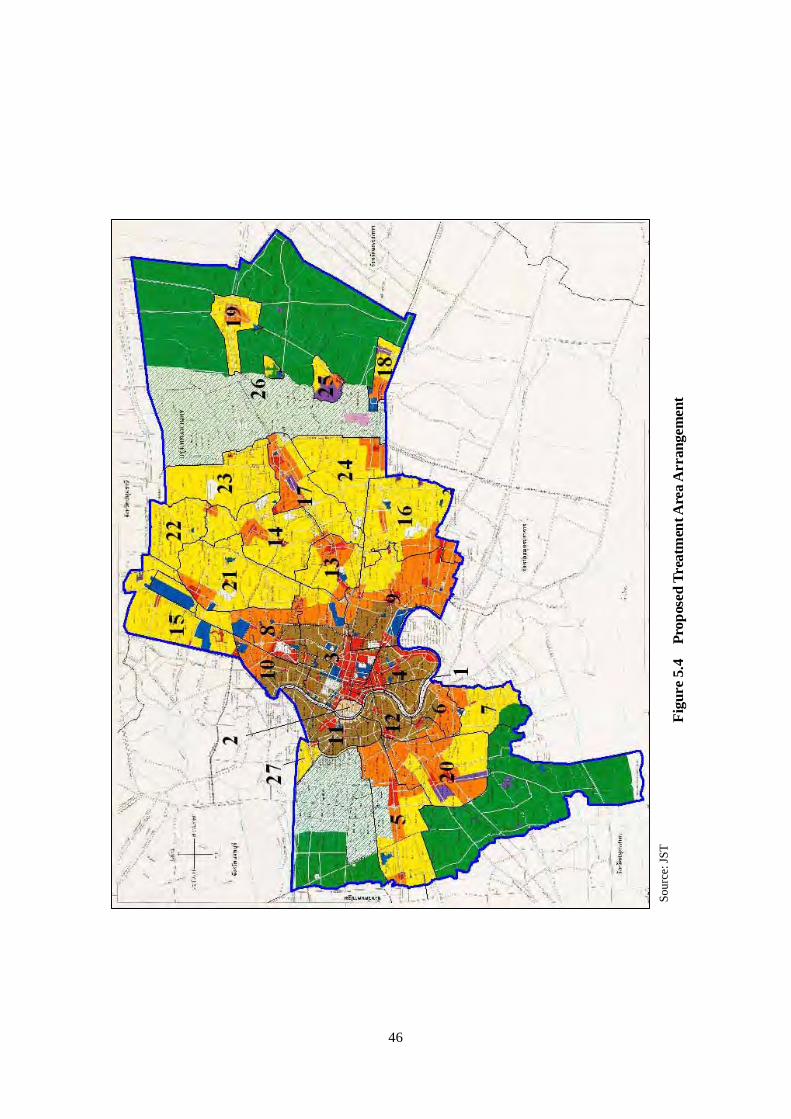
46
Figu
re 5
.4
Prop
osed
Tre
atm
ent A
rea
Arr
ange
men
t So
urce
: JST

47
Table 5.7 Estimated Flow at WWTP by Treatment Area in 2040
Note: Total wastewater flow in Table 5.5 and in this table slightly differ because infiltration rate is
different by treatment areas, and therefore unit wastewater flow is different due to rearrangement of
treatment areas.
Source: JST
5.8 Construction Cost Construction cost for sewerage system to be implemented was estimated by using unit costs of Bang Sue and Klong Toei sewerage projects. Unit costs including construction costs for interceptors, pumping stations and WWTPs per treatment area, population and wastewater flow were worked out. Construction cost for each treatment area was calculated as an average of those estimated by three unit costs. Construction costs for treatment areas are shown in Table 5.8. A total construction cost including Bang Sue and Klong Toei sewerage systems is estimated to be 102 billion Baht, and that excluding two sewerage systems is to be 86 billion Baht
Watewater Infiltration Total(ha) (Person)
1 Si Praya 226 57,495 28,977 1,130 30,1072 Rattanakosin 367 49,480 24,938 3,670 28,6083 Din Daeng 5,931 689,699 297,950 59,310 357,2604 Chong Nonsi 2,872 372,960 187,972 14,360 202,3325 Nong Khaem 6,239 590,483 170,060 62,390 232,4506 Thung Khru North 1,513 128,637 46,310 7,565 53,8757 Thung Khru South 2,934 127,396 45,862 14,670 60,5328 Chatuchak 3,645 239,653 103,530 36,450 139,9809 KhlongToei 7,309 579,670 250,418 73,090 323,50810 Bang Sue 2,095 229,063 82,463 20,950 103,41311 Thon Buri North 2,922 359,542 129,435 29,220 158,65512 Thon Buri South 2,087 333,707 120,135 20,870 141,00513 Wangthonlang 2,872 246,098 88,595 28,720 117,31514 Bunkhum 5,639 340,430 98,044 39,218 137,26215 Don Mueang 4,941 383,981 110,587 44,235 154,82216 Nong Bon 6,385 264,883 95,358 38,143 133,50117 Min Buri 4,165 274,182 98,706 39,482 138,18818 Lat Krabang-1 1,258 59,502 21,421 8,568 29,98919 Nong Chok-1 2,109 208,634 75,109 21,090 96,19920 Jomthong 5,816 453,938 163,418 58,160 221,57821 Lat Phrao 6,206 475,384 136,911 54,764 191,67522 Sai Mai 2,958 158,188 45,558 18,223 63,78123 KhlongSam Wa 5,015 310,738 111,866 44,746 156,61224 Lat Krabang-2 4,959 211,457 76,125 30,450 106,57525 Lat Krabang-3 988 28,129 10,127 4,051 14,17826 Nong Chok-2 309 20,908 7,527 3,011 10,53827 Taling Chan 759 149,866 43,161 7,590 50,751
92,519 7,344,103 2,670,563 784,126 3,454,689 Out ofService Area 62,939 281,897 81,186 32,474 113,660
155,458 7,626,000 2,751,749 816,600 3,568,349
No.
Total
Sub-total
(m3/d)
Inflow to WWTPAreaTreatment Area
Population
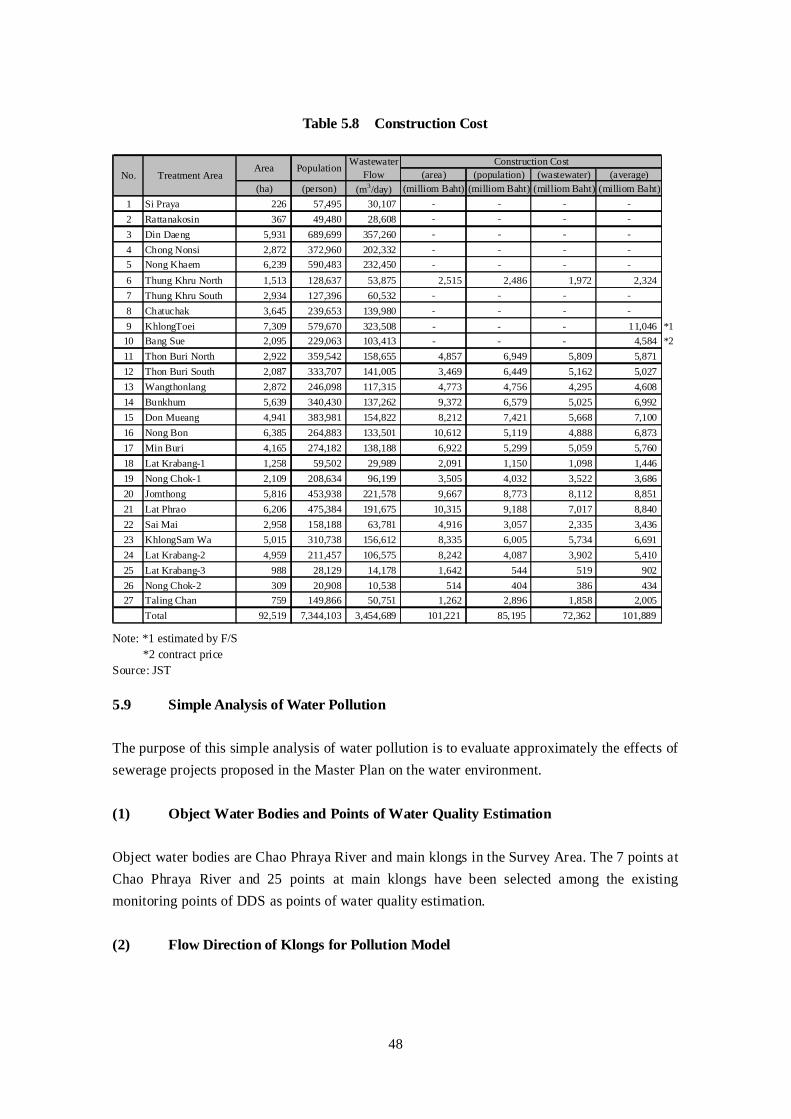
48
Table 5.8 Construction Cost
(area) (population) (wastewater) (average)(ha) (person) (m3/day) (milliom Baht) (milliom Baht) (milliom Baht) (milliom Baht)
1 Si Praya 226 57,495 30,107 - - - -
2 Rattanakosin 367 49,480 28,608 - - - -
3 Din Daeng 5,931 689,699 357,260 - - - -
4 Chong Nonsi 2,872 372,960 202,332 - - - -
5 Nong Khaem 6,239 590,483 232,450 - - - -
6 Thung Khru North 1,513 128,637 53,875 2,515 2,486 1,972 2,3247 Thung Khru South 2,934 127,396 60,532 - - - -
8 Chatuchak 3,645 239,653 139,980 - - - -
9 KhlongToei 7,309 579,670 323,508 - - - 11,046 *110 Bang Sue 2,095 229,063 103,413 - - - 4,584 *211 Thon Buri North 2,922 359,542 158,655 4,857 6,949 5,809 5,87112 Thon Buri South 2,087 333,707 141,005 3,469 6,449 5,162 5,02713 Wangthonlang 2,872 246,098 117,315 4,773 4,756 4,295 4,60814 Bunkhum 5,639 340,430 137,262 9,372 6,579 5,025 6,99215 Don Mueang 4,941 383,981 154,822 8,212 7,421 5,668 7,10016 Nong Bon 6,385 264,883 133,501 10,612 5,119 4,888 6,87317 Min Buri 4,165 274,182 138,188 6,922 5,299 5,059 5,76018 Lat Krabang-1 1,258 59,502 29,989 2,091 1,150 1,098 1,44619 Nong Chok-1 2,109 208,634 96,199 3,505 4,032 3,522 3,68620 Jomthong 5,816 453,938 221,578 9,667 8,773 8,112 8,85121 Lat Phrao 6,206 475,384 191,675 10,315 9,188 7,017 8,84022 Sai Mai 2,958 158,188 63,781 4,916 3,057 2,335 3,43623 KhlongSam Wa 5,015 310,738 156,612 8,335 6,005 5,734 6,69124 Lat Krabang-2 4,959 211,457 106,575 8,242 4,087 3,902 5,41025 Lat Krabang-3 988 28,129 14,178 1,642 544 519 90226 Nong Chok-2 309 20,908 10,538 514 404 386 43427 Taling Chan 759 149,866 50,751 1,262 2,896 1,858 2,005
92,519 7,344,103 3,454,689 101,221 85,195 72,362 101,889
WastewaterFlow
Construction CostAreaNo. Treatment Area
Population
Total Note: *1 estimated by F/S *2 contract price Source: JST 5.9 Simple Analysis of Water Pollution
The purpose of this simple analysis of water pollution is to evaluate approximately the effects of sewerage projects proposed in the Master Plan on the water environment. (1) Object Water Bodies and Points of Water Quality Estimation Object water bodies are Chao Phraya River and main klongs in the Survey Area. The 7 points at Chao Phraya River and 25 points at main klongs have been selected among the existing monitoring points of DDS as points of water quality estimation.
(2) Flow Direction of Klongs for Pollution Model
49
Topography of the Survey Area is generally flat, and flow in klongs is affected by tide and also influenced strongly by pump and gate operation in wet weather. Flow is often stagnated and sometimes reverse flow may occur. For simplification of pollution model, regular flow direction is assumed for each klong. (3) Water Quality Items to be Evaluated Water quality item to be estimated is Biochemical Oxygen Demand (BOD). (4) Representative BOD Values for Pollution Model Representative BOD values for pollution analysis are determined to be annual average values in 2009. (5) Simulation Conditions Based on the explanation mentioned above, an Excel based simplified model was developed by the JST. Using the model, BOD concentrations in Chao Phraya River and klongs in future are estimated for the flowing two cases.
i) Without project case: Sewerage system in BMA will remain the same as it is at present until 2040.
ii) With project case Sewerage system will be developed as proposed in this Master Plan.
(6) Simulation Result
BOD concentrations in main klongs on the east bank, viz. Klong Saen Saep, Klong Lad Phrao, Klong Prawetburirom and Klong Phra Khanong will rise to 1.4 times the current values on average (1.2 to 1.7 times) if sewerage system remains the same as it is now.
BOD concentrations in the same klongs as mentioned above will be less than 10 mg/l if sewerage system is developed as proposed.
If BOD concentrations are less than 10 mg/l, conservation of ecosystem and prevention of emission of foul smell from sediments can be assured in klongs since a certain DO level is maintained (average DO value is 1.9 mg/l if BOD concentrations are less than 10 mg/l, and DO values of 73 % of total samples exceed 1.0 mg/l.)
If sewerage system remains the same as it is now, BOD pollutant load is estimated to increase to 1.3 times the current level (2008). As a result, BOD concentrations in Chao Phraya River will increase to 7 mg/l from current 6 mg/l.
On the other hand, if sewerage system is developed as proposed in this Master Plan, BOD concentrations in Chao Phraya River will be improved to 5 mg/l from 7 mg/l in case of

50
without project.
99
97
95
9493
101
271
462461
463
92
181
182
514
515
118
184
K. T
an
281282
4
7
44
7
57
12
7
5
6
7
7
9
7
8
11
6
13
16
9
10
12
6
9
11
6 10
12
7
11
16
7
9
11
6
12
15
7
R02
R03
R05
R06
R07
R08
R04
Klo
ng L
ad P
hrao
K. T
an
4
4
4
6
7
5
6
7
5
6
7
5
4
4
45
5
56
7
5
6
8
4
20
23
7
13
16
10
12
16
8
10
12
6
9
11
6
9
11
5
Existing
Future (without project)Future (with Project)
BOD Concentration (mg/l)
N
N
Source: JST
Figure 5.5 (1) Results of Estimation of BOD Concentrations by Simplified Pollution Model (1/2)
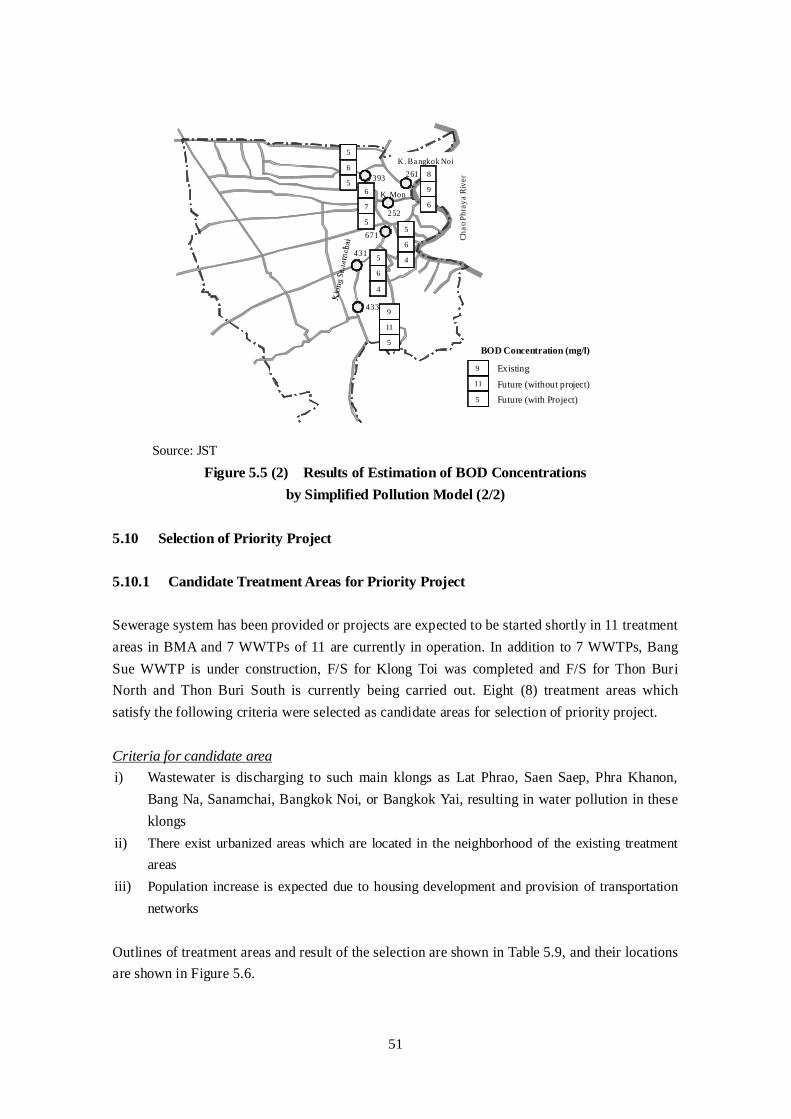
51
261
252
671
431
433
393
Chao
Phra
ya R
iver
K . Ba ngkok Noi
K. Mon6
7
55
6
45
6
4
9
11
5
5
6
58
9
6
9
11
5
Existing
Future (without project)Future (with Project)
BOD Concentration (mg/l)
Source: JST
Figure 5.5 (2) Results of Estimation of BOD Concentrations by Simplified Pollution Model (2/2)
5.10 Selection of Priority Project 5.10.1 Candidate Treatment Areas for Priority Project Sewerage system has been provided or projects are expected to be started shortly in 11 treatment areas in BMA and 7 WWTPs of 11 are currently in operation. In addition to 7 WWTPs, Bang Sue WWTP is under construction, F/S for Klong Toi was completed and F/S for Thon Buri North and Thon Buri South is currently being carried out. Eight (8) treatment areas which satisfy the following criteria were selected as candidate areas for selection of priority project. Criteria for candidate area i) Wastewater is discharging to such main klongs as Lat Phrao, Saen Saep, Phra Khanon,
Bang Na, Sanamchai, Bangkok Noi, or Bangkok Yai, resulting in water pollution in these klongs
ii) There exist urbanized areas which are located in the neighborhood of the existing treatment areas
iii) Population increase is expected due to housing development and provision of transportation networks
Outlines of treatment areas and result of the selection are shown in Table 5.9, and their locations are shown in Figure 5.6.

52
Table 5.9 Outlines of Candidate Treatment Areas for Priority Project
Candidate
treatment area Location
Area (ha) Population in 2040
(persons) Population density
(persons /ha)
Tendency of population
growth (2004-08)
Land use plan (Dominant land use)
Receiving klong Reasons for candidate area
1 Huaykwang
Sub-treatment area
2,008 164,800
82
Increase 0 - 10%/year
Medium- and high-density residential Commercial
Downstream of Klong Lat Phrao
Existing urbanized area Water quality deterioration in Klong Lat Phrao
2 Wangthonlang 2,872
246,100 86
Increase 0 - 10%/year
Low- and medium-density residential Commercial
Downstream of Klong Saen Saep
Existing urbanized ares Water quality deterioration in Klong Saen Saep
3 Dong Mueang 4,941
384,000 78
Decrease Low-density residential Public (airport)
Upstream of Klong Pram Prachakom, and Klong Lat Phrao
Existing urbanized area Water quality deterioration in Klong Lat Phrao
4 Nong Bon 6,385
264,900 41
Increase 0 - 10%/year
Low- and medium-density residential Commercial
Upstream of Klong Bang Na Downstream of Klong Phra Khanong
Existing urbanized area Population growth due to development Closeness to international airport Water quality deterioration in Klong Bang Na, and Klong Phra Khanong
5 Min Buri 4,165
274,200 66
Increase 0 - 10%/year
Low- and medium-density residential Commercial
Upstream of Klong Saen Seap Existing urbanized area Water quality deterioration in Klong Saen Saep
6 Lat Phrao
East bank of Chao Phraya
River
6,206 475,400
77
Increase 0 - 10%/year
Low- and medium-density residential Commercial
Upstream of Klong Lat Phrao Existing urbanized area Water quality deterioration in Klong Lat Phrao
7 Jomthong 5,816
453,900 78
Increase, an area with 10%/year is included
Low- and medium-density residential Commercial
Klong Sanamchai Existing urbanized are, population growth expected
8 Taling Chan
West bank of Chao Phraya
River 759 149,900
197
Increase 0 - 10%/year
Low-density residential Klong Bangkok Noi and Klong Bangkok Yai
Existing urbanized are, population growth expected
Note: Location of treatment areas, refer to Figure 5.6 Source: JST

53
Existing, F/S is finished or
F/S is in progress

54
5.10.2 Selection of Priority Project Area Priority project is selected from among eight (8) treatment areas shown in Table 5.9 taking into account the various factors comprehensively such as future situation of the area, current water pollution in klongs, improvement effects of water pollution due to provision of sewerage system, availability of land for WWTP, and DDS’s intention Selection of priority project is described in the following and summarized in Table 5.10. There are many reaches in Klong Bang Na, Klong Lat Phrao and Klong Saen Saep where BOD concentrations exceed 10 mg/l, in particular in Klong Bang Na BOD concentrations exceed 15 mg/l. This means that urgency of implementation sewerage project is obvious in these treatment areas related to the above klongs. As for improvement effects on water quality in klongs, effect of an individual treatment area is not so significant for large klongs such as Klong Lat Phrao and Klong Saen Saep because catchment areas of these klongs cover many treatment areas. On the other hand, Klong Bang Na is a small klong flowing through congested residential areas. Improvement effect on water quality due to implementation of sewerage project can be expected to be significant. Among the candidate treatment areas only Nong Bon treatment area is included in catchment area of Klong Bang Na. To conduct F/S, construction site for WWTP must be secured beforehand, because preliminary design of sewerage facilities such as trunk sewers and WWTP is indispensable element of the study. Treatment areas which satisfy this requirement are Nong Bon and Min Buri treatment areas. DDS’s intention is that sewerage system will be provided in all urbanized areas except for agricultural areas by 2040. To realize the aim, DDS will implement the sewerage projects as soon as possible from where preparation for implementation is completed. DDS’s thought was that implementation of sewerage projects for Klong Toie, Thon Buri North and Thon Buri South for which F/S was completed would be followed by implementation of sewerage projects in Min Buri and Nong Bon treatment areas. Currently budget for F/S, detailed design and construction for Min Buri project was secured by DDS and F/S for Nong Bon is desired. According to the results of strategic environmental assessment, it is judged that there is no obstacles to prevent smooth implementation of the project in both Nong Bon and Min Buri treatment areas and that there is no problem to select these areas as priority project area.

55
In conclusion, Nong Bon treatment area in which provision of sewerage system is expected to contribute to improvement of water quality in Klong Bang Na and Klong Phra Khanon, of which construction site for WWTP is secured is selected as priority project area. The selection is also confirmed with the results of the strategic environmental assessment. Contents and results of the selection are presented in Table 5.10. Therefore, F/S will be conducted at the second stage of the Survey for selected Nong Bon treatment area.

56
Table 5.10 Selection of Priority Project Area
Candidate
treatment area
Area (ha) Population (persons)
Population density
(persons/ha)
Land use plan (dominant land use)
Receiving klong
Water quality in
klong (BOD mg/l)
(1) Urgency of project
(2) Effects of provision of
sewerage system
(3) Construction site for WWTP
(4) Strategic environmental
assessment Remarks
1 Huaykwang
sub-treatment area
2,008 164,800
82
Medium- and high-density residential Commercial
Downstream of Klong Lat Phrao
10~12 Medium Medium To be integrated
to Din Daeng Treatment area
Can not be done
2 Wangthonlang 2,872
246,100 86
Low- and medium-density residential Commercial
Downstream of Klong Saen Saep
11~12 Medium Low Not determined Can not be done
Upstream of Klong Pram Prachakom
13 3 Dong Mueang
4.941 384,000
78
Low-density residential Public (airport) Upstream of Klong
Lat Phrao 10
Medium Medium Not determined Can not be done
Upstream of Klong Bang Na
13~20 4 Nong Bon
6,385 264,900
41
Low- and medium-density residential Commercial Downstream of Klong
Phra Khanong 7~8
High High Secured No problem Selected as
priority project
5 Min Buri 4,165
274,200 66
Low- and medium-density residential Commercial
Upstream of Klong Saen Seap
7~11 Medium Medium Secured No problem
6 Lat Phrao 6,206
475,400 77
Low- and medium-density residential Commercial
Upstream of Klong Lat Phrao
9~13 Medium High Site is under
consideration by DDS
Can not be done
7 Jomthong 5,816
453,900 78
Low- and medium-density residential Commercial
Klongs on the west bank
5~9 Low Low Not determined Can not be done
8 Taling Chan 5,816
453,900 78
Low- and medium-density residential Commercial
Klongs on the west bank
5~6 Low Low Not determined Can not be done

57
5.10.3 Outlines of Nong Bon Treatment Area Although population density in Nong Bon treatment area is comparatively low at present, population has been increasing because of opening of airport link which connects central part of the city and a new airport and consequent enhancement of convenience. Many housing developments of relatively high class houses by private companies have been progressing. A new elevated railway line is planned to be constructed along Sri Nakharin Road in the western part of the area resulting in further enhancement of convenience. Nong Bon treatment area is close to the new international airport. Population growth and needs for development are expected in the area. Outlines of Nong Bon treatment area and Nong Bon WWTP are shown in Table 5.11. Construction site for WWTP is located in the neighborhood of Rama IX Park, adjacent to storm water reservoir constructed under Monkey Cheek Project. Construction site for WWTP is shown in Figures 5.7 and 5.8.
Table 5.11 Outlines of Nong Bon Treatment Area and Nong Bon WWTP
Design figure Remarks
Area of treatment area 6,385 ha Including areas of parks, vacant lands and water surfaces
Design population (2040)
265,000 persons
Design capacity (2040)
135,000 m3/day
Area of WWTP site
3.5 (22
(1.1 above
facilities)
ha Rai) ha for ground
Adjacent to storm water reservoir constructed under Monkey Cheek Project, in the neighborhood of Rama IX Park Biological treatment: adoption of compact treatment process A part of the facilities is to be constructed underground, administration building is to be constructed above ground
Source: JST

58
Source: JST
Figure 5.7 Location of Nong Bon WWTP
Source: JST
Figure 5.8 Proposed Site for Nong Bon WWTP
Proposed Site for Nong Bon
Rama IX Park
Reservoir

59
5.11 Strategy for Sewerage System Development Long term sewerage system development plan up to 2040 was developed classifying 27 treatment areas into the following four groups.
Group 1: Existing treatment areas (7) Si Praya, Rattanakosin, Din Daeng, Chong Nonsi, Nong Khaem, Thung Kru South, and Chatuchak Group 2: Under construction and F/S to be prepared (5) Bang Sue, Klong Toei, Thon Buri North, Nong Bon and Min Buri Group 3: High priority treatment areas (7) Thon Buri South, Thung Kru North, Wangthonlang, Don Muaeng, Lat Prao, Jomthong, and Taling Chan Group 4: Low priority treatment areas (8) Bunkhum, Sai Mai, Lat Krabang-2, LatKrabang-1, Nong Chok-1, Klong Sam Wa, Lat Krabang-3, Nong Chok-2 Table 5.12 and Figure 5.9 show sewerage system development plan based on the classification of treatment areas. Since a total construction cost to complete all the sewerage projects by 2040 is estimated to be 101.9 billion Baht, and an annual average of initial investment is calculated to be 3.4 billion Baht (approximately 3 times DDS’s annual budget for recent years), significant increase of budget is necessary to achieve long term goal of M/P until 2040. In order to cover a tremendous amount of investment, introduction of loans from bilateral or multilateral financial institutions such as JICA together with increase of budget of BMA and central government is recommended. It is proposed that implementation of sewerage projects in 5 treatment areas including on going project and for which F/S is prepared should be completed by 2020, 7 treatment areas with higher priority by 2030, and the remaining 8 treatment areas by 2040 on an assumption that budget will be significantly increased.

60
Source: JST
Figure 5.9 Implementation Plan of Sewerage Projects

61
Tabl
e 5.
11.1
Sew
erag
e Sy
stem
Dev
elop
men
t Pla
n
1. S
i Pra
ya30
,000
10. B
ang S
ue 2)
120,
000
4,58
412
. Tho
n Bu
ri So
uth
142,
000
5,02
714
. Bun
khum
138,
000
6,99
22.
Rat
tana
kosin
40,0
009.
Klo
ng T
oei
3)36
0,00
011
,046
6. T
hung
Kru
Nor
th54
,000
2,32
422
. Sai
Mai
64,0
003,
436
3. D
in D
aen
350,
000
11. T
hon
Buri
Nor
th16
0,00
05,
871
13. W
angt
honl
ang
117,
000
4,60
824
. Lat
Kra
bang
-210
7,00
05,
410
4. C
hong
Non
si20
0,00
016
. Non
g Bon
13
4,00
06,
873
15. D
on M
uaen
g15
5,00
07,
100
18. L
at K
raba
ng-1
30,0
001,
446
5. N
ong K
haem
1)23
4,00
017
. Min
Bur
i14
0,00
05,
760
21. L
at P
rao
192,
000
8,84
019
. Non
g Cho
k-1
97,0
003,
686
7. T
hung
Kru
Sou
th65
,000
20. J
omth
ong
222,
000
8,85
123
. Klo
ng S
am W
a 15
7,00
06,
691
8. C
hatu
chak
150,
000
27. T
aling
Cha
n51
,000
2,00
525
. Lat
Kra
bang
-315
,000
902
26. N
ong C
hok-
211
,000
434
Total
1,06
9,00
091
4,00
034
,134
933,
000
38,7
5561
9,00
028
,997
Not
e: 1)
Cur
rent
capa
city
of 1
57,0
00 m
3 /day
is to
be e
xpan
ded
2) C
ntra
ct am
ooun
t
3) E
stim
ated
by
F/S
Sour
ce: J
ST
Exist
ing
Und
er co
nstru
ctio
n an
d F/
S to
be p
repa
red
(up
to 2
020)
High
prio
rity
treat
men
t are
as(u
p to
203
0)Lo
w p
riorit
y tre
atm
ent a
reas
(up
to 2
040)
Trea
tmen
t are
aTr
eatm
ent
capa
city
(m3 /d
ay)
Trea
tmen
t are
aTr
eatm
ent
capa
city
(m3 /d
ay)
Cons
truct
ion
cost
(mill
ion
Baht
)Tr
eatm
ent a
rea
Trea
tmen
tca
pacit
y(m
3 /day
)
Cons
tructi
onco
st (m
illio
nBa
ht)
Trea
tmen
t are
aTr
eatm
ent
capa
city
(m3 /d
ay)
Cons
truct
ion
cost
(mill
ion
Baht
)
Cont
ract
amou
nt