preparation of liposomes: a novel application of ... research preparation of liposomes: a novel...
TRANSCRIPT

Loughborough UniversityInstitutional Repository
Preparation of liposomes: anovel application of
microengineered membranes
This item was submitted to Loughborough University's Institutional Repositoryby the/an author.
Citation: LAOUINI, A. ... et al., 2013. Preparation of liposomes: a novelapplication of microengineered membranes. RSC Advances, 3 (15), pp. 4985 -4994.
Additional Information:
• This article was accepted for publication in the journal, RSC Advances[ c© Royal Society of Chemistry] and the definitive version is available at:http://dx.doi.org/10.1039/C3RA23411H
Metadata Record: https://dspace.lboro.ac.uk/2134/12141
Version: Accepted for publication
Publisher: c© Royal Society of Chemistry
Please cite the published version.

This item was submitted to Loughborough’s Institutional Repository (https://dspace.lboro.ac.uk/) by the author and is made available under the
following Creative Commons Licence conditions.
For the full text of this licence, please go to: http://creativecommons.org/licenses/by-nc-nd/2.5/

Original research
Preparation of Liposomes: A Novel Application of Microengineered Membranes - Investigation of the Process Parameters and Application to the Encapsulation
of Vitamin E
A. Laouini1,2, C. Charcosset2, H. Fessi2, R.G. Holdich1, G.T. Vladisavljević1*
1: Loughborough University, Department of Chemical Engineering, Loughborough, Leicestershire, LE11 3TU, United Kingdom 2 : Université Claude Bernard Lyon 1, Laboratoire d’Automatique et de Génie des Procédés (LAGEP), UMR-CNRS 5007, CPE Lyon, Bat 308 G, 43 Boulevard du 11 Novembre 1918, F-69622 Villeurbanne Cedex, France.
*: To whom correspondence should be addressed: [email protected]
Tel: + 44 (0) 1509 222518; Fax: + 44 (0) 1509 223923

Abstract Liposomes with a mean size of 59−308 nm suitable for pulmonary drug delivery were prepared by the ethanol injection method using nickel microengineered flat disc membranes with a uniform pore size of 5−40 μm and a pore spacing of 80 or 200 μm. An ethanolic phase containing 20−50 mg/ml phospholipid (1-palmitoyl-2-oleoyl-sn-glycero-3-phosphocholine (POPC) or Lipoid® E80), 5−12.5 mg/ml stabilizer (cholesterol, stearic acid or cocoa butter), and 0 or 5 mg/ml vitamin E was injected through the membrane into an agitated aqueous phase at a controlled flux of 142−355 l/m2/h and a shear stress on the membrane surface of 0.80−16 Pa. The mean particle size obtained under optimal conditions was 84 and 59 nm for Lipoid E80 and POPC liposomes, respectively. The particle size of prepared liposomes increased with increasing the pore size of the membrane and decreased with increasing the pore spacing. Lipoid E80 liposomes stabilized by cholesterol or stearic acid maintained their initial size within 3 months. A high entrapment efficiency of 99.87% was achieved when Lipoid E80 liposomes were loaded with vitamin E. Transmission electron microscopy images revealed spherical multi-lamellar structure of vesicles. A reproducibility of the developed fabrication method was high. Key words: Liposomes – Vitamin E – Encapsulation – Microsieve membrane – Membrane emulsification

Preparation of Liposomes: A Novel Application of Microengineered Membranes – Investigation of Process Parameters and Application to the Encapsulation of
Vitamin E
1. Introduction Over the last decades, advances in pharmaceutical science and technology have facilitated the availability of an extensive range of novel drug carriers including nanoparticles, nanocapsules, nanospheres and liposomes. Liposomes are known as self-assembled vesicles witmh a phospholipid bilayer structure, which contains an aqueous cavity [1]. Because of their structure, liposomes can entrap hydrophilic agents in their internal aqueous compartment and lipophilic ones within the lipid membrane [2]. Owing to their biocompatibility, biodegradability and low toxicity, liposomes have attracted much attention in a wide variety of fields including contrast agents, cosmetics, and drug delivery systems [3]. Rational liposome design can be done by selecting an appropriate formulation and production method. For pharmaceutical and clinical use, several criteria must be fulfilled in terms of size and size distribution which are of critical importance for in vivo applications of a liposomal formulation. In particular, the size of liposomes affects drug loading, biodistribution, targeting, acoustic response, therapeutic efficacy and rate of clearance from the body. In addition, the method used for liposome preparation must be reproducible and process conditions must allow production at reasonable costs and economic scale-up [4]. Since the pioneering discovery of Bangham several decades ago [1], the development of liposomes preparation methods has been astonishing. Indeed, numerous preparation techniques have been reported in the literature. Thin film hydration, reversed-phase evaporation, detergent dialysis and solvent injection are the most commonly applied methods for liposome formulation. More details can be found in a recent review on liposomes [5]. The conventional ethanol injection technique first described by Batzari and Korn [6] offers many advantages, such as simplicity, the absence of potentially harmful chemicals and complicated physical treatments, the possibility of production of small-sized liposomes with minimum technical requirements and the possibility of scale up. Several novel approaches based on the ethanol injection technique are reported such as the microfluidic channel method [7] and the cross flow injection technique [8] whereby substantial progress was achieved, leading from conventional batch process to potential large scale continuous procedure. Microporous membranes are increasingly used for the preparation of emulsions and micro/nano particles, such as lipid nanoparticles [9], nanocapsules [10], gel microbeads [11], microcapsules [12] and liposomes [13]. Recently, a new microengineered nickel membrane has become available, consisting of an array of regulary spaced, rectilinear pores. Microengineered membranes are analogous to an

array of parallel microfluidic channels through which one fluid phase can be introduced into another fluid at an overall much higher flow rate than is possible in microfluidic devices. The membrane contactor method of liposome preparation used in this study was based for the first time on microengineered membranes. These membranes, which have a perfect hexagonal array of uniform pores, allow a much more uniform and controllable injection of lipid-containing organic phase into an aquous phase. Therefore, the use of microengineered membranes enables a better control over diffusive mixing at the liquid/membrane interface where the lipids self-assemble into vesicles. This may provide fine control of liposome size distribution and make easier the extrapolation of the results for an industrial large scale production. This new method of liposome preparation was applied to the encapsulation of α-tocopherol (one isomer of vitamin E), which prevents oxidative damage and lipid peroxidation in central and peripheral nervous systems [14]. Because of its promising therapeutic potential and safety, α-tocopherol has been tested to prevent cigarette smoke toxicity as several pulmonary disorders are mainly caused by oxidative stress phenomena [15]. However, oral or intravenous administration failed to restore the bronchoalveolar level of vitamin E [16]. Recently, attention has been drawn to pulmonary delivery of nanoencapsulated drugs, showing high intracellular uptake and improved stability and solubility of active substances; in particular liposome formulations have been used for the solubilization of poorly water-soluble drugs. Vitamin E-loaded liposomes with appropriate size distribution and high loading capacity could be an effective drug carrier to target the lungs after its pulmonary administration via aerosol. The aims of the present study were: (a) to develop and optimize a novel liposome preparation method using microengineered membranes: the experiments have been done to investigate the effects of process parameters (aqueous to organic phase volume ratio, organic phase flow rate, agitation speed), phospholipid type and concentration, stabilizer type, and membrane microstructure on the characteristics of the vesicles; (b) to apply the optimized process to the encapsulation of vitamin E; (c) to study the process reproducibility and the stability of liposomal suspensions.
2. Materials and methods 2.1 Materials
Reagents. Phospholipids used were POPC (1-palmitoyl-2-oleoyl-sn-glycero-3-phosphocholine) and Lipoid® E80, purchased from Lipoïd GmbH (Ludwigshafen, Germany). Lipoid® E80 is obtained from egg yolk lecithin and containing 82% of phosphatidyl-choline and 9% of phosphatidyl-ethanolamine. Vitamin E, cholesterol and phosphotungstic acid were supplied by Sigma-Aldrich Chemicals (Saint Quentin Fallavier, France). All reagents were acquired with their analysis certificate. Ethanol 95% was supplied by Fisher Scientific (United Kingdom) and was of analytical grade and used without further purification. Ultra-pure water was obtained from a Millipore Synergy® system (Ultrapure Water System, Millipore).

Microengineered membranes and stirred cell. The liposomes suspension was prepared using a stirred cell with a flat disc membrane fitted under the paddle blade stirrer, as shown in Figure 1 (a).
Figure 1 Both stirred cell and membranes were supplied by Micropore Technologies Ltd. (Hatton, Derbyshire, United Kingdom). The agitator was driven by a 24 V DC motor (INSTEK model PR 3060) and the paddle rotation speed could be controlled in the range from 200 to 1300 rpm by the applied voltage. The membranes used were nickel microengineered membranes containing uniform cylindrical pores with a diameter of 5, 10, 20 or 40 µm, arranged at a uniform spacing of 80 or 200 µm. The membranes were fabricated by the UV-LIGA process, which involves galvanic deposition of nickel onto the template formed by photolithography [17]. A perfect hexagonal array of pores with a pore at the centre of each hexagonal cell can be seen in the supplementary material (Figure S1). The porosity of a membrane with the hexagonal pore array is given by:
2)/)(3/(2 Ld pπε = (1)
where dp is the pore diameter and L is the interpore distance. The porosities of the membranes used in this study, calculated from Equation (1) and expresses as percentages, are given in the supplementary material (Table S1).
2.2 Protocol for preparation of liposomes A schematic diagram of the experimental set-up is shown in Figure 1 (b). The required amounts of phospholipid (20 or 50 mg/ml Lipoid E80 or POPC) and stabilizer (cholesterol, stearic acid or cocoa butter, 25% w/w based on phospholipid dry matter) were dissolved in ethanol. The organic phase was injected through the membrane using a peristaltic pump (Watson Marlow 101U, Cornwall, UK) at a constant flow rate of 2-5 ml/min corresponding to the dispersed phase flux of 142-355 l/m2/h. The stirring speed ranged from 200 to 1300 rpm, which generated a shear stress on the membrane surface between 0.80 to 15.5 Pa. The cell was filled with 20-60 ml of ultrapure water and the experiment was run until a predetermined organic to aqueous phase ratio was achieved. Spontaneous formation of liposomes started as soon as the organic phase was brought in contact with the aqueous phase. The liposomal suspension was kept under stirring for 15 min and finally the suspension was collected and the ethanol was removed by evaporation under reduced pressure (Buchi, Flawil, Switzerland). After each experiment, the membrane was sonicated in ethanol for 1 hour, followed by soaking in a siloxane-based wetting agent for 30 min (in order to increase the hydrophilicity of the membrane surface). Drug-loaded liposomes were prepared as described above, with the only difference being that 5 mg/ml vitamin E was dissolved in the ethanolic phase containing a mixture of phospholipid and stabilizer.

2.3 Characterization of liposomes In order to assess the quality of liposomes and to allow comparison between different batches, various analyses have been performed: particle size distribution, zeta potential, encapsulation efficiency, and microscopic observation. Size analysis. In this study, two different techniques for particle size characterization were used: dynamic light scattering (DLS) otherwise known as photon correlation spectroscopy (PCS) and differential centrifugal sedimentation (DCS). A Malvern Zetasizer Nano-series (Zetamaster 3000 HSA, Malvern, UK) was used for DLS measurements. Each sample was diluted 100-fold with ultra-pure water before measurement and was then analyzed in triplicate at 25°C. The average particle size was expressed as the Z-average and polydispersity was expressed as the polydispersity index, PDI. A CPS disc centrifuge, model DC 24000 (CPS instruments, Florida, USA), was used for DCS measurements. A light beam near the outside edge of the rotating disc passes through the centrifuge at some distance below the surface of the fluid and measures the concentration of particles as they settle. The time required for particles to reach the detecting beam depends upon the speed and geometry of the centrifuge, the difference in density between the particles and the fluid, and the diameter of the particles. Thus, when operating conditions are stable, sedimentation velocity increases with the particle diameter, so that the time needed to reach the detector beam is used to calculate the size of the particles [18,19]. In this study, a sucrose gradient (from 18% to 26%) was built and the sample was diluted in a sucrose solution (30%) before being injected. Prior to the analysis, the instrument was calibrated using an aqueous dispersion of polybutadiene particles of a known size distribution (mean size of the calibration standard = 402 nm). The mean particle size was expressed as the number-average mean diameter, dav and the polydispersity was expressed as the coefficient of variation, CV = (σ/dav) × 100, where σ is the standard deviation of particle diameters in a suspension. A smaller CV or PDI value indicates the narrower size distribution [20, 21]. All values of the mean particle size and PDI or CV are expressed as the mean ± standard deviation (S.D.). Zeta potential determination. The zeta potential was measured using a Malvern Zetasizer Nano-series (Zetamaster 3000 HSA, Malvern, UK) and used to predict the colloidal stability of the liposome syspension. The measurements were repeated at least three times after sample dilution in water. The zeta potential was calculated from the electrophoretic mobility using the Helmholtz-Smoluchowski equation [22]. Encapsulation efficiency. Liposome preparations are a mixture of encapsulated and non-encapsulated drug fractions. Methods to determine the fraction of encapsulated material within liposomes typically rely on destruction of the lipid bilayer and subsequent quantification of the released material. In the present study, the drug encapsulation efficiency was determined using the protamine aggregation method, as described by Wang et al. [23] and Sun et al. [24]. Briefly, the total amount of

vitamin E (TA) was determined after disrupting and dissolving vitamin E-loaded liposomes in ethanol using an ultrasound bath for 10 min. The amount of encapsulated vitamin E was determined after non-disruptive aggregation of liposomes with an equal volume of protamine solution (10 mg/ml) and a normal saline solution. The mixture was centrifuged (Heraeus, Thermo scientific, Philadelphia, USA) at 15 000 rpm for 50 min at + 4°C to remove the supernatant from the liposome - protamine aggregates. The resulting liposomal pellet was dissolved in ethanol and assayed for encapsulated vitamin E amount (EA). The vitamin E encapsulation efficiency (E.E) was calculated as follows:
100/.. ×= TAEAEE (2) The encapsulation efficiency was determined in triplicate. The concentration of vitamin E was measured using an HPLC system (Agilent System series 1100, Agilent Technologies, California, USA). The HPLC equipment consisted of a pump, an auto-sampler and a UV/VIS detector. The column used was a LiChrospher RP C18 column (5 µm, 15 cm 0.46 cm) (Supelco, Bellefonte, USA). The separation was carried out using a mixture of methanol and water (96:4 v/v) as the mobile phase at a flow rate of 1.6 ml/min. The eluent was monitored at 292 nm and peaks were recorded using the chromatography data system software provided by Agilent. Before the chromatographic data were collected, the column was equilibrated for 30 min with a minimum of 30 column volumes. At the end of the assay, the column was washed using water - acetonitrile mixture (50:50 v/v) for 60 min. This HPLC analytical method was validated (data not shown). Microscopic observation. The morphology of the liposomes was observed by Transmission Electron Microscopy (TEM) using a CM 120 microscope (Philips, Eindhoven, Netherlands) operating at an accelerating voltage of 80 kV. The sample was prepared as described in our previous study [25]. A drop of the liposome dispersion was placed on a copper grid. A thin film of the liposome dispersion was obtained by removing excess solution using a filter paper. Negative staining using a 2% phosphotungstic acid solution (w/w) was performed directly on the deposit during 1 min. Finally, the excess of phosphotungstic solution was removed with a filter paper after which the stained samples were transferred to the TEM for imaging.
2.4 Reproducibility test Once all process parameters were assessed, the experiment under optimal conditions was repeated two times. The technique reproducibility was evaluated in terms of mean particle size and size distribution.
2.5 Stability study Stability assessment is a major consideration for liposomes production. Since liposome preparations are heterogeneous in size, the average size distribution changes upon storage. Liposomes tend to fuse and grow into bigger vesicles, which

are thermodynamically more stable. Hence, time variation of the size distribution is a good indicator of the long-term stability of liposomes. Moreover, breakage of liposomes during production and storage presents a significant problem leading to drug leakage from the vesicles. Therefore, encapsulation efficiency is also an important indication of the stability of liposomes [5].
The liposomal samples were stored under conditions required by the 2008 guidelines of the ICH (International Conference on Harmonization of Technical Requirements for Registration of Pharmaceutical for Human Use): 5 ± 3°C for normal stability study. The storage period was about 3 months for drug-free liposomes and 2 months for drug-loaded liposomes. The stability was assessed by comparing the initial mean size, zeta potential and encapsulation efficiency with those achieved after the storage period. 3 Results and discussion
3.1 Mechanism of liposomes formation In our study, an ethanolic solution of vesicle-forming lipids was injected through the membrane into an agitated aqueous phase, leading to the formation of numerous micro-streams of the organic phase within a boundary layer of the aqueous phase. Due to interdiffusion of the two miscible phases, phospholipids in the ethanol/water mixture reached a solubility limit and self-assembled into vesicles [13]. The exact mechanism of liposomes formation is not yet well understood. A model of vesicle formation was proposed by Lasic [26]; this model suggests that during the injection process, the phospholipids which are completely soluble in the organic phase, precipitate at the water/ethanol phase boundary due to change in their solubility. The phospholipid bilayers peel off of the precipitated phase and forms bilayered phospholipid fragments (BPFs) in the aqueous phase. The thermodynamic instability at the edges of the BPF causes bending and when the BPF closes upon itself, a vesicle is formed. The BPF was suggested to be an intermediate structure in all vesicle formation processes.
3.2 Optimization of phospholipid concentration
As can be seen from Table 1, as the phospholipid concentration in the organic phase was increased from 20 to 50 mg/ml, the mean vesicle size increased from 187 to 227 nm and the PDI increased from 22 to 29%. Probably, at the higher phospholipid concentration in the organic phase, more phospholipid molecules are incorporated into each vesicle and larger vesicles are formed.
Table 1 Our results are in agreement with those reported elsewhere. Laouini et al. [27] observed that the mean size of liposomes, prepared using a hollow fiber membrane contactor, increased from 114 to 228 nm when the phospholipid concentration in the organic phase increased from 20 to 80 mg/ml. In addition, Jaafar-Maalej et al. [13] prepared liposomes using SPG membranes and observed that the average size was

around 50 and 95 nm at the phospholipid concentration in the organic phase of 20 and 60 mg/ml, respectively. The similar trends with larger vesicles at higher phospholipid contents in the organic phase were reported in other liposome preparation techniques such as the modified ethanol injection method [28] and the microfluidic method [29]. Therefore, 20 mg/ml was selected as the optimum phospholipid concentration in the ethanolic phase in the subsequent parts of the study, since it gave vesicles with the smaller mean size.
3.3 Optimization of aqueous to organic phase ratio In order to investigate the effect of aqueous phase volume, liposomes were prepared using approximately 13 ml of the organic phase and respectively 20, 40 and 60 ml of water; corresponding to an aqueous to organic phase volume ratio of 1.5, 3 and 4.5. As can be seen in Table 1, the mean size of liposomes decreased as the aqueous phase volume increased. Indeed, at the higher aqueous to organic phase volume ratio, phospholipids from the organic phase become more diluted after mixing with the aqueous phase, which may result in the formation of smaller vesicles. Moreover, formation of a more diluted liposomal suspension may help to prevent the fusion of small liposomes to larger vesicles, which can occur immediately after their formation. The similar results were obtained using a hollow fiber membrane module [27]; increasing the aqueous to organic phase volume ratio from 0.4 to 2 led to a decrease in the mean size of liposomes from 189 to 114 nm. When the organic phase was injected through a 0.9 µm SPG membrane into aqueous phase with a volume of 400 and 500 ml, the mean particle size of liposomes was 203 and 61 nm, respectively [13]. Our data suggests that the optimum aqueous to organic phase volume ratio is 4.5 since it produced liposomes with the smallest mean size. Thus, in the following experiments, the aqueous phase volume was set at 60 ml and the organic phase volume was set at approximately 13 ml.
3.4 Optimization of agitation speed Table 1 also illustrates the effect of the stirrer speed on the particle size distribution of the prepared liposomes. When the stirrer speed was increased by a factor of 6.5 (from 200 to 1300 rpm), the mean size decreased by 58% (from 219 to 92 nm). The decrease in the particle size was the most pronounced in the range from 200 to 600 rpm. In addition, an increase in the agitator speed from 200 to 1300 rpm led to a broader size distribution (the PDI was 8, 22 and 41% for the agitation speed of 200, 600 and 1300 rpm, respectively). A decrease in the particle size with an increase in the stirrer speed was due to increase in the interdiffusion rate of the two phases. The faster diffusion rates generally lead to smaller vesicles because the local phospholipid concentration during vesicle formation is lower due to a more uniform distribution of phospholipids over the ethanol/water mixture. A similar trend was

reported by Dragosavac et al. [30] in membrane emulsification using the same stirred cell device and it was attributed to the higher drag force acting on droplets on the membrane surface. The droplet size was significantly reduced when the stirrer speed increased up to 600 rpm, but this effect was less pronounced at the higher stirrer speeds; the average droplet size was almost constant at stirrer speeds above 1100 rpm. Our results are also in agreement with other membrane emulsification studies using the stirred cell device [31, 32]. In this study, 600 rpm was selected as the optimum agitation speed taking into consideration both the size of liposomes and their uniformity.
3.5 Optimization of the organic phase flow rate As the flow rate of the organic phase decreased, so did the liposome size. Table 1 shows that the liposome size was 121 and 84 nm at the flow rate of 5 and 2 ml/min, respectively. These two flow rates are equivalent to the transmembrane flux of 142 and 355 l/m2/h, respectively. Increase in the flow rate of the organic phase leads to an increase in the rate of transfer of phospholipids (PL) to the membrane surface, given by the product: CoQo, where Co is the PL concentration in the organic phase and Qo is the organic phase flow rate. Our results indicate that the size of liposomes increases with increasing the rate of transfer of PL to the membrane surface or decreasing the rate of transfer of PL away from the membrane surface. Therefore, the largest vesicles are formed at the conditions corresponding to the maximum concentration of PL at the membrane/aqueous phase interface. The similar trends were observed in liposome preparation using SPG membrane and hollow fiber membrane. Laouini et al. [27] observed a decrease of the liposome size from 129 to 114 nm when the organic phase pressure was reduced from 3.8 to 1.8 bar. Jaafar-Maalej et al. [13] found that a peak in the particle size distribution of liposomes was shifted from around 45 to 80 nm as the organic phase pressure increased from 3 to 5 bar. Sheibat-Othman et al. [33] have produced pH-sensitive particles by injecting organic phase into aqueous phase in a membrane contactor and obtained larger particles at higher organic phase flow rates. In this study, based on the obtained results 2 ml/min was considered as the optimum organic phase flow rate, since it produced liposomes with the smaller size at acceptable production rate.
3.6 Choice of the stabilizer The liposomal preparation developed in this study is intended to be aerosolized in order to target the smokers lungs. Therefore, it would be meaningful if cholesterol used as a stabilizer could be replaced by another lipid, since cholesterol is usually associated with atherosclerosis and cardio-vascular diseases [34]. In the present study, we have investigated the use of stearic acid and cocoa butter as alternative stabilizers to cholesterol. Stearic acid was already tested in liposomal formulations [35, 36]; however only the encapsulation efficiency was assessed and no investigation on long-term stability has

been carried out. Cocoa butter has never been used in a liposome preparation; it was choosen since it is a widely used excipient in pharmacy and exhibits a better biocompatibility and lower in-vivo toxicity than semi-synthetic lipids. Cocoa butter contains 41% stearic acid of its typical fatty acid content, it is solid at room temperature and melts between 32 and 38°C. As shown in Table 1, at the same experimental conditions (the phospholipid concentration of 20 mg/ml, the aqueous to organic phase ratio of 4.5, the agitator speed of 600 rpm, and the transmembrane flux of 142 l/m2/h), the initial vesicle size was 84, 154, and 135 nm for liposomes stabilised by cholesterol, stearic acid and cocoa butter, respectively. However, only liposomes prepared using cholesterol or stearic acid maintained their initial mean size after 3 months (Figure 2). Liposomes prepared using cocoa butter doubled in size during the storage period (from 135 nm at day 0 to 324 nm at day 90). Therefore, it can be concluded that stable liposomes can be obtained using cholesterol or stearic acid. Although stearic acid was an efficient long-term stabilizer of liposomes, under the same experimental conditions significantly smaller and more uniform vesicles can be produced using cholesterol (the PDI increased from 24 to 37% and the mean size from 84 to 154 µm when cholesterol was replaced by stearic acid in the liposomal formulation). Cocoa butter was not suitable for long-term stabilisation, although the initial vesicle uniformity was comparable to that achieved with cholesterol.
Figure 2
3.7 Choice of the phospholipid Two phospholipids were tested in this study: Lipoid E 80 and POPC. Table 1 shows that under optimal conditions both phospholipids enable the formation of liposomes with a mean size below 85 nm and acceptable size distribution. Therefore our optimized process can be used to prepare liposomes containing any of these two phospholipids.
3.8 Reproducibility of the optimized process Based on the previous findings, the formulation composed of 60 ml of water and 13 ml of ethanolic phase containing 20 mg/ml of phospholipid (Lipoid E 80 or POPC) and 5 mg/ml of cholesterol was taken to produce an optimal liposome suspension using a microengineered membrane with a mean pore size of 20 µm and a pore spacing 80 µm. The organic phase flow rate was 2 ml/min, which is equivalent to the transmembrane flux of 142 l/m2/h, and the agitation speed was 600 rpm. The experiment conducted under these optimum conditions was repeated twice with both Lipoid E 80 and POPC in order to test the reproducibility of the technique. The resulting data, presented in Figure 3, revealed very good reproducibility, in terms of mean size and PDI, between different liposome batches produced using the same type of phospholipid.
Figure 3

The other results (not shown here) obtained in repeated experiments performed under identical conditions confirm good reproducibility of the preparation process.
3.9 Comparison of different particle size characterization methods The DLS (dynamic light scattering) instrument does not require calibration and sample preparation prior to each measurement. Due to its simplicity and speed, the DLS method was used for size characterization of liposomes during the optimization step. The differential centrifugal sedimentation (DCS) requires a density gradient to be built up with 9 different sucrose concentrations (from 18% to 26%) and the sample should be diluted in 30% sucrose solution prior to each measurement. In addition, calibration of the instrument is required using a sample of known particle size. Thus, DCS was only used once the process was optimized to corroborate the values for particle size by checking for multiple modes in the size distribution. The four reproducibility test batches (two using the lipoid E 80 and two using the POPC) were characterized using DCS and the results were compared with those obtained with the DLS instrument in Table 2.
Table 2 As can be seen, the results obtained using the same sample differ significantly depending on the characterization method used. The larger mean particle sizes and broader particle size distributions were obtained using DCS, which can be explained by the fact that in DCS, the sedimentation velocity increases as the square of the particle diameter, so particles that differ in size by only a few percent settle at appreciably different rates. This means that the DCS method can achieve a higher resolution of particle size compared to the DLS method. The DCS method also has a higher sensitivity which enables the detection of small additional peaks and picks up small changes in the size distribution. In addition, all measurements using DCS were run against a known calibration standard which assures a high accuracy of the size analysis. Given that the CPS instrument was more accurate and more sensitive, the DCS method was used for particle size measurements in the subsequent parts of this study.
3.10 The effect of ethanol removal During the preparation process, the ethanolic phase was injected through the membrane pores into the aqueous phase. The obtained liposomes were in the nanometric range, although the pore diameter ranged between 5 and 40 µm. In order to investigate the effect of solvent evaporation on the vesicle size, the particle size distribution of liposomes was measured before and after rotary evaporation and the results are presented in the supplementary material (Table S2). As can be seen in Table S2, no significant difference in the mean particle size and size distribution was observed in the liposomal suspension before and after solvent removal, which means that the vesicle formation process was mainly controlled and driven by the rate of interdiffusion of the two phases. Vesicles were formed once the

organic phase was brought into contact with the aqueous phase, irrespective of the ethanol removal rate. Therefore, the critical concentration of phospolipid in the ethanol/water mixture was reached without solvent evaporation, simply by dilution of the organic phase with water present in the cell. Because ethanol evaporation did not affect the liposome size and size distribution, it was not necessary to optimize experimental conditions in the rotary evaporator such as evaporation temperature, pressure, rotation speed of the flask, etc.
3.11 The effect of membrane cleaning and wetting procedure The membrane was immersed in a siloxane-based wetting agent for 30 min before each experiment in order to improve the hydrophilicity of the membrane surface. The reason for this treatment was to prevent the organic phase from being spread over the membrane surface and to ensure that tiny jets of the organic phase emerging from the membrane pores penetrate thoroughly into the aqueous phase. Table S3 summarises the results of two experiments performed under identical conditions with a brand new membrane used without any surface treatment and the one re-used after cleaning and treatment with the wetting agent. No difference in the mean size of liposomes and CV was observed between the two membranes, which means that the membrane properties were completely restored after cleaning and that the treatment with a wetting agent, critically important in membrane emulsification, is not needed in liposome production.
3.12 The effect of membrane microstructure In order to investigate the effect of the membrane characteristics on the liposomes mean size, experiments were conducted using 6 different membranes with nominal pore sizes 5, 10, 20 and 40 µm. The membranes with pore sizes of 5 and 10 µm had a pore spacing of 200 µm, whereas the membranes with 20 and 40 µm were supplied with two different pore spacings (80 and 200 µm). As shown in Figure 4 (a), as the interpore spacing increased, the particle mean size decreased. This may be explained by the fact that when the distance between the membrane pores increased, the newly formed vesicles are less likely to aggregate. The liposome size is determined by a balance between the nucleation and growth rates. The larger the pore spacing, the smaller the number of organic phase micro-streams (potential nuclei) formed in the aqueous phase and the higher the amount of phospholipid delivered through each pore; hence, smaller number of larger vesicles will be formed. It could also be noticed from Figure 4 (a) that the influence of the pore spacing is more pronounced for larger pore sizes.
Figure 4 Figure 4 (b) summarizes the effect of the membrane pore size on the size of the liposomes produced. Our results are in agreement with those reported for membrane emulsification in the same stirred cell. Dragosavac et al. [30] used the same type of microengineered membranes to produce oil-in-water emulsions and found that the

size of oil drops increased by a factor of 1.8 when the pore size was changed from 19 to 40 µm. Many other studies on membrane emulsification indicate that the particle size increases linearly with increasing the pore size [37, 38]. Our data fitted well to a linear model with a gradient of 0.22 nm/µm and R2=0.992 (Figure 4 c). Thus, our study confirmed that the liposome size depends on the membrane structure (pore size, spacing); this underlines the feasibility of controlling the liposome size by using microengineered membranes with different pore sizes and interopore distances.
3.13 Loading of vitamin E into liposomes Table 3 shows the effect of entrapment of vitamin E on the liposome size and size distribution.
Table 3 The addition of the drug increased the vesicle mean size from 88 to 96 nm and the CV from 32 to 44%. The increase in the vesicle size could be explained by the entrapment of the drug within the phospholipidic bilayers. The negative values of the zeta-potential were obtained (around -28 mV), which could be attributed to the presence of negatively charged phospholipids in bilayers. The zeta potential measurements give information on the surface properties of the colloidal system and could therefore be useful to determine the type of the association between the active substance and the colloidal system (for example whether the drug is encapsulated in the lipid matrix or simply adsorbed on the surface) [39]. Table 3 indicates that the presence of the drug did not affect the negative surface charge. This result suggests that all vitamin E was encapsulated within the lipid bilayers without any adsorption to the vesicles surface. The greater the zeta potential the more likely the suspension to be stable, because the charged particles repel each other and this overcomes their natural tendency to aggregate [40, 41]. It is currently believed that the absolute value of zeta potential above 15 is required for a good electrostatic stabilization [42]. Thus, our zeta-potential values were sufficient to prevent liposomes aggregation and predict a good stability of the liposomal suspensions. The high encapsulation efficiency of vitamin E within liposomes (99.87 ± 1.14%) was probably due to the high lipophilicity of the drug. This result was in agreement with those reported in the literature. Marsanasco et al. [35] reported that the percent of vitamin E encapsulated within liposomes prepared by the method of Bangham was equal to 98.13 ± 0.02%. The prepared liposomal suspension is intended to be aerosolized for specific delivery of vitamin E to the alveoli level. Several previous studies have shown that the aerosolization of colloidal systems would enhance their aggregation which is dependent on the nebulizer design. No specific correlation was found between the initial size and the size of the nebulized droplets [43, 44]. For instance, the mass median diameters of aerosols generated upon nebulization were 2 to 14.4 folds larger than primary geometric particle diameters [45]. Therefore, the aerosolization of our vitamin E-loaded liposomes would generate particles less than 1.5 µm which is

suitable to reach the alveolar space since many studies reported that for specific delivery to the alveoli a size less than 5 µm was required [46].
3.14 TEM observation
The micrographs of drug-free liposomes (prepared using Lipoid E 80 and POPC) and drug-loaded liposomes taken by Transmission Electron Microscopy (TEM) are given in Figure 5.
Figure 5 As could be seen, liposomes were of spherical shape with multilayered membrane structure. Their size estimated from TEM pictures was in the range of 50-150 nm which is coherent with values obtained using DLS and DCS.
3.15 Stability study The variations of the zeta potential, the vesicle mean size and CV were followed over the storage time of 3 months for drug-free liposomes and 2 months for drug-loaded liposomes at 5 ± 3°C. The stability data are shown in Table 4 and Figure 6.
Table 4 Figure 6
According to Heurtault et al.42, the size determination is a good indicator of stability since in most cases the particle size increased before macroscopic changes appeared. Our stability data show that the average size remained nearly unchanged during the storage period. In addition, the zeta potential was maintained at its initial value and no aggregation or sedimentation was observed during storage. Also, there were no significant changes in the vesicle size distribution during the same period (data not included). These results demonstrate a good stability of the liposome suspensions and thus indicate an adequate formulation of the preparation and optimum selection of process conditions. 4 Conclusions In this study, we present a novel application of microengineered membranes: the preparation of size-controlled liposomes. The purpose of the research was to study the effect of the formulation factors and the process parameters on the final characteristics of lipid vesicles. The liposome formation was based on a diffusion-driven process in which the dissolved phospholipids (Lipoid E 80 or POPC) self-assemble into liposomes as ethanol quickly diffuses and dilutes into agitated aqueous stream at the microsieve/aqueous phase interface. The size and size distribution of liposomes was precisely controlled through adjusting phospholipid concentration and flow rate of the organic phase, pore size and spacing of the

microengineered membrane used for injection of the organic phase, the degree of agitation in the cell and the mixing ratio of the two phases. This indicates that with a careful choice of formulation factors and process parameters, liposomes could be obtained with a defined size distribution. The rate of evaporation of ethanol did not have any appreciable effect, indicating that the process was controlled by the rate of interdiffusion of the two miscible liquids. The reproducibility of the optimized process was good, and after each experiment the membrane surface could be easily cleaned and fully regained its hydrophilicity. The prepared samples remained stable for 3 months. We have shown that a simple low-volume stirred cell is a useful apparatus for a quick testing of different experimental conditions. For continuous and larger-scale production, other experimental set-ups should be employed, such as crossflow and oscillation membrane systems and it will be the subject of our future investigation. 5 References
[1] Bangham, A. D. Ann N Y Acad Sci. 1978, 308, 2-7.
[2] Torchilin, V. T. Drug Discov. 2005, 4, 145-160.
[3] Lian, T.; Ho, R. J. Y. J Pharm Sci. 2001, 90, 667-680.
[4] Wagner, A.; Platzgummer, M.; Kreismayr, G. J Liposome Res. 2006, 16, 311-319.
[5] Laouini, A.; Jaafar-Maalej, C.; Limayem-Blouza, I.; Sfar-Gandoura, S.; Charcosset, C.; Fessi, H. J Colloid Sci. Biotechnol. 2012, 1, 147-168.
[6] Batzri, S. Korn, E. D. Biochim Biophys Acta. 1973, 298, 1015-1019.
[7] Jahn, A.; Vreeland, W. N.; Gaitan, M.; Locascio, L. E. J Am Chem Soc. 2004. 126, 2674–2675.
[8] Wagner, A.; Vorauer-Uhl, K.; Katinger, H. J Liposome Res. 2002, 12, 259-270.
[9] Charcosset, C.; El Harati, A,; Fessi, H. J. Controlled Release. 2005. 108, 112-120.
[10] Charcosset, C.; Fessi, H. Drug Dev. Ind. Pharm. 2005. 31, 987-992.
[11] Zhou, Q. Z.; Wang, L. Y.; Ma, G. H.; Su, Z. G. J. Colloid Interface Sci. 2007. 311, 118-127.
[12] Wagdare, N. A.; Marcelis, A. T. M.; Boom, R. M.; Van Rijn, C. J. M. J. Colloid Interface Sci. 2011. 355, 453-457.
[13] Jaafar-Maalej, C.; Charcosset, C.; Fessi, H. J. Liposome Res. 2011. 3, 213-220.

[14] Terrasa, A. M.; Guajardo, M. H.; Marra, C. A.; Zapata, G. Vet. J. 2009. 182, 463-468.
[15] Scherrer-Crosbie, M.; Paul, M.; Meignan, M.; Dahan, E.; Lagrue, G.; Atlan, G.; et al. J. Appl. Physiol. 1996. 81, 1071-1077.
[16] Kato, Y.; Watanabe, K.; Nakakura, M.; Hosokawa, T.; Hayakawa, E.; Ito, K. Chem. Pharm. Bull. 1993. 41, 599-604.
[17] Vladisavljević, G. T.; Kobayashi, I.; Nakajima, M. Microfluid. Nanofluid. 2012. 13, 151-178.
[18] Fitzpatrick, S. T.; US patent number 5,786,898. 28 July 1998.
[19] Schucks, P. Biophys. J. 2000. 82, 1096-1111.
[20] Cheng, C.; Chu, L.; Xie, R. J. Colloid Interface Sci. 2006. 300, 375-382.
[21] Nazir, A.; Schroen, K.; Boom, M. J. Membr. Sci. 2010. 362, 1-11.
[22] Hunter, R.; Midmore, H. Z. J. Colloid Interface Sci. 2001. 237, 147-149.
[23] Wang, X. H; Cai, L. L.; Zhang, X. Y.; Deng, L. Y.; Zheng, H.; Deng, C. Y et al. Int. J. Pharm. 2010. 410, 169-174.
[24] Sun, W.; Zhang, N.; Li, A.; Zou, W.; Xu, W. Int. J. Pharm. 2008. 353, 243-250.
[25] Laouini, A.; Jaafar-Maalej, C.; Sfar-Gandoura, S.; Charcosset, C.; Fessi, H. Prog Colloid Polym Sci. 2012. 139, 23-28.
[26] Lasic D. D. Biochem J. 1988. 256, 1-11.
[27] Laouini, A.; Jaafar-Maalej, C.; Sfar-Gandoura, S.; Charcosset, C.; Fessi, H. Int J Pharm. 2011. 415, 53-61.
[28] Kremer, J. M. H.; Vander Esker, M. W.; Pathmamanoharan, C.; Wiessema, P. H. Biochemistry. 1977. 16, 3932-3935.
[29] Pradhan, P.; Guan, J.; Lu, D.; Wang, P. G.; Lee, L. G.; Lee, R. J. Anticancer Res. 2008. 28, 943-948.
[30] Dragosavac, M. M.; Sovilj, M. N.; Kosvintsev, S. R.; Holdich, R. G.; Vladisavljević, G. T. J. Membr. Sci. 2008. 322, 178-188.
[31] Stillwell, M. T.; Holdich, R. G.; Kosvintsev, S. R.; Gasparini, G.; Cumming, I. W. Ind. Eng. Chem. Res. 2007. 46, 965-972.
[32] Kosvintsev, S. R.; Gasparini, G.; Holdich, R. G.; Cumming, I. W.; Stillwell, M. T. Ind. Eng. Chem. Res. 2005. 44, 9323-9330.
[33] Sheibat-Othman, N.; Brune, T.; Charcosset, C.; Fessi, H. Colloids Surf. A. 2008. 315, 13-22.
[34] LaRosa, J. C.; Hunninghake, D.; Bush, D.; Criqui, M. H.; Getz, G. S.; Gotto, A. M. Jr.; et al. Circulation. 1990. 81, 1721-1733.
[35] Marsanasco, M.; Márquez, A. L.; Wagner, J. R.; Alonso, S. V.; Chiaramoni, N. S. Food Res. Int. 2011. 44, 3039-3046.
[36] Hsieh, Y. F.; Chen, T. L.; Wang, Y. T.; Chang, J. H.; Chang, H. J. Food Sci. 2002. 67, 2808-2813.
[37] Vladisavljević, G. T.; Schubert, H.; 2003. J. Membr. Sci. 2003. 225, 15-23.
[38] Williams, R. A.; Peng, S. J.; Wheeler, D. A.; Morley, N. C.; Taylor, D.; Whalley, M.; et al. Chem. Eng. Res. Des. 1998. 76 A 8, 902-910
[39] Barratt, G. Cell. Mol. Life Sci. 2003. 60, 21–37.
[40] Mora-Huertas, C. E.; Fessi, H.; Elaissari, A. Int. J. Pharm. 2010. 385, 113-142.
[41] Wiacek, A.; Chibowski, E. Colloids Surf. A. 1999. 159, 253–261.
[42] Heurtault, B.; Saulnier, P.; Pech, B.; Proust, J. E.; Benoit, J. P. Biomaterials. 2003. 24, 4283-4300.
[43] Dailey, L. A.; Schmel, T.; Gessler, T.; Wittmar, M.; Grimminger, F.; Seeger, W.; et al. J. Controlled Release. 2003. 86, 131-144.
[44] McCallion, O. N. M.; Taylor, K. M. G.; Thomas, M.; Taylor A. J. Int. J. Pharm. 1996. 133, 203-214.
[45] Bosquillon, C.; Rouxhet, P. G.; Ahimou, F.; Simon, D.; Culot, C.; Preat, V.; et al. J. Controlled Release. 2004. 99, 357-367.
[46] Schreir, H.; Gonzalez-Rothi, R. J.; Stecenko, A. A. J. Controlled Release. 1993. 24, 209-223.

(a)
(b)
Figure 1. (a) Schematic illustration of the stirred cell with simple paddle stirrer above a flat disc membrane (b = 12 mm, D = 32 mm, Dm = 33 mm, nb = 2 and T = 40 mm). (b) Schematic diagram of the experimental set-up.

Figure 2. Stability data for Lipoid E80 liposomes prepared using various lipids (cholesterol, stearic acid or cocoa butter) as stabilizers. The experimental conditions are specified in Table 1. The size characterization was performed using DLS.

Figure 3. Reproducibility data for liposome suspensions prepared under optimal conditions. The size characterization was performed using DLS.

Figure 4. Influence of the nominal pore size and pore spacing of the membrane on the liposome mean size. The experimental parameters: phospholipid: 20 mg/ml lipoid E80, stabilizer: 5 mg/ml cholesterol, aqueous to organic phase volume ratio: 4.5, agitation speed: 600 rpm, and organic phase flow rate: 2 ml/min. The size characterization was performed using DCS.
(a)
(b)
(c)

Figure 5. Transmission electron microscopy of drug-free liposomes prepared using lipoid E80 (a) or POPC (b) and drug-loaded liposomes (c).
(a) (b) (c)

Figure 6. Stability data of drug-free liposomes prepared using Lipoid E80 (a) and POPC (b) (results presented are the average of reproducibility batches) and drug-loaded liposomes (c). The size characterization was done using DCS.
(a)
(b)
(c)

Table 1.
Influence of formulation factors and process parameters (phospholipid concentration, aqueous to organic phase volume ratio, agitation speed, transmembrane flux, stabilizer type and phospholipid type) on liposomes characteristics (mean size and PDI). The method used for size characterization was the DLS.
Phospholipid concentration (mg/ml)
Aqueous to organic phase volume ratio
Agitation speed (rpm)
Transmembrane flux (l/m2/h)
Stabilizer nature
Phospholipid nature
Mean size* (nm)
PDI* (%)
20 3 600 355 Cholesterol Lipoid E 80 187 ± 3 22 ± 1
50 3 600 355 Cholesterol Lipoid E 80 227 ± 3 29 ± 1
20 1.5 600 355 Cholesterol Lipoid E 80 308 ± 2 21 ± 1
20 4.5 600 355 Cholesterol Lipoid E 80 121 ± 1 22 ± 1
20 4.5 200 355 Cholesterol Lipoid E 80 219 ± 3 8 ± 1
20 4.5 1300 355 Cholesterol Lipoid E 80 92 ± 1 41 ± 1
20 4.5 600 142 Cholesterol Lipoid E 80 84 ± 2 24 ± 1
20 4.5 600 142 Stearic acid Lipoid E 80 154 ± 4 37 ± 1
20 4.5 600 142 Cocoa butter Lipoid E 80 135 ± 2 24 ± 1
20 4.5 600 142 Cholesterol POPC 59 ± 2 30 ± 2
*: Each value represents the mean ± S.D. (n=3)

Table 2.
Size characterization of liposome suspension containing two different phospholipid (PL) types, prepared under optimal conditions, using two different characterization methods.
PL Dynamic light
scattering (DLS)
Differential centrifugal sedimentation
(DCS)
Lipoid E 80
Mean size* (nm) 84 ± 1 110 ± 3
PDI or CV* (%) 25 ± 2 37 ± 2
POPC
Mean size* (nm) 58 ± 1 88 ± 1
PDI or CV* (%) 28 ± 2 34 ± 1
*: Each value represents the mean of the 2 batches of reproducibility ± S.D. (n=3).

Table 3.
Effect of vitamin E loading on the characteristics of liposomal suspension. The experimental parameters: phospholipid: 20 mg/ml Lipoid E 80, stabilizer: 5 mg/ml cholesterol, vitamin E: 5 mg/ml, aqueous to organic phase volume ratio: 4.5, stirring speed: 600 rpm, organic phase flow rate: 2 ml/min, pore size: 10 µm, pore spacing: 200 µm. The size characterization was performed using DCS.
Liposome suspension
Mean size* (nm) CV* (%)
Zeta potential*
(mV) E.E.* (%)
Drug-free 88 ± 2 32 ± 1 -28.0 ± 0.9
Drug-loaded 96 ± 3 44 ± 2 -28.5 ± 0.8 99.87 ± 1.14
* Each value represents the mean ± S.D. (n=3)

Table 4.
Encapsulation efficiency stability ± S.D.* (%) of vitamin E loaded liposome suspension stored at 5 ± 3°C.
After preparation After 1 month After 2 months 99.87 ± 1.14 99.76 ± 1.03 98.81 ± 1.20
Experimental conditions of liposome suspension preparation: phospholipid: 20 mg/ml Lipoid E 80, stabilizer: 5 mg/ml cholesterol, 5 mg/ml vitamin E, aqueous to organic phase volume ratio: 4.5, agitation speed: 600 rpm, organic phase flow rate: 2 ml/min, pore size: 10 µm, pore spacing: 200 µm. The size characterization was performed using DCS.
* Standard deviation (n=3).

Supplementary Material
Figure S1. Microscopic images of some membranes used in this study: (a) dp = 40 µm, L = 200 µm, (b) dp = 20 µm, L = 80 µm, and (c) dp = 10 µm, L = 200 µm. (d) Schematic view of the pore arrangement showing a regular hexagonal array of cylindrical pores with uniform pore spacing (L – pore spacing, dp – pore diameter).

Table S1. Pore diameters, pore spacing and porosities of the membranes used in this study.
Pore diameter (µm)
Pore spacing (µm)
Membrane porosity (%)
5 200 0.06
10 200 0.2
20 200 0.9
40 200 3.6
20 80 5.7
40 80 22.7
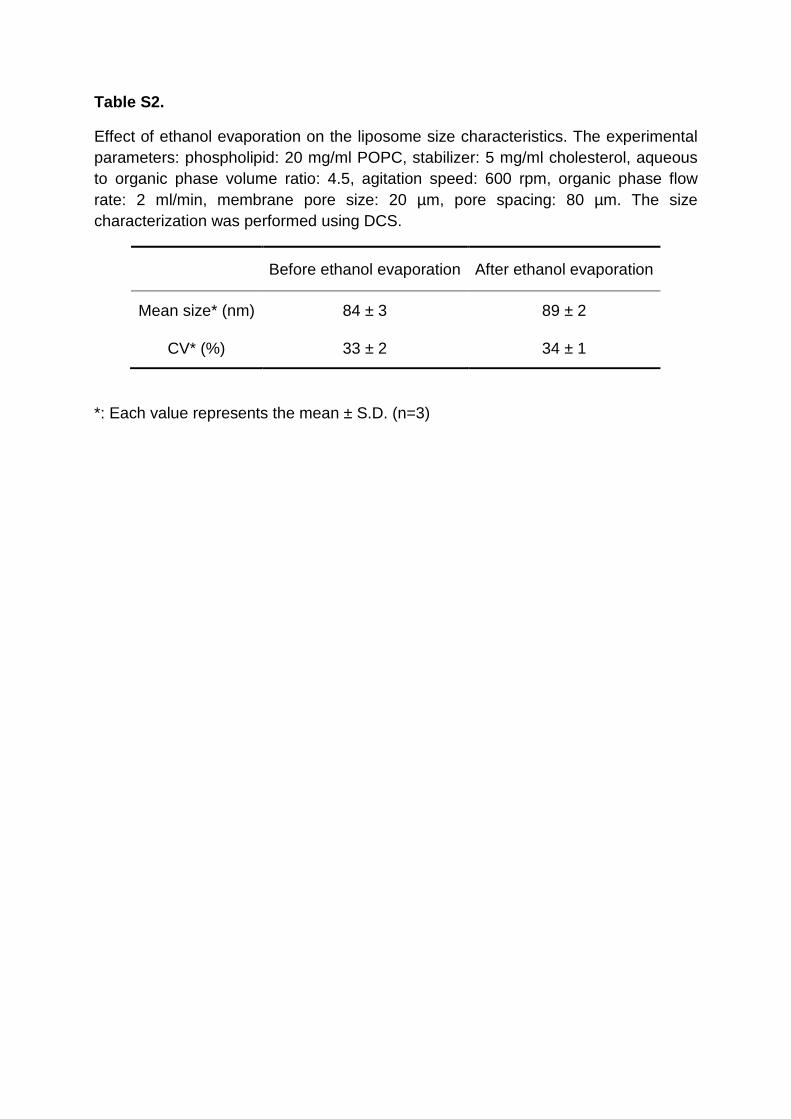
Table S2.
Effect of ethanol evaporation on the liposome size characteristics. The experimental parameters: phospholipid: 20 mg/ml POPC, stabilizer: 5 mg/ml cholesterol, aqueous to organic phase volume ratio: 4.5, agitation speed: 600 rpm, organic phase flow rate: 2 ml/min, membrane pore size: 20 µm, pore spacing: 80 µm. The size characterization was performed using DCS.
Before ethanol evaporation After ethanol evaporation
Mean size* (nm) 84 ± 3 89 ± 2
CV* (%) 33 ± 2 34 ± 1
*: Each value represents the mean ± S.D. (n=3)

Table S3.
The effect of membrane cleaning and treatment with a wetting agent on the liposome size and size distribution. The experimental parameters: phospholipid: 20 mg/ml Lipoid E 80, stabilizer: 5 mg/ml cholesterol, aqueous to organic phase volume ratio: 4.5, agitation speed: 600 rpm, organic phase flow rate: 2 ml/min, pore size: 20 µm, pore spacing: 200 µm. The size characterization was performed using DCS.
Brand new membrane (without wetting agent
treatment)
Used membrane (after cleaning and wetting)
Mean size* (nm) 91 ± 3 91 ± 2
CV* (%) 36 ± 1 35 ± 1
*: Each value represents the mean ± S.D. (n=3)

Acknowledgments
Abdallah LAOUINI held a CMIRA Explora 2011 fellowship from “Région Rhône-Alpes”.
The authors wish to thank Dr Marijana Dragosavac for fruitful discussions and useful advice.

Nomenclature
b Blade height (m)
CV Coefficient of variation
PDI Polydispersity index
dp Pore diameter (m)
D Stirrer diameter (m)
Dm Effective membrane diameter (m)
L Pore spacing (interpore distance) (m)
nb Number of blades
T Internal diameter of tank (m)
ε Membrane porosity