premixed combustion in a light duty … · premixed combustion in a light duty compression ignition...
TRANSCRIPT

PREMIXED COMBUSTION IN A LIGHT DUTY COMPRESSION
IGNITION ENGINE THROUGH FUEL AND INJECTION
SYSTEM DESIGN: AN EXPERIMENTAL APPROACH
by
Gabriele Di Blasio
A thesis submitted to the UNIVERSITÀ DEGLI STUDI DI NAPOLI FEDERICO
II and produced in collaboration with ISTITUTO MOTORI of Naples
in fulfilment of the requirements for the Degree of Doctor of Philosophy
in
Mechanical Engineering
Scuola di dottorato in Ingegneria Industriale Dottorato di Ricerca
in “Ingegneria dei Sistemi Meccanici” XXIV Ciclo
2011
Supervisors:
Prof. Mariano Migliaccio
Dr. Carlo Beatrice
Coordinator:
Prof. Fabio Bozza

ABSTRACT
2
Abstract
Premixed combustion modes in compression ignition engines are studied as a promising solution
to meet fuel economy and increasingly stringent emissions regulations. Nevertheless, PCCI
combustion systems are not yet consolidated enough for practical applications due to their high
complexity in terms of air-fuel charge preparation, combustion process control or due to the
difficulties to extent the operating range.
In this framework, this research is aimed to further investigation in the field of PCCI in order to
provide additional information, from the fuel side and engine side, for an adequate
comprehension of the phenomena and for practical applications.
From the fuel side, this work focuses on providing an overview of the low cetane number (CN)
oxy-fuel capabilities to improve both diesel and PCCI combustion in a research light-duty diesel
engine. The effects of the cyclohexanone (chosen as representative of the low CN oxy-fuels) and
diesel blends on the engine combustion are assessed, i.e. in terms of speed and load range and
using PCCI and conventional engine control strategies (EGR, injection pressures, splitted
injection, etc.). The results show that low CN oxy-fuels could act as enablers for PCCI
combustion, outlining that the low CN and the oxygen content works together to control the
smoke emissions. Moreover, the cyclohexanone can be produced from lignin and thus has the
potential to be renewable.
From the engine side, the study is aimed to investigate the effect of a specially designed port
fuel injection (PFI) system on performance and emissions using n-heptane, as representative of
diesel fuel for direct injection, and n-heptane or ethanol as PFI fuel. The results highlight that
ethanol (as a low CN fuel) exhibits improved performance in terms of premixed charge
formation, combustion control and smoke emissions without evident reduction in fuel
efficiency.

3
To my family

4
Acknowledgements
I am proud to have had the opportunity to develop my graduate studies in collaboration with
“Dipartimento di Ingegneria Meccanica per l’Energetica” within University of Naples “Federico
II” and “Istituto Motori - CNR”.
Many people contributed directly and indirectly to my research, so I would like to thank: Prof.
Mariano Migliaccio who gave me the opportunity to conduct my research at Istituto Motori, in
close cooperation with Dr. Carlo Beatrice that gave me the opportunity to research under his
guidance and supervision in the field of advanced compression ignition engines; all the
researchers that belong to his research group, in particular S. Di Iorio, C. Guido, M. Migliaccio
and V. Fraioli; all the technicians, R. Maniscalco, A. Piccolo, G. Aloisi, G. Corcione, A.
Schiavone who supported the research with the installation of the mechanical systems, and
Bruno Sgammato who implemented some electronic controls units.
I also want to thank Dr. Maurizio Lazzaro and Nicola Del Giacomo from whom I received
motivation and support during all my studies. Special thanks to Dr. Michael Boot and Rutger
Dijkstra from the University of Eindhoven for their scientific support and Francesco Catapano,
my flatmate.
Without all of them and their support it would be impossible for me to finish my work, that is
why I wish to dedicate this section to recognize their sustain.
Finally, I want to thank the Italian University and Research Ministry for partially funding this
work through the FIRB Project DM24153.
At least, but the most important I would like to thank my family and Laura, for their
unconditional support, inspiration and love.

LIST OF CONTENTS
5
List of Contents
ABSTRACT .................................................................................................................................. 2
ACKNOWLEDGEMENTS ........................................................................................................ 4
LIST OF CONTENTS ................................................................................................................. 5
LIST OF TABLES ....................................................................................................................... 8
LIST OF FIGURES ..................................................................................................................... 9
LIST OF ABBREVIATIONS ................................................................................................... 15
1 INTRODUCTION ................................................................................................................. 16
1.1 EMISSIONS, LEGISLATION AND FUTURE OF THE INTERNAL COMBUSTION ENGINES ............... 17
1.1.1 Greenhouse gas emissions .....................................................................................................17
1.1.2 Emissions ...............................................................................................................................21
1.1.3 Unregulated Emissions ..........................................................................................................32
1.1.4 The future of the internal combustion engine ........................................................................34
1.2 COMPRESSION IGNITION FUELS ............................................................................................ 35
1.3 INVESTMENT AND RESEARCH IN THE FIELD OF THE INTERNAL COMBUSTION ENGINES. ........ 43
1.4 STRUCTURE AND OBJECTIVES OF THIS RESEARCH ................................................................ 44
2 BACKROUND: ADVANCED DIESEL COMBUSTION METHODOLOGIES AND
TECHNOLOGIES ................................................................................................................ 46
2.1 THE ADVANCED DIESEL COMBUSTION CONCEPTS: HCCI, PCCI, LTC ................................. 46
2.2 ASPECTS AND CHALLENGES OF PCCI/HCCI COMBUSTION .................................................. 48
2.2.1 Homogeneous mixture preparation ........................................................................................48
2.2.2 Two-Stage Heat Release ........................................................................................................49
2.2.3 Low NOx and Soot Emissions - Non-Luminous Flame ........................................................52
2.2.4 High levels of Noise, UHC and CO emissions ......................................................................54
2.2.5 Combustion control ................................................................................................................55
2.2.6 Operation range ......................................................................................................................56

LIST OF CONTENTS
6
2.3 STRATEGIES TO IMPROVE THE DIESEL COMBUSTION ............................................................ 57
2.3.1 Fuels .......................................................................................................................................64
2.3.2 Technologies: injection system, compression ratio, piston bowl. ..........................................65
2.3.3 Strategies: injection timing and phasing, EGR ......................................................................68
3 EXPERIMENTAL SETUP .................................................................................................. 71
3.1 ENGINE SETUP ..................................................................................................................... 72
3.2 AUXILIARY SYSTEMS ........................................................................................................... 73
3.3 MEASUREMENT SET-UP ....................................................................................................... 74
4 EXPERIMENTAL CHARACTERIZATION OF LOW CETANE NUMBER OXY-
FUELS FOR PCCI COMBUSTION ................................................................................... 79
4.1 INTRODUCTION .................................................................................................................... 79
4.2 FUELS .................................................................................................................................. 81
4.3 TEST POINTS AND PROCEDURES ........................................................................................... 85
4.4 SOI SWEEP IN PCCI COMBUSTION MODE ............................................................................. 87
4.4.1 Experimental procedure .........................................................................................................87
4.4.2 Test results and discussions ...................................................................................................88
4.5 EGR SWEEP WITH CONVENTIONAL DIESEL COMBUSTION ................................................... 103
4.5.1 Experimental procedure .......................................................................................................104
4.5.2 Test Results ..........................................................................................................................104
4.6 PCCI APPLICATION WITH LOW CN FUELS .......................................................................... 112
4.6.1 Experimental procedure .......................................................................................................112
4.6.2 Test results ...........................................................................................................................112
4.7 NANOPARTICLE EMISSION FROM LOW CN OXY-FUELS ....................................................... 117
4.7.1 PCCI combustion mode .......................................................................................................117
4.7.2 Conventional combustion mode ..........................................................................................119
4.8 CONCLUSIONS ................................................................................................................... 122
5 EXPERIMENTAL CHARACTERIZATION OF PCCI COMBUSTION VIA PFI
INJECTION SYSTEM ....................................................................................................... 125
5.1 INTRODUCTION .................................................................................................................. 125

LIST OF CONTENTS
7
5.2 EXPERIMENTAL SETUP ....................................................................................................... 127
5.3 FUELS ................................................................................................................................ 128
5.4 EXPERIMENTAL PROCEDURE .............................................................................................. 129
5.5 RESULTS AND DISCUSSION ................................................................................................. 131
5.5.1 Case1: n-heptane (DI) – n-heptane (PFI) .............................................................................131
5.5.2 Case2: n-heptane (DI) – ethanol (PFI) .................................................................................139
5.6 NANOPARTICLE EMISSION FROM PFI-DI COMBUSTION ...................................................... 147
5.7 CONCLUSIONS ................................................................................................................... 148
6 SUMMARY ......................................................................................................................... 150
APPENDIX A ........................................................................................................................... 161
APPENDIX B ........................................................................................................................... 162

LIST OF TABLES
8
List of Tables
Tables Page
Table 1.1: Forward and reverse rate constant for NO formation mechanism [4]. 25
Table 1.2: Main fuel parameters 39
Table 1.3: Comparison of biodiesel with petroleum Diesel; Properties and performance. 40
Table 3.1: Main engine geometrical characteristics 72
Table 3.2: Emission measurement instruments and their working principles. 76
Table 4.1: Fuel properties 82
Table 4.2: Blend properties 84
Table 4.3: Reference values of the test points; the BMEP value refers to the real four-cylinder
engine. 85
Table 4.4: Prefixed operating limits. 87
Table 4.5: Main engine parameters in PCCI and conventional injection strategies. 117
Table 4.6: Main engine parameters in conventional injection strategies. 120
Table 5.1: Main fuel properties. 129
Table 5.2: Reference points 130
Table 5.3: Experimental engine test conditions with constant ɸ. 132
Table 5.4: Experimental engine test conditions with constant DI and increasing ɸ. 135
Table 5.5: Experimental engine test conditions at constant IMEP. 140
Table 5.6: Experimental engine test conditions at constant DI increasing PFI. 143
Table 5.7: Experimental engine test conditions pilot-main injection strategy. 145
Table 6.1: Fuel properties 161

LIST OF FIGURES
9
List of Figures
Figures Page
Figure 1.1: Final energy consumptions by sectors (Mtoe), 1990-2008 [2]. ................................ 18
Figure 1.2: Greenhouse gas emissions (CO2 equivalent). Total emissions vs. transport sector
emissions in the last two decades [2]. ...................................................................... 19
Figure 1.3: Change of GHG emissions, total vs. transport sector and road transportation [2]. ... 20
Figure 1.4: Fuel consumption reduction improving the vehicle technologies at constant vehicle
size and performance and for the different power units [3]. .................................... 21
Figure 1.5: EU Emission Standards for Passenger Cars (Category M1*) [1]. ............................. 23
Figure 1.6: Typical structure of engine particle [14]. .................................................................. 27
Figure 1.7: Important steps of soot formation in a diffusion flame [10]. .................................... 28
Figure 1.8: Mechanism of soot formation and oxidation in a transient reacting spray [12]. ....... 28
Figure 1.9: Typical size distribution of Diesel particulate matter [14]. ....................................... 30
Figure 1.10: Trans-esterification of vegetable oil to biodiesel .................................................... 40
Figure 2.1: Comparison between conventional and HCCI (or PCCI) combustion showing a
longer induction time ............................................................................................... 48
Figure 2.2: Typical heat release curve from HCCI combustion of n-heptane fuel. ..................... 50
Figure 2.3: Reaction paths of hydrocarbon fuels in low and high temperature reactions [28]. ... 51
Figure 2.4: Operating regions for conventional and advanced diesel combustion regimes in
relation to NO and soot regions [12]. ....................................................................... 53
Figure 2.5: Conventional diesel and LTC (engine speed 1200rpm, nitrogen dilution to simulate
EGR) [81]. ................................................................................................................ 53
Figure 2.6: Relationships between NOx emissions and mean equivalence ratio for various
combustion strategies without EGR [82]. ................................................................ 54
Figure 2.7: Diesel HCCI operating region and IMEP map for a compression ratio of 18 and
intake charge temperature of 30°C [34]. .................................................................. 56
Figure 2.8: Effects of injection timing on emissions and IMEP in UNIBUS combustion [12]. . 58
Figure 2.9: NOx emission characteristics of PREDIC (without EGR) [43]. ............................... 60

LIST OF FIGURES
10
Figure 2.10: Effect of EGR rate and injection timing (IT) on the rate of heat release in MK
combustion [86]. ...................................................................................................... 61
Figure 2.11: Conceptual scheme of low-temperature combustion [90]. ...................................... 63
Figure 2.12: Combustion evolution under standard diesel conditions (a). Combustion evolution
under LTC conditions (b). ........................................................................................ 64
Figure 2.13: Relationship between injection timing and combustion event in advanced and
conventional diesel combustion [12]. ...................................................................... 69
Figure 3.1: Perspective view of the test bench and the single cylinder research engine ............. 71
Figure 3.2: Test bench scheme..................................................................................................... 73
Figure 3.3: Scheme of the DMS500 classifier column and charger ............................................ 77
Figure 4.1: Boiling curves of the neat fuels ................................................................................. 83
Figure 4.2: Position of the stationary operating points in the speed-load plot of a vehicle with
1400 kg of inertial mass, equipped with the multi-cylinder engine over the
UDC+EUDC (NEDC) cycle. ................................................................................... 86
Figure 4.3: Pressure cycle and RoHR comparisons for all blends at 1500 rpm, IMEP= 3.2 bar
and MBF50%= 12 °Ca aTDC. ................................................................................. 90
Figure 4.4: Emission Indices comparisons and efficiencies for all blends at 1500 rpm, IMEP=3.2
bar and MBF50%=12 °Ca aTDC. ............................................................................ 90
Figure 4.5: Ignition delay versus CN for blends at 1500 rpm, IMEP= 3.2 bar and
MBF50%=12 °Ca aTDC. ......................................................................................... 91
Figure 4.6: Emission Indices and efficiencies comparisons at 1500 rpm, IMEP= 3.2 bar and
MBF50%= 12 °Ca aTDC for diesel and CN38 blends (left) and CN20 blends (right).
.................................................................................................................................. 92
Figure 4.7: Pressure cycle and EC comparison (left) and RoHR (right) comparisons for all
blends at 2000rpm, IMEP=6.9bar and MBF50%=15° aTDC. ................................. 93
Figure 4.8: Emission Indices and efficiencies comparisons for all blends at 2000rpm,
IMEP=6.9bar and MBF50%=15°aTDC. .................................................................. 93
Figure 4.9: Ignition delay versus CN for the blends at 2000rpm, IMEP=6.9 and MBF50%=15°.
.................................................................................................................................. 94
Figure 4.10: IMEP as function of SOI at 1500 rpm for all blends............................................... 95

LIST OF FIGURES
11
Figure 4.11: Pressure rise rate and NOx emissions as a function of SOI at 1500 rpm for all
blends. ...................................................................................................................... 96
Figure 4.12: HC and CO emissions as a function of SOI at 1500 rpm for all blends. ................. 97
Figure 4.13: Soot emissions and Ignition delay as a function of SOI at 1500 rpm for all blends.
.................................................................................................................................. 98
Figure 4.14: Pressure traces and RoHR (left) and the Thermodynamic temperature (right) for all
blends at 1500 rpm, SOI -40 °Ca aTDC for the same injected energy. ................... 99
Figure 4.15: Emission Indices and efficiencies comparisons for all blends at 1500 rpm, SOI -
40 °Ca aTDC for the same injected energy. ........................................................... 100
Figure 4.16: IMEP as function of SOI at 2000rpm for all the blends. ....................................... 101
Figure 4.17: Pressure rise rate and NOx emissions as function of SOI at 2000rpm for all the
blends. .................................................................................................................... 101
Figure 4.18: HC and CO emissions as function of SOI at 2000rpm for all the blends. ............. 102
Figure 4.19: Soot emissions as function of SOI at 2000rpm for all the blends. ........................ 102
Figure 4.20: Pressure traces and energizing current (left), Emission Indices and efficiencies
(right); comparisons diesel and blend with CN38 at 2000rpm, SOI -10° for the same
injected energy. ...................................................................................................... 103
Figure 4.21: Trade off CO vs. NOx at 1500x3.2 for all the blends (left); trade off PM vs. NOx at
2000x6.9 for all the blends (right). ........................................................................ 105
Figure 4.22: Trade off UHC vs. NOx at 1500x3.2 (left), and at 2000x6.9 (right), for all the
blends. .................................................................................................................... 105
Figure 4.23: At left, SOImain variations for EGR sweep at 1500x3.2 for all the blends. SOIpilot
of the two lowest CN fuels without EGR and for the highest EGR are also reported.
At right, COV of IMEP with EGR sweep for all the blends. ................................. 107
Figure 4.24: At left, cylinder pressure and injector energizing current versus crank angle; at right,
heat release rate versus crank angle; curves of all blends are referred to the test case
1500x3.2 and with an EGR rate of 37%. ............................................................... 108
Figure 4.25: At left, cylinder pressure and injector energizing current versus crank angle; at right
heat release rate versus crank angle; curves of all blends are referred to the test case
2000x6.9 and with an EGR rate of 28%. ............................................................... 108

LIST OF FIGURES
12
Figure 4.26: ISFC variations for EGR sweep at 1500x3.2 (left) and at 2000x6.9 (right) for all the
blends. .................................................................................................................... 109
Figure 4.27: At left, Indicated thermal efficiency variations for EGR sweep at 1500x3.2 (on the
left) and at 2000x6.9 (on the right) for all the blends. ........................................... 110
Figure 4.28: At left, indicated signal comparison for tests with and without pilot injection at
2000x6.9 for DG blend. At right, indicated signal comparison for cycles with
maximum and minimum IMEP for the test with GD blend at 2000x6.9 and pilot
plus main injection strategy. .................................................................................. 111
Figure 4.29: Engine operating parameters (left) and exhaust emissions (right) for all blends at
the lowest attainable NOx emissions in PCCI conditions at 1500x3.2. Note that
dp/d limit at 1500 rpm was fixed at 8.8 bar/°. ..................................................... 113
Figure 4.30: Engine operating parameters (left) and exhaust emissions (right) for all blends at
the lowest attainable NOx emissions in PCCI conditions at 1500x6.9. Note that
dp/d limit at 2000 rpm was fixed at 8.8 bar/°. ..................................................... 114
Figure 4.31: Engine operating parameters (left) and exhaust emissions (right) for all blends at
the lowest attainable NOx emissions in PCCI conditions at 2000x3.2. Note that
dp/d limit at 2000 rpm was fixed at 6.8 bar/°. ..................................................... 114
Figure 4.32: Engine operating parameters (left) and exhaust emissions (right) for all blends at
the lowest attainable NOx emissions in PCCI conditions at 2000x6.9. Note that
dp/d limit at 2000 rpm was fixed at 6.8 bar/°. ..................................................... 115
Figure 4.33: Cylinder pressure and injector energizing current versus crank angle of all tested
blends in PCCI mode at 2000x6.9. ........................................................................ 116
Figure 4.34: PDSF in conventional and PCCI mode with and without EGR for diesel (left) and
for DC (right). ........................................................................................................ 118
Figure 4.35: Smoke concentration comparison for the different strategies. .............................. 119
Figure 4.36: Reference test points. ............................................................................................ 119
Figure 4.37: Particle size distribution measured for D and DC fuels at 1500rpm 3.2bar BMEP
applying the pilot plus main injection strategy at EGR0 (left) and EGR1 (right). 120
Figure 4.38: Particle size distribution measured for D and DC fuels at 2000rpm 6.9bar BMEP at
EGR0 (left) and EGR1 (right) and EGR2 (bottom). .............................................. 121

LIST OF FIGURES
13
Figure 4.39: Smoke emissions at different EGR levels. ............................................................ 122
Figure 5.1: Vaporizer with integrated glow plug. ...................................................................... 127
Figure 5.2: Vaporizer placed upstream the runners. .................................................................. 128
Figure 5.3: Control unit and power unit..................................................................................... 128
Figure 5.4: In-cylinder pressure, RoHR and thermodynamic bulk temperature (bottom right)
evolution for the test cases with a fixed global fuel equivalence ratio with different
levels of premixing charge. .................................................................................... 133
Figure 5.5: Emission indices and efficiencies for the test cases with a fixed global fuel
equivalence ratio (Φ=0.28) with different levels of premixing charge. ................. 134
Figure 5.6: MBF50%, thermodynamic efficiency and SOI-DI as a function of premixed ratio (rp)
at constant Φ........................................................................................................... 135
Figure 5.7: In-cylinder pressure and RoHR evolution at 1500rpm with variable global fuel
equivalence ratio and different levels of premixing charge. .................................. 136
Figure 5.8: Emission indices and efficiencies at 1500rpm with variable global fuel equivalence
ratio for different premixing ratio. ......................................................................... 137
Figure 5.9: Computed histories of significant chemical species and the corresponding RoHR for
case #4 (PFI+DI) IMEP 5.8bar. ............................................................................. 138
Figure 5.10: Correlation between rp and rpe using n-heptane as DI fuel and ethanol as PFI fuel.
................................................................................................................................ 140
Figure 5.11: In-cylinder pressure and RoHR evolution at 1500x3.2 varying the global fuel
equivalence ratio and for different premixing ratio. .............................................. 141
Figure 5.12: Emission indices and efficiencies for the test cases with a fixed IMEP=3.2bar for
different levels of premixing charge. ..................................................................... 142
Figure 5.13: MBF50%, thermodynamic efficiency, COV and SOI-DI as a function of premixed
ratio rp, at 1500rpmx3.2bar IMEP. ........................................................................ 142
Figure 5.14: Pressure, RoHR, emissions and efficiencies at constant DI and increasing PFI. .. 143
Figure 5.15: Pressure traces, RoHR emissions and efficiencies at 2000x6.9 at constant IMEP for
different levels of premixing ratio. ........................................................................ 144
Figure 5.16: In-cylinder pressure and RoHR comparison at 2000x7.8 and 2000x8.3 with and
without PFI. ............................................................................................................ 146

LIST OF FIGURES
14
Figure 5.17: Emission indices and efficiencies comparison at 2000x7.8 and 2000x8.3 with and
without PFI. ............................................................................................................ 146
Figure 5.18: Particle size distribution measured at different premixed ratios. .......................... 147

LIST OF ABBREVIATIONS
15
List of Abbreviations
AIT Auto-ignition temperature
aTDC After top dead center
bTDC Before top dead center
CI Compression ignition
CH4 Methane
C3H8 Propane
CI Compression ignition engine
CO Carbon oxide
CO2 Carbon dioxide
CR Compression ratio
CYCLOX Cyclohexanone
DI Direct injection
DME Dimethyl ether
DOC Catalytic oxidation device
DPF Diesel particulate filter
EC Energizing current
EGR Exhaust gas recirculation
EOI End of injection
EU European Union
FAME Fatty acid methyl ester
GHG Greenhouse gases
GTL Gas to liquid
H2 Hydrogen
HCCI Homogeneous charge
compression ignition
HHR High heat release
HP High pressure
HR Heat release
HTO High temperature oxidation
ICE Internal combustion engine
ID Ignition delay
LD Light duty
LHR Low heat release
LNG Liquefied natural gas
LTC Low temperature combustion
LTO Low temperature oxidation
MBF Mass burned fraction
Mtoe Million tonnes oil equivalent
NOx Nitrogen oxides
NTC Negative temperature
coefficient
ON Octane number
PCCI Premixed charge compression
ignition
PFI Port fuel injection
ppm: part per million
PM: Particulate matter
PN: Particulate number
RME: Rapeseed methyl ester
RoHR: Rate of heat release
SCR: Selective catalytic reduction
SI: Spark ignition
SME Soybean methyl ester
SOC Start of combustion
VOC Volatile organic compound

INTRODUCTION
16
1 INTRODUCTION
Driven by a need for energy independence and concerns about environmental quality and GHG
(Greenhouse gases) emissions1
, the development of new fuels and technologies for the
transportation sector is moving forward increased fuel efficiencies2
and reduced pollutant
emissions, using also alternatives and renewable fuels.
In the next two decades, scenarios foresee new vehicles fleet with much more fuel-efficient
powertrains, engines powered with renewable fuels, turbocharged downsized engines, hybrid
electric drives (plug-in electric vehicles, range extender vehicles, etc.).
This dissertation would like to fit in this context without the presumption to indicate the way
forward but the main scope is to give more knowledge in the field of the alternative fuel-efficient
and low emission combustions, in particular in the field of PCCI combustion (Premixed charge
compression ignition). It would try to elucidate, to some extent, how the covered topics could be
a potential ways, or not, to achieve the imposed objectives in terms of fuel efficiencies and
pollutant emissions that seem to be conflicting.
There are several ways to meet the prefixed objectives but the solution cannot be “unique” in
presence of trade-offs between two or more conflicting objectives. This is the case of many
engineering problems where many conflicting objectives have to be satisfied leading to an
optimized solution rather than to the best solution.
Moreover, it would also give an overview on the emerging technologies and on the “specially
designed” fuels.
1 The GHG emissions are mainly due to the carbon dioxide(CO2), methane(CH4), nitrous oxide(N2O) and fluorinated
gases. These gases have the ability to trap the heat in the atmosphere that lead to the notorious global warming effect
and to the climate change. 2 The fuel efficiency can be interpreted in terms of carbon dioxide production; the higher the fuel efficiency the
lower the CO2 production.

INTRODUCTION
17
In summary, Chapter 1 attempts to evidence and collocate the importance of the experimental
research done in the field of the internal combustion engines. Chapter 2 deals with the
technologies and methodologies in the field of advanced and alternative combustions, whereas
chapter 3 describes the experimental setup and Chapters 4 and 5 the test result and discussion of
tests done. Finally, chapter 6 presents the main conclusions of the experiments and the future
work that is going to realize.
1.1 Emissions, legislation and future of the internal combustion
engines
In the last century, the internal combustion engine (ICE) has played a key role as power-unit in
different sectors of power generation, like transportation sector, energy production, work
machines and other niche areas because it has represented the most cost efficient power-unit. For
this reason, in the road transportation sector, the number of vehicles in the last decades has grown
exponentially representing one of the main actors in terms of petroleum consumption, pollutant
and Greenhouse gas (GHG) emissions.
Accordingly, the standard vehicle exhaust emissions regulations has imposed very stringent
limits in terms of pollutant and GHG emissions requiring significant changes of the future vehicle
characteristics.
1.1.1 Greenhouse gas emissions
Concerning the GHG emissions, the European Commission has developed a mandatory CO2
(Carbon dioxide)3
emission target for new passenger cars4
adopted on 2009 [regulation
443/2009/EC]. The regulation established a fleet-average CO2 emission target of 130 g/km by
each vehicle manufacturer by 2015 using vehicle technology. Moreover, a further emission
reduction of 10 g/km is provided by additional measures, such as the use of biofuels. The
regulation also defines a long-term target of 95 g CO2/km that has to be reached in 2020 [1].
3 The CO2 represent the majority of the GHG emissions emitted by the internal combustion engines. The natural gas
powered engines emit also CH4(methane) that is a GHG. 4 There is also a CO2 target for light duty commercial vehicles that have to be reached from 2016[1].

INTRODUCTION
18
In order to give an idea about the contribution of the transport sector to GHG emissions and
energy consumption of the transport sector it might be interesting to give a look on the next
graphs.
The European transportation sector is responsible for about the 32% (Figure 1.1) compared to the
total energy consumption and the 20% of total greenhouse gas emissions in 2008 (Figure 1.2) [2].
Figure 1.1: Final energy consumptions by sectors (Mtoe), 1990-2008 [2].

INTRODUCTION
19
Figure 1.2: Greenhouse gas emissions (CO2 equivalent). Total emissions vs. transport sector
emissions in the last two decades [2].
Moreover, the road transportation represents, alone, more than 90% of the total GHG emissions
in relation to the whole transportation sector. The light-duty passenger vehicles are the majority
of this share therefore, they represent a key segment to target reductions.
More in detail, in Figure 1.3 shows the total and transportation sector change of the European
GHG emissions of year 2009 respect to the base year 1990. The total GHG emissions have been
reduced whereas the emissions of the transportation sector emissions have been increased, in
particular those of the road transportation [2].

INTRODUCTION
20
Figure 1.3: Change of GHG emissions, total vs. transport sector and road transportation [2].
In order to invert this trend and to meet the further emission limits, there have been proposed
various possible strategies to reduce the road transportation impact such as (i) reducing the
carbon content of transportation fuels; (ii) improving the on-road fuel efficiency of vehicles (iii)
reducing passenger vehicle travel and (iv) improving traffic flow and operation.
In this context, Cheah et al. [3] explored the magnitude, combinations and timings of changes of
the vehicles in order to meet the new emission standards. They elaborate four different scenarios
in terms of fuel saving5 technologies and approaches to improving vehicle fuel economy up to
year 2030. In particular, the first three scenarios employ different strategies like (a) vehicle light
weighting, (b) vehicle downsizing, (c) alternative powertrains whereas the last employ (d) a
combination of the previous approaches in the case each of them should be not sufficient to meet
the emission and fuel economy standards.
5 Fuel saving means reduction of CO2 emissions

INTRODUCTION
21
One of the results of this study is reported in Figure 1.4. The graph shows the trends of the fuel
consumption reduction improving all the vehicle technologies (at constant vehicle size and
performance attributes) up to year 2030. At the same time, it is possible to note the fuel
consumption improvement changing only the power unit technology.
Figure 1.4: Fuel consumption reduction improving the vehicle technologies at constant vehicle size
and performance and for the different power units [3].
1.1.2 Emissions
Concerning the harmful engine emissions of the compression ignition engines (CI), this
subsection contains an overview of the classification, the limitations and the factors that mostly
affect their production.
In general, the term “engine emissions” refers primarily to pollutants in the exhaust [11]. The
internal combustion (IC) engines convert chemical energy contained within the fuel into
mechanical power. The fuel is made by various hydrocarbons that in a theoretical complete
combustion will produce carbon dioxide (CO2) and water (H2O) vapour. These gases are not
harmful for health, but as described before, CO2 is considered a greenhouse gas. These ideal
combustion gases and any unused air make up the bulk of the exhaust from a real IC combustion
engine. Whereas, if occurs a non-ideal combustion process there are formed other emissions,
some of which are toxic or harmful for the human health. These can derive from incomplete
combustion of the fuel, combustion of lubricating oil, combustion of additives and non-
hydrocarbon compounds such as sulphur (from fuel or lube oil), or indeed separate reactions or
decompositions of the mixture components at high pressure/temperature.
Improving Vehicle
Technologies
Changing the
Power unit

INTRODUCTION
22
Thus, for CI engines, there are many factors that affect the emission and these include the
preparation of the mixture during ignition delay, the quality of the fuel, the air/fuel mixing
process, the residence time of the fuel at different combustion temperatures and the combustion
duration in the expansion stroke. Many inherent design features of the engine can also play a role
in emissions formation
Currently the regulated emission are:
Nitrogen oxides (NOx)
Particulate matter (PM)
Hydrocarbons (HC)
Carbon monoxide (CO)
excluding the further but imminent limits in terms of CO2 and carbonaceous nanoparticles.
Restricting the field to light duty vehicles, Figure 1.5 reports the EU (European Union) emission
limits of diesel and gasoline engines up to the new standards Euro VI [1]. The next Euro VI limits
are very stringent for both engines, mainly in terms of NOx (Nitrogen oxide) and PM (Particulate
matter) emissions. Moreover, it should be also considered that since Euro 5 there is an additional
PM requirement, for a PM total number (PN) limit at 6 ×10¹¹
#/km. This is because, many of
researches are going on in order to evaluate and improve the effectiveness of the current after-
treatments devices, such as DPF, to retain the particles6.
6 It is proved the carcinogenicity of the nanoparticles. The very small dimensions (nm) allow their to penetrate deep
into the lung air sacs.

INTRODUCTION
23
Figure 1.5: EU Emission Standards for Passenger Cars (Category M1*) [1].
Nitrogen Oxides (NOx): NOx, in the fields of ICE, refers chiefly to nitric oxide (NO) and
nitrogen dioxide (NO2). In particular, for diesel engines NO represents approximately 90% and
NO2 10% of total NOx created by an ICE. NOX, together with volatile organic compounds
(VOC’s) and carbon monoxide (CO), is the main precursor of the formation of photochemical
smog. Smog is a term used to describe air pollution that is a result of the interaction of sunlight
with certain chemicals in the atmosphere is ozone. While ozone in the stratosphere protects earth
from harmful UV radiation, ozone on the ground is hazardous to human health. Ground-level
ozone forms when vehicle emissions containing nitrogen oxides (primarily from vehicle exhaust)
and volatile organic compounds (from paints, solvents, and fuel evaporation) interact in the
presence of sunlight. Therefore, some of the sunniest cities are also some of the most polluted.
The NOX species also exert a direct toxic effect on human health. NO is regarded as being
carcinogenic (like soot), and responsible for acid rain and smog. NO2 is an irritant gas causing
pulmonary edema [2][6][7].

INTRODUCTION
24
In the internal combustion engine, NO is the predominant oxide of nitrogen produced during the
combustion. The main source of NO is the oxidation of atmospheric nitrogen but also the fuel if it
contains significant levels of nitrogen. NO is formed in both the flame-front and the post-flame
gases. In engines, however, combustion occurs at high pressure so the flame reaction zone is
extremely thin (~ 0.1 mm) and residence time within this zone is short. In addition, the cylinder
pressure rises during most of the combustion process, so that burned gases produced early in the
combustion process compressed to a higher temperature that they reached immediately after
combustion. For this reason, the NO formation in the post-flame gases often dominates any
flame-front produced NO.
According to literature, three primary sources of NOX have been identified in the homogeneous
combustion processes: thermal NOX, fuel NOX and prompt NOX [7].
Thermal NOX is formed in the post-flame by the oxidation of atmospheric nitrogen at relatively
high temperatures (T>1600 °C) in fuel-lean environments in a strongly temperature dependent
process (Figure 2.4). Thermal NOX reactions take place in a few tens of microseconds, and are
highly dependent on temperature, residence time and atomic oxygen concentration [7]. The
formation of thermal NOX from molecular nitrogen (and its destruction) is governed by the
extended Zel’dovich mechanism:
1. 2
2. 2 2
3.
The equation 3. was introduced by Lavoie & Blumberg (1973). The major contribute in NO
formation are given by the first two equation whereas the last contribute particularly in fuel-rich
mixtures. The forward and reverse rate constants for these reactions have been measured in
numerous experimental studies; recommended values are reported in Table 1.1 [4].

INTRODUCTION
25
Reaction Rate constant
[cm3/(mol s)]
Activation energy Temperature range [K]
1 7.6 x 10¹³
exp(-38000/T) 38000 2000 - 5000
reverse 1 1.6 x 10¹³
- 300 - 5000
2 6.4 x 10⁹ exp(-3150/T) 3150 300 - 3000
reverse 2 1.5 x 10⁹ exp(-19500/T) 19500 1000 - 3000
3 4.1 x 10¹³
- 300 - 2500
reverse 3 2 x 10¹⁴
exp(-23650/T) 23650 2200 - 4500
Table 1.1: Forward and reverse rate constant for NO formation mechanism [4].
Reaction 1. determines the rate of formation due to its high activation energy of breaking the
triple bond of molecular nitrogen (N2), and is temperature-sensitive. The temperature-dependence
also results from the temperature sensitivity of the O atom equilibrium concentration [7].
A simplified formula for the initial NO formation rate could be written, as proposed by Heywood
[4], as:
[ ]
⁄ (
) [ ] [ ] [ ]⁄
where [...] denote species concentrations in moles per cubic centimetre and c1 and c2 are two
positive constants. The forward rate constant for reaction 1. and the reverse constant for reaction
2. and 3. have large activation energies which results in a strong dependence of NO formation
rate on temperature. Thus, high temperatures and high oxygen concentrations result in high NO
formation rates.
Fuel NOX refers to NOX formed by the combustion of fuels containing organic nitrogen in the
fuel; dependent on local combustion conditions and nitrogen content in the fuel. It is usually
assumed that fuel NOX is a source of nitrogen oxides via formation of precursors (NH3, HCN,
and CN). In fuel-rich regions, these nitrogen-containing species will typically be reduced to N2,
and in fuel-lean regions, they are generally oxidized to form NO. The amount of fuel nitrogen
converted to NO is sensitive to the air/fuel ratio but only weakly dependent on temperature, in
contrast to the strong temperature dependence of NO formed from atmospheric nitrogen [4]. Fuel
NO is formed more readily (occurring on a time scale comparable to that of combustion
reactions) than thermal NO because the N-H and N-C bonds, which are very common in fuel-

INTRODUCTION
26
bound nitrogen, are much weaker than the triple bond in molecular nitrogen which must be
broken for thermal NO formation. Controlling the local environment in which nitrogen is
released from the fuel is a primary means of controlling NO emissions and although the amount
of fuel NO in the diesel exhaust is negligible with the diesel fuel used today, its contribution to
the total amount of NOX produced from the engine must be considered [7].
Prompt NOx form in the flame-reaction zone and are produced by the reaction of atmospheric
nitrogen with hydrocarbon radicals (C, CH, CH2, etc.) in fuel-rich regions of flames. This process
results in the formation of fixed species of nitrogen (NH, HCN, H2CN, CN, etc.) which can then
oxidized to form NO. Since the prompt NOX mechanism requires a hydrocarbon to initiate the
reaction with nitrogen, this mechanism is much more prevalent in fuel rich than in fuel-lean
hydrocarbon flames [7]. Anyway, the contribution of prompt NOX is normally considered
negligible.
In general, terms, the critical equivalence ratio for NOX formation in high-temperature high-
pressure burned gases, typical of DI-diesel engines, is close to stoichiometric. The critical period
occurs when burned gas temperatures are at a maximum, i.e., between the start of combustion and
shortly after the occurrence of peak cylinder pressure. Mixture which burns early in the
combustion process is especially important since it is compressed at higher temperature, thereby
increasing the NO formation rate, as combustion proceeds and cylinder pressure increases. After
the time of peak pressure, burned gas temperatures decrease as the cylinder gases expand. The
decreasing temperature due to expansion and due to mixing of high-temperature gas with air or
cooler burned gas freezes the NO chemistry. This second effect means that freezing occurs more
rapidly in the diesel than in the spark-ignition engine, and there is much less decomposition of the
NO. The parameters that most significantly affect the formation of NOx in diesel engines are the
in-cylinder gas temperature, the availability of oxygen, the cylinder pressure, as well as the
residence time of the fuel/gas mixture in locations with favourable temperatures and oxygen
concentration for the formation of nitric oxides. All these parameters, in turn, depend on the inlet
air pressure and temperature, the exhaust gas recirculation (EGR) rate, and on the injection
timing with respect to the engine cycle [4].

INTRODUCTION
27
Particulate Matter (PM) is a mixture of carbonaceous soot, as well as other solid and liquid
materials. They are small solid or liquid particles, mostly less than 2.5 microns in size, and
consist of a complex mix of engine oils, sulphates and inorganic materials. Different types of
particulates are emitted from diesel engines under different modes and operating conditions.
Diesel particulate emissions are increasing and this fact concerns really much because health
experts have demonstrated that these particles contribute to a variety of lung-related illnesses
including asthma, emphysema and bronchitis. The International Agency for Research on Cancer
(IARC) considers particulate matter (PM) a probable human carcinogen. Consequently, the
generation of PM is under intense study by researchers from various disciplines.
The Particulate matter can be classified as:
Solid Fraction (Solid particulate matter) consisting of carbonaceous soot and ash
(including metallic).
Soluble Organic Fraction (Liquid Particulate Matter) consisting of organic material
derived from the fuel (hydrocarbons) and organic material derived from the engine
lubricating oil (higher hydrocarbons).
Water Particulate consisting of water and sulphuric acid H2SO4 (when fuel sulphur is
present).
A typical structure of engine particles [14] is reported in Figure 1.6.
Figure 1.6: Typical structure of engine particle [14].

INTRODUCTION
28
Soot production process consists of some principal events which main steps are represented in
Figure 1.7 [10], and
Figure 1.8 [12].
Figure 1.7: Important steps of soot formation
in a diffusion flame [10].
Figure 1.8: Mechanism of soot formation and
oxidation in a transient reacting spray [12].
• Pyrolysis: formation of soot precursors. Large quantities of reactive molecules are formed,
such as acetylene (C2H2), phenyl radical (C6H6), cyclic structures, etc. by polymerization
reactions, these precursors can grow to macromolecules. Due to their high thermal stability,
cyclic structures play an important role.
• Nucleation: formation of primary particles. As soon as the molecules mentioned above reach
a sufficient supersaturation first particles are formed by nucleation. Typical number
concentrations of such nucleation particles are in the order of 1012
/cm3. They have diameters
about a few nanometers.
• Particle growth: Immediately after nucleation, the particles start to grow. On the one hand,
this growth occurs by coagulation, which is very rapid due to the high number concentration
of the nucleation particles. Another important process is surface growth. This means growth

INTRODUCTION
29
by attachment of material from the gas phase. Surface growth determines the total particle
mass.
• Dehydration: in the last step oxidation processes are dominant so the particle burnout. These
reduce the particle mass. The hydrogen content decreases (dehydration). Under certain
conditions, the particles can burn completely.
More details about the formation process can be found in [12]. The chemical composition of soot
particles depends on the temperature in the engine exhaust and on the particulate sampling
system. At high temperatures (>500 °C), its composition is mainly elementary carbon and
organic carbon. Below 500 °C, the particles become coated with adsorbed and condensed high
molecular weight organic compounds, among which, unburned hydrocarbons, aromatic and
oxygenated hydrocarbons and inorganic species such as sulphur dioxide and sulphuric acid
(sulphates).
Considering the high complexity of the combustion in compression ignition engines, the
dependence between PM emission and the engine’s physical parameters is very complex due to
the difficulty of isolating the effects of each of them. For example, reasons for incomplete
burnout of the particle emission are the local or global lack of oxygen, bad mixing, not enough
time for complete combustion (combustion is abruptly terminated when the outlet valve opens),
chamber geometry, the intake temperature and pressure, the injection system, etc.. Other details
can be found in literature, for example in [4], [26].
Particle number PN: as reported in Figure 1.5, the regulation foresees limits also in terms of PN.
There is increasing evidence that several health effects are associated with the ultra-fine particles
with diameters below 100 nm. Recent research shows that they can penetrate the cell membranes,
enter into the blood and even reach the brain. Some investigations indicate that particles can
induce inheritable mutation [13]. The nanoparticles (20-100nm) originate from different source
such as organic compound (elemental carbon), deriving from the fuel and oil, or in some case
metal oxides and metallic PM. Several fuel and engine oil additives include metallic compounds.
This results in some metal oxide and elemental emissions, including metals such as; iron, copper,
zinc, cerium, and phosphorus.

INTRODUCTION
30
Usually, particles are classified according to their diameter in [15]:
Nano: particles smaller than 50nm;
Ultrafine: particles with an aerodynamic diameter lower than 0.1μm;
Fine (PM2.5): particles with an aerodynamic diameter in the size range from 0.1 up to 2.5μm;
Coarse (PM10): particles with an aerodynamic diameter in the size range from 2.5 up to
10μm;
Supercoarse: particles with an aerodynamic diameter higher than 10μm.
The particles usually form separated modes in the particle size distribution function (PSDF).
Figure 1.9 displays a typical size distribution of atmospheric particulate matter [14]. It possible to
distinguish three modes:
Nuclei mode: particles smaller than 50nm usually formed from volatile precursor during
exhaust dilution and cooling processes;
Accumulation mode: particles from 50nm up to 1000nm size range usually consists of
carbonaceous agglomerates and adsorbed material;
Coarse mode: particles larger than 1000nm consists of reentrained accumulation mode
particles, crankcase fumes.
Figure 1.9: Typical size distribution of Diesel particulate matter [14].
The different modes are used to characterize the emission of the nanoparticles in the test results
(see Chapters 4 and 5).

INTRODUCTION
31
Hydrocarbons (HC), in the exhaust of a CI engine, consist of unburnt hydrocarbons (UHC),
partially decomposed fuel molecules and recombined intermediate compounds. In direct injection
CI engines, hydrocarbons originate predominantly through insufficient mixing of fuel and air, in
regions where the flame quenches on the walls and where excessive dilution with air prevents the
combustion process from either starting or going to completion.
In particular, during the ignition delay period, the fuel injected mixes with air and can produce a
wide range of equivalence ratios. This is because some regions in the combustion chamber are
too lean to support combustion, whilst others fall within the flammability limits and finally some
regions are too rich and evaporate too slowly to combust also if the global mixture is lean. When
the fuel is injected after the start of combustion, in the mixing controlled combustion region, fuel
pyrolysis may occur (due to the high temperature and local low oxygen environment into which
the fuel is being injected) or, where oxygen is available, there will be a rapid oxidation. Any
conditions that slow down the rate of pyrolysis and/or oxidation, may lead to a localised rich
mixture and therefore, a delay or lack of combustion. When this happens, the exhaust is likely to
contain more UHC [11].
Moreover, fuel that vaporizes from the nozzle sac volume during diffusive combustion phase,
liquid films on combustion chamber surfaces, quenching in the squish volume outside the piston
bowl, are also a source of HC. A small portion of these hydrocarbons originate from the
lubricating oil left in a thin film on the cylinder wall, piston and perhaps on the cylinder head.
These oil layers can absorb and desorb fuel hydrocarbon components, before and after
combustion, respectively, thus permitting a fraction of the fuel to escape the primary combustion
process unburned.
The mechanisms of formation and oxidation of the hydrocarbon molecules depend upon most of
the engine operating variables, i.e., fuel-air ratio, injection time, swirl and of course injection
system design, time and rate of injection.
Carbon Monoxide (CO) is a product of incomplete combustion, formed when hydrocarbon
species are not completely oxidised to carbon dioxide. It is a colourless and odourless gas, highly
toxic to human beings and other life forms. There are several potential sources of CO emissions

INTRODUCTION
32
which include over-lean mixture regions, in the temperature range 800<T<1400K, that burn
slowly and over-rich regions that have insufficient oxygen availability for complete combustion
but temperatures enough high to oxidise the source fuel.
In hydrocarbon flames, the dominant reactions for oxidation of carbon monoxide are [9]:
1. 2
2. 2 2
3. 2 2
More importantly in the oxidation of CO is the amount of OH present. OH radical concentration
increases exponentially with peak charge temperature. The oxidation of CO is dominated by the
reaction described in Equation 1, such as the oxidation process is highly sensitive to temperature.
A minimum temperature of ~1500 K has to be finding because it is necessary for near complete
CO oxidation. As with HCs, the original fuel compound does not affect the final oxidation
process even if the required local equivalence ratio varies in accordance with fuel in order to
attain the required threshold temperature. Complete oxidation of HCs occurs at lower temperature
than that of CO, allowing CO to remain in an unoxidised state, leading to higher CO than HC
emissions.
In general, Diesel CO emissions are low because the mixture is globally lean. Nevertheless, since
this mixture is highly heterogeneous a certain amount of CO is generated locally in the
combustion chamber. In the case of combustions of high-diluted charges (e.g. high levels of
EGR), the CO increase due to the over lean zones as well low combustion temperatures inside the
chamber. More details regarding this aspect, in particular for new/alternative combustions, are
reported in the next Chapters.
1.1.3 Unregulated Emissions
Even if the unregulated emissions go beyond the objective of this thesis, it is worth to spend
some words on the unregulated emissions that have been found in CI engine exhaust. Although
they are at much lower concentration levels than the regulated emissions, they could be potential

INTRODUCTION
33
future regulated compounds. Some of them represent a part of the complex PM emission whereas
others are gas phase species:
• Polycyclic aromatic hydrocarbons (PAHs) are atmospheric pollutants that consist of fused
aromatic rings. Some PAH compounds have been identified as carcinogenic.
• Nitrous oxide, N2O (not included in NOx measurements) is a possible future concern as it is
promoted in some aftertreatment systems for use as an oxidant. As a pollutant, it is a powerful
greenhouse gas at 298 times the effect of CO2.
• Aldehydes are a part of the gaseous emission from CI engines Aldehydes are the product of
partial oxidation of hydrocarbons. They mainly consist of acetaldehyde (CH3CHO) and
formaldehyde (CH2O) that have proved to produce health effects and be probable
carcinogens. As occurs for hydrocarbon formation, aldehydes originate in a region where the
flame extinguishes. Aldehydes are highly oxygen concentration-dependent thus, the use of
alcohol fuels in diesel engines substantially increases aldehyde emissions principally if they
are used in quantities comparable to gasoline and diesel.
• Sulphur dioxide (SO2), from sulphur present in the fuel and the lube oil. Actually the sulphur
level in the fuels are quite low (<10ppm), but higher levels may still exist in some developing
markets. Sulphur dioxide is a precursor of acid rain and atmospheric particulate. Automotive
catalysts can be rendered ineffective (poisoned) by sulphur, as it deactivates the catalytic sites
of the catalyst.
• Nitrogen dioxide, (NO2), constitutes a part of the NOx emission (it is more toxic than NO, the
other component of NOx) it could be anticipated that in the future NO2 may be regulated
individually.
• Dioxins (polychlorinated dibenzodioxins), have lipophilic (dissolve in fats) properties, and are
known teratogens (cause birth defects), mutagens, and suspected human carcinogens. Dioxin
emissions are a problem only when chlorine is present during combustion. Consequently,
chlorine levels in diesel are now strictly controlled. Potentially biodiesels can contain small
levels of chlorine, if certain herbicides are used in production and this must be avoided.

INTRODUCTION
34
1.1.4 The future of the internal combustion engine
The internal combustion engine (ICE) will continue to improve and remain the dominant
technology for the next two or so decades, although we are likely to see an increase in powertrain
electrification [5]. Moreover, the need to improve the fuel economy and to reduce the pollutant
emissions of the ICE is driving to continuous improvements in all the conventional internal
combustion engines. These improvements are considered capable of bringing to a reduction of
about 30% to 40% in fuel consumption of light-duty vehicles over the next two 20 years (see
Figure 1.5) [3].
Such improvements could be achieved through the developments of breakthrough technologies,
such as two-stage turbochargers, electronic engine control, direct injection (DI) system (gasoline
engines), High pressure Common rail (HP-CR) injection systems, Exhaust gas recirculation
(EGR), Diesel oxidation catalyst (DOC), Diesel particulate filter (DPF), selective catalytic
reduction (SCR), etc.
In this framework, due to combination of energy efficiency, power, reliability and durability, the
diesel engines have many advantages. There are, however, several challenges still have to be
overcome. In fact, one of the biggest drawbacks of diesel engines is the so-called diesel dilemma.
This refers to the trade-off between NOx and PM, i.e. when attempting to reduce NOx by
reducing the combustion temperature, PM emissions increase (e.g. due to poorer oxidation) and
vice versa. Therefore, a lot of research is being conducted into the field of new combustion
concepts in order resolve this problem [18].
The reason why it is so difficult to control NOx and PM emissions in Diesel engines is related to
the basics of the conventional Diesel combustion process. The air-fuel mixture is globally lean
but not homogeneous, with local conditions in the combustion bowl of very high temperature and
oxygen concentration, ideal for NOx generation [25]. The local rich mixture conditions together
with high temperatures (T~1800K) promote moreover soot formation. Therefore, the NOx and
the soot emissions are inversely linked in the conventional diesel combustion.
To overcome to this dilemma, the combustion process must be modified to achieve more
homogeneous charge, the so-called advanced combustions, in order to reduce the mean charge
temperature and without unacceptable deterioration of efficiency and combustion noise [25].
More details about new and alternatives combustions are reported in the next Chapter 2

INTRODUCTION
35
With the introduction of the actual Euro 5 emission standard to meet the targets in terms of
particulate emissions (see Figure 1.5), most of Diesel engines has been equipped with an HP CR
fuel injection system and with DPF, whereas to meet the targets in terms of NOx, high levels of
EGR has been used. However, the combination of these technologies could be not sufficient to
close the gap to further Euro6 standards.
In this field, researches are going on in order to develop advanced engine control units and
strategies such as the “torque controlled” diesel engine control method [19]. This methodology,
called Closed-Loop Combustion Control (CLCC), is able to detect and control in real time the
level of biodiesel blend and the combustion respectively. The latter, in combination with the
actual engine technologies should lead to flex-fuel engines. The flex-fuel engines permit the use
of alternatives/renewable and low emission fuels, at constant performances and let to meet the
further targets in terms of pollutant and GHG emissions.
Thus, since further improved combustion process such as advanced diesel combustion (HCCI,
PCCI, LTC. etc.) have only reached research status up to now, EURO 5/EURO 6 level will
necessitate for aftertreatment technologies such as DPF, DOC or DeNOx, etc.
Anyway, in order to improve the global engine efficiency, necessary more attention has to be
devoted to the improvement of the new combustion concepts, which are able to reduce the
emissions maintaining high the efficiency. This permits simultaneously to reduce the load
devolved to the aftertreatment system and increase the global engine fuel efficiency.
1.2 Compression ignition fuels
The dilemma of matching engines and fuels with each other is being raised. In other words, the
question such as, how far should the engines be optimized for the use of a specific fuel, or vice
versa, how far should a fuel’s composition be optimized for use with a specific engine
technology, have to be assessed. This is why, this paragraph will focus essentially on the fuels
characteristics assessing, to some extent, their impact on the CI engines.
Concerning the GHG and pollutant emissions, significant changes in the mix of transportation
fuels in the future are expected. Moreover, there are also other factors driving such changes for
instance, the rate of introduction of new automotive technologies, the price of petroleum and

INTRODUCTION
36
petroleum products, the rate of utilization of resources from agricultural and forestry sectors, the
availability of new sources such as natural gas, etc.
Hence, all these aspects are leading to a deeper investigation concerning the creation of many
new potential fuels. Obviously, their practicability must be assessed in terms of a wide range of
physical-chemical properties, in relation to the operational condition in different engines.
Intrinsic fuel properties include volumetric energy, vapour pressure, heat of reaction, latent
enthalpy of vaporization, etc. Other important combustion properties include the minimum
ignition energy, laminar burning velocity, turbulent flame burning and quenching, auto-ignition
delay time, octane numbers (RON, MON), cetane number (CN) and so on.
In the follow are reported only the most common parameters, which regulate and characterize the
compression ignition fuels:
• Cetane number (CN)7: represent the ignition quality of CI fuels [24]. The higher the cetane
number, the greater the fuel’s tendency to ignite. A high CN corresponds to a short ignition
delay, whereas a low CN increase the ignition delay and then the mixing time between air and
fuel leading to undesired spike in the first part of the heat release and accordingly in the
pressure trace. Higher spikes determine also higher combustion noise and relatively higher
amounts of NOx. The average values for conventional diesel fuels are between 40 and 60.
• Auto-ignition temperature (AIT): there are several ways to define the auto-ignition
temperature of the fuel, which depends not only on the chemical composition but also on
many other parameters that define the physical condition of the system where the mixture
air/fuel will burn (i.e. fuel fraction in the mixture, pressure, heat conductivity, etc.). A simple
way to define the AIT is the lowest temperature at which the fuel mixture with air will
spontaneously ignite in a normal atmosphere without an external source of ignition. In the
case of the internal combustion engine (ICE), this occurs when the energy released by the low
temperature reactions (radical formation) during the compression stroke is larger than the heat
loss by the surrounding walls of the combustion chamber. A higher AIT reduce the tendency
of knock in the spark ignition (SI) engines whereas in the non-conventional combustions like
HCCI/PCCI ample the time for the mixing process between fuel and air.
7 The CN of a diesel fuel is defined in a standard CFR single cylinder test engine with variable compression pistons

INTRODUCTION
37
• Volatility/boiling curve: volatility may be specified by the boiling curve and represents the
distillation temperatures, which various percentages of the original sample have evaporated.
Higher volatility fuels will be characterized by lower temperatures for given fixed
percentages of evaporated sample, or conversely, by higher percentages evaporated at or
below a given temperature. A low initial boiling point makes a fuel suitable for use in cold
weather, but also means a lower CN and poor lubricant properties raising the wear risk [24].
It is important to highlight that sometimes the fuels (diesel, gasoline) are blend of
hydrocarbons, therefore there can be define a distillation curve. In the case of pure fuel, the
curve is reduced to a boiling point.
• Lubricity: is a measure of the fuel capacity to reduce the friction between mechanical parts.
The lubricity is measured in a High Frequency Reciprocating Rig method (HFRR) that
measure the amount of wear WSD (Wear scare diameter) in µm. Diesel must have WSD ≤
460 µm reached with the use of lubricity enhancers since the introduction of desulfurized
diesel fuels with lower lubricating characteristics.
• Low heating value (LHV): is usually specified to express the energy content of the fuels. The
HHV (High heating value) is higher than the LHV since it includes the heat trapped in the
water vapour (latent heat). The LHV of diesel fuel is about 42.5 MJ/kg. Oxygenates fuels
such as alcohol, FAME (Fatty acid methyl esters), etc., have a lower calorific value than pure
hydrocarbons because the oxygen bonded in them does not contribute to the combustion
process.
• Density: the energy content of fuels per unit of volume increases with density. The use of
fuels with widely different densities causes variations in mixture ratios due to fluctuations in
calorific value.
• Viscosity: is a measure of the fuel resistance to flow due to internal friction. Viscosity is
measured with various types of viscometers and rheometers. The kinematic viscosity8 is
measured in mm2/s and is comprised between 2 and 4.5
9 for diesel fuel. Leakage losses in the
fuel injection pump could result if diesel fuel viscosity is too low; high viscosity (e.g.
biodiesel) also changes the spray pattern due to the formation of larger droplets. Indeed,
viscosity is the most important parameter affecting spray atomization process [24].
8 The kinematic viscosity is the dynamic viscosity divided by the density(typical units mm
2/s, Stokes, St)
9The European Standard EN 590 define the requirements of diesel fuel

INTRODUCTION
38
In the next subsections are itemized the most common conventional and alternatives fuels
considered as diesel-like fuel for the compression ignition engines. A table of the main fuel
characteristics used during the research is reported in Table 6.1.
Petroleum fuel
Diesel fuels are the product of graduated distillation of crude oil. They contain a whole range of
individual hydrocarbons with boiling points ranging from roughly 180°C to 370°C. Diesel fuel
ignites (AIT) on average at approximately 350°C which is very early in comparison with gasoline
(on average 500°C). Traditional, petroleum-based diesel fuel is still expected to represent the
majority of CI fuels during the next 15 years and its composition will probably not change even if
the new regulation foresees an increasing percentage (5-10%) of biodiesel in blend with diesel.
Sulphur is a major source of particulate and acidic emissions but on-road sulphur levels in fuel
have declined dramatically in recent years. In Europe, the current sulphur specification for diesel
is 10 ppm. These reductions have reduced PM emissions, and enabled the introduction of
catalytic after-treatment systems in light and heavy-duty diesels. However, the lack of availability
of low-sulphur diesel is a major barrier to the wide scale deployment of diesel emission control
devices in developing countries.
Two significant sources of new diesel fuels are the so-called first and second-generation biofuels
that are respectively, the fatty acid esters and the F-T fuels (Fischer and Tropsch or synthetic
diesel). In Table 1.2 are reported the main physical and chemical fuel characteristics of these
alternative fuels. In particular, there are reported the fatty acid methyl esters (FAME), e.g. RME
(Rapeseed methyl ester) and SME (Soybean methyl ester) and the F-T fuel, i.e. the GTL (Gas to
liquid). Their impact on the combustion, in terms of performance and emissions are widely
assessed [20].

INTRODUCTION
39
Feature Method Petroleum
diesel GTL RME SME
Density @ 15 °C
[kg/m3]
EN ISO
12185 840.1 777.5 883 884.4
Viscosity a 40 °C
[mm2/s]
EN ISO
3104 3.141 2.547 4.254 3.958
Oxidation
Thermal Stability
a 110°C h
EN
14112 - - 8.6 7.9
Cetane Number EN ISO
5165 51.8 73.9 52.3 48
Low Heating
Value [MJ/kg]
ASTM
D3338 43.1 43.53 37.35 37.25
Distillation
[°C] IBP
203.1 322 320
°C 10%
vol. 230.3 333.2 332.1
°C 50%
vol. 280.1 265.9 337 335
°C 90%
vol. 338.1 305.8 343.3 341.2
°C 95%
vol. 312.2 347 345.6
°C FBP 362 317.3 360 362
Carbon [%,
m/m] 5991 86.5 84.3 78.5 78.4
Hydrogen [%,
m/m] 5991 13.5 14.4 10.8 11.0
Nitrogen [%,
m/m] 5991 - 1.3 0.2 0.2
Oxygen [%, m/m] 5991 - 0.0 10.5 10.4
Polyaromatic
content wt.-% ~4 0 0 0
Table 1.2: Main fuel parameters
Biodiesel (First generation biodiesel)
Biodiesel refers to esters of fatty acids. These are usually fatty acid methyl esters (FAME), but
may also be ethyl esters. The primary source is plant oils such as soy, palm, rapeseed, and
jatropha and consists primarily of triglycerides.
First generation biodiesel are produced through a trans-esterification process with alcohol (Figure
1.10) that features both high energy conversion efficiency and fuel yield from processed oil, these
two characteristics are the main responsible for the overall GHG emissions benefit of biodiesel in
WTW (Well to wheel) analyses [23].

INTRODUCTION
40
Figure 1.10: Trans-esterification of vegetable oil to biodiesel
When purified, the resulting product contains oxygenated molecules that have a relatively narrow
molecular weight distribution in the diesel fuel range.
The methanol used for trans-esterification is generally produced from natural gas or coal, and is
thus not obtained from biologic sources. Relative to petroleum-based diesel fuel, fatty acid
methyl esters have a number of benefits and challenges, which are summarized in Table 1.3.
Advantages of Biodiesel Disadvantages of Biodiesel
Lower emissions of PM, HC,
CO, PAH Slightly higher emissions of NOx
and possibly aldehydes
Near zero sulphur content Higher viscosity
Lower aromatic content Poorer low-temperature
Better lubricity Poorer oxidative stability
Higher Cetane Number Lower energy content
Lower GHG(life cycle basis) Increased engine deposits
Table 1.3: Comparison of biodiesel with petroleum Diesel; Properties and performance.
Negative aspects of biodiesel performance can be overcome through blending or using additives
or both. While it may be used neat, biodiesel is most commonly used as a blendstock. ASTM
International has developed a specification for pure biodiesel (2010a), and 5% (volume) biodiesel

INTRODUCTION
41
(B5) is approved for use under the diesel specification (D975). ASTM has developed a
specification for higher concentrations, B6-B20 (ASTM 2010b). Use of biodiesel is expected to
grow in the outlook period.
The emission effects of biodiesel have been largely studied and analysed [20].The data show that
biodiesel reduces emissions of PM, hydrocarbons, and CO and somewhat increases emissions of
NOx. Moreover, the oxygen content of the FAME is significant, exceeding 10% of the total mass,
and is responsible of the fuel LHV reduction of the same magnitude.
Because conventional diesel fuel is highly paraffinic and biodiesel fuels contain esters, it is
possible that unregulated emissions will be affected. Based on the particular vegetation source
used to produce the biodiesel fuel, emissions of formaldehyde and acetaldehyde (unregulated
emissions) may increase, as compared with a petroleum diesel because of the higher oxygen
content of the biodiesel (see paragraph 1.1.3). In fact, respect to the second-generation biofuels,
FAME retains trace of original feedstock used for oil production, which has different
implications in terms of chemical and physical properties of the biodiesel itself, such as oxidative
stability (primarily), lower heating value (LHV), stoichiometric air-to-fuel ratio, viscosity,
evaporation curve, etc.
Fischer-Tropsch Diesel (Second-generation biodiesel)
F-T diesels are usually indicated with XTL, where X denotes the specific source feedstock and
TL (to Liquid) highlights the final liquid state of the fuel. The input feedstock can be either
renewable Biomass (hence BTL) or fossil fuels, as natural Gas (GTL) or Coal (CTL). Looking at
the renewable BTL production, it has minor interferences with the human food chain with respect
to biodiesel, since non-edible biomasses can be employed or, in case of animal-edible biomasses,
the whole plant can be processed, as for the cellulosic ethanol production. The XTL shows,
respect to the first generation of biofuels instead much better stability in the chemical
composition, which is essentially driven by the synthesis process itself and not by the baseline
feedstock, and can therefore be managed in a more consistent way [20].
In fact, if engine manufacturers develop new engine technologies that take advantage of the
special properties of F-T diesel, then a separate grade of fuel could be produced converting the
process to adapt it to the final product.

INTRODUCTION
42
F-T diesel producing process is consisting of two steps. First, a feedstock is thermally treated to
produce a synthesis gas (syngas) consisting primarily of CO (carbon oxide) and H2 (hydrogen). In
the second step, the synthesis gas is reacted catalytically to produce a mixture of hydrocarbons
(long paraffin chains + wax) and then hydrocracked to produce the desired end product
(kerosene, diesel, Jet fuel, Naphtha, etc.). The resulting fuel is similar to petroleum diesel
(paraffin olefin) in molecular weight range (C8–C24), although the distributions may not match
exactly. The F-T diesel fuel is extremely high quality and has low or zero aromatics and sulphur,
along with a very high cetane number >70 (see Table 1.2).
One of the most important advantages of the F-T fuels is that they are aromatic free, and as
known, the aromatics are soot precursor.
In one study of a light-duty “torque controlled” diesel engine, F-T diesel, in particular GTL has
been shown to reduce CO (30%) and HC (50%), at more or less constant NOx and PM emissions,
relative to petroleum diesel. This test were performed at constant combustion phasing and IMEP
so that the potential advantages, due to the absence of aromatics, in terms of PM reduction are
overcame by the higher CN that lead to a more diffusive combustion [20].
Alcohols and Ethers
Alcohols and ethers have been proposed for use either in diesel engines, neat or in mixtures with
diesel fuel. Alcohols such as methanol and ethanol are not particularly miscible with diesel fuel
and their use is under studying.
Within the outlook period of the next decade, ethers such as dimethyl ether (DME) can be good
diesel fuels. DME is also highly volatile and flammable; its physical properties are similar to
C3H8 (propane). Its widespread use in transportation would require expansion of the LPG
infrastructure to transport and store it. There is interest in DME use in Asia and some plants are
being built in China and Japan. Coal and natural gas are the primary feedstocks for DME
production. However, the most interesting takes into consideration that DME can also be
produced from the thermochemical conversion of biomass to produce synthesis gas, which is then
followed by the catalytic conversion of the synthesis gas to DME. Unlike any other synthetic
diesel fuel, DME virtually eliminates soot emissions and the need for DPFs [20].

INTRODUCTION
43
Innovative - renewable fuel
To be acceptable, biofuel feedstocks must be sustainably produced in terms of agricultural
practices, forest management, protection of bio-diverse ecosystems, etc. 2th
generation biofuels
do not compete with food and fibre and therefore, ligno-cellulosic, forest and agricultural
residuals, are promising alternatives in terms of renewable and alternative fuels production.
Besides, for the production of the already mentioned renewable fuels, such as Biodiesel, BTL,
and DME, new biomass feedstocks are being considered, e.g. example fatty acids from algae
farming. Or else, glycerine as a significant by-product of biodiesel production. In this field,
research is underway to find new uses for this product evaluating the possibility to use this by-
product as a fuel in blend with petroleum diesel fuel.
Other innovative fuels are cyclic oxygenates fuels (used in this research). They can be produced
from biological feedstock, more specifically, from lingo-cellulosic biomass (also known as plant
waste/residue) which principal components include cellulose, hemicellulose and lignin. The
production of liquid cyclic oxygenates from such heavy molecules is straightforward therefore,
the design of a commercially viable production process of these species is a current subject of
investigation [102].
1.3 Investment and research in the field of the internal combustion
engines.
This paragraph would collocate and explain why, in the period in which it is advertises a lot the
electrification of the propulsion system, have sense to invest to further extent in the field of the
internal combustion engine.
Cheah et al. [3] affirmed that - the internal combustion engine will continue to improve and
remain the dominant technology for the next two or so decades, although we are likely to see an
increase in powertrain electrification and the use of nonpetroleum fuels within this period.
An answer was also given, at the Emission Research Conference (DEER), by Byron Bunker,
Director of Heavy Duty Engine Center, US Environmental Protection Agency during his remarks
in a panel discussion on the role for internal combustion engines in the energy future [16]:

INTRODUCTION
44
“The future of the IC engine is bright and clear; I don’t think that could be any more obvious to
all of us”. Even while projecting to the future and talking about batteries and electric vehicles, he
said, “When you look at our actual analysis and you look to our projections for the future, 95%
or more of the vehicles, all of the heavy-duty vehicles in our analysis are relying on IC engines”.
By the other way, Hugh Blaxill, Managing Director of Mahle Powertrain, said that the current
surge in volume of 4-cylinder engines along with the rapid ramp in direct injection and variable
valvetrain technologies across all manufacturers marks the start of a sharp increase in downsized
applications and hybrid powertrains.
In the longer term (out toward 2030), Mahle sees increasing downsizing, with a surge in 3-
cylinder applications, increasing electrification, and increased use of bio- and gaseous fuels.
David Greene of Oak Ridge National Laboratory put the importance of improving efficiency in
the transportation sector in the broader context of an ultimate transition to a different form of
energy, i.e., non-petroleum-based for transportation. He said: “the number one priority, I think, is
and should be improving the energy efficiency of the global transportation system.” [16].
If we are going to get to a sustainable transportation system, for 2050 and beyond, probably we
should introduce different forms of energy to run the transportation system. However, it is
obvious that, the transition process would be a lot easier with a higher energy efficient
transportation system.
However, to improve the fuel economy of the propulsion systems, and moreover to meet the
targets in terms of both GHG emissions and other pollutants (see 1.1.4), engine should become
more robust to fuel variation with new sensor technologies and new/alternatives combustion
methodologies. These objectives require, however, a strong research in the field of internal
combustion engines.
In this context, I am going to place the research done and described in this manuscript
1.4 Structure and objectives of this research
A great deal of research is currently devoted to the development of innovative combustions such
as PCCI/HCCI in order to improve efficiency and reduce emissions relative to typical diesel

INTRODUCTION
45
engines. The aim is to reduce the in-cylinder emissions in order to reduce the load devolved to
the aftertreatment devices bringing to higher fuel efficiency and lower costs.
It is logical to think that these changes necessarily bring to specifically “designed fuels” and to
new or modified engine hardware in order to make them suitable for the new combustion
concepts. However, at this stage of development, it is not possible to define with any certainty the
fuel requirements of these engines but it has been suggested that the best fuel will be a minimally
refined product that has properties midway between gasoline and diesel [5].
The purpose of this research is to bring a scientific contribute understanding of what approaches
are successful in adapting a modern LD DI diesel engine to operate a PCCI with the aim to
reduce simultaneously soot and NOx emissions without excessive penalties in terms of HC and
CO. The not less important, fuel consumption and combustion noise level, that could be
potentially limiting factors, are considered. The approach of this research was essentially
experimental combining different type of fuels, injection systems and strategies.
The first part of this work is dedicated to assess the impact of alternatives/renewable low cetane
“oxy-fuels” on a modern automotive LD DI diesel engine. The aim is to acquire insight into the
influence of cetane number (CN) and fuel oxygen on overall engine performance in a premixed
combustion mode (PCCI: Premixed charge compression ignition). Further, more conventional
engine control strategies (pilot + main, EGR, etc.) were used. The project was carried out in
cooperation with the Technical University of Eindhoven.
The aim of the second part of this work is to study the combustion mechanism improving the
mixing process using a port fuel injection (PFI) system. This part, conducted in cooperation with
the Politecnico di Torino and Centro Ricerche Fiat (CRF) was founded partially by the Italian
University and Research Ministry for through the FIRB Project DM24153.
This research will continue in the future in order to contribute further, to some extent, in the
promising field of the low emission high efficient combustion. Finally, I believe that as occurred
more times in the past, there will be new breakthroughs that will make the ICE competitive in the
coming decades with respect to the alternatives propulsion systems.

BACKROUND: ADVANCED DIESEL COMBUSTION METHODOLOGIES AND TECHNOLOGIES
46
2 BACKROUND: ADVANCED DIESEL COMBUSTION
METHODOLOGIES AND TECHNOLOGIES
2.1 The advanced diesel combustion concepts: HCCI, PCCI, LTC
In conventional diesel combustion, the typical high compression ratio of the CI engines (14-20),
permit the air-fuel mixture to auto-ignite as consequence of piston compression. The processes,
which occur between the two moments when the liquid fuel leaves the injector nozzles and
when the fuel starts to burn, are complex and include droplet formation, collisions, breakup,
evaporation and vapour diffusion. These processes effectively limit the rate of combustion. A
part of the air and fuel will be premixed and burn fast, but for the larger fraction of the fuel, the
time scale of evaporation, diffusion, etc. is larger than the chemical time scale. Therefore, the
mixture can be divided into high fuel concentration regions and high temperature flame regions.
In the high fuel concentration regions, a large amount of soot is formed because of the absence
of O2. Some soot can be oxidized with the increase of in-cylinder temperature. In the high
temperature flame region, the temperature can reach about 2200 K, which leads to a great deal
of NOx emissions. Thus, for diesel engines, a trade-off between these two emissions is
observed, and their problem is how to break through the compromise between NOx and PM
emissions. Moreover, as discussed in the previous chapter, since the aftertreatment systems to
reduce NOx and particulates are expensive, instead to delegate the emission reduction almost
completely to the aftertreatment systems, the ambition is to have both low in-cylinder emissions
and high efficient combustions.
This is because of increasing attention has been devoted to the study of the homogeneous charge
compression ignition (HCCI) engine. The HCCI concept seems to be the most promising new
combustion strategy because it can reduce NOx and soot emissions simultaneously while
maintaining high fuel efficiency [36][37][38].
The HCCI combustion process is closest to the Otto cycle and incorporates the advantages of
both spark ignition (SI) engines and compression ignition direct injection (CIDI) engines. The
ideal HCCI process is characterized by a lean, premixed and homogeneous charge that reacts

BACKROUND: ADVANCED DIESEL COMBUSTION METHODOLOGIES AND TECHNOLOGIES
47
and burns volumetrically and slowly throughout the cylinder by piston compression. In
particular, the auto-ignition occurs through the cylinder without flame propagation at multiple
sites simultaneously. These features lead to very low NOx and particulate matter emissions
while maintaining high thermal efficiency. In particular, this avoids the well-known drawbacks
of mixing - controlled combustion that cause soot formation in DI Diesel engines. Moreover, it
leads to lower gas temperatures, thus reducing NOx emissions [39].
HCCI is the basic idea of advanced diesel combustion. The diesel HCCI combustion strategy is
often referred to as “PCCI concept” [40], which is based on non-uniform or partially premixed
mixtures achieved during a shorter period of crank angle between injection and combustion
event than in port injection HCCI strategy. The stratified fuel mixtures present in the cylinder
include fuel rich mixture elements, which are effectively utilized to expand load range by
preventing instantaneous combustion specific to HCCI combustion. There are various types (and
relative acronyms) of advanced diesel combustion strategies such as Uniform Buckly
Combustion System (UNIBUS) [41], Premixed Lean Diesel Combustion (PREDIC) [42][43],
low temperature rich combustion (LTC) [44] and premixed charge ignition (PCI) [45] that are
categorized in the PCCI combustion regime. They are described more in detail in the paragraph
2.3 where are also reported the possible pathways to realize such advanced diesel combustions.
Figure 2.1 illustrates a comparison between diesel HCCI (or PCCI) and conventional diesel
combustion, showing typical features of PCCI combustion achieved by early injection timing
[12]. HCCI combustion exhibits a two-stage combustion process instead of the conventional
premixed-diffusive combustion. Moreover, the HCCI in-cylinder combustion temperature is
much lower compared to the conventional one. These aspects are discussed in detail in the next
paragraphs.

BACKROUND: ADVANCED DIESEL COMBUSTION METHODOLOGIES AND TECHNOLOGIES
48
Figure 2.1: Comparison between conventional and HCCI (or PCCI) combustion showing a longer
induction time
2.2 Aspects and challenges of PCCI/HCCI combustion
The most typical features, advantages and drawbacks, of HCCI/PCCI combustion are itemized
and discussed in the next subsections [12]. In particular, they are characterized by:
• Homogeneous mixture preparation
• Two-Stage Heat Release
• Low NOx and Soot Emissions
• High levels of Noise, UHC and CO emissions
• Combustion control
• Operation range
2.2.1 Homogeneous mixture preparation
Mixture homogeneity, is one of the challenges of the HCCI combustion mode because, it has an
effect on auto-ignition reactions that control the HCCI combustion phasing [46] and there is
significant evidence that low NOx emissions can be produced even with some degree of mixture
inhomogeneity within the combustion chamber.

BACKROUND: ADVANCED DIESEL COMBUSTION METHODOLOGIES AND TECHNOLOGIES
49
Therefore, an early injection phasing and a long induction time are fundamental to have a
sufficient mixing time before auto-ignition occurs. These characteristics play a fundamental rule
in the PCCI combustion to premix fuel, air and EGR gases. A longer induction time between the
start of injection and the start of heat release (HR) features diesel HCCI combustion.
The mixture can be prepared either internally (HCCI) [47][48], than externally the cylinder, e.g.
with port fuel injection (HCCI-PFI)[54][55][56]. The problem observed when in-cylinder
mixture formation occurs is the integration with the conventional DI operations at medium and
high loads where HCCI operations are inapplicable (see paragraph 2.2.6). The external mixture
formation approach, instead, allows for a better mixing of air and fuel without modifications to
the DI system [55][57][58] even if fuel deposit or condensation may occur in the intake
manifold.
Homogeneous mixture preparation is most difficult for fuels with reduced volatility such as
diesel, which requires very early direct injection or elevated intake air temperatures for low-
smoke operation when port-injected. The integration of the external mixture formation with a
conventional in-cylinder fuel injection has been also analysed in this work and explained in the
Chapter 5.
2.2.2 Two-Stage Heat Release
HCCI combustion mode, as shown in Figure 2.2, features a Two-Stage Heat Release combustion
one for the low temperature oxidation reactions and the other for the high temperature oxidation
reactions. In fact, as the in-cylinder mixture temperature rises during the compression stroke,
weak heat release due to the low temperature reactions occurs first, resulting in slight increases
in both in-cylinder pressure and gas temperature.

BACKROUND: ADVANCED DIESEL COMBUSTION METHODOLOGIES AND TECHNOLOGIES
50
Figure 2.2: Typical heat release curve from HCCI combustion of n-heptane fuel.
The low heat release (LHT) is associated with low temperature kinetic reactions. After, the LHT
the high heat releases (HHR) occurs which is attributed to the negative temperature coefficient
(NTC) regime [27]. The NTC, as the intermediate temperature regions between the LHT and
HHR, is regarded as being the general characteristic in fully or partially premixed mixture. In
this region, though reactions among in-cylinder species are still going on, the heat release is near
zero. The duration of NTC decreases greatly with increasing pressure and cool flame
temperature because these accelerate the activation of the hot flame region [75]. The
temperature range of the NTC area is between 700 -950K [72][73]. In this NTC regime, the
overall reaction rate decreases though the in-cylinder temperature increases, which leads to a
lower reactivity of the system10
.
Heat release from low temperature reaction is mainly related to the fuel and the engine operating
conditions. In particular, in the case of diesel fuels with a relatively high11
auto ignition tendency
or cetane number [76], the LHT curve was observed. In the case, instead, of gasoline-like fuels
with a low cetane number (high octane number), LHT is less compared with diesel-like fuels at
the same condition. Consequently, heat release from low temperature reaction is too little to
observe expectedly from the heat release profiles at most conditions for gasoline-like fuels [28].
10
Generally, in the literature, NTC region refers to a range of temperature where ignition delay time (ID) increase
with temperature, i.e. the slope of ID as a function of 1000/Tin in an Arrhenius plot from positive becomes negative. 11
In general, the higher the longer the carbon chain the higher the auto-ignition tendency.

BACKROUND: ADVANCED DIESEL COMBUSTION METHODOLOGIES AND TECHNOLOGIES
51
In case of HCCI-DI can be noted also a diffusive combustion due to the directly injected diesel
fuel [75]. Oxidation of hydrocarbon fuels mainly takes place via two representing routes shown
in Figure 2.3.
Figure 2.3: Reaction paths of hydrocarbon fuels in low and high temperature reactions [28].
In the low temperature oxidation (LTO) reactions are produced intermediate species (CH2O,
HO2, and O radicals) within the cylinder through abstraction reactions of hydrogen, and auto-
ignition, i.e., cool flame reaction, starts by the reaction of OH with RH produced from peroxides
such as aldehydes[27]. After a short period, the thermal flame reaction starts, accompanied by
the main heat release.
The high heat release rate (RoHR) of main combustion (Figure 2.2) is dominated by the high
temperature oxidation (HTO) reactions of hydrocarbon fuel through which intermediates such as
olefins and alkyl radicals are rapidly consumed. The presence of high concentrations of CH, H,
and OH radicals are indicative of high temperature chemistry during the bulk burn [78]. These
intermediate species are produced by thermal decomposition reactions including the chain
breaking of C–C bonds in the fuel. The in-cylinder mixture is partially or nearly homogeneous
when ignition starts, and once high temperature oxidation occurs locally, it triggers auto-ignition
instantly throughout the combustion chamber except in the quench layers. The steep pressure

BACKROUND: ADVANCED DIESEL COMBUSTION METHODOLOGIES AND TECHNOLOGIES
52
rise produced by the auto-ignition generates intense combustion noise, one of the other concerns
of HCCI combustion.
The in-cylinder gas temperatures, which the low and high temperature oxidation reactions start
respectively, was investigated [29]. It was observed that for n-pentane the low temperature
oxidation (LTO) and the high temperature oxidation (HTO) start at around 790 and 970 K,
respectively, independently of equivalence ratio, EGR rate and intake air temperature.
Thus, the in-cylinder gas temperature governs dominantly the ignition process in HCCI
combustion. In accordance with Najt and Foster [77], who concluded that HCCI auto-ignition is
controlled by low temperature (below 1000 K) chemistry and the bulk energy release is
controlled by the high temperature (above 1000 K) chemistry dominated by CO oxidation.
2.2.3 Low NOx and Soot Emissions - Non-Luminous Flame
When EGR is not employed, HCCI combustion is possible only for Fuel Lean and Low
Temperature Combustion, i.e. in a limited range of air fuel ratio (see Figure 2.6). As shown in
Figure 2.1, the peak cylinder gas temperature in HCCI combustion ranges from 1400 to 1600K
and is significantly lower than 1700–2200K in conventional diesel combustion. The low
cylinder gas temperature suppresses both NOx and soot production, but, on the other hand,
involves the slow oxidation reactions that cause misfiring and quenching, resulting in the higher
HC and CO emissions as compared with those in conventional diesel combustion. In Figure 2.4
[12] is reported a φ-T map, showing the operating regions of the advanced combustion regimes
and a belt-like region for conventional diesel combustion representing the temporal changes of
equivalence ratio, φ, and temperature, T, in the flame [79][80]. The advanced combustion
regions are located in the left bottom corner away from NO and soot formation areas.

BACKROUND: ADVANCED DIESEL COMBUSTION METHODOLOGIES AND TECHNOLOGIES
53
Figure 2.4: Operating regions for conventional and advanced diesel combustion regimes in relation
to NO and soot regions [12].
In HCCI combustion, the fuel air mixtures are nearly premixed within the longer induction
duration, and as a result optical diagnostics (see Figure 2.5) has shown that advanced low
temperature combustion (LTC) initiates simultaneously at multiple sites within the combustion
chamber and that there is no discernible flame propagation - Non-Luminous Flame [27]
Figure 2.5: Conventional diesel and LTC (engine speed 1200rpm, nitrogen dilution to simulate
EGR) [81].
Figure 2.6 [82] illustrates a comparison of NOx emission characteristics between three
combustion modes; compressed natural gas (CNG) homogeneous mixture spark ignition
combustion, glow plug assisted CNG direct injection combustion, and the premixed diesel
combustion, including PREDIC, UNIBUS and PCCI combustion[30]. NOx emissions of spark
ignited homogeneous mixture combustion depend on the equivalence ratio as the NO chemistry

BACKROUND: ADVANCED DIESEL COMBUSTION METHODOLOGIES AND TECHNOLOGIES
54
suggests. NOx emissions for direct injection combustion remain at high levels from 102 to 103
ppm over a wide range of equivalence ratio, which is common in turbulent diffusion
combustion. All the data for NOx emissions of the advanced diesel combustion regimes stay in a
domain bounded by two extrapolated lines, for CNG direct injection(not homogeneous) and
CNG homogeneous combustion. This means that the advanced diesel combustion regimes are of
partially homogeneous combustion. This is the reason why the HCCI in diesel engines are
defined PCCI. NOx emissions in PCCI combustion regimes are lower than 100 ppm although
the operation is possible only in a narrow range of equivalence ratio (between 0.2 and 0.4).
Figure 2.6: Relationships between NOx emissions and mean equivalence ratio for various
combustion strategies without EGR [82].
This is why, further researches are needed, in the field of HCCI combustion, to overcome the
obstacles that limit its use in the whole operating range of the ICE.
2.2.4 High levels of Noise, UHC and CO emissions
Challenges for HCCI operation are the potential increase in noise, UHC (unburned hydrocarbon)
and CO emissions. As with all homogeneous combustion systems and with the early direct
injection strategies, the spray wall impingement as well as the low temperature combustion are
the major causes for the high HC and CO emissions and high indicated specific fuel

BACKROUND: ADVANCED DIESEL COMBUSTION METHODOLOGIES AND TECHNOLOGIES
55
consumption (ISFC). This is why, significant portion of the in-cylinder fuel is stored in crevices
during the compression stroke and escapes combustion. Moreover, the burned gas temperature is
too low to consume much of this unburned fuel when it re-enters the cylinder during the
expansion stroke. This results in significant increase in both HC and CO emissions relative to
conventional combustion. In addition, the peak burned gas temperatures are too low (lower than
1400 K or 1600 K) to complete the CO to CO2 oxidation at low loads, and the combustion
efficiency deteriorates precipitously.
This loss of combustion efficiency combined with ignition difficulties limits the effectiveness of
HCCI combustion at the lightest loads (see Figure 2.6). At higher loads, the rate of pressure rise
can become so large that engine noise increases significantly, and if left unchecked, engine
damage may occur [31].
The use of high volatile fuels could be beneficial to reduce HC and CO emissions for medium
loads but for very low loads, it could be lead to over-mixed charge increasing more the HC and
CO [18]. Moreover, since the exhaust temperature is lower than in conventional diesel
combustion, the advanced diesel combustion systems need special exhaust gas treatment
systems that are active at lower temperatures to reduce HC and CO emissions.
2.2.5 Combustion control
One of the principal challenges of HCCI combustion is the control of the combustion phasing.
Unlike conventional combustion, a direct method for controlling the start of combustion is not
available. Instead, the start of combustion is established by the auto-ignition chemistry of the
air-fuel mixture. Hence, combustion phasing of HCCI engines is affected by the following
factors: auto-ignition properties of the fuel, fuel concentration, residual rate and reactivity of the
residual, mixture homogeneity, compression ratio, intake temperature, latent heat of
vaporization of the fuel, engine temperature, heat transfer to the engine and other engine-
dependent parameters [33]. In this context, the development of advanced combustion electronic
control technology is important (see paragraph 1.1.4) [20]. The state of the art of the new
advanced combustion suggests investigating more in such field to make effective the
combustion control.

BACKROUND: ADVANCED DIESEL COMBUSTION METHODOLOGIES AND TECHNOLOGIES
56
2.2.6 Operation range
In addition to the above problems, another fundamental barrier in HCCI development is
extending the operating load range whilst maintaining the full HCCI benefit. Extending the
operating range is as important as the auto-ignition process. In addition to expanding the HCCI
operation to higher load, very light load operation is also limited, because there is insufficient
thermal energy to permit auto-ignition of the mixture late in the compression stroke.
Figure 2.7 gives an example of the narrow Operating Range of a diesel HCCI combustion in
which equal IMEP lines are included. The data obtained at an engine speed of 1500 rpm using a
single cylinder test engine with a compression ratio of 18. In this study, n-heptane (CN 56) was
injected into the intake charge to eliminate the difficulty of fuel evaporation [34].
Figure 2.7: Diesel HCCI operating region and IMEP map for a compression ratio of 18 and intake
charge temperature of 30°C [34].
The abscissa represents the EGR rate (percentage by mass), while the ordinate gives the overall
excess air ratio, lambda, of the cylinder charge. It can be seen, under such operating conditions,
diesel HCCI combustion can be achieved over a narrow range of excess air ratios and EGR rates.
IMEP is governed mainly by excess air ratio, and 4.0 bar of maximum IMEP is achieved at a
lambda of 1.5 and EGR rate of 65%. The upper limit of the HCCI region is bounded by knock,

BACKROUND: ADVANCED DIESEL COMBUSTION METHODOLOGIES AND TECHNOLOGIES
57
while misfire occurs at the right and top-right boundary of the region. The richest lambda
attainable at zero EGR is approximately 5.0–6.0, significantly high as compared to 3.0 for
gasoline HCCI combustion. However, the diesel HCCI combustion can tolerate very high EGR
rates, up to 70% by mass.
The operation of diesel HCCI combustion engine depends also on fuel injection timing, which
affects the extent of in-homogeneity of mixtures produced during the induction time.
2.3 Strategies to improve the diesel combustion
In the previous paragraph aspects, challenges and the well-known typical features of
HCCI/PCCI combustion are explained, whereas in this section, the most known diesel-fuelled
HCCI combustion concepts are introduced. Further, there is a classification of what the author
thinks about possible strategies to actuate the new combustion concept (fuels, engine
architecture, and injection strategies) and finally a hint of the approaches used in this study.
Hereafter are described some of the proposed types of advanced combustion concepts, UNIBUS,
PREDIC, LTC, that are actuated in following different methodologies.
Uniform Bulky Combustion System (UNIBUS). Toyota uniform bulky combustion system
(UNIBUS) was introduced in 2000 in Japanese Market. The engine is a Toyota 1KD-FTV. It is
two-staged injection diesel combustion. The first injection is introduced into cylinder in early
compression stroke to form premixed mixture and initiate some low temperature reaction. The
second injection is released after TDC to trigger the three combustions. Timing and quantity of
the first injection has to be precisely controlled along with boost pressure to avoid premature
auto ignition. The main enabling control technologies are common rail injection system and
variable nozzle turbo. UNIBUS is only applied under part load and under rpm of 3000. Within
UNIBUS operation region, richer mixture is supplied in the first injection under low load
condition to ensure there is enough low temperature reaction; while total load is controlled by
the second injection
Other UNIBUS studies were done on a 4dm3 four-cylinder diesel engine with a compression
ratio of 18 [83] test engine. It employs a centrally mounted pintle-type fuel injector to control

BACKROUND: ADVANCED DIESEL COMBUSTION METHODOLOGIES AND TECHNOLOGIES
58
mixture formation and avoid fuel impingement on the cylinder walls. Figure 2.8 [12] shows
effects of injection timing on IMEP and emissions under conditions without EGR. High advance
in injection timing allows NOx emissions lower than 10 ppm and no soot emissions, but is
accompanied by increased HC emissions and lowered IMEP.
Figure 2.8: Effects of injection timing on emissions and IMEP in UNIBUS combustion [12].
The optimum injection timing of the UNIBUS combustion regime was found to lie between 40
and 60° BTDC. As the figure indicates, the major concerns with UNIBUS are high HC
emissions and reduced IMEP. High HC emissions can be attributed to locally distributed
mixtures with too lean to burn equivalence ratios and the cylinder wall wetting. Therefore,
preventing the injected fuel from impinging on the cylinder walls is an important challenge in
UNIBUS combustion regime. The low IMEP, i.e., deteriorated thermal efficiency, is due to
premature ignition. The premature ignition phases the combustion in advance respect to the
value (6-15°C aTDC) that maximizes the thermodynamic efficiency. Accordingly, the key to
improve thermal efficiency is how to postpone the spontaneous ignition timing. Many trials have
been made to prolong the ignition delay by focusing on the compression ratio, EGR rate,
injection control [48], CO2 addition, and water injection, all aiming to lower the compressed
cylinder gas temperature.
Further studies were carried out looking at the possibility of using a second injection closer to
TDC to trigger the combustion, which reduced the NOx benefits but also the fuel consumption.

BACKROUND: ADVANCED DIESEL COMBUSTION METHODOLOGIES AND TECHNOLOGIES
59
Low levels of fuelling and low injection pressures were regarded as being most appropriate to
limit wall wetting and knocking with this particular injector nozzle.[35]
Premixed Lean Diesel Combustion (PREDIC) is a diesel HCCI combustion concept and
employs an early injection strategy [43] [82]. A single cylinder test engine with a displacement
of 2dm3 and a compression ratio of 16.5 was operated using a fuel with a cetane number of 19 at
an engine speed of 1000 rpm. Two injectors were mounted on the sidewalls of the combustion
chamber so that the sprays could evolve across the combustion bowl, minimizing the spray
impingement on the walls.
Figure 2.9 shows the effect of injection timing on NOx emissions for different excess air ratios.
For each excess air ratio, a set of three data plots forms a short curve indicating a range of
injection timing in which heat release occurs moderately near TDC with substantially low NOx
emissions. The combustion mode observed here was denoted as PREDIC. If the injection timing
is retarded beyond the end of the curve, excessive and harsh combustion-knock critical to the
operating limit occurs because the shorter induction duration produces much heterogeneous
mixture distribution, causing fuel rich mixtures to ignite earlier. Conversely, when the injection
timing is advanced earlier beyond the opposite end, the engine suffers the unstable ignition and
eventual misfire because the long induction period generates more uniform mixtures that are too
lean to burn. This suggests that non-homogeneous mixtures are desirable for PREDIC to assure
stable spontaneous ignition. Thus, the extent of the homogeneity of the mixture is an important
parameter to determine ignition timing together with the overall equivalence ratio. When the
overall excess air ratio is decreased to 2.5, the injection timing has to be advanced to 120° bTDC
to achieve PREDIC. The injection timing appropriate for PREDIC is limited in a very narrow
crank angle window of less than 10◦CA for each excess air ratio.

BACKROUND: ADVANCED DIESEL COMBUSTION METHODOLOGIES AND TECHNOLOGIES
60
Figure 2.9: NOx emission characteristics of PREDIC (without EGR) [43].
Modulated Kinetics (MK) combustion strategy is based on significantly retarded fuel injection
timing and high EGR rate, and requires auto-ignition to occur after the end of fuel injection,
allowing lean and partially premixed mixtures to be formed before auto-ignition [85]. Nissan
modulated kinetics (MK) combustion mode is introduced to market in 1998 in Nissan engine. In
this case, there is a single injection after TDC. The retarded injection along with high EGR ratio
prolongs the ignition delay. At the meantime, no re-entrant bowl in combination with high swirl
facilitates the dispersion of the injected fuel outside of the piston bowl. Therefore, the mixing
time scale is shorter than the auto-ignition time scale, and HCCI combustion occurs. MK mode
achieves first success at low load condition, and engine switches to regular diesel operation at
high loads. In the effort to expand the MK operating range, one key technical issue is the
relationship between injection duration and ignition delay. In order to make the ignition delay
longer than the injection duration, high-pressure injection, reduced compression ratio and EGR
gas cooling are applied for second generation of MK engine. Normally, retarded ignition and
combustion has lower efficiency, but low temperature combustion and low piston head heat
transfer mitigates the problem [89].
The characteristics of MK combustion were also investigated using a four-cylinder DI engine
[86]. The swirl ratio was set relatively high at four to enhance mixing during the short induction
duration. Shown in Figure 2.10 is a comparison between the rates of heat release at three
different injection timings and EGR rates. When the fuel is injected at TDC in compressed

BACKROUND: ADVANCED DIESEL COMBUSTION METHODOLOGIES AND TECHNOLOGIES
61
charge containing 45% cooled EGR gas, combustion starts after the end of injection, showing a
single peak heat release rate in the expansion stroke that is specific to MK combustion.
The authors also show that with cooled EGR and a lambda of about 1.8, the late injection
drastically reduces the NOx emissions with the smoke at the same level. Despite the late
combustion phasing after TDC, the thermal efficiency penalty is relatively small. Moreover, the
authors claim that both the low combustion temperature due to the fuel lean combustion and the
reduced flame interaction with the piston surfaces due to high swirl air motion act effectively to
reduce heat losses to the combustion chamber walls. HC emissions are lower than in PCCI
combustion because of the reduced wall wetting and reduced quench layers near the cylinder
walls. The operation of MK combustion is limited to a low-medium engine speed and load range
because, at high load conditions, ignition tends to occur before the end of fuel injection due to
high cylinder gas temperature
Figure 2.10: Effect of EGR rate and injection timing (IT) on the rate of heat release in MK
combustion [86].
Low Temperature Combustion (LTC) in diesel engines consists of fuel injection in which the
fuel is allowed to vaporize and mix better with the ambient gas (less rich or even leaner than
stoichiometric mixtures) before combustion occurs. A high level of Exhaust Gas Recirculation
(EGR) is usually used to reduce the combustion temperature to mitigate the formation of NOx.

BACKROUND: ADVANCED DIESEL COMBUSTION METHODOLOGIES AND TECHNOLOGIES
62
Flame temperature under 1800K and equivalence ratios higher than 2 (see Figure 2.4) can lead
to soot formation [80]. However, diesel diffusion flames can have complete combustion at
temperatures in the range of 1500 - 1600 K, where NOx formation is very low. Therefore, there
is a trend towards the development of low-temperature combustion strategies for diesel engines.
The initial premixed burn of classical diesel combustion is an example of this type of low-
temperature combustion, and if the mixture is lean enough, soot will not form during the low-
temperature combustion reaction. The heat release is controlled by the chemical reaction
kinetics of the mixture. This introduces new variables due to the factors that are not present in
traditional diffusion-burn diesel combustion, where combustion starts in a cetane number-based
time delay after the start of the fuel injection [87][88][90][91].
In Figure 2.11 [90] is shown the conceptual mechanism of the LTC. After the fuel injection, fuel
evaporation occurs as the hot air has entrained into the fuel jet and mixes. During the fuel
evaporation, chemistry becomes active and entrainment continues until ignition occurs. Once
ignition occurs, it is assumed that no more air mixes into the core of the fuel jet because the
oxygen is consumed in the outer layers of the jet. Consequently, no sooting and low NOx
combustion is realized at equivalence ratios below 2 and flame temperatures less than 1800 K.
In LTC, with the increase of EGR, the auto-ignition delay period is increased and fuel-air
premixing improved. Although liquid fuel penetrates much further into the chamber, the higher
energy released from premixed reactions contributes to the intense evaporation of liquid fuel
[88]. Since the fuel and air are very well mixed, the amount of oxygen around the fuel molecules
is sufficient to prevent pyrolysis and soot formation throughout the jet cross-section.

BACKROUND: ADVANCED DIESEL COMBUSTION METHODOLOGIES AND TECHNOLOGIES
63
Figure 2.11: Conceptual scheme of low-temperature combustion [90].
Sasaki et al. performed experiments on LTC combustion using a 2liter, four-cylinder inter-
cooled turbocharged engine with a compression ratio of 18.6. They show the changes in smoke
emission and flame images in LTC with the increase in EGR rate, which reduces the air fuel
ratio simultaneously [87]. The smoke level increases with the increase in EGR rate, exhibiting
luminous colours due to the conventional high combustion temperature. Further increase in EGR
rate establishes smoke-less combustion, exhibiting non-luminous flame at air fuel ratios lower
than 17.5 realizing a low temperature rich combustion.
Similar experiences were carried out by Bertoli et al. [91]. Figure 2.12 shows the flame
luminosity evolution carried out with experiments in a single cylinder optical diesel engine
operating both under conventional diesel combustion and under low temperature combustion.
2.2° ATDC 6.8° ATDC 11.3° ATDC 15.8° ATDC 20.3° ATDC 24.8° ATDC 29.3° ATDC 38.3° ATDC

BACKROUND: ADVANCED DIESEL COMBUSTION METHODOLOGIES AND TECHNOLOGIES
64
Figure 2.12: Combustion evolution under standard diesel conditions (a); Combustion evolution
under LTC conditions (b).
However, albeit a full realization of low-temperature combustion in a practical diesel engine is
difficult to realize, with the advanced injection systems (high-pressure multiple injections) and
EGR, the standard diesel combustion process is shifting in this direction.
2.3.1 Fuels
In paragraph 2.2.2 is explained why the HCCI combustion, and in particular the low temperature
heat release (LTHR) event, is mostly dominated by the chemical kinetics of the fuel/air ratio.
Furthermore, researches have shown that the use of conventional fuels (i.e. diesel) is not
completely HCCI-like fuels. Thus, to make effective HCCI combustion mode in practical engine
operation it could be necessary to reform or design the components, the composition and
chemical-physical properties of the fuels. The main parameters that characterize the fuels to
HCCI-like fuels are12
:
Cetane number: high CN fuels feature favourable flame ignitability, and therefore, they
extend the lean-burn area for HCCI combustion. Moreover, high CN has a significant
potential to promote cold starting, broaden the lean-burn limit, reduces cycle-to-cycle
variation and depress HC and CO emissions, but it has a negative effect on the rich-burn
limit. Octane number has an almost opposite effect to one of the cetane number.
Molecular structure: higher presence of paraffin’s enhance the LTHR characteristics, the
aromatics inhibit the LTHR effects, olefins and naphthenes have an intermediate
behaviour and could both enhance or inhibit the LTHR.
Oxygen content: this factor has a positive effect that broadens the load limit and
improves the local combustion efficiency and emissions.
12
Some of them are described in paragraph 1.2
2.2° ATDC 6.8° ATDC 11.3° ATDC 15.8° ATDC 20.3° ATDC 24.8° ATDC 29.3° ATDC 38.3° ATDC

BACKROUND: ADVANCED DIESEL COMBUSTION METHODOLOGIES AND TECHNOLOGIES
65
Latent heat of evaporation (LHE): a large LHE reduce the initial temperature at the
beginning of the compression stroke, delay the ignition timing, reduce the maximum
combustion temperature and prevent partially knocking combustion.
Boiling point and distillation: a lower boiling point and distillation temperature improves
the potential to form homogenous mixtures reducing the local fuel rich zones, then the
NOx and PM emissions. On the other hand, at low loads, the lower boiling point
promotes misfire or partial burn due to over-mixing increasing the HC and CO
emissions.
Considering such characteristics, it is possible to reconfigure the fuel properties and
compositions improving the adaptability and compatibility of different fuels for HCCI
combustion under a wide operating range [92].
One of the most effective ways to design the fuel characteristics is blend fuels with opposite
properties, e.g. adding to the high CN primary reference fuel (PRF) high octane number (ON)
fuels. The higher the ratio between ON and CN the higher is the ignition delay [18].
More details, in terms of performance and emissions, of the low CN blends prepared mixing
diesel and high octane number fuels are described in detail in Chapter 4
2.3.2 Technologies: injection system, compression ratio, piston bowl.
For high speed LD diesel engines, where high transient conditions occur frequently during
vehicle driving operations, to realize a well premixed charge, at least in the low/partial load
range, requires a very accurate control of the in-cylinder mixing process and consequently high
sophisticated and expensive technologies (like variable compression ratio, variable valve
actuation systems, injection rate shaping etc.). Therefore, engine technology improvements
represent an important pathway to control HCCI performance, emissions and operating limits.
As outlined before, there are several key factors that are fundamental to achieve diesel HCCI
combustion and in this section are introduced some technologies able to control them. Anyway,
there are reported only some of the technologies and in particular those that are investigated in
this work. The effects of the others are widely studied and reported in the literature.

BACKROUND: ADVANCED DIESEL COMBUSTION METHODOLOGIES AND TECHNOLOGIES
66
One of the dominant challenges of HCCI is the mixture formation (see paragraph 2.2.1). The
mixture can be prepared either internally (HCCI-DI) with an adequate injection phasing and
timing [49][50][51][52][53] than externally the cylinder (HCCI-PFI) [54][55][56].
The HCCI - PFI mixture is created in the intake system increasing the available time for
premixed fuel evaporation, and then the charge is ignited through piston compression. This
allowed to achieving higher engine loads than the in-cylinder mixture formation systems, while
preserving part of the HCCI benefits on emissions and without penalizing fuel efficiency.
The integration of the external mixture formation with a conventional in-cylinder fuel injection
has been also analysed. The dual combustion system could potentially overcome the limits of
low-load operations and allow for a gradual transition between the conventional DI mode at high
load and the HCCI external mixture formation at idle and low load [55][57][58][59][60].
Port fuel injection (HCCI - PFI) has been used in early investigations of diesel-fuelled HCCI by
Ryan et al. and Gray et al. [93][94] and Christensen et al. [95]. They investigated diesel-fuelled
HCCI - PFI as part of an investigation of variable compression ratios in controlling HCCI with
various fuel types. They found that smoke emissions were significant for some conditions, and
although NOx emissions were very low, they were not as low as those with gasoline. These
trends were thought to be due because the fuel injected in the intake manifold act as EGR
reducing the in-cylinder oxygen content. Moreover, the fuel injected directly inside the chamber
is affected by a poorer vaporization due to the higher temperature and pressure inside the
cylinder chamber created by the radicalic reaction of the injected PFI fuel. Thus, the oxygen
entrainment phenomenon is less effective creating a more inhomogeneous mixture [96] (these
aspects are discussed further in the experimental results).
Others found that premixing by port fuel injection has an excellent effect on NOx and soot
reduction with premixed gasoline and diesel fuels [61][62][63]. Using Gasoline as PFI fuel,
premixing level will drastically increase due to its excellent vaporization and mixing with air
[59][60]. On the other hand, diesel premixing showed the limited premixing effects in the
emission characteristics and operative range due to the excessively advanced auto-ignition of
premixed fuels [61]. In particular, diesel knocking due to uncontrolled self-ignition may occur
under high premixed fuel ratio at high loads. Thus the maximum amount of premixed fuel was
restricted by these knocking limits [64][65]. Moreover, due to the relatively higher boiling curve

BACKROUND: ADVANCED DIESEL COMBUSTION METHODOLOGIES AND TECHNOLOGIES
67
of diesel, problems in terms of intake manifold deposits and wall wetting can cause higher HC
emissions and possible dilution of lube oil, respectively.
In order to avoid knock, Ryan and Callahan demonstrated that knock in HCCI diesel combustion
can be prevented by reducing the compression ratio. When compression ratio is reduced, the
accompanying reduction in temperature rise of the end gas prevents explosive auto ignition from
occurring [93]. Peng et al. conducted experiments on a four-stroke, single cylinder, variable
compression ratio engine using n-heptane, which verified the effects of compression ratio on
HCCI combustion. The results showed that the possibility of knocking decreased, with the
knock limit pulled to lower air fuel ratio (AFR) region (richer mixture) when compression ratio
was reduced from 18:1 to 12:1 [34]. The maximum IMEP attainable on this engine thus
increased from 2.7 bar to 3.5 bar. Knock is prevented because, lowering the compression ratio,
the in-cylinder gas temperature at TDC is reduced. Moreover, the ignition delay (ID) is
prolonged allowing complete injection of all fuel prior to ignition, which is a prerequisite for
premixed combustion [97].
Therefore researchers have focused their attentions on potential control methods such as variable
compression ratio (VCR) [69][70][71] or variable valve actuation (VVA) to provide the
compensation required for changes in speed and load. For example, a variation of the Inlet
Valve Closing (IVC) can change the effective compression ratio, which in turn will change the
combustion phasing realizing more control in terms of combustion efficiency but also in terms
of in-cylinder temperature[66][67][68].
The piston bowl geometry is another parameter that can be adapted to enable the development of
HCCI combustion. Researcher demonstrated that in the case of early direct injection, a shallow
dish type can reduce the formation of fuel wall-film on the surface of the piston bowl wall
leading to lesser soot, HC and CO emissions compared to a standard re-entrant bowl[97]. The
BUMP ring combustion bowl combined with multi-pulse fuel injection has been demonstrated
to work successfully for HCCI diesel combustion [98].

BACKROUND: ADVANCED DIESEL COMBUSTION METHODOLOGIES AND TECHNOLOGIES
68
2.3.3 Strategies: injection timing and phasing, EGR
As mentioned before, diesel HCCI combustion is difficult to prepare because of the lower
volatility, higher viscosity and lower resistance to auto-ignition of diesel fuel. Therefore, as
mentioned in the previous paragraph, port fuel injection can be used to realize a more premixed
charge leading however to more complex design and sometimes to lesser advantages in terms of
efficiencies and soot reduction (paragraph 2.3.2).
To overcome the disadvantages of HCCI-PFI, early direct injection (HCCI-DI) strategies can be
used. The higher in-cylinder temperatures and densities can help to vaporize the diesel fuel and
promote mixing. This allows cooler intake temperatures, reducing the propensity for early
ignition. Moreover, only the conventional fuelling system is required for both HCCI and
conventional diesel operation. As a drawback, early DI for HCCI produce piston wall and
cylinder line wetting due to over-penetration of the fuel. Further, controlling combustion
phasing is still a critical issue because injection timing does not provide an effective means of
directly controlling combustion phasing as in conventional diesel combustion. Avoid fuel/wall
interactions is crucial for achieving high fuel efficiency, reducing HC and PM emissions, and
preventing oil dilution. Fuel impinging on the surfaces of the combustion chamber has been
proven disadvantageous to HC emissions even for moderately volatile fuels such as gasoline
[18].
An interesting diagram relatively to the different injection strategies is reported in Figure
2.13[12]. The diagram illustrates the relationships between injection timing and combustion
event for advanced diesel combustion strategies. Different strategies are applied with the
objective to reduce the combustion temperature. In particular, HCCI, UNIBUS, and PREDIC are
realized by early fuel injection (early HCCI-DI). As a result, the heat release shows two-stage
combustion typical of the homogeneous charge.
More retarded injection event are applied in the case of MK, PCCI and LTC. The injection is
phased near TDC and in general, high EGR rates are used. In particular, MK combustion
involves late fuel injection in high EGR rate environment and the low temperature combustion
takes place in the expansion stroke. LTC strategy features intake-air cooling and high EGR rate
to prolong the ignition delay time. Consequently, the duration between the end of injection and

BACKROUND: ADVANCED DIESEL COMBUSTION METHODOLOGIES AND TECHNOLOGIES
69
the start of combustion is shorter than one in the first group. Generally, they also use high swirl
and high injection pressures levels to complete the formation of partially premixed mixtures
within this narrow duration. The main differences that characterize the two types of strategies
are related to a longer induction period and the two-stage heat release in the case of early HCCI-
DI.
Figure 2.13: Relationship between injection timing and combustion event in advanced and
conventional diesel combustion [12].
Concerning the EGR, some effects have been already discussed in paragraph 2.2.4. However,
EGR in a compression ignition engine it is generally used to depress the NOx formation whereas
in the advanced combustion concepts, EGR could be an alternative method to control the
ignition timing and burn rate. EGR has several effects on the combustion. In particular, EGR
has: a preheating effect on the inlet charge temperature; a dilution effect with a substantial
reduction of the oxygen concentration; a heat capacity effect, increasing the heat capacity of the
air, fuel and EGR mixture, leading to a reduction of gas temperature at the end of compression
stroke; a chemical effect, inasmuch there persist more radicals that affect the ignition timing,
moreover the residual gases (CO, CO2, NO, H2O, etc.) take part in the chemical reactions and
could lead to some effects on the reaction rates. Results have shown that in the case of HCCI
combustion mode, the EGR retard the cool and the high flame heat release. Moreover, with
increasing the EGR rate, the combustion duration is prolonged due to the lower combustion
temperature; this effect is emphasized for high octane number fuels. Besides, results show that

BACKROUND: ADVANCED DIESEL COMBUSTION METHODOLOGIES AND TECHNOLOGIES
70
the EGR tolerability seems to be higher for high cetane number fuel but limited at 45% for CN
about 56[100].
In conclusions, in order to give a contribution to reach the HCCI challenges, various strategies
that may also move away from truly homogeneous mixtures, including PCCI combustion, where
assessed. In particular, in chapter 4 are assessed different kind of fuels, in chapter then a port
fuel injection strategy was employed in order to assess their effect of the combustion
characteristics.
In chapter 3 is described the experimental setup whereas in chapter and are discussed the
experimental

EXPERIMENTAL CHARACTERIZATIONSETUP
71
3 EXPERIMENTAL SETUP
This section describes the experimental setup (engine, emission test bench, etc.) used to conduct
the research in the field of advanced diesel combustion. In order to acquire insight into the
combustion performances, a very useful instrument is a single-cylinder engine characterised by
a simple inter-changeability between all components and an independent control of each
operating parameter without limiting the others. Vice versa, in the case of multi-cylinder
engines, the presence of all auxiliary systems (injection pump, alternator etc.), impose the
interdependence among the operating parameters.
Therefore, the experimental activities were conducted on a prototype single cylinder research
engine developed at Istituto Motori – CNR. In Figure 3.1 is reported a perspective view of the
experimental setup. In the front view shows the single cylinder engine and the auxiliary systems
of the engine. Moreover, in the rear view is depicted the panel control of the electronic units.
Figure 3.1: Perspective view of the test bench and the single cylinder research engine

EXPERIMENTAL CHARACTERIZATIONSETUP
72
3.1 Engine setup
The engine has a modern combustion system design derived from a reference Euro V compliant
four cylinders engine. The engine configuration corresponds to the FIAT Multijet 16V
architecture, which represents the state of the art of light duty diesel engine technology. In fact,
the cylinder head is derived from production series and is a 4-cylinder Fiat JTDM 16V; but it
has been modified to work in single-cylinder mode. Connecting rod and piston are derived from
production series. The main characteristics are reported in Table 3.1.
Bore [mm] 82,0
Stroke [mm] 90,0
Compression ratio 16,5
Displacement [cm3] 475
Valve number 4
Injection system Common rail 3rd
generation
Injector Centered 7 holes microsac
Table 3.1: Main engine geometrical characteristics
The engine is equipped with a fully programmable ECU that permits the operator to modify the
fuelling strategy, swirl ratio, backpressure, EGR level, etc. Moreover, the engine was also
equipped with a port fuel injector designed and installed specifically to conduct the experiments
described in detail in the Chapter 5. The engine system scheme is laid out in Figure 3.2

EXPERIMENTAL CHARACTERIZATIONSETUP
73
Figure 3.2: Test bench scheme
3.2 Auxiliary systems
The engine is equipped with the following auxiliary systems:
1. Air supply system(Intake, exhaust, EGR)
2. Fuel supply system
3. Cooling system
4. Lubricating system
1. The intake pressure is generated by an external supercharge system connected with the intake
line of the engine. Moreover, as depicted in Figure 3.2, an air electrical heater is mounted in the
intake line before the manifold. This permits to control the air temperature and pressure in a
wide range of temperature values (10÷100°C) and boost pressure values (0÷4.5 bar).

EXPERIMENTAL CHARACTERIZATIONSETUP
74
The exhaust line, instead, has been realized in order to simulate the presence of the turbocharger.
Therefore a damping volume and, downstream, a throttle valve have been placed. Throttling the
valve, by means of the ECU, it is possible to regulate the engine backpressure. The cooled EGR
line has been designed to ensure a fine regulation of exhaust gas temperature at the inlet
manifold through a small-size EGR cooler. An external water circuit, automatically controlled,
in order to regulate EGR temperature independently from the engine water one, feeds the cooler
(see Figure 3.2).
2. A low-pressure circuit (tank, balance meter, filter, low-pressure pump, fuel cooler) and a
high-pressure 3th generation common rail system (high-pressure injection pump, rail,
connection pipe, injector, etc.) constitute the fuel supply system. In order to regulate the rail
pressure independently by the engine speed, the injection pump is coupled with an electrical
motor. The maximum injection pressure is about 1600 bar and the fuel injector is a “microsac” 7
holes injector. The fuel temperature is automatically controlled by a water-fuel cooler.
3. The cooling system has been realized by an external system including an electrical pump,
water cooler, electrical heater and by two, different circuits one for cylinder and the other for the
engine head. This approach permits the maximum flexibility in terms of cooling temperature
during the engine operations.
4. The lubrication system is ensured by an external circuit including electrical heated tank,
pump, filter, oil cooler and by four different circuits to supply cylinder head, crankcase,
crankshaft pin, piston and cylinder wall. Therefore, the oil temperature and the pressure can be
controlled for each subsystem.
3.3 Measurement setup
The instrumentation of the single-cylinder research engine is complicated because the several
sub-systems including lubricating, cooling and fuel systems are externally established and
controlled (see previous paragraph). Therefore, temperature, pressure sensors and emission

EXPERIMENTAL CHARACTERIZATIONSETUP
75
probes have been placed in each critical point of the whole laboratory engine plant in order to
measure all the parameters that control the process. In particular, the most important instruments
cover the following subheadings:
1. Cylinder pressure measurement and analysis: The cylinder pressure is carried out with a
piezo-quartz transducer (Kistler 6121 A1) placed in the glow-plug hole. A shaft optical
encoder with a maximum angular resolution of 0.1 crank angle degree (AVL 365C) is used
for the measurement of the engine speed (rpm) and for the synchronization between
crankshaft angle position and the acquired in-cylinder pressure. The signals are amplified
acquired and elaborated by a DAQ system (AVL IndiMicro).
2. Fuel flow and injection pressure measurements: The fuel consumption is performed by
means of a gravimetric balance (AVL 733). A separate fuel supply line has been
implemented for the port fuel injection in order to permit the injection of different kind of
fuels respect to the direct injection. The measurement of the fuel injection pressure and
temperature are obtained by a piezo-resistive transducer (Kistler A4067 A2000) mounted
into the connecting pipe between rail and injector, while the energizing current that drives
the injector is acquired by a current sensor (MicroSwitch 9617).
3. Intake, exhaust and EGR systems: The flows in a single-cylinder configuration (intake,
exhaust) are highly pulsating and require special setup and instrumentation considerations to
provide reliable and accurate measurements. The intake airflow measurement is performed
by a volumetric air flow meter. The characterization of air condition in the intake manifold,
in terms of dynamic pressure and temperature values, is performed by a piezo-resistive
absolute pressure transducer for instantaneous boost pressure measurement (Kulite ETL193-
190M) and by a PT100. A gas-sampling probe has been also installed to measure CO2 and
O2 inlet concentrations in order to quantify the EGR rate in terms of CO2 ratio. In the
exhaust line, temperature and pressure are measured, immediately downstream the exhaust
valves, by a K-type thermocouple and an instantaneous cooled piezo-resistive absolute
pressure transducer (Kulite EWCT-250/312M).
4. Lubricating and cooling system: The pressures and temperatures of the water cooling system
and of the lubricating system are measured in order to control them in real time and control
them by means of PID controllers.

EXPERIMENTAL CHARACTERIZATIONSETUP
76
5. Exhaust emission measurement and analysis: The gas sampling probes have been installed
in the intake and in the exhaust lines in order to measure the EGR rate and the engine out
emissions respectively. In particular, in the intake manifold are measured the O2 and CO2
concentration whereas in the exhaust line are measured the HC, CO, NOx and PM (in some
tests are measured also the nanoparticles) concentrations. In Table 3.2 are reported the
devices used for the measurements of the intake and the exhaust gases.
Emissions Working principles Model
Carbon monoxide (CO) Non dispersive infrared analyser(NDIR) Rosemount 880A
Carbon dioxide (CO2) Non dispersive infrared analyser(NDIR) Hartmann Braun URAS10E
Nitrogen oxides (NO, NO2) Chemiluminescence detector Ecophysics CLD700
Unburned hydrocarbons (UHC) Flame ionization detector(FID) ABB AO2020
Oxygen (O2) Paramagnetic detection analyser Hartmann Braun MAGNOS 6G
Particulate matter(PM) Filter paper method AVL 415S
Nanoparticles(#PM) Differential Mobility Sizer(DMS) Cambustion DMS500
Table 3.2: Emission measurement instruments and their working principles.
The gaseous emission measurement set up is equipped with a sample conditioning system. The
purpose of the emission conditioning system is to provide a clear and dry exhaust stream to the
analysers. The conditioning system removes the particulate matter (PM) and water content from
the exhaust stream before it reaches the emission analysers. The raw exhaust gas is transported
from the sampling location to the conditioning unit in a heated sampling line in order to prevent
any water/UHC condensation in the line. The sample gas are further heated (180 - 200°C) before
they reach the UHC, NOx analysers. Besides, the sample passes through the refrigerated unit
where any suspended water droplets are removed before they reach the CO, CO2 and O2
analysers. For the smoke emissions, no separate conditioning unit is typically used. The smoke
meter is normally a self-contained unit and does not require any additional conditioning system.
As explained in Chapter 0, greater attention is focused by the legislation on the emitted
nanoparticles (see Figure 1.5). For this reason, it is worth to give some details of the instrument
used to measure them. The other devices are well known and more details can be found in the
literature.

EXPERIMENTAL CHARACTERIZATIONSETUP
77
In this research, some comparisons have been made between different fuels and strategies in
order to evaluate their effect on the number and size of the nanoparticles.
The sizing and the counting classification of the particles were performed by a Differential
Mobility Sizer (DMS500) which measurement principle is based on the deflection of electrically
charged particles combined with electrical counting. Particles enter the DMS500 via a cyclone,
which removes particles bigger than the maximum measurable particle size of the instrument
(1000nm). Then the sample gas passes through a corona discharge charger then the classifier
column (Figure 3.3). Particles are electrically charged by collision with air ions, in a process
known as diffusion charging. The charged particles flow within a particle-free sheath flow,
which is a uniform, cylindrical laminar column of air, designed to carry the charged particles in
a predictable manner. The particles are then deflected towards grounded electrometer rings by
their repulsion from a central high voltage rod. In particular, they are subjected to a radial
electric field from a central high voltage electrode, which repels the particles towards the
electrometer rings. These measure the electrical current from the arrival of charged particles,
and thus their mobility.
Figure 3.3: Scheme of the DMS500 classifier column and charger
Particles are detected at different points throughout the column, depending upon their
aerodynamic drag/charge ratio. Particles which are of low electrical mobility are repelled to the
outside slower than highly mobile particles, and hence will travel further down the column
before impinging upon one of a 22 electrometer rings along the length of the column. The
particles yield their charge to the electrometer amplifiers and the resulting currents are processed

EXPERIMENTAL CHARACTERIZATIONSETUP
78
in real time by the instrument’s user-interface providing spectral data and other desired
parameters. The DMS500 has a fully integrated two-stage dilution and sampling system, this
provides primary dilution at the sampling point to avoid condensation and agglomeration issues,
and a high ratio in the secondary stage to allow sampling from a very wide range of aerosol
concentrations. More details can be found in [101].

EXPERIMENTAL RESULTS AND DISCUSSION
79
4 EXPERIMENTAL CHARACTERIZATION OF LOW
CETANE NUMBER OXY-FUELS FOR PCCI
COMBUSTION
4.1 Introduction
As outlined in Chapter 2, one of the biggest drawbacks of diesel engines is the so-called diesel
dilemma. This refers to the trade-off between NOx and PM, i.e. when attempting to reduce NOx
by reducing the combustion temperature, PM emissions increase (e.g. due to poorer oxidation)
and vice versa. A lot of research is being conducted into the field of PCCI combustion concepts
in order to resolve the diesel dilemma.
In the field of the combustion research applied to the diesel engines, it is known that with
conventional diesel fuel, PCCI combustion is difficult to realize due to the relatively high fuel
reactivity, which limits the mixing time. Conversely, less reactive, low CN fuels appear to be
more tailored to realize PCCI combustion. On the other hand, the main hurdle for PCCI
combustion is to extend the operating range to higher loads. In fact, high load PCCI is in general
limited by an excessive combustion pressure rise rate. Therefore, more suitable fuels in terms of
mixture formation and knock prevention should be explored. In this framework a lot of research
and results were carried out in recent past years blending gasoline, and low CN fuels in general,
in compression ignition engines ([104]-[107]). As an example, Kalghatgi et al. [104], and Han et
al. [105], have demonstrated the positive effect of high octane number gasoline on soot and
NOx reduction in a light duty (LD) compression ignition engine. Among the numerous available
papers on the use of low CN fuels in diesel engines for PCCI application, a recent valuable work
performed by Kalghatgi et al. [120], highlights the influence of the volatile fuel fraction with
high resistance to auto-ignition on the unburned emissions in PCCI conditions and due to the
over-mixing phenomena, while for fuels with CN<30 where completely premixed conditions
can be reached, volatility and composition become secondary factors on the combustion process.

EXPERIMENTAL RESULTS AND DISCUSSION
80
In this framework, from the fuel side, to limit the over-mixing phenomena for unburned
emission control for total premixed air-fuel charges and, simultaneously, to limit smoke
emissions when over-rich mixing occurs, low CN oxygenated fuels with less volatility than
gasoline could be useful to design tailored blended fuels for PCCI engines. Indeed, it is well
known that oxygenated fuels have an intrinsic capability to reduce soot emissions,
independently from the engine technology and the combustion mode (e.g. diffusive versus
premixed).
Therefore, the adoption of low CN fuels containing intra-molecular oxygen and with boiling
temperature range close to the diesel fuel could have potential to improve PCCI performance
both at low as at medium/high load conditions [102]. On the other hand, although there are
many papers available, which provide valuable information on gasoline/diesel blends ([104]-
[109]), there is little information on the use of low CN oxy-fuels in diesel blends [110]. This
makes the use of low CN oxygen fuels an interesting route to improve the applicability of PCCI
combustion in diesel engines.
The goal is to acquire insight into the influence of cetane number (CN) and fuel oxygen on
overall engine performance in PCCI combustion mode. Accordingly, this chapter focuses on
providing an overview of the low cetane number oxy-fuels capabilities to improve both diesel
and PCCI combustion.
Accordingly, in this study, a commercial, premium quality gasoline and a cyclic oxygenate (e.g.
cyclohexanone) were selected as low CN fuels to blend with diesel fuel. The oxygenate in
question, cyclohexanone (C6H10O), is a low reactive cyclic oxygenate (cyclohexanone –
CYCLOX) that can be produced from lignin (e.g. via depolymerisation) and thus has the
potential to be renewable [102].
To assess the impact of cyclohexanone on diesel combustion and pollutant emissions, a
parametric test program was carried out in a joint project between Istituto Motori (Naples) and
the University of Technology Eindhoven.
The impact of the blends on the engine combustion has been assessed, i.e. in terms of speed and
load range and using conventional engine control strategies such as EGR, injection pressures,
splitted injection, etc. To highlight the effects of the oxygen content presence in the fuel blends,
were prepared and blends with same CNs and different oxygen content (gasoline/diesel and

EXPERIMENTAL RESULTS AND DISCUSSION
81
CYCLOX/diesel). Since gasoline and CYCLOX have different boiling temperature
characteristics, the fuel oxygen content effect on combustion cannot be completely isolated from
the volatility effect. However, these factors do not affect the investigation mainly aimed to the
evaluation of the CYCLOX combustion characteristics. It was assessed that low CN oxy-fuels
could act as enablers for PCCI combustion, outlining that the low CN and the oxygen content
works together to control the smoke emissions. The research was conducted in a research LD
single cylinder diesel engine described in Chapter 3.
4.2 Fuels
As stated before, the aim of the study was to characterize the combustion performance of low
CN fuels in blend with diesel. Consequently, a commercial, high-quality diesel fuel was chosen
as reference fuel, while a premium quality gasoline was chosen as the most common fuel low
CN fuel and CYCLOX as low CN oxygenate fuel.
Diesel, gasoline and cyclohexanone were blended into five mixtures, with varying cetane
number or oxygen content. The physical and chemical characteristics of the used fuels are
reported in Table 6.1. Part of this table is reported in Table 4.1.

EXPERIMENTAL RESULTS AND DISCUSSION
82
Fuel properties Commercial
Diesel
Commercial
gasoline Cyclohexanone
Density @ 15°C
[kg/m³] 850 720 950
Viscosity @ 40°C
[mm²/s] 3,1 0.5-0.75 4.9
Estimated Cetane
Number ~56 ~10 ~10
Lower Heating Value
[MJ/kg] 42,5 43 35
Distillation [°C]
IBP - - 155
10% vol. 222 45 -
50% vol. 276 105 -
90% vol. 329 155 -
95% vol. 345 - -
FBP 358 190 155
Oxygen
[molar%]
0 0 16.3
Table 4.1: Fuel properties
It is worth to note that gasoline and CYCLOX respect to gasoline have a much lower CN (~10).
Moreover, the gasoline and diesel are not pure fuels but mixtures of paraffinic and olefinic
compounds whereas the CYCLOX is a single component fuel (such as n-heptane and ethanol-
see Chapter 5). Accordingly, the distillation curves of the three neat fuels listed in Table 4.1 are
plotted Figure 4.1. The single component fuels (CYCLOX) are characterized by a boiling point
rather than a boiling trajectory, in fact, one of the advantages to operate with pure fuels is to
have well defined fuel characteristics.

EXPERIMENTAL RESULTS AND DISCUSSION
83
Figure 4.1: Boiling curves of the neat fuels
The estimation of the CN for the blends was computed using Kay’s mixing rule [111], which
dictates that CN is a molar average of the compounds in the mixture. In particular:
∑
Where, xi and CNi represent the molar fraction and the CN of the ith-fuel while n represent the
maximum number of fuels used for the blend preparation.
The blends were formulated such that an equal step size in CN was achieved, namely CN 20, 38
and 56 (see Table 4.2). The CN20 and CN38 blends were prepared for both diesel-gasoline and
diesel-CYCLOX, in order to discern the effects between CYCLOX and gasoline.

EXPERIMENTAL RESULTS AND DISCUSSION
84
Blend Properties Blend1 Blend2 Blend3 Blend4 Blend5
Fuels Diesel Diesel plus
Gasoline
Gasoline plus
Diesel
Diesel plus
CYCLOX
CYCLOX plus
Diesel
Blend name D DG GD DC CD
Mixing ratio [% vol.] 100 69/31 29/71 77/23 38/62
Estimated CN 56 38 20 38 20
Lower heating value [MJ/kg] 42.5 42.6 42.8 40.7 37.7
Aromatic content [wt.%] 21 24.7 29.5 16.1 8
Table 4.2: Blend properties
Before the presentation of the results, a disclaimer is added pertaining uncertainties regarding
the blends. The volatility and the aromatics of the CN20 (Blend 3 and 5) and CN38 (Blend 2 and
4) blends are not equal and could partially have affected the results.
The potential impact of volatility is that higher volatility fuels (e.g. gasoline) can evaporate from
hot engines surfaces much better than lower volatility fuels (e.g. CyclOx), which could help
prevent UHC emissions.
A second uncertainly is related to CN. It is stressed that for the estimation of CN utilizing a
linear Kay’s mixing rule, there is an unknown uncertainty, particularly in the low, gasoline-like,
CN regime. This is explained by the fact that in the diesel-like CN regime (CN>30) the volatility
and the aromatics are less effective on the auto-ignition tendency, thus on the ignition delay,
whereas, in the gasoline-like regime (CN<30), the aromatic content and the volatility play an
important rule [120]. In particular, the auto-ignition (and therefore the ID) behaviour depends
strongly on the chemical structure and behave very differently compared to aromatics as
operating pressure and temperatures changes, that explain the possible CN differences.
Therefore, for the gasoline/diesel with CN20, due to its higher aromatics and volatility
compared to the diesel/CYCLOX, the estimation of the CN is less accurate.
This suspicion is supported by the difference in ID for the two CN20 blends, e.g. see Figure 4.5.

EXPERIMENTAL RESULTS AND DISCUSSION
85
4.3 Test points and procedures
The tests procedure has been performed in order to characterize and evaluate the fuel effects in
terms of performance and emissions either in PCCI combustion mode either in conventional
combustion mode.
The chosen reference test points for this campaign are reported in detail in Table 4.3. They were
chosen because they are the most representative operating points of the real engine of equal unit
displacement during the UDC sub-cycle of the NEDC homologation cycle. To confirm this,
Figure 3 shows the position of the selected points in the speed-load plot of a vehicle with 1400
kg of inertial mass, equipped with the corresponding four-cylinder engine over the UDC+EUDC
(NEDC) cycle. Moreover, the MBF50% of the reference points is such that the combustion
phase maximize the thermodynamic efficiency.
Test point13
RPM [1/min]
IMEP [bar]
BMEP [bar]
MBF50% [CA_aTDC]
1500x3(2) 1500 3.2 2 12
1500x7(5) 1500 6.9 5 15
2000x3(2) 2000 3.2 2 12
2000x7(5) 2000 6.9 5 15
Table 4.3: Reference values of the test points; the BMEP value refers to the real four-cylinder
engine.
13
The values inside the parenthesis are referred to the BMEP value. The graphs that follows, sometimes refer to
IMEP other times to BMEP (i.e. 1500x2 or 1500x3).

EXPERIMENTAL RESULTS AND DISCUSSION
86
Figure 4.2: Position of the stationary operating points in the speed-load plot of a vehicle with 1400
kg of inertial mass, equipped with the multi-cylinder engine over the UDC+EUDC (NEDC) cycle.
The aim is to acquire insight into the influence of fuel oxygen and CN on the overall
performance of a LD DI CI engine in both PCCI and conventional CI mode. The PCCI tests
were carried out without the use of a pilot injection or EGR, in order to isolate the influence of
the different fuel characteristics.
The five blends were prepared to have different characteristics pertaining to fuel oxygen content
and CN. This permit to separate the CN and the oxygen effect on the performance and
emissions:
varying CN at a constant fuel oxygen content
varying fuel oxygen content at a constant CN
Besides, in order to have a complete screening of the CN and oxygen impact on the combustion
characteristics, the different blends has been subjected to an extensive experimental procedure
varying the operating conditions:
SOI sweep in PCCI combustion mode.
EGR sweep with conventional diesel combustion
PCCI application with low CN
-4
-2
0
2
4
6
8
10
12
500 1000 1500 2000 2500 3000
Engine speed [rpm]
BM
EP
[bar]

EXPERIMENTAL RESULTS AND DISCUSSION
87
The procedures are well explained in the corresponding paragraph where also the results are
discussed.
Moreover, in the literature, many times when PCCI combustions are performed, any limits are
considered, for example, the fuel consumption increase or the combustion noise level or the
COV, etc., that most of times limit the practical application of this combustion mode. Therefore,
during the test were also considered and imposed the operative limits reported in Table 4.4.
Parameter Prefixed limits
ISFC ≤5% of ISFC increase with respect to the EURO 5 standards
Cylinder pressure
rise rate
≤80 bar/ms of maximum pressure rise rate for each work point
to preserve current comfort standards
Smoke ≤1.5 FSN of exhaust smoke as estimated limit in order
to avoid excessive DPF system loading
COV ≤3.5 - 4%
Table 4.4: Prefixed operating limits.
4.4 SOI sweep in PCCI combustion mode
4.4.1 Experimental procedure
In this test campaign, for every blend (see Table 4.2), the tests were executed in two of the four
mentioned workpoints, reported in Table 4.3: namely 1500x3.2 and 2000x6.9. 1500 and 2000
are the rotations per minute while 3.2 and 6.9 represent the values for IMEP. The workpoint
1500x3.2 relates to the workpoint 1500x2 for the corresponding four-cylinder engine where 5
indicates the BMEP. The same is for the case 2000x6.9 related to the 2000x5. Furthermore, an
injection strategy of one shot per cycle was chosen
Starting from these points, the SOI was varied, while all the other parameters were kept
constant. The SOI was delayed until the combustion became unstable and the COV reached its
fixed limit (~ 4%). This point was defined as the upper limit. After this, the SOI was advanced

EXPERIMENTAL RESULTS AND DISCUSSION
88
with a step size of 10 °CA until the defined limit (80 bar/ms) for the pressure gradient was
reached (see Table 4.4).
4.4.2 Test results and discussions
In this subsection, the following analyses are performed:
Reference point analysis with fixed IMEP and MBF50%: This analysis is useful to study
the effect of fuel chemistry at constant value of thermodynamic efficiency.
Engine performance trend analysis varying start of injection (SOI) at constant injected
energy flow: This analysis is useful to evaluate the operating range of the different
blends and to compare the trends.
Reference point analysis with fixed IMEP and MBF50%
1500rpm@IMEP=3.2bar and MBF50%= 12° aTDC
In Figure 4.3, the pressure traces and the rate of heat release (RoHR) are reported for all blends
with a fixed MBF50%. For the various blends, differences in SOI are observed, as could be
expected for blends with varying CN. The blends with a lower CN require more advanced SOI
values to obtain the same MBF50%.
The differences in terms of ignition delay (ID), calculated as the difference between SOI and
MBF10%, are reported in Figure 4.5. In this figure, the differences in ID between the blends
with the same estimated CN are evident.
As stated before, these can be attributed to uncertainties pertaining the estimation of CN, mainly
for the CN20 blends. In fact, CN20 blend lies in the gasoline auto-ignition range (CN<30) where
the linear estimation of CN, through the Kay’s linear mixing rule, is less accurate. Conversely,
for the CN38 blends (diesel auto-ignition range: CN> 30) the CN (i.e. ID) is well predicted
(paragraph 4.2) [120].

EXPERIMENTAL RESULTS AND DISCUSSION
89
Therefore, the blends with CN38 show a quite similar pressure traces and SOI values, but with
the SOI more advanced compared to the CN56 reference fuel.
For the CN20 blends, the differences become more evident and there are differences between
the two CN20 blends. This is due to the high percentage of low CN fuels (gasoline or CyclOx)
with diesel, which has a stronger effect on the combustion characteristics. Moreover, the low
CN blends are more volatile compared to the reference fuel (Figure 4.1). Nevertheless, in [120],
where an extensive study on the volatility effect has been performed, is affirmed that volatility
has a lower influence, compared to the auto-ignition quality, on the emission performance.
The compression pressure peaks (Figure 4.3, on the left) are lower and have different shapes,
which is due to the differences in terms of heat of evaporation, higher for gasoline and
cyclohexanone compared to diesel. In addition, the RoHR (Figure 4.3, on the right) is clearly
influenced by the CN and volatility, which lead to better mixing and over-lean areas far away
from the injector. This assumption is supported by the emissions reported in Figure 4.4, where
higher UHC and CO emissions are shown for blends 3 (GD) and 5 (DG); in particular for the
gasoline blend (blend 3; CN20) that support the hypothesis of a certain inaccuracy in the
determination of the CN mainly for the blends CN20. Furthermore, also the fuel conversion
efficiency appears to be lower for blend 3.
The NOx levels are lower for the low CN fuels (Figure 4.4), which is attributed to the lower
temperature reached by leaner conditions in the combustion chamber. This is supported by the
RoHR, which shows longer combustion duration and lower pressure rise rates. In fact, the
longer ignition delay increases the level of premixing in such a way that the local air/fuel ratio
approaches the global lean air/fuel ratio. Under such conditions, the local temperature decreases
and therefore NOx too (Kamimoto and Bae, 1988) [80][120][121].
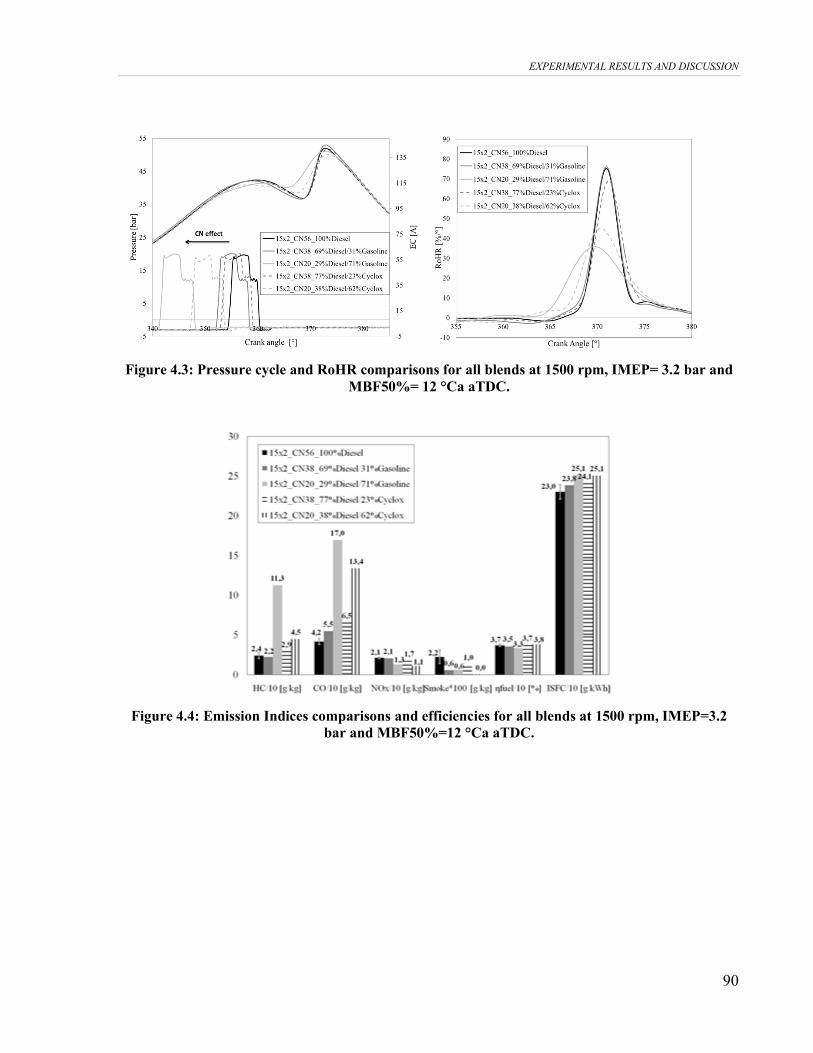
EXPERIMENTAL RESULTS AND DISCUSSION
90
Figure 4.3: Pressure cycle and RoHR comparisons for all blends at 1500 rpm, IMEP= 3.2 bar and
MBF50%= 12 °Ca aTDC.
Figure 4.4: Emission Indices comparisons and efficiencies for all blends at 1500 rpm, IMEP=3.2
bar and MBF50%=12 °Ca aTDC.

EXPERIMENTAL RESULTS AND DISCUSSION
91
Figure 4.5: Ignition delay versus CN for blends at 1500 rpm, IMEP= 3.2 bar and MBF50%=12 °Ca
aTDC.
The effect of the presence of oxygen in the diesel/ CyclOx blends is evaluated comparing
oxygenated and non-oxygenated blends with the same CN and benchmarking these fuels to the
reference fuel (diesel CN56). In Figure 4.6, the emission indices and efficiencies are plotted for
the CN20 and CN38 blends in the reference test point.
For low oxygen contents (Figure 4.6 on the left), e.g. diesel/ CyclOx at CN38, the oxygen effect
cannot be discerned from the other effects. For high oxygen contents, i.e. comparing
diesel/CyclOx with diesel/gasoline blend at CN20 (Figure 4.6 on the right), the oxygen effect on
smoke and UHC emissions becomes more evident.
Instead, the CN effect can be evaluated by comparing the graphs in Figure 4.6, on the left
(CN38) and on the right (CN20). The lower CN, which is thought to induce over-lean areas
because of ample mixing time (mainly for diesel/gasoline) tend to increase the HC source
mechanisms (e.g. fuel outside the piston bowl or in the cylinder crevices, fuel wall wetting).
Moreover, the CO formation for CN20 increases much more than for CN38. This is due to the
more diluted charge inside the cylinder that lower the temperature then the conversion rate from
CO to CO2. For CN38, the CO emission sources are limited because the main actor is still the
diesel fuel (Figure 4.6 on the left: CN38).

EXPERIMENTAL RESULTS AND DISCUSSION
92
The fuel efficiencies for CyclOx blends are inside the test repeatability of the reference fuel,
whereas the gasoline blends show a small penalty.
Note that, in the case of CyclOx blends, due to a slightly lower LHV, the fuel efficiency is about
the same as the reference fuel but with a higher ISFC.
Figure 4.6: Emission Indices and efficiencies comparisons at 1500 rpm, IMEP= 3.2 bar and
MBF50%= 12 °Ca aTDC for diesel and CN38 blends (left) and CN20 blends (right).
2000rpm@IMEP=6.9bar and MBF50%= 15° aTDC
Analogous considerations are suitable for higher speeds and loads. In Figure 4.7, the pressure
and the RoHR traces are reported for all the blends for fixed MBF50%. The same trends for SOI
variation are observed, i.e. blends with lower CN need more advanced SOI at constant
MBF50%. The differences in terms of ID are shown in Figure 4.9.
For the pressure and RoHR traces, the CN20 blends, in particular the diesel/gasoline, show a
significant difference for the first pressure peak. This is due to the higher heat of vaporization of
the blends.
Also for higher loads, although to a lesser extent, it is possible to attribute the over-lean
phenomenon thus the higher HC and CO emissions to the increased mixing time and to the
higher volatility mainly for decreasing CN.
However, for the diesel/ CyclOx blends, smaller differences in the pressure and RoHR are
reflected in the emission indices, which are more or less similar to those from the reference fuel.

EXPERIMENTAL RESULTS AND DISCUSSION
93
The improved characteristics of these blends are attributable to the lower volatility and the
reduced mixing time (see SOI) compared to the diesel/gasoline blends. Moreover, also for
higher loads, the efficiencies of diesel/CyclOx are comparable to that of the reference fuel
(Figure 4.8).
Figure 4.7: Pressure cycle and EC comparison (left) and RoHR (right) comparisons for all blends
at 2000rpm, IMEP=6.9bar and MBF50%=15° aTDC.
Figure 4.8: Emission Indices and efficiencies comparisons for all blends at 2000rpm, IMEP=6.9bar
and MBF50%=15°aTDC.

EXPERIMENTAL RESULTS AND DISCUSSION
94
Figure 4.9: Ignition delay versus CN for the blends at 2000rpm, IMEP=6.9 and MBF50%=15°.
Referring to the CN impact, it is possible to state again that also for higher loads there are
evidences of both higher volatility and mixing time of the diesel/gasoline blends compared to
the others. Therefore, HC emissions increases due to the over-mixing and CO emissions due to
the lower combustion flame temperature. The smoke emissions are reduced by the higher level
of premixing for all the blends with respect to the reference fuel, but the best results are obtained
for the diesel/cyclohexanone blends thanks to the oxygen presence, which enables to reduce the
emitted smoke.
Due to the higher premixed conditions for the blends, the higher NOx emissions compared to
diesel were not expected. They are due to the higher in-cylinder temperatures for such operating
conditions. Further investigations are necessary to have a detail explanation of this trend.

EXPERIMENTAL RESULTS AND DISCUSSION
95
Engine performance trend analysis by varying SOI at constant injected energy flow
1500 rpm; IMEP= 3.2 bar
In Figure 4.10, starting from the reference point (IMEP=3.2bar and MBF50%=12° aTDC)
keeping constant the injected energy, IMEP versus SOI variation traces are plotted. The CN38
diesel/CyclOx blend has similar lower and upper limits (i.e. in terms of coefficient of variance
(COV) and maximum pressure rise rate) as the diesel fuel, but shows higher values for IMEP at
the same SOI values. Moreover, the curve is shifted to more advanced SOI values.
The same effect is noticeable for the diesel/gasoline blend, but in this case, it was not possible
to perform the tests in the SOI value range between -40 and -15 °Ca aTDC (note the curve
interruption in the Figure) due to excessive pressure rise values (i.e. >>8.9 bar/ °Ca) over the
prefixed limit (see Table 4.4) with the risk of engine damage. Similar results have also been
observed by other researchers [118]. The operating ranges for the CN20 blends are smaller, as
expected, but with the CyclOx/diesel blend appearing slightly more advantageous.
Figure 4.10: IMEP as function of SOI at 1500 rpm for all blends.
In Figure 4.11, the pressure rise rates for all blends are presented. The CN38 blends reach the
8.9 bar/ °Ca limit at similar SOI timings, which suggests they perform similarly.

EXPERIMENTAL RESULTS AND DISCUSSION
96
For the CN20 blends, the longer ID creates more mixing time. This combined with the typical
higher swirl level adopted in the LD engines (as in the present case), and the relatively low
fuelling rate applied, increases to fuel over-mixing.
Obviously, as can be seen in Figure 4.11, the NOx trend is similar to the one that offers the
pressure rise rate [4]. As it could be expected, the pressure rise rate determines the peak
combustion temperature and therefore indirectly the NOx emissions. Naturally, the lowest NOx
values are found for operating conditions where the pressure rise rate is low as well.
The CN38 blends show more or less the same trends as the reference fuel since the diesel fuel
remain the main component. Lower NOx values are emitted for the CN20 blends, due to the
longer ignition delay that increases fuel-premixing level.
Figure 4.11: Pressure rise rate and NOx emissions as a function of SOI at 1500 rpm for all blends.
Figure 4.12 shows the HC and CO trends. As discussed earlier, the lower CN blends (e.g. higher
percentages of gasoline and CyclOx, CN20), mainly the gasoline blends, support the assumption
that the over-lean phenomenon leads to more charge dilution and therefore lower temperatures
and higher CO emissions.
In addition, here, the uncertainties pertaining the CN estimation (mainly for the CN20 blends)
and the differences in terms of volatility are evident. In fact, such differences induce, for
diesel/CyclOx, lower HC and CO emissions.

EXPERIMENTAL RESULTS AND DISCUSSION
97
Figure 4.12: HC and CO emissions as a function of SOI at 1500 rpm for all blends.
The soot emissions reported in Figure 4.13(on the left) are extremely low (about 0.01 FSN) for
these operating conditions. Accordingly, given the measurement uncertainly, no hard
conclusions can be drawn. However, it appears that the lowest values are found for the lowest
CN blends and in particular, the diesel/ CyclOx blend. This supports the assumption reported in
[120][121] that high levels of premixing and higher percentages of oxygen are important drivers
in suppressing soot emissions.
Figure 4.13(on the right) displays the ID as a function of the SOI. Both the CN38 blends show a
similar characteristic. Of course, when CyclOx and gasoline become the main blend components
(e.g. in CN20), the ID increases more. Looking at the two CN20 blends, due to its slightly lower
CN and volatility, the gasoline blend shows higher ID values than those seen for the CyclOx
blend. However, as discussed earlier, this trend may also be linked to higher HC emissions

EXPERIMENTAL RESULTS AND DISCUSSION
98
Figure 4.13: Soot emissions and Ignition delay as a function of SOI at 1500 rpm for all blends.
Engine performance analyses at constant injected energy flow at a fixed SOI
1500 rpm; IMEP= 3.2 bar-SOI= -40 °Ca aTDC
As stated before, it was not possible to perform the tests for all the SOI values for each blend,
mainly for the blend 2. This was due to excessive pressure rise rates (Figure 4.11) or combustion
instability. Accordingly, only the comparisons for SOI -40 °Ca aTDC are made.
This point simulate an early direct injection strategy (EDI) usually performed to achieve a PCCI
combustion mode (see Chapter 2).
The figures report the pressure traces and RoHR, the thermodynamic temperature (Figure 4.14)
and the emissions and efficiencies (Figure 4.15) for all blends at 1500 rpm. In each case, the SOI
and injected energy is kept constant and equal to that of the reference point.
As could be expected, the MBF50% is retarded for the CN38 blends and the maximum peak is
higher with respect to the reference diesel fuel (Figure 4.14). This difference is mainly due to a
more efficient mixing process. Obviously, the CN20 blends show a more retarded start of
combustion. The gasoline blend delays more the MBF50% and reduces the combustion
temperature (Figure 4.14).

EXPERIMENTAL RESULTS AND DISCUSSION
99
Figure 4.14: Pressure traces and RoHR (left) and the Thermodynamic temperature (right) for all
blends at 1500 rpm, SOI -40 °Ca aTDC for the same injected energy.
The trends in terms of pressure and RoHR traces (Figure 4.14), the higher CO and lower NOx
emissions (Figure 4.15), are typical for a PCCI operating mode. The higher UHC emissions, as
discussed earlier, are induced by over-mixing, wall wetting and out-of-bowl and crevice
phenomena. These conclusions appear also valid for the CyclOx blend, despite the lower
volatility and the presence of oxygen.
For the CN20 blends, very low levels of NOx and high levels for CO are observed. This is
explained partially by a decrease in the global temperature (Figure 4.14). However, the most
important precursor for NOx is not the global temperature but the local temperature. The lower
CN for the CN20 blends induces more mixing time and therefore higher mixing rates inside the
cylinder and a more homogeneous charge is developed. This limits the presence of thermal NO
production zones.
The soot emissions were omitted for all the blends, because the exhaust concentration values
were always low and at the limit of the measurement device.
In Figure 4.15, the fuel efficiencies and the ISFC are reported. They show similar values for
ISFC for all the blends, whereas the combustion efficiency is obviously lower for the blends that
emit more CO and HC. The thermodynamic efficiency for the low CN blends is higher due to
the improved combustion phasing in the engine thermodynamic cycle. Actually, the lower CN
blends show retarded combustion, which causes a better combustion phasing (MBF50%) and
therefore higher thermodynamic efficiencies (see etha thermo in Figure 4.15). The combination

EXPERIMENTAL RESULTS AND DISCUSSION
100
of the combustion and thermodynamic efficiency gives the fuel efficiency, which suggests that,
for the low CN fuels, the lower combustion efficiency is compensated by improved combustion
phasing.
Figure 4.15: Emission Indices and efficiencies comparisons for all blends at 1500 rpm, SOI -40 °Ca
aTDC for the same injected energy.
2000 rpm; IMEP= 6.9 bar
For higher speeds and loads, due to the limitations of maximum pressure rise rate, few
workpoints were possible to perform. For each blend in terms of SOI (Figure 4.16), and
therefore the operating range was smaller with respect to the low load conditions. This is mainly
due to the higher amount of injected fuel which burns simultaneously and therefore causes
higher pressure rise rates (see Figure 4.17, on the left) [104]. Indeed, for all the blends only a
small SOI variation is permitted.

EXPERIMENTAL RESULTS AND DISCUSSION
101
Figure 4.16: IMEP as function of SOI at 2000rpm for all the blends.
The pressure rise rate is dependent on the degree of mixing. It is higher due to the higher
available amount of fuel to burn when the combustion starts. Like discussed before for 1500rpm,
the emitted NOx is linked to the pressure rise rate and as expected the trends are similar to the
ones for lower loads.
Figure 4.17: Pressure rise rate and NOx emissions as function of SOI at 2000rpm for all the blends.
The HC and CO emissions (Figure 4.18), for the fuels with CN38, are similar as the emissions
for the reference points; whereas the CN20 blends show large differences due to the combustion
instability. The CO emissions (Figure 4.18, on the right) are linked to the temperature and more.

EXPERIMENTAL RESULTS AND DISCUSSION
102
Figure 4.18: HC and CO emissions as function of SOI at 2000rpm for all the blends.
In Figure 4.19, on the left, are reported the soot emissions for all the blends. It is not possible to
formulate hard conclusions based on these because of the limited SOI range, but it is possible to
make some assumptions for the CN and/or oxygen effect on the soot emissions. In fact, the
blend with cyclohexanone, especially the one with CN20, shows drastic soot reductions with
respect to the other blends.
Figure 4.19: Soot emissions as function of SOI at 2000rpm for all the blends.
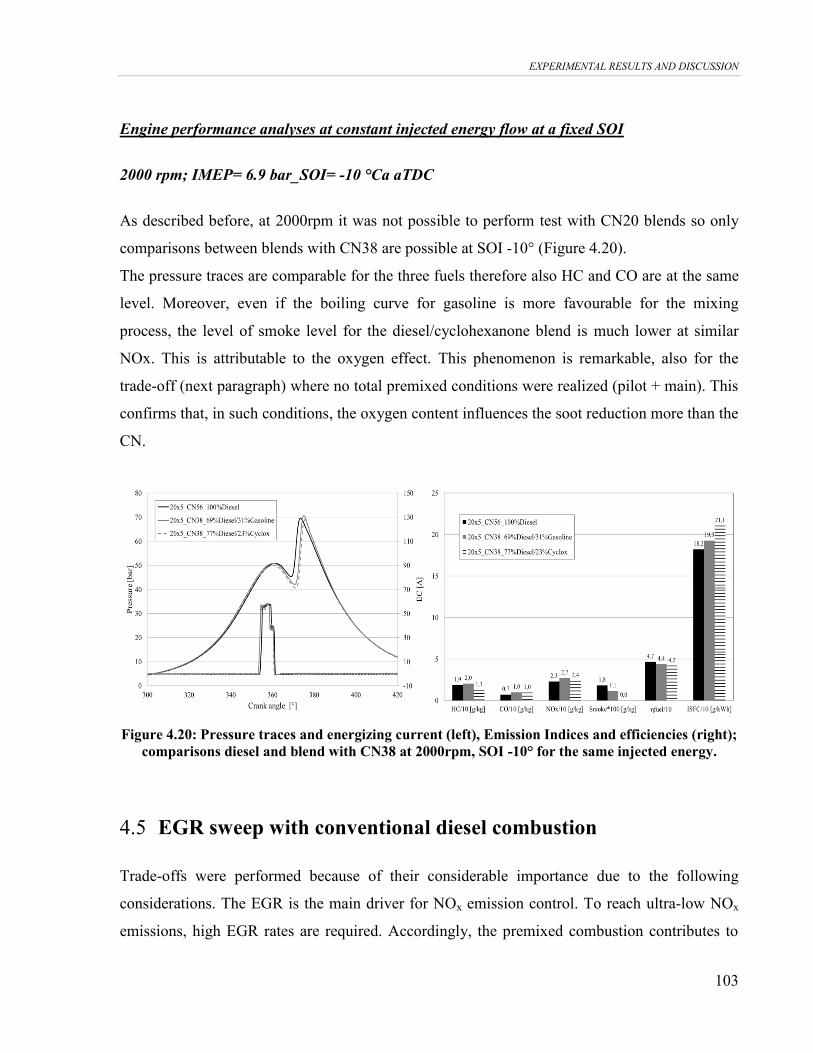
EXPERIMENTAL RESULTS AND DISCUSSION
103
Engine performance analyses at constant injected energy flow at a fixed SOI
2000 rpm; IMEP= 6.9 bar_SOI= -10 °Ca aTDC
As described before, at 2000rpm it was not possible to perform test with CN20 blends so only
comparisons between blends with CN38 are possible at SOI -10° (Figure 4.20).
The pressure traces are comparable for the three fuels therefore also HC and CO are at the same
level. Moreover, even if the boiling curve for gasoline is more favourable for the mixing
process, the level of smoke level for the diesel/cyclohexanone blend is much lower at similar
NOx. This is attributable to the oxygen effect. This phenomenon is remarkable, also for the
trade-off (next paragraph) where no total premixed conditions were realized (pilot + main). This
confirms that, in such conditions, the oxygen content influences the soot reduction more than the
CN.
Figure 4.20: Pressure traces and energizing current (left), Emission Indices and efficiencies (right);
comparisons diesel and blend with CN38 at 2000rpm, SOI -10° for the same injected energy.
4.5 EGR sweep with conventional diesel combustion
Trade-offs were performed because of their considerable importance due to the following
considerations. The EGR is the main driver for NOx emission control. To reach ultra-low NOx
emissions, high EGR rates are required. Accordingly, the premixed combustion contributes to

EXPERIMENTAL RESULTS AND DISCUSSION
104
control the PM formation assisting simultaneously the EGR work for NOx control because lower
combustion temperatures can be attained. However, in some engine conditions, pilot injection
could be necessary to control the combustion stability and the engine noise due to too high
cylinder pressure rise rates. All combustion control measures for emission reduction have to be
applying within absolute constraints on maximum fuel consumption and pressure rise (Table
4.4). Therefore, two test series where performed in order to evaluate the performance of the low
CN fuels [22].
4.5.1 Experimental procedure
Starting from a reference Euro 5 calibration of real engines of similar characteristics, based on
the use of moderate EGR levels, pilot plus main injection strategy and medium-high injection
pressure, the fuel blends were analysed performing the conventional EGR trade-off at constant
indicated mean effective pressure (IMEP). This was done until the cycle-to-cycle IMEP
variability (up to 4% of the coefficient of variation – COV) or the exhaust smoke exceeded their
prefixed limits (described later). Performing the trade-off, in order to avoid too high penalties in
the engine thermodynamic efficiency, the MBF50% value was kept constant (its value
depending on the engine test point, Table 4.3) varying the start of injection (SOI). In this way,
the limits toward low NOx emissions with conventional diesel operating mode of all fuel blends
can be evaluated.
As stated before, the EGR sweep was performed in the two work points 1500x3.2 and 2000x6.9
starting from zero EGR, increasing the EGR rate.
4.5.2 Test Results
In the low speed and load point, i.e. 1500x3.2, the trade-off was plotted as CO vs. NOx instead
of soot vs. NOx because, for modern engines, at low loads the CO emission becomes the main
pollutant. The emissions are converted into specific emission indexes (EI) represented as
gemiss/kgfuel units. The MBF50% values were 12° crank angle (CA) after top dead center (aTDC)
for the test point 1500x3.2, and 15° CA aTDC for the test point 2000x6.9.

EXPERIMENTAL RESULTS AND DISCUSSION
105
The Figure 4.21 and Figure 4.22 report the diagrams of CO, PM and UHC variation versus NOx
for the two considered test points.
In the diagrams, the measure uncertainty bars for the diesel (D) and the estimated “engine out”
Euro 5 limits (Figure 4.21) are also reported. The limits are derived from engine complied Euro
5 targets, with a unit displacement similar to the single cylinder employed in the experiments.
Figure 4.21: Trade off CO vs. NOx at 1500x3.2 for all the blends (left); trade off PM vs. NOx at
2000x6.9 for all the blends (right).
Figure 4.22: Trade off UHC vs. NOx at 1500x3.2 (left), and at 2000x6.9 (right), for all the blends.
The first experimental evidence suggests that by reducing CN it is possible to improve the PM-
NOx trade-off at medium load, well below the Euro5 limits, despite of an increment of CO-NOx
1500x3
0
40
80
120
160
200
0 5 10 15 20
NOx [g/kgfuel]
EIC
O [
g/k
gfu
el]
D
DG
GD
DC
CD
Euro5
EGR 0%
EGR 25%
EGR 30%
EGR 35%
EGR 45%
EGR 50%
Comb.
instability
"Engine out" Eu5 area
2000x7
0.0
0.2
0.4
0.6
0.8
0 4 8 12 16
NOx [g/kgfuel]
EIS
oo
t [g
/kg
fue
l]
D
DG
DC
Euro5
EGR 0%
EGR 15%
EGR 23%
EGR 30%
Premixing level
increment
"En
gin
e o
ut"
Eu
ro 5
are
a
EGR 27%
Oxygen
fuel content
1500x3
0
40
80
120
160
0 5 10 15 20
NOx [g/kgfuel]
EIH
C [g
/kg
fue
l]
D
DG
GD
DC
CD
EGR 0%
EGR 25%
EGR 30%
EGR 35%EGR 45%
EGR 50%
Comb.
instability
2000x7
4
6
8
10
12
14
16
18
0 4 8 12 16
NOx [g/kgfuel]
EIH
C [
g/k
gfu
el]
D
DG
DC
EGR 0%EGR 15%
EGR 23%
EGR 27%
EGR 30%

EXPERIMENTAL RESULTS AND DISCUSSION
106
trade-off. At 2000x7, due to a high IMEP instability (COV up to 3.5%), tests with blends 4 and
5 (highest fraction of gasoline and CYCLOX in the blend) were not executed. These results are
in line with previous experiences of other researchers [104][107][120]. In Figure 4.21 on the
right, a PM-NOx trade-off reduction is associated with an increment on ID time and therefore of
the premixing time, while high CO emissions are associated with reduction of the local mixture
strength toward the global in-cylinder very lean air-fuel ratio. Simultaneously, this effect leads
to shift the flame temperature towards the thermodynamic bulk temperature and so to lower NOx
formation rates, as observable for data points corresponding to the test without EGR. A recent
paper from Benajes et al. [124] discusses the local mixture distribution variation when gasoline
is injected instead of diesel fuel.
On the left diagram of Figure 4.23 it is possible to note the limited EGR sweep of blend 3 (diesel
in gasoline) with respect to the others, because of the combustion instability with an IMEP COV
higher than 3.5%. The limited EGR sweep at the test point 1500x3.2 for the GD blend indicates
that although a pilot injection is present, its effect on the auto-ignition stability of the main
injection becomes ineffective at high EGR rate. Vice versa, at about the same CN level, less
volatile fuels give better results in terms of combustion stability, even if CO emissions remain
high. This result seems to conflict with those of Kalghatgi et al. [120] where for CN<30, the fuel
volatility has less influence on combustion conditions. Considering the uncertainty on the actual
CN of the present blends (determined with the linear Kay’s mixing rule), and as showed later in
the plot of the indicated signals, the large difference in SOImain between GD and CD, a
discrepancy between the results of the two researches is acceptable.
The breakup of the PM-NOx trade-off with EGR sweep for the DC fuel, plotted in the right
diagram of Figure 4.21, is essentially due to the oxygen content of the CYCLOX. On the
contrary, DG fuel shows similar PM emissions for moderate EGR levels, and gives better PM
trend at higher EGR rate.
Figure 4.22, on the left, confirms the effect of CN reduction on UHC emissions. Nevertheless, it
is important to highlight that the pilot drastically increases the UHC emissions in the whole
EGR sweep and in both the two operating points when low CN fuels are employed. At 2000x7,
the slight reduction for the DG blend increasing EGR is due to the predominant effect of exhaust
flow reduction versus the UHC concentration increment. Of course, the pilot presence could be

EXPERIMENTAL RESULTS AND DISCUSSION
107
useful to control ID and pressure rise in some operating conditions, but for low CN fuels, a too
high degree of over-mixing is realized for very early pilot injection timings. This comment is
well explained by the left diagram of Figure 4.23 where the SOI values for main and pilot are
displayed. This means that whereas in the engine working map a pilot activation is necessary to
control fuel ignitability and maximum pressure rise, nevertheless an accurate pilot injection
management is required to burning low CN fuels (e.g. SOI pilot close to the main etc.) and also
to avoid its over dispersion in the combustion chamber (and in the piston squish area) and as a
consequence there are uncontrollable UHC emissions. The analysis of the influence of pilot
injection parameters (e.g. quantity and dwell time) on combustion of low CN fuels was out of
the aim of the present work, but it will be included in future studies. However, the improvement
of pilot injection management, when it is required, seems mandatory when CN is reduced and
fuel volatility increases. To do this, new injectors able to actuate the injection rate shaping could
be useful. Indeed, the COV variation with EGR sweep reported in the right diagram of Figure
4.23 shows the significant rise of cycle-to-cycle variation of IMEP moving progressively from
diesel (D) to gasoline and diesel (GD).
Figure 4.23: At left, SOImain variations for EGR sweep at 1500x3.2 for all the blends. SOIpilot of
the two lowest CN fuels without EGR and for the highest EGR are also reported. At right, COV of
IMEP with EGR sweep for all the blends.
The analysis of the combustion characteristics of all blends can be outlined looking at the plots
of the indicated signals reported in Figure 4.24 for the test case 1500x3 and an average EGR rate
1500x3
-30
-25
-20
-15
-10
-5
0
0 10 20 30 40 50 60
EGR CO2based [%]
SO
Ima
in [
° A
TD
C]
D
DG
GD
DC
CD
SOIpil =-30° ADTC
SOIpil =-37° ADTC
SOIpil =-22° ADTC
SOIpil =-29° ADTC
1500x3
1
2
3
4
0 10 20 30 40 50 60
EGR CO2based [%]
IME
P C
OV
[%
]
D
DG
GD
DC
CD

EXPERIMENTAL RESULTS AND DISCUSSION
108
among all fuels of 37%, and in Figure 4.25 for the test case 2000x7 and an average EGR rate
among all fuels of 28%.
Figure 4.24: At left, cylinder pressure and injector energizing current versus crank angle; at right,
heat release rate versus crank angle; curves of all blends are referred to the test case 1500x3.2 and
with an EGR rate of 37%.
Figure 4.25: At left, cylinder pressure and injector energizing current versus crank angle; at right
heat release rate versus crank angle; curves of all blends are referred to the test case 2000x6.9 and
with an EGR rate of 28%.
At 1500x3 in Figure 4.24, starting from the diesel case (D), it is evident that the pilot
combustion is visible and the combustion of the main injection shows the highest heat release
rate. Moving toward lower CN blends, SOImain has to be advanced progressively in the
1500x3 - averaged EGR=37%
0
10
20
30
40
50
60
320 330 340 350 360 370 380 390 400
CA [°]
Cylin
de
r pre
ssu
re [
ba
r]
0
40
80
120
160
EC
[A
]
D
DG
GD
DC
CD
SOImain CD
SOImain GD
1500x3 - averaged EGR=37%
-20
-10
0
10
20
30
40
50
60
350 360 370 380 390
CA [°]
Hea
t re
lea
se
rate
[J/°
]
D
DG
GD
DC
CD
2000x7 - averaged EGR=28%
0
10
20
30
40
50
60
70
80
330 340 350 360 370 380 390
CA [°]
Cylin
de
r p
ressu
re [
ba
r]
0
40
80
120
160
EC
[A
]
D
DG
DC
2000x7 - averaged EGR=28%
-20
0
20
40
60
80
100
350 360 370 380 390
CA [°]
He
at
rele
ase
ra
te [
J/°
]
D
DG
DC

EXPERIMENTAL RESULTS AND DISCUSSION
109
compression stroke, pilot combustion reduces its effectiveness and for lowest CN blends,
combustion approaches the typical HCCI shape, indicating that pilot has a negligible or weak
influence on ignition. This is valid for both the CYCLOX and gasoline blends, and this data is in
line with the emission results of Figure 4.21 and Figure 4.22. This trend is also visible in the
diagrams of Figure 4.25, for the test point 2000x7. In the present test case, the difference in
SOImain between DG and DC blend is attributable to the lower LHV of the DC blend that gives
less heat released from pilot combustion. Such an effect is notable also in Figure 4.24 for the
heat release rate (HRR) traces of the DG and DC blends.
The excessive over-mixing phenomenon for reducing CN is the main factor that affects the ISFC
increment and the relative indicated thermal efficiency. This trend is for both test points and all
blends displayed in Figure 4.26 and Figure 4.27 for ISFC and thermal efficiency respectively.
Figure 4.26: ISFC variations for EGR sweep at 1500x3.2 (left) and at 2000x6.9 (right) for all the
blends.
The diagrams show quite “flat” trends versus the EGR, except for the highest rates where an
ISFC rise is generally expected. These trends seem different from the results found by Kalghatgi
et al. [120] in similar tests and for similar fuels. Actually, in other test series performing the SOI
sweep of a single injection event per cycle with and without EGR, the authors found a slight
reduction of ISFC for the EGR case with respect to the zero EGR case. Therefore, in line with
other literature data ([120][125]), the ISFC insensibility to EGR may be attributed to the
1500x3
180
200
220
240
260
280
300
0 10 20 30 40 50 60
EGR CO2based [%]
ISF
C [g
/kW
h]
D
DG
GD
DC
CD
2000x7
140
160
180
200
220
240
0 5 10 15 20 25 30 35 40
EGR CO2based [%]
ISF
C [
g/k
Wh
]
D
DG
DC

EXPERIMENTAL RESULTS AND DISCUSSION
110
presence of a pilot injection that progressively reduces the combustion efficiency as the
SOImain is advanced to keep the MBF50% timing constant. The effect is clearly visible in the
ISFC trend of the GD blend at 1500x3.2. In that case, the ISFC rise was detected for low EGR
rate (20%). The corresponding indicated signals of the GD blend in Figure 4.24 denotes the very
early timing of SOIpilot that, pointed out before, loses its effectiveness reducing combustion
efficiency and increasing the unburned emissions.
The trends of the indicated thermal efficiency for both test points and all blends reflect the
trends for ISFC.
Figure 4.27: At left, Indicated thermal efficiency variations for EGR sweep at 1500x3.2 (on the left)
and at 2000x6.9 (on the right) for all the blends.
The overall analysis of the experimental data of the diesel, gasoline and CYCLOX blends
reported in the previous Figures points out the importance of the fuel characteristics to realize
the combustion control when low CN fuels are burnt and a pilot and main injection is required to
stabilize the combustion, limit the pressure rise rate and reduce emissions. The relevance is also
highlighted in the plots of Figure 4.28. The plot on the left denotes the effectiveness of the pilot
injection on COV and pressure rise rate value for the DG blend, while the right plot evidences
the difficulties in the IMEP COV control when gasoline is the main component of the blend and
the SOImain has to be advanced earlier in the compression stroke to have acceptable MBF50%
values.
2000x7
35
40
45
50
0 10 20 30 40
EGR CO2based [%]
Ind
icate
d t
he
rma
l e
ffic
ien
cy [
-]
D
DG
DC
1500x3
30
31
32
33
34
35
36
37
38
39
40
0 10 20 30 40 50 60
EGR CO2based [%]
Ind
ica
ted
th
erm
al e
ffic
ien
cy [
-] D
DG
GD
DC
CD

EXPERIMENTAL RESULTS AND DISCUSSION
111
In this latter case (see right diagram of Figure 4.28), despite of quite similar ignition timing, and
injection pressure variation inside the injector chamber, between the maximum and minimum
IMEP cycle (see HRR traces), the combustion instability lies mainly on heat release of main
injection, indicating a large variation of spray-air mixing and over-mixing of the main injection
(in line with the results exposed in [124]). For similar test conditions as in the right diagram but
without pilot activation, the COV was higher than 6%.
Therefore, in the comparison between a high quality gasoline and a less volatile low CN oxy-
fuel, as CYCLOX, an evidenced improvement of the engine stability, unburned and PM
emissions at the same NOx exhaust level can be obtained with the second one, for those engine
operating conditions (e.g. transient, cold starting etc.) where a pilot combustion is required to the
combustion control. Similar results for a heavy-duty engine fed with the same kind of oxy-fuels
can be found in [126]
Figure 4.28: At left, indicated signal comparison for tests with and without pilot injection at
2000x6.9 for DG blend. At right, indicated signal comparison for cycles with maximum and
minimum IMEP for the test with GD blend at 2000x6.9 and pilot plus main injection strategy.
320 340 360 380 400 420CA [°]
20
40
60
80
Cy
lin
de
r P
res
su
re [
ba
r]
0
20
40
60
E.C
. [A
]
0
40
80
120
160
HR
R [
%/d
eg
]
Single shot injection; COV=1.5%, dp/d=12 bar/°
Pilot and main injection; COV=0.9%, dp/d=12 bar/°
Cylinder pressure cycle comparisonwith and w/o pilot injection for DG blend at 2000x7
320 340 360 380 400 420CA [°]
20
40
60
80
Cy
lin
de
r P
res
su
re [
ba
r]
800
900
1000
Ra
il P
res
su
re [
ba
r]
0
20
40
60
80
E.C
. [A
]
0
20
40
60
80
100
HR
R [
%/d
eg
]
Cycle with minimum IMEP
Cycle with maximum IMEP
Max. and min. pressure cycle comparison for GD blend at 2000x7
COV > 3%

EXPERIMENTAL RESULTS AND DISCUSSION
112
4.6 PCCI application with low CN fuels
This paragraph has the aim at evaluating the lowest possible NOx emission conditions in PCCI
mode for the different fuels. The test methodology is hereby described.
4.6.1 Experimental procedure
PCCI operating mode is realized with a single injection event, increasing the EGR
systematically, until one of the limits on the maximum values on fuel consumption, pressure rise
and smoke emission is reached. In addition, in this case SOI was varied in order to keep the
MBF50% constant. Even though very early, multiple injection strategies could be useful to
realize well-premixed air-fuel charges [112], they were not considered in the present study
because they require optimization of many parameters in each test point, as the dwell times
among all injection events, the different quantities and so on. Moreover, the use of sophisticated
injection strategies could affect the interpretation of the results. With this testing methodology
the capability of the different blends (and fuels) to reduce NOx in PCCI combustion mode within
reasonable limits in efficiency, comfort and emissions, and for a fixed combustion system
design (e.g. compression ratio, injection system characteristics and so on), can be evaluated. No
limits on engine-out UHC and CO emissions were fixed since they were object of analysis of the
quality of the fuels.
In the test series, injection pressure, boost pressure, exhaust backpressure, swirl level, intake air
temperature and water coolant temperature were kept equal to the reference Euro 5 calibration.
4.6.2 Test results
In the present case, all four tests points were object of investigation. However, for the lowest CN
blends (e.g. GD and CD), the IMEP variability and the cylinder pressure rise rate was always
above the fixed limits for reliable functionality of the engine. For the CD blend, it was only
possible to perform the tests at 1500x3.2 and 2000x6.9. For this reason, no data for the GD
blend is displayed in the following.

EXPERIMENTAL RESULTS AND DISCUSSION
113
Figure 4.29 shows some engine operating parameters and exhaust emissions for the blends for
which it was possible to reach PCCI conditions at 1500x3.2. To show all the emission data in
the same graph without normalization of the values, the different species emissions were
properly scaled.
Considering the left diagram, the low value for IMEP for the DG blend is obvious. For this case,
difficulties in controlling the combustion stability were observed with a slight reduction for the
averaged IMEP consequently. Nevertheless, for the other fuels the target value for IMEP of
3.2bar was attained. From a first perspective, looking at the diagrams in Figure 4.29, it appears
that PCCI conditions can be realized for all fuels within the prescribed limits. In this operating
condition, it is quite easy to reach very low NOx and low PM emission at high EGR rates.
Nevertheless, both DG (with a CN 38) and CD blend (with a CN 20) yield very high-unburnt
emissions.
Figure 4.29: Engine operating parameters (left) and exhaust emissions (right) for all blends at the
lowest attainable NOx emissions in PCCI conditions at 1500x3.2. Note that dp/d limit at 1500 rpm
was fixed at 8.8 bar/°.
Figure 4.30, Figure 4.31 and Figure 4.32 report the same data of Figure 4.29 for the test points
1500x6.9, 2000x3.2 and 2000x6.9 respectively.
Engine operating values for PCCI mode at 1500x3
0
1
2
3
4
5
6
7
IMEP [bar] COV
IMEP[%]
EGR
fraction
Smoke
[FSN]
dp/dθ
[bar/deg]
ISFC/100
[g/kWh]
D
DG
DC
CD Limit on
ISFC
Engine emission and efficiency values for PCCI mode at 1500x3
0
5
10
15
20
25
30
HC/10
[g/kg]
CO/10
[g/kg]
NOx [g/kg] PM·100
[g/kg]
ISFC/10
[g/kWh]
ηfuel/10
[%]
D
DG
DC
CD

EXPERIMENTAL RESULTS AND DISCUSSION
114
Figure 4.30: Engine operating parameters (left) and exhaust emissions (right) for all blends at the
lowest attainable NOx emissions in PCCI conditions at 1500x6.9. Note that dp/d limit at 2000 rpm
was fixed at 8.8 bar/°.
Figure 4.31: Engine operating parameters (left) and exhaust emissions (right) for all blends at the
lowest attainable NOx emissions in PCCI conditions at 2000x3.2. Note that dp/d limit at 2000 rpm
was fixed at 6.8 bar/°.
Engine operating values for PCCI mode at 1500x7
0
2
4
6
8
10
IMEP [bar] COV
IMEP[%]
EGR
fraction
Smoke
[FSN]
dp/dθ
[bar/deg]
ISFC/100
[g/kWh]
D
DG
DC
Limit dp/d
Limit on
FSN
Limit on
ISFC
Engine emission and efficiency values for PCCI mode at 1500x7
0
10
20
30
40
50
HC/10
[g/kg]
CO/10
[g/kg]
NOx [g/kg] PM·100
[g/kg]
ISFC/10
[g/kWh]
ηfuel/10
[%]
D
DG
DC
Engine operating values for PCCI mode at 2000x3
0
2
4
6
8
IMEP [bar] COV
IMEP[%]
EGR
fraction
Smoke
[FSN]
dp/dθ
[bar/deg]
ISFC/100
[g/kWh]
D
DG
DC
Limit dp/d
Limit on
ISFC
Engine emission and efficiency values for PCCI mode at 2000x3
0
10
20
30
HC/10
[g/kg]
CO/10
[g/kg]
NOx [g/kg] PM·100
[g/kg]
ISFC/10
[g/kWh]
ηfuel/10
[%]
D
DG
DC
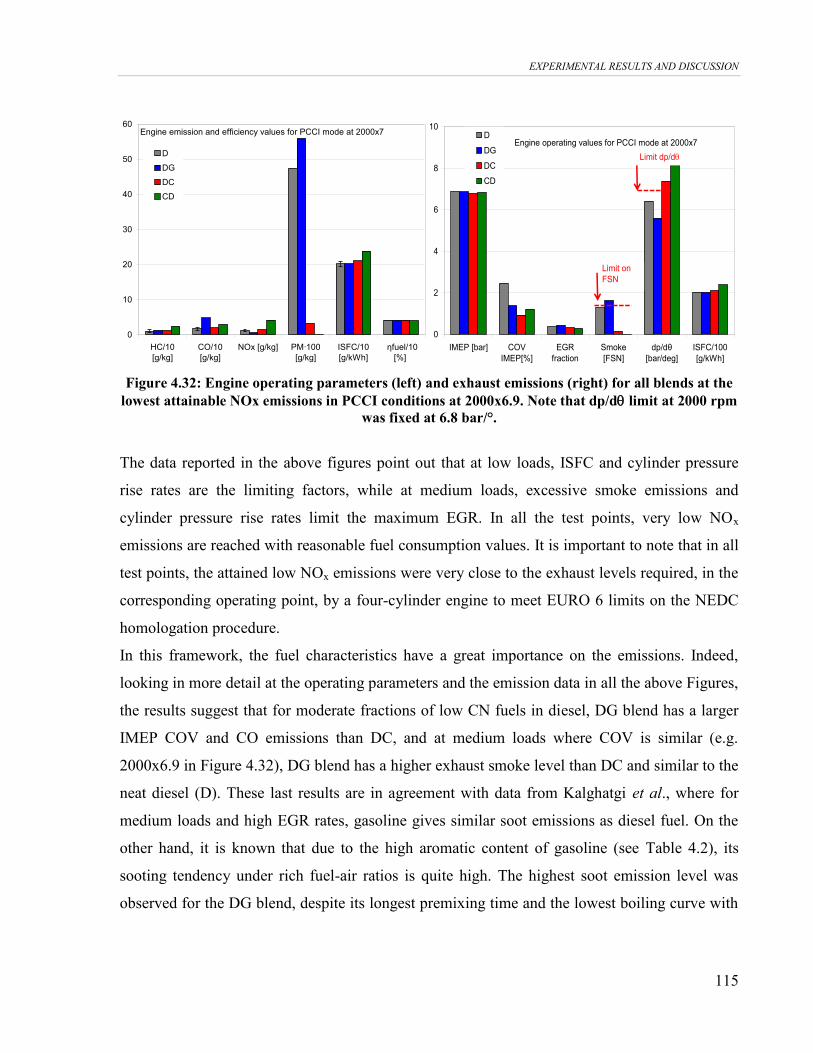
EXPERIMENTAL RESULTS AND DISCUSSION
115
Figure 4.32: Engine operating parameters (left) and exhaust emissions (right) for all blends at the
lowest attainable NOx emissions in PCCI conditions at 2000x6.9. Note that dp/d limit at 2000 rpm
was fixed at 6.8 bar/°.
The data reported in the above figures point out that at low loads, ISFC and cylinder pressure
rise rates are the limiting factors, while at medium loads, excessive smoke emissions and
cylinder pressure rise rates limit the maximum EGR. In all the test points, very low NOx
emissions are reached with reasonable fuel consumption values. It is important to note that in all
test points, the attained low NOx emissions were very close to the exhaust levels required, in the
corresponding operating point, by a four-cylinder engine to meet EURO 6 limits on the NEDC
homologation procedure.
In this framework, the fuel characteristics have a great importance on the emissions. Indeed,
looking in more detail at the operating parameters and the emission data in all the above Figures,
the results suggest that for moderate fractions of low CN fuels in diesel, DG blend has a larger
IMEP COV and CO emissions than DC, and at medium loads where COV is similar (e.g.
2000x6.9 in Figure 4.32), DG blend has a higher exhaust smoke level than DC and similar to the
neat diesel (D). These last results are in agreement with data from Kalghatgi et al., where for
medium loads and high EGR rates, gasoline gives similar soot emissions as diesel fuel. On the
other hand, it is known that due to the high aromatic content of gasoline (see Table 4.2), its
sooting tendency under rich fuel-air ratios is quite high. The highest soot emission level was
observed for the DG blend, despite its longest premixing time and the lowest boiling curve with
Engine emission and efficiency values for PCCI mode at 2000x7
0
10
20
30
40
50
60
HC/10
[g/kg]
CO/10
[g/kg]
NOx [g/kg] PM·100
[g/kg]
ISFC/10
[g/kWh]
ηfuel/10
[%]
D
DG
DC
CD
Engine operating values for PCCI mode at 2000x7
0
2
4
6
8
10
IMEP [bar] COV
IMEP[%]
EGR
fraction
Smoke
[FSN]
dp/dθ
[bar/deg]
ISFC/100
[g/kWh]
D
DG
DC
CD
Limit dp/d
Limit on
FSN

EXPERIMENTAL RESULTS AND DISCUSSION
116
respect to the D and DC blends. Figure 4.33, where cylinder pressure curves and injector
energizing time traces are displayed for the test case 2000x6.9, shows the relative differences.
On the contrary, the DC blend shows overall better performance than the D and DG blend.
Therefore, it can be noted that in PCCI combustion mode, at about the same CN as DG, the use
of a less volatile oxygenated fuel gives more benefits on the in-cylinder air-fuel mixing
preparation and soot formation suppression than the gasoline based blends.
In case of the lowest CN blends, as stated before, it was only possible to test the CD fuel at
1500x3.2 and 2000x6.9, while at 1500x5 and 2000x2, as for GD, too high combustion instability
was observed.
As notable in Figure 4.29 and Figure 4.32, acceptable combustion stability for CD was attained
for lower EGR values than the others fuels. This condition implies higher NOx emissions and
higher in-cylinder dp/d maximum values (see green bars in Figure 4.32), also despite of the
long premixing times (see green curves in Figure 4.33). Moreover, this result highlights, also for
low CN fuels, the clear link between air-fuel mixing conditions and combustion stability when
the engine operates in PCCI mode and with high EGR rates.
Figure 4.33: Cylinder pressure and injector energizing current versus crank angle of all tested
blends in PCCI mode at 2000x6.9.
PCCI combustion mode @ 2000x7
0
10
20
30
40
50
60
70
80
340 350 360 370 380 390 400
CA [°]
Cylin
de
r pre
ssu
re [
ba
r]
-10
10
30
50
70
90
110
130
EC
[A
]
D
DC
DG
CD

EXPERIMENTAL RESULTS AND DISCUSSION
117
From this point of view, and based on the type of work performed by Benajes et al. in [124], it
will be very interesting in future research to evaluate the critical mixing conditions versus
characteristics of low CN fuels, where both the cycle-to-cycle combustion stability and unburnt
emissions become unacceptable.
4.7 Nanoparticle emission from low CN oxy-fuels
Referring to the upcoming legislation in terms of number of nanoparticles (paragraph 1.1.2),
measurements in terms of size and number of particle emissions was performed.
The aim was to assess the effect of the low oxy-fuels on the size distribution of the emitted
nanoparticle. Diesel and DC fuel (Table 4.2) were compared either in PCCI (single injection)
combustion mode either in conventional combustion mode (splitted injection).
4.7.1 PCCI combustion mode
In PCCI combustion mode, the tests were performed at 2000rpm and 5bar BMEP, which
represent one of the most significant test points in terms of emissions (Figure 4.2). Two different
EGR levels were adopted. The results are compared to the conventional combustion mode
performed with pilot and main injection in order to assess the different distribution
characteristics.
In Table 4.5 are reported the main engine parameters used fixed for this test campaign.
Fuel Description RPM BMEP
[bar]
SOI
[Ca aTDC]
Δt_pil
[µs]
Swirl
[%]
P inj
[bar]
EGR
[%]
Smoke
[mg/m3]
Diesel
PCCI 2000 5 -8 / 30 974 0 0.26
PCC2 2000 5 -9 / 30 974 25 0.57
Conventional 2000 5 -8 1524 30 974 19 3.35
DC
PCCI 2000 5 -10 / 30 974 0 0.02
PCCI2 2000 5 -12 / 30 974 43 0.05
Conventional 2000 5 -9 1524 30 974 22 0.5
Table 4.5: Main engine parameters in PCCI and conventional injection strategies.

EXPERIMENTAL RESULTS AND DISCUSSION
118
In Figure 4.34 are reported the particle size distribution function (PSDF) measured for
conventional combustion and premixed modes for both the tested fuels.
Figure 4.34: PDSF in conventional and PCCI mode with and without EGR for diesel (left) and for
DC (right).
PSDFs show a bimodal size distribution both for premixed and conventional combustion modes.
For both fuels, PCCI and PCCI2 modes show a strong reduction of particles larger than 20 nm.
Moreover, the PCCI combustion shows a stronger nucleation mode (Figure 1.9) centred on
around 10nm and an accumulation mode lower of around one order of magnitude compared to
the conventional combustion mode. The nuclei mode is associated with the low amount of
accumulation particles. This is consistent with the hypothesis of Kittelson et al. [127], who
consider that nucleation is favoured by low accumulation mode particle number, due to the low
adsorption of volatiles that can take place on the carbonaceous particles surface at these
conditions. In fact, for diesel fuel, this result is only evident in PCCI combustion mode. As
higher amount of EGR are used (PCCI2) larger amount of particles formed compared to PCCI
even if they remain lower than in conventional mode. For DC fuel, a strong nucleation mode is
observed for both PCCI and PCCI2 as the low accumulation mode.
0.0E+00
2.0E+07
4.0E+07
6.0E+07
8.0E+07
1.0E+08
1.2E+08
1.4E+08
1.6E+08
1.8E+08
1 10 100 1000
Dp [nm]
dN
/dlo
gD
p [
1/c
m3
]
PCCI
PCCI2
Conventional
0.0E+00
5.0E+07
1.0E+08
1.5E+08
2.0E+08
2.5E+08
1 10 100 1000
Dp [nm]
dN
/dlo
gD
p [
1/c
m3
]
PCCI
PCCI2
Conventional

EXPERIMENTAL RESULTS AND DISCUSSION
119
Figure 4.35: Smoke concentration comparison for the different strategies.
As stated in the previous paragraphs, DC blend show, in addition to smoke reduction (Figure
4.35), a significant advantage in terms of particle number emission. In fact, the future legislation
computes the emitted particle number for particle with a diameter greater than about 20nm.
4.7.2 Conventional combustion mode
In conventional combustion mode, the tests were carried out in the reference points reported in
Figure 4.36.
Test point14
RPM [1/min] IMEP [bar] BMEP [bar] MBF50% [CA]
1500x3(2) 1500 3.2 2 12
2000x7(5) 2000 6.9 5 15
Figure 4.36: Reference test points.
Applying the conventional injection strategy, the experiments were performed both with and
without EGR. The measurements without EGR allowed a comprehensive analysis of the fuel
effect on the particle emissions. On the other hand, the tests with EGR are performed to analyse
the effect of DC using the actual engine calibration. Moreover, at 2000rpm and 5bar BMEP and
14
The values inside the parenthesis are referred to the BMEP value. The graphs that follows, sometimes refer to
IMEP other times to BMEP(i.e. 1500x2 or 1500x3).
0.0
0.5
1.0
1.5
2.0
2.5
3.0
3.5
4.0
PCCI PCCI-EGR Conventional PCCI PCCI-EGR Conventional
Sm
oke [
mg
\m3]
D
DC1500 rpm 3bar BMEP 2000 rpm 7bar BMEP

EXPERIMENTAL RESULTS AND DISCUSSION
120
higher EGR rate of was applied in order to assess the effect using a EURO6-NOx reduction
calibration strategy. In Table 4.6 are reported the main engine parameters.
Fuel Description RPM BMEP
[bar]
SOI
[Ca aTDC]
Δt_pil
[µs]
Swirl
[%] P inj
EGR
[%]
Smoke
[mg/m3]
Diesel Pilot-Main-EGR0 1500 2 -8 1174 65 480 0 2.54
Pilot-Main-EGR_map 1500 2 -8 1174 65 480 22 2.11
Diesel
Pilot-Main-EGR0 2000 5 -7 1524 30 974 0 1.57
Pilot-Main-EGR_map 2000 5 -8 1524 30 974 21 4.35
Pilot-Main-EGR2 2000 5 -8 1524 30 974 19 3.35
DC Pilot-Main-EGR0 1500 2 -8 1174 65 480 0 1.65
Pilot-Main-EGR_map 1500 2 -8 1174 65 480 25 0.9
DC
Pilot-Main-EGR0 2000 5 -8 1524 30 974 0 0.42
Pilot-Main-EGRmap 2000 5 -9 1524 30 974 22 0.5
Pilot-Main-EGR2 2000 5 -9 1524 30 974 16 0.5
Table 4.6: Main engine parameters in conventional injection strategies.
Figure 4.37 depicts the PSDF measured for D and DC engine fuelling at 1500rpm 3bar BMEP
and EGR0 and EGR1.
Figure 4.37: Particle size distribution measured for D and DC fuels at 1500rpm 3.2bar BMEP
applying the pilot plus main injection strategy at EGR0 (left) and EGR1 (right).
For each fuel and for each condition are well resolvable three modes: the first peaked on 10nm,
the second on 20nm and the third on 60nm. Fuelling DC, it is observed a larger number of
0.0E+00
5.0E+06
1.0E+07
1.5E+07
2.0E+07
2.5E+07
3.0E+07
1 10 100 1000
Dp [nm]
dN
/dlo
gD
p [
1/c
m3
]
D
DC
0.0E+00
5.0E+06
1.0E+07
1.5E+07
2.0E+07
2.5E+07
3.0E+07
3.5E+07
4.0E+07
1 10 100 1000
Dp [nm]
dN
/dlo
gD
p [1/c
m3]
D
DC

EXPERIMENTAL RESULTS AND DISCUSSION
121
particles smaller than 10nm. On the other hand, the concentrations of particles larger than about
10 nm are reduced. These results are ascribable to a combination of several factors. In particular,
the retarded combustion timing due to the low CN allows a better mixing reducing the formation
of local rich zone in the combustion chamber. Moreover, the higher oxygen content and the
higher soot reactivity favour particles oxidation [129][130][131].
Similar trends are observed at 2000rpm 5bar BMEP, as shown in Figure 4.38.
Figure 4.38: Particle size distribution measured for D and DC fuels at 2000rpm 6.9bar BMEP at
EGR0 (left) and EGR1 (right) and EGR2 (bottom).
Looking at the diagrams reported in Figure 4.38, it is possible to observe the effects of the EGR
on particle emissions. In particular, increasing the EGR rate, the particles smaller than 10nm
decreases conversely the particle larger than 10nm increases. These results are in agreement
with previous studies [127][128] that correlate the reduction of 10nm particles with the increase
of the accumulation mode, as the adsorption or condensation of volatile materials on the
particles surface prevails over the nucleation rate. Nonetheless, the effect of the EGR is less
strong for DC fuel with respect to the diesel fuel. In particular, the number of the particle
slightly increases passing from EGR0, EGR1 and EGR2. On the other hand, for diesel fuel the
0.0E+00
5.0E+06
1.0E+07
1.5E+07
2.0E+07
2.5E+07
3.0E+07
3.5E+07
4.0E+07
4.5E+07
5.0E+07
1 10 100 1000
Dp [nm]
dN
/dlo
gD
p [
1/c
m3
]
D
DC
0.0E+00
5.0E+06
1.0E+07
1.5E+07
2.0E+07
2.5E+07
3.0E+07
3.5E+07
4.0E+07
4.5E+07
5.0E+07
1 10 100 1000
Dp [nm]
dN
/dlo
gD
p [
1/c
m3
]
D
DC
0.0E+00
1.0E+07
2.0E+07
3.0E+07
4.0E+07
5.0E+07
6.0E+07
7.0E+07
1 10 100 1000
Dp [nm]
dN
/dlo
gD
p [
1/c
m3
]
D
DC

EXPERIMENTAL RESULTS AND DISCUSSION
122
particle number measured for EGR1 is quite the double than for EGR0. This result suggests
higher EGR rate calibration can be used of oxygenated and low CN fuel allowing the reduction
of the NOx emission without great particle emissions penalty.
Figure 4.39: Smoke emissions at different EGR levels.
4.8 Conclusions
In this chapter, the effects of the use of low CN fuel on the performance of a LD single cylinder
research engine operating in conventional and PCCI mode have been presented. Low CN blends
were prepared by adding commercial gasoline or a low CN cyclic oxygenated compound (e.g.
cyclohexanone) to a quality premium low sulphur diesel fuel. The oxygenated fuel is interesting
because of its current availability and more suitable as PCCI-like fuel, and the latter because of
its potential to be produced from lignin (i.e. second-generation biomass). Different mixtures
with the two low CN fuels and diesel were prepared to obtain two blends with CN38 and two
with CN20.
The present study has been focused to produce a detailed screening on the fuel effects on
combustion and emission in the most important engine operating points for emission control,
keeping the engine thermodynamic efficiency at the same current standards.
The experiments have led to several valuable results.
0.0
0.5
1.0
1.5
2.0
2.5
3.0
3.5
4.0
4.5
EGR0 EGR1 EGR0 EGR1 EGR2
Sm
oke [
mg
\m3]
D
DC1500 rpm 3bar BMEP 2000 rpm 7bar BMEP

EXPERIMENTAL RESULTS AND DISCUSSION
123
Use of low CN fuels in LD diesel engines
High premixing levels can be reached with low CN fuels, but combustion quality, in terms of
stability, emissions and efficiency, is strongly affected by fuel characteristics (e.g. volatility,
aromatics, and oxygen content).
In particular, it was evident that the use of low CN and volatile fuels (like gasoline), is very
effective on the promotion of premixed combustion as well as over-mixing, and as consequence
on UHC emissions. This effect becomes critical in those operating conditions where a pilot
injection is required to control the combustion noise. Due to excessive over-mixing with very
low CN fuels (e.g. CN20), the pilot activation becomes ineffective when its SOI is too early in
the compression stroke. This is due to the low auto-ignition tendency of the CN20 blends and
the low in-cylinder temperature. In this case, the adoption of a pilot close to the main injection
or injection rate shaping could be useful to improve the trade-off of premixing time versus
combustion noise and UHC emissions.
However, attributing the results to the tested combustion system design, low CN volatile fuels
have limited EGR operating range with conventional injection strategies at low and medium
load conditions. Moreover, as engine speed increase, fuels with greater auto-ignition resistance
seem to become less tolerant to EGR.
A better compromise in terms of efficiency and emissions was found for blends at CN38, and so
for limited fractions of both low CN fuels in diesel. In fact, also in full PCCI mode, aimed to
push the engine towards very low NOx emissions, the combustion became unstable for fuel
blends at CN 20, while emission improvements at reasonable engine efficiencies were found
for fuel blends at CN38.
Use of cyclic oxygenated fuels in LD diesel engines
The use of less volatile cyclic oxygenated fuels (better if renewable as CYCLOX) was found to
improve the emissions at similar engine performance. In particular, where the diesel-gasoline
blends give high PM and UHC emissions, the lower volatility and the oxygen content of the
oxy-fuel limits the over-mixing phenomena and simultaneously reduce the soot formation rate.

EXPERIMENTAL RESULTS AND DISCUSSION
124
This result was particularly pointed out when a pilot injection and high EGR rate were used in
conjunction.
Similar results were attained in PCCI operating mode. In this case, in two of the four test points,
acceptable working conditions were reached for the lowest CN blend of CYCLOX and diesel.
However, the overall result analysis indicates that, also for CYCLOX, critical engine working
conditions for emission and functionality can arise at very low CNs.
Moreover, as stated in paragraph 4.5, in the comparison between a high quality gasoline and a
less volatile low CN oxy-fuel, as CYCLOX, an evidenced improvement of the engine stability,
unburned and PM emissions at the same NOx exhaust level can be obtained with the second one,
for those engine operating conditions (e.g. transient, cold starting etc.) where a pilot combustion
is required to the combustion control.
The present analysis underlines that in the continuous development of PCCI engines, the fuel
properties play a fundamental role. To realize a more precise control of the in-cylinder air-fuel
charge, before and during the combustion, future PCCI fuels have to be tailored to the desired
combustion process. In this framework, renewable low CN oxygenated fuels could give a useful
contribution.
Concerning the particle distribution, the use of low CN oxy-fuels as DC blend, evidences a
general reduction of smoke emissions and of particle larger than 20-30nm. This aspect is
interesting from a legislation point of view that will limit the number of emitted particles and
larger than 23nm from 2014.
EXPERIMENTAL RESULTS AND DISCUSSION
125
5 EXPERIMENTAL CHARACTERIZATION OF PCCI
COMBUSTION VIA PFI INJECTION SYSTEM
5.1 Introduction
Although premixed combustion modes, in compression ignition engines, are studied as a
promising solution to meet fuel economy and increasingly stringent emissions regulations, they
are not still consolidated enough for practical applications. The high complexity of such
combustion systems in terms of both air-fuel charge preparation and combustion process control
requires, in addition to a deep experimental investigation, the employment of robust and reliable
numerical tools to provide adequate comprehension of the phenomena.
As discussed in chapter 2 and 4, a precise control of auto-ignition time and heat release rate
during combustion is necessary to extend engine operation under HCCI mode, avoiding misfire
and knock risks, and to have high efficient combustions.
Therefore, in order to solve the HCCI control problems various investigation strategies can be
applied also moving away from truly homogeneous mixtures, including PCCI combustion. One
of the possible strategies is the use of more suitable fuels (HCCI-like fuels), i.e. low CN – oxy
fuels, as described in chapter 4 or, as proposed in the present chapter, it is possible to premix the
fuel or part of it in the intake manifold (HCCI – PFI). In this case, the “homogeneous” mixture
is partially or fully created in the intake system allowing more time for premixed fuel
evaporation and air mixing.
The possibility to operate the engine with two different fuel types (dual-fuel) at the same time is
also under investigation and represents a combination between PCCI and HCCI combustion
[104]. In this case, a high ON fuel is port-injected and a high CN fuel, which is directly injected
into the cylinder, ignites the resulting air-fuel mixture. This allows a very precise control of the
auto-ignition time and, by varying the premixed ratio, it is possible to cover a wide range of
engine speed and loads. Several studies have revealed the advantages of dual fuel combustion

EXPERIMENTAL RESULTS AND DISCUSSION
126
mode, showing a simultaneous reduction of NOx and soot emissions, at the expense of CO and
UHC increase [132][133].
For this reason, both numerical and experimental studies on the flame structure are important to
identify how premixed charge auto-ignition and flame propagation are influenced by the ratio
between the amount of premixed and direct-injected fuel.
The use of multi-dimensional models, supported by detailed chemistry, will probably allow a
better explanation for experimental findings. Furthermore, CFD simulation will make possible
to optimize the injection strategy and charge premixing levels for different operating points in a
relatively short time [21].
Therefore, the aim of this test campaign was to employ a test procedure able to provide,
additional experimental information in terms of capability of HCCI-PFI (port fuel injected fuel)
in addition to HCCI-DI (direct injected fuel) combustion mode and, to develop and validate
suitable numerical models evaluating the effects of charge premixing levels in Diesel
combustion.
The tests were performed by varying the charge premixing level from the typical diesel
combustion mode towards an almost completely premixed/HCCI mode using n-heptane as a
direct injected fuel, and both n-heptane or ethanol as a port-injected fuel.
The use of such fuels (single component) allowed a detailed investigation of the “mixed
injection conditions”, that are typical of dual fuel configurations without employing fuels of
different chemical nature, composition and ignition tendency.
Firstly, the choice of using a single fuel, n-heptane as DI and as PFI fuel, was motivated by the
need to isolate the effects of different premixing levels and the resulting interaction between the
charge and the fuel spray. Secondly, the use of n-heptane as DI injected fuel and ethanol (with
low CN) as PFI fuel, was aimed to investigate on the possibility to realize (and to control) an
equal combustion timing for the two fuels.
In order, to realize a homogeneous air-fuel charge, the intake manifold was modified to provide
the desired extent of fuel port-injection (PFI). The port fuel injection system is described in
paragraph 5.2.
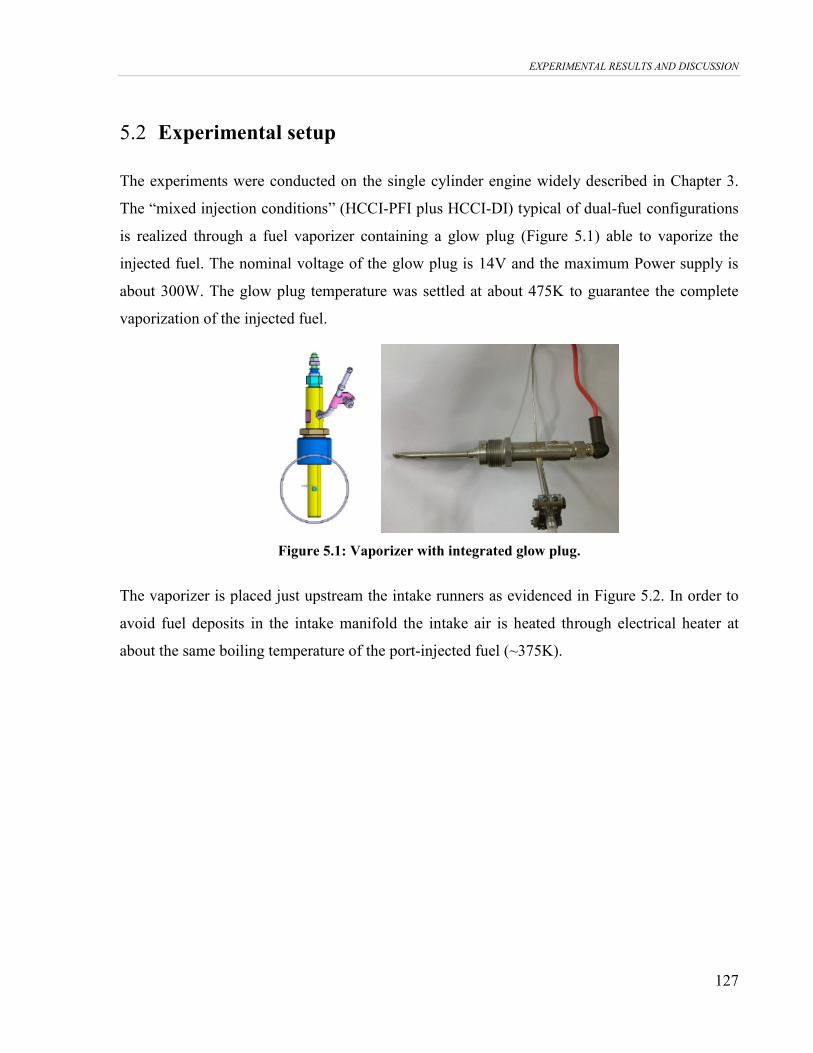
EXPERIMENTAL RESULTS AND DISCUSSION
127
5.2 Experimental setup
The experiments were conducted on the single cylinder engine widely described in Chapter 3.
The “mixed injection conditions” (HCCI-PFI plus HCCI-DI) typical of dual-fuel configurations
is realized through a fuel vaporizer containing a glow plug (Figure 5.1) able to vaporize the
injected fuel. The nominal voltage of the glow plug is 14V and the maximum Power supply is
about 300W. The glow plug temperature was settled at about 475K to guarantee the complete
vaporization of the injected fuel.
Figure 5.1: Vaporizer with integrated glow plug.
The vaporizer is placed just upstream the intake runners as evidenced in Figure 5.2. In order to
avoid fuel deposits in the intake manifold the intake air is heated through electrical heater at
about the same boiling temperature of the port-injected fuel (~375K).

EXPERIMENTAL RESULTS AND DISCUSSION
128
Figure 5.2: Vaporizer placed upstream the runners.
The control and the power unit of the vaporizer were realized in Istituto Motori (Figure 5.3). The
control unit is able to regulate the fuel pump frequency and therefore the fuel mass flow rate
delivered to the vaporizer. Moreover, the unit permits to manage the heating time of the glow
plug.
Figure 5.3: Control unit and power unit.
5.3 Fuels
As already stated, the choice of using n-heptane (n-C7H16, single component fuel) for direct
injection and for port fuel injection(or premixed) fuel derives from the need to isolate the effects

EXPERIMENTAL RESULTS AND DISCUSSION
129
of different premixing levels and the resulting interaction between the charge and the fuel spray.
N-heptane has a relatively low boiling point and excellent ignition ability (CN 56, equivalent to
that of diesel fuel).
The use of ethanol as a PFI fuel was due to its low CN that permits to some extent a better
control of the combustion phasing as described further.
The physical and chemical characteristics of the used fuels are reported in Table 6.1. Part of this
table is reported in Table 5.1.
Feature Method n-heptane Ethanol
Density @ 15 °C [kg/m3] EN ISO
12185 684 790
Viscosity a 40 °C [mm2/s] EN ISO
3104 0.51 1.01
Oxydation Thermal Stability
a 110°C h
EN
14112 -
Cetane Number EN ISO
5165 56 <10
Low Heating Value [MJ/kg] ASTM
D3338 44 30
Distillation
[°C] IBP 98 78
°C 10% vol. -
°C 50% vol. -
°C 90% vol. -
°C 95% vol. -
°C FBP 98 78
Carbon
[molar%] 5991 83.9 52.2
Hydrogen
[molar%] 5991 16.1 13.1
Nitrogen
[molar%]] 5991 0
Oxygen
[molar%] 5991 0 34.7
Table 5.1: Main fuel properties.
5.4 Experimental procedure
In this work, the characteristics of premixed combustion mode and the effects of different
premixed ratios were investigated. Different premixed ratios were obtained by adjusting the

EXPERIMENTAL RESULTS AND DISCUSSION
130
quantities of premixed fuel (PFI) while keeping a fixed direct injected fuel (DI) quantity at a
constant engine speed.
Starting from DI conditions, the premixed quantity is gradually increased rising the premixed
ratio. Premixed combustion mode is characterized by a premixed ratio defined using the
following equations:
( )
( )
where and indicate the mass flow rate of premixed fuel (PFI) and directly injected fuel
(DI) respectively; whereas hp and hd are the lower heating values of the PFI and DI fuels.
Equation (1) and (2) define the premixed ratio in terms of mass and energy respectively.
Obviously if the DI fuel and PFI fuel are the same, the equation (1) and (2) coincide.
Thus, is equivalent to fully HCCI and means the conventional DI. indicates
the total fuel equivalence ratio.
The tests were performed starting from the reference test points reported in Table 5.2.
Test point15
RPM [1/min] IMEP [bar] BMEP [bar] MBF50% [CA]
1500x3(2) 1500 3.2 2 12
2000x7(5) 2000 6.9 5 15
Table 5.2: Reference points
Moreover, a direct injection (DI) strategy of one shot per cycle was adopted in order to discern
the DI and PFI fuel effect on the combustion.
Starting from these operating conditions, a first set of experiments was performed in order to
evaluate the influence of on combustion process and engine performance at constant total fuel
equivalence ratio or, at constant IMEP in the tests with using ethanol as PFI fuel. Therefore,
maintaining the value of or IMEP, equal to the value of the reference starting point, PFI fuel
was increased and DI fuel “proportionally” decreased.
15
The values inside the parenthesis are referred to the BMEP value. The graphs that follows, sometimes refer to
IMEP other times to BMEP(i.e. 1500x2 or 1500x3).

EXPERIMENTAL RESULTS AND DISCUSSION
131
The second set of tests was addressed to investigate the effect of PFI fuel addiction on
combustion evolution at fixed DI injected fuel mass. Different premixed ratios are obtained by
increasing the quantities of PFI fuel while keeping intact the DI parameters (fuel mass, SOI and
injection pressure). In this way test exhibits increased values of premixed ratio, and vary for
MBF50%, IMEP and global fuel equivalence ratio .
Temperatures of intake air, oil and coolant water were held stable during the experiments. As
mentioned before, due to the need to isolate the effects of different factors on combustion, EGR
was not applied in this experimental campaign.
As already, hint, the test were performed using n-heptane as DI fuel and n-heptane or ethanol as
a PFI fuel:
Case1: n-heptane (DI) – n-heptane (PFI)
Case2: n-heptane (DI) – ethanol (PFI)
5.5 Results and discussion
5.5.1 Case1: n-heptane (DI) – n-heptane (PFI)
1500prm at fixed 3.2bar IMEP
The performed test points are summarized in Table 5.3. Moreover, the point 1500rpm@3bar
IMEP (#1) correspond to the reference point reported in Table 5.2 and represent one of the most
significant test point in terms of emissions computation(see Figure 4.2). Starting from these
operating conditions, a first set of experiments was performed in order to evaluate the influence
of on combustion process and engine performance at constant total equivalence ratio.
Therefore, maintaining the value of equal to the value in DI combustion (test #1), premixed
combustion mode with a mixed PFI-DI injection (test #2, 3 and 4) and a fully homogeneous
HCCI combustion with only PFI injection (test #5) were reproduced.

EXPERIMENTAL RESULTS AND DISCUSSION
132
Test Inj. DI Fuel
[kg/h]
PFI Fuel
[kg/h] rp Φ
IMEP
[bar]
1 DI 0.4 0 0 0.28 3.2
2 PFI+DI 0.30 0.13 0.30 0.28 3.2
3 PFI+DI 0.23 0.19 0.46 0.28 3.2
4 PFI+DI 0.18 0.27 0.64 0.28 3.2
5 PFI 0 0.39 1.00 0.28 2.2
Table 5.3: Experimental engine test conditions with constant ɸ.
Figure 5.4 shows the pressure and heat release rate (RoHR) comparisons of different combustion
ignitions: DI combustion (test #1, rp=0), premixed combustion (test #2, 3 and 4) and fully HCCI
combustion (test #5) at equal to 0.28. It is worth to notice that, while tests from #1 to #4
produce the same value of IMEP, HCCI mode (test #5) presents a sensible reduction of the
thermodynamic efficiency(Figure 5.5) and, as a consequence, a sensible reduction of the
measured IMEP. HCCI combustion mode shows, as expected, higher peak pressure (Figure 5.4)
and thermodynamic temperature (Figure 5.4, bottom right). As well-known curves of heat
release rate (ROHR) show that test #3 is characterized by the expected two-stage combustion of
fully HCCI conditions, while test #2, with a premixed ratio of 0.45, exhibits three-stage
combustion. In agreement with many results [132], the combined HCCI-DI and HCCI-PFI
combustion exhibits three-stage combustion. Curves of heat release rate evidences in fact a
typical two-stage auto-ignition of n-heptane due to PFI fuel combustion and a third diffusive
combustion due to the directly injected fuel (HCCI-DI). Heat release rate for HCCI combustion
shows low temperature reactions (LTR) in the cool flame (NTC) region at about 800K and high
temperature reactions (HTR) at about 1000K in agreement with [134].

EXPERIMENTAL RESULTS AND DISCUSSION
133
Figure 5.4: In-cylinder pressure, RoHR and thermodynamic bulk temperature (bottom right)
evolution for the test cases with a fixed global fuel equivalence ratio with different levels of
premixing charge.
In Figure 5.5 are reported the emission indices and efficiencies. In particular, the HC and CO
emissions increase with increasing the premixing ratio (rp) whereas the NOx decrease
drastically. Conversely, in contradiction with the expected results, when the combustion become
more premixed, albeit the smoke is at very low level (smoke•100), it increases. This could be
explained by the following considerations:, more premixed become the combustion more the
local temperature can be assumed equal to the bulk temperature; moreover, increasing rp, the
bulk combustion temperature increase at about 1800 - 1900K (Figure 5.4, bottom right).
Therefore referring to the Kamimoto and Bae diagram(Figure 2.4) the local temperature in the
case of higher rp is lower than the NOx formation temperature but not out of the soot formation
zone. Thus, probably in some regions of the in-cylinder charge, the local fuel-air ratio ɸ is at
values in the low soot formation area. Analogous results are stated in [132] where the higher
local ɸ are justified with the fact that higher is the fuel (n-heptane) injected in PFI conditions,
less is the in-cylinder oxygen concentration therefore the premixed charge play a similar role as
EGR, when the DI combustion start. Furthermore, the boundary regions of the DI fuel spray are
at higher pressure and temperatures causing a poorer evaporation of the fuel core of the spray
favouring the soot formation. For rp=1 this considerations are less valid and probably, the not
expected higher soot is caused by a poorer evaporation of the high quantity of PFI fuel causing

EXPERIMENTAL RESULTS AND DISCUSSION
134
fuel rich regions inside the cylinder; besides the lower combustion temperature does not permit
the complete oxidation of the formed soot.
The decrease of the fuel efficiency is due to the increase of CO and HC emissions increasing the
premixed ratio (Figure 5.4) but, also to the difficulty to control the combustion phasing mainly
in fully PFI condition(rp=1). In fact, Figure 5.6 shows the even more delayed start of injection
(SOI) of the direct injection (DI) as the premixed ratio increase in order to keep constant the
thermodynamic efficiency and at the same level of the DI case. In fully PFI condition, due to the
high auto-ignition tendency of n-heptane the combustion is advanced to values before top dead
center(TDC) (Figure 5.6) lowering the thermodynamic and thus the fuel efficiency16
(Figure
5.4).
Figure 5.5: Emission indices and efficiencies for the test cases with a fixed global fuel equivalence
ratio (Φ=0.28) with different levels of premixing charge.
16
See the definitions of the efficiencies in Appendix B.

EXPERIMENTAL RESULTS AND DISCUSSION
135
Figure 5.6: MBF50%, thermodynamic efficiency and SOI-DI as a function of premixed ratio (rp)
at constant Φ.
1500prm at fixed DI (3.2bar) and adding PFI
The second set of tests was addressed to investigate the effect of PFI fuel addiction on
combustion evolution of a fixed DI injected fuel mass (test #1, Table 5.4). Engine tests from #2
to #4 were performed with different premixed ratios obtained by increasing the quantities of PFI
fuel while keeping intact the DI parameters (fuel mass, SOI and injection pressure). In this way
test points from #2 to #4 exhibits increased values of premixed ratio, and vary for MBF50%,
IMEP and global fuel equivalence ratio . Moreover, the load was limited at 5.8bar of IMEP
because knocking occurs for higher loads.
Test Inj. DI Fuel
[kg/h]
PFI Fuel
[kg/h] rp Φ
IMEP
[bar]
1 DI 0.4 0 0 0.28 3.2
2 PFI+DI 0.4 0.1 0.19 0.35 4.0
3 PFI+DI 0.4 0.2 0.34 0.43 4.8
4 PFI+DI 0.4 0.4 0.45 0.5 5.8
Table 5.4: Experimental engine test conditions with constant DI and increasing ɸ.
Curves of Figure 5.7 summarize results relative to the effect of partial premixing. The premixed
ratio was increased and the total fuel mass was increased through the addiction of PFI n-heptane
to a fixed in-bowl injected fuel mass.

EXPERIMENTAL RESULTS AND DISCUSSION
136
In agreement with literature [132], experimental results show that, without EGR; the ignition
timing of low temperature cool flame is poorly influenced by the variation of rp and Φ, and
occurs at about 35° BTDC. On the contrary, with the rise of rp, the second stage of combustion
(HHR-PFI) advances significantly and shows progressive heat release increment of HCCI
combustion. In addition, the peak values of cylinder pressure increase with the increase of
premixed ratio.
Considering the combustion of the direct injected fuel mass, the third peak of heat release rate is
typical of a diffusive combustion. When rp is increased from 0 (test #1) to 0.25 (test #4), the
maximum peak of RoHR of DI conditions is significantly reduced, due to a sensible reduction of
ignition delay time of the DI fuel. As evidenced in the Figure 5.7, the phasing of diffusive
combustion of the DI fuel is not influenced by a further increase of rp. Ma et al. [132] attribute
this behaviour to a resulted minimal diffusive ignition delay time deriving from high in-cylinder
temperature and pressure conditions produced by HCCI combustion. With respect to such
interpretation, it is worth to precise that such result depends on the strong reduction of the
chemical ignition delay of the DI fuel so the physical ignition delay becomes the controlling
factor of diffusive combustion.
Figure 5.7: In-cylinder pressure and RoHR evolution at 1500rpm with variable global fuel
equivalence ratio and different levels of premixing charge.

EXPERIMENTAL RESULTS AND DISCUSSION
137
In Figure 5.8, the emission indices and efficiencies are reported. In particular, for the test points
from #1 to #3 the HC, CO and smoke emissions increases and the NOx decrease. Such trends
are in agreement with the results at constant ɸ and due to the combined effect of PFI injection
and charge premixing. The efficiencies are more or less as the DI one.
The emissions of test #4 show a trend inversion. In particular, the HC, CO and smoke emissions
are lower compared to the previous cases due to the higher in-cylinder temperatures (higher
load) that oxidize HC and smoke and permit a more complete conversion of CO to CO2.
As for the previous cases, the decrease of fuel efficiency is attributable to the difficulty to
control the combustion phasing. In fact, pressure and RoHR traces (Figure 5.7) show an advance
in combustion timing, away from the optimum value, leading to a lower thermodynamic
efficiency17
(Figure 5.8).
Figure 5.8: Emission indices and efficiencies at 1500rpm with variable global fuel equivalence ratio
for different premixing ratio.
The experimental results were provided for the calibration of the combustion model using
OpenFoam as numerical tool. Figure 5.9 reports the evolutions of chemical species produced
during the combustion and computed after the calibration.[21].
17
See the definitions of efficiencies in Appendix B.

EXPERIMENTAL RESULTS AND DISCUSSION
138
Figure 5.9: Computed histories of significant chemical species and the corresponding RoHR for
case #4 (PFI+DI) IMEP 5.8bar.
Looking at the histories of significant chemical species in case #4 (Table 5.4), together with the
corresponding RoHR, it is possible to follow the ignition phenomena of the premixed fuel
fraction. The first RoHR peak, corresponding to the first reduction in the fuel concentration, is
characterized by a typical low temperature dynamics, as fuel consumption corresponds to a
marked formaldehyde increase and the hydrogen peroxide accumulation. Moreover, a first step
of carbon monoxide increment takes place, as visible from the respective profile at 30 CAD
BTDC. At about 15 CAD BTDC the hydrogen peroxide decomposition, linked to the high
temperature branching event, determines the second stage of ignition, with the consequent OH
radicals release, the carbon monoxide oxidation and the complete fuel consumption. It is
interesting to notice that the high temperatures reached in this second event allow the survival of
0
50
100
150
200
250
Ro
HR
[J
/deg
]
-40 -30 -20 -10 0
CRANK ANGLE [deg]
0
0.001
0.002
0.003
MA
SS
FR
AC
TIO
N
0
0.0002
0.0004
0.0006
0.0008
0.0010
0.02
0.04
MA
SS
FR
AC
TIO
N
Fuel
CO2
H2O
CO
H2O2
CH2O
OH
O

EXPERIMENTAL RESULTS AND DISCUSSION
139
a certain amount of OH and O radicals, that, starting from 10 CAD BTDC, keep to decrease
quite gently: it follows that the subsequent directly injected fuel not only is admitted in a very
hot environment, but it is also set next to these active radicals, capable of greatly enhance its
ignition.
This is an example of how, the development of suitable numerical and reliable tools are
fundamental to provide additional information for an adequate comprehension of the complex
combustion phenomena of PCCI.
5.5.2 Case2: n-heptane (DI) – ethanol (PFI)
In this set of experiments, n-heptane is used as a direct injected fuel whereas ethanol is used as
port injected fuel. The use of ethanol as a PFI fuel derives from the possibility to use both a low
boiling fuel and an oxygenate renewable fuel. Moreover, ethanol has a very low CN that permits
to some extent a better control of the combustion phasing as described further.
The test procedure is similar to that used for the test with n-heptane. Different premixed ratios
were adopted by varying “proportionally” the quantities of DI and premixed fuel. In particular,
at constant IMEP varying the premixed ratio (varying the quantities of DI and PFI fuel) and at
constant DI fuel increasing the PFI fuel. These procedures are adopted starting from both the
reference points reported in Table 5.2. It is worth to note that since the DI and PFI fuels have
different energy content, the premixed ratio is defined in energy terms 18 (see equation (2),
paragraph 5.3). In fact, the energy content of ethanol at the same injected mass is much lower
than that of n-heptane. This is confirmed by Figure 5.10 that shows the correlation between rp
and . The lower LHV19
of ethanol (Table 5.1) lead to a higher injected mass compared to n-
heptane if certain energy is desired.
18
Using different fuels for DI and PFI injection it is preferable refer to the premixed ration in energy terms, see
equation (2). 19
Low heating value.

EXPERIMENTAL RESULTS AND DISCUSSION
140
Figure 5.10: Correlation between rp and rpe using n-heptane as DI fuel and ethanol as PFI fuel.
1500prm at fixed 3.2bar IMEP
The test points are summarized in Table 5.5. Moreover, the first test point, IMEP (#1)
corresponds to the reference point reported in Table 5.2. Starting from this point, the premixed
combustion was realized varying the DI and PFI fuels (test #2, 3 and 4 ) maintaining the IMEP
constant and equal to the value in DI combustion (test #1). Obviously it was not possible to
perform the fully HCCI with only ethanol.
Test Inj. DI Fuel
[kg/h]
PFI Fuel
[kg/h] rpe IMEP
[bar]
1 DI 0.39 0 0 3.2
2 PFI+DI 0.29 0.27 0.23 3.2
3 PFI+DI 0.21 0.39 0.28 3.2
4 PFI+DI 0.17 0.49 0.31 3.2
Table 5.5: Experimental engine test conditions at constant IMEP.
Figure 5.11 shows the pressure and heat release rate (RoHR) comparisons of different
combustion ignitions: DI combustion (test #1, =0) and premixed combustion (test #2, 3 and
4). In this case is not present the characteristic two-stage heat release of the premixed
combustions noted in the case of n-heptane as PFI fuel. The reason is the low auto-ignition
tendency (low CN) of ethanol that does not exhibits the low temperature heat release. Curves of

EXPERIMENTAL RESULTS AND DISCUSSION
141
heat release rate evidence in fact that, the combustion of the premixed charge starts when the DI
fuel auto-ignite. This allows a better control of the combustion phasing that is one of the
challenges of the HCCI application (see paragraph 2.2.5).
Increasing the premixed ratio, only a slight variation of the DI-SOI (direct start of injection) is
needed (Figure 5.13) to phase the combustion, and this evidence again the easier control of the
combustion using, as PFI, low CN fuels. The control of the combustion permits the keep almost
constant the thermodynamic efficiency (Figure 5.12, Figure 5.13). Therefore, the lower fuel
efficiencies for higher premixing ratios are linked only to the lower combustion efficiency
(higher CO and HC, thus ISFC). In fact, Figure 5.12 shows the expected higher CO and HC
increasing the premixed ratio.
Figure 5.11: In-cylinder pressure and RoHR evolution at 1500x3.2 varying the global fuel
equivalence ratio and for different premixing ratio.
Moreover, compared to Figure 5.5, where n-heptane was used as PFI fuel, the soot emission
decreases drastically. This can be recognized to the better mixing process (low CN-more time
available) and to the presence of intra-molecular oxygen of ethanol. In addition, the NOx
emission decreases, in some measure and increasing the premixed ratio. Probably for higher
premixing ratios, the NOx could be lower but in the performed tests, the mixing ratio was limit
at 0.23 due to the increase of combustion instability (COV~6.5, Figure 5.13).

EXPERIMENTAL RESULTS AND DISCUSSION
142
Figure 5.12: Emission indices and efficiencies for the test cases with a fixed IMEP=3.2bar for
different levels of premixing charge.
Figure 5.13: MBF50%, thermodynamic efficiency, COV and SOI-DI as a function of premixed
ratio rp, at 1500rpmx3.2bar IMEP.

EXPERIMENTAL RESULTS AND DISCUSSION
143
1500prm at fixed DI (3.2bar) and adding PFI
The second set of test, in the same way as with n-heptane, was addressed to investigate the
effect of PFI fuel addiction on combustion evolution at fixed DI injected fuel mass. Different
premixed ratios were obtained by increasing the quantities of PFI fuel while keeping intact the
DI parameters (fuel mass, SOI and injection pressure). In this way test exhibits increased values
of premixed ratio and IMEP. In particular the test point are summarized in Table 5.6
Test Inj. DI Fuel
[kg/h]
PFI Fuel
[kg/h] rpe IMEP
[bar]
1 DI 0.39 0 0 3.2
2 PFI+DI 0.39 0.16 0.15 4.0
3 PFI+DI 0.39 0.29 0.21 4.8
4 PFI+DI 0.39 0.45 0.25 5.8
5 PFI+DI 0.39 0.77 0.29 7.7
Table 5.6: Experimental engine test conditions at constant DI increasing PFI.
Figure 5.14 show the pressure traces, RoHR, emission and efficiencies. The RoHR show that
also increasing the PFI fuel, the combustion is phased with the DI combustion. Thus, in the case
of low CN fuels it is possible to control the combustion phase and then the thermodynamic
efficiency for higher loads. Again, the premixed energy ratio was limited by the increase of the
combustion instability (COV_IMEP) that reached values close to 10%.
Figure 5.14: Pressure, RoHR, emissions and efficiencies at constant DI and increasing PFI.

EXPERIMENTAL RESULTS AND DISCUSSION
144
Starting from the reference point at 3.2 bar IMEP, the HC and CO indices increase and the NOx
decrease as goes from 0 to 0.15. Then the ratio remains constant also for further increases of
the PFI fuel quantity. An important result is that at the same level of NOx, increasing the
proportion of ethanol the smoke decrease even more. Therefore, the oxygen effect (or rpe effect)
is evident in terms of smoke reduction without penalizing other emissions or the efficiencies.
2000prm at fixed 6.9bar IMEP
Figure 5.15 shows again that HC and CO increase as the premixed ratio increase but this time
NOx and smoke are clearly reduced without significant penalties in terms of fuel efficiency.
Therefore, the premixing and the oxygen effect are evident.
Figure 5.15: Pressure traces, RoHR emissions and efficiencies at 2000x6.9 at constant IMEP for
different levels of premixing ratio.
Thus, it can be stated that also for higher speeds, it is possible to control the combustion phase
with the use of ethanol as PFI fuel. The maximum COV was inside acceptable limits for the
highest premixed ratio (~3.5).
2000prm pilot-main injection strategy at higher loads
The pilot plus main strategies was used to assess the effect of the pilot injection on the
controllability of the combustion. Table 5.7 show the settings of the performed points.

EXPERIMENTAL RESULTS AND DISCUSSION
145
Test Inj. DI Fuel
[kg/h]
PFI Fuel
[kg/h] rpe SOImain
[Ca aTDC]
MBF50%
[Ca aTDC]
IMEP
[bar]
1 DI 1.15 0.00 0.00 -7.5 15 7.8
2 PFI+DI 0.99 0.27 0.12 -6.7 15 7.8
3 DI 1.30 0.00 0.00 -7.5 15 8.3
4 PFI+DI 1.40 0.40 0.15 -4.7 15 8.3
Table 5.7: Experimental engine test conditions pilot-main injection strategy.
Therefore, in Figure 5.16 are compared DI and DI+PFI strategies using a pilot plus main
injection for the direct injection. The continuous traces are referred to the DI+PFI injection
whereas the dashed traces refer to the DI. In the case of PFI (continuous traces), the start of pilot
injection is slightly delayed and this is probably due to the presence of ethanol in the intake
charge that perhaps reduce the pilot efficiency. Again, thanks to the low auto-ignition tendency
of the ethanol it was possible to settle the MBF50% to 15° Ca aTDC. Comparing the SOI values
of DI+PFI and DI combustion modes, it is possible to state that, even if the pilot combustion is
slightly delayed, part of the ethanol starts to burn before the DI - heat release occurs. Therefore,
the MBF50% without any adapting of the SOI, would advance. Thus, the presence of pilot
injection tends to advance the combustion phasing. This is an interesting result in terms of
combustion control that is one of the challenges of the premixed combustion.
Therefore, a deeper investigation with a parametric test procedure is necessary to find an
optimal combination in terms of timing and phasing of the pilot injection. Such approach could
be useful for additional information in terms of combustion control.

EXPERIMENTAL RESULTS AND DISCUSSION
146
Figure 5.16: In-cylinder pressure and RoHR comparison at 2000x7.8 and 2000x8.3 with and
without PFI.
However, both the lower efficiency of the pilot and the more premixed combustion lead to
higher HC, CO and smoke emissions. A slight decrease in terms of NOx is shown increasing the
premixed ratio compared to the DI conditions (Figure 5.17).
Figure 5.17: Emission indices and efficiencies comparison at 2000x7.8 and 2000x8.3 with and
without PFI.

EXPERIMENTAL RESULTS AND DISCUSSION
147
5.6 Nanoparticle emission from PFI-DI combustion
As already done in the previous chapter 4, measurements in terms of particle size distribution
were performed at 1500rpm 3.2bar IMEP using ethanol as PFI fuel and varying the premixed
ratio at constant IMEP. The results show similar trends as depicted in paragraph 4.7 for the DC
blend that is also a low CN oxy-fuel like ethanol. The main engine parameters of this test are
reported in Table 5.3.
Figure 5.18shows the PSDF (particle size distribution function measured at different premixed
ratios.
Figure 5.18: Particle size distribution measured at different premixed ratios.
The number of particles larger than 20nm strongly decreases when the port-HCCI was
performed. On the other hand, the nuclei mode decreases at the increasing of the premixed ratio
(rp) even if it remains higher with respect to the direct injection case. The better mixing and the
higher oxygen content of ethanol mainly contribute to the lower emissions of large particles.
Moreover, at the increasing of the rp the local in-cylinder temperature increases then the nuclei
particle concentration decreases.
0.0E+00
2.0E+07
4.0E+07
6.0E+07
8.0E+07
1.0E+08
1.2E+08
1 10 100 1000
DP [nm]
dN
/dlo
gD
p [1/c
m3]
rpe0
rpe0.23
rpe0.28
rpe0.31

EXPERIMENTAL RESULTS AND DISCUSSION
148
5.7 Conclusions
In the case of mixed combustion strategy, i.e. HCCI-DI and HCCI-PFI, the homogeneous
mixture is partially created in the intake system allowing more time for premixed fuel
evaporation and air mixing prior the auto-ignition through piston compression occurs. However,
mainly using low boiling fuels, an effective premixed charge can be formed. On the other hand,
high CN and low volatile fuels show limited premixing effects due their poor vaporizing
tendency. In fact, problems due to wall wetting can occur. In particular, the liquid fuel can enter
in to combustion chamber and can deposit on cylinder with a consequent increase of soot
formation or can cause the dilution of lube oil.
Therefore, the aim of this test campaign has to have a screening of the PFI impact on the HCCI
mixed combustion mode (DI+PFI).
Concerning the NOx emissions, it is possible to state that, premixing by port fuel injection has a
positive effect on NOx reduction for both, n-heptane and ethanol as PFI fuel. This trend derives
from the reduction of the local in-cylinder temperature because of an improved mixing process.
Concerning the soot emissions, different trends are observed. In the case of low boiling fuels
with high CN (n-heptane), the high auto-ignition tendency does not permit the formation of a
complete homogeneous charge. In fact, in the case of three-stage heat release, when the two
stage combustion occurs before the diffusive combustion (presence of DI injection), the oxygen
reduction and the higher pressures in the out-layer of the fuel spray lead to a poorer evaporation
of the fuel core. For higher loads, there are some evidences that, the smoke emissions reduce
due probably to the high in-cylinder temperature that permits a better soot oxidation of the DI
rich zones.
In the case of using ethanol, different trends are observed. The soot emissions are reduced at any
speeds and loads due to a combined factor of CN and oxygen effect. The lower CN permit an
improved mixing process therefore the local equivalence ratio tend to shift the operating region
out of the soot and NOx formation areas.
Concerning the combustion control, in the case of n-heptane as PFI fuel, due to its high auto-
ignition tendency, an excessively and uncontrolled advance in auto-ignition of the premixed

EXPERIMENTAL RESULTS AND DISCUSSION
149
charge are evidenced leading to a lower thermodynamic efficiency. Moreover, due to
uncontrolled self-ignition, knocking may occur at higher loads. Therefore, for both reasons, the
operating range was limited to lower loads.
The ethanol instead, thanks to its low CN, allows a very precise control of the auto-ignition time
and, by varying the premixed ratio, it is possible to cover a wide range of engine speeds and
loads In fact, in the performed tests, any significant advance of the main heat release can be
noted therefore the thermodynamic efficiency remain constant.
Besides, a multiple injection strategy appears to be beneficial in terms of start of combustion
control even if a deeper investigation is necessary to optimize the quantities and the phasing of
the injections to avoid excessive emission and efficiency penalties.
Concerning the particle distribution, using ethanol as PFI fuel, the particles larger than 23nm
tend to decrease as with DC blend. This could be an advantage to meet the future limits in terms
of number of particles number.

CONCLUSIONS
150
6 SUMMARY
The present study has focused to produce a detailed screening on the benefits and drawbacks on
the use of innovative fuels (as low CN oxy-fuels) and alternative fuel injection systems (as the
PFI technology) for the application of advanced combustion concepts as HCCI and PCCI.
The experimental activity was limited to several engine operating conditions but adequate for an
overall screening of the engine response in the working area subject to emission regulation.
A final summary of the research is reported in the following.
As general result, the oxygenated renewable fuels such as cyclic-oxygenated and ethanol are
suitable as PCCI-like fuel, taking also into account that their production chain seems mature for
medium/large scale application.
In the case of use low CN fuels in blend with diesel, high premixing levels can be reached but
combustion quality, in terms of stability, emissions and efficiency, is strongly affected by fuel
characteristics (e.g. volatility, aromatics, and oxygen content). In particular, it was evident that
the use of low CN and volatile fuels is very effective on the promotion of premixed combustion
as well as over-mixing, and as consequence on UHC emissions. This effect becomes critical in
those operating conditions where a pilot injection is required to control the combustion noise,
thus in the case of conventional injection strategy. Moreover, the lower volatility and the oxygen
content of the oxygenated fuel limits the over-mixing phenomena and simultaneously reduce the
soot formation rate. This result was particularly evidenced when a pilot injection and high EGR
rate were used in conjunction.
However, the overall result analysis indicates that critical engine working conditions for
emission and functionality can arise at very low CNs.
In the case of mixed combustion systems, i.e. DI-PFI, the homogeneous mixture is partially
created in the intake system allowing more time for premixed fuel evaporation and air mixing
prior the auto-ignition through piston compression occurs.

CONCLUSIONS
151
It was observed that mixed injection has a positive effect on NOx. This trend derives from the
reduction of the local in-cylinder temperature because of an improved mixing process.
Contrarily, different trends for soot emissions were observed. High CN number fuels increase
the soot emissions due their difficulties to realize well-premixed charges also using a PFI
injection. In the case of low CN oxy-fuel (such as ethanol), the soot emissions are reduced at
any speeds and loads due to combined factor of CN and oxygen effect.
Concerning the combustion control, low CN fuels allows a combustion overlapping of both the
PFI and DI fuel charge. This permits, in principle, a precise control of the auto-ignition time
and, by varying the premixed ratio, it is possible to cover a wide range of engine speeds and
loads.
Besides, a multiple injection strategy appears to be beneficial in terms of start of combustion
control even if a deeper investigation is necessary to optimize timing and phasing of the
injections to avoid excessive efficiency penalties.
In conclusion, the present analysis underlines that in the continuous development of PCCI
engines, the fuel properties and fuelling systems will play a fundamental role. To realize a more
precise control of the in-cylinder air-fuel charge, before and during the combustion, future fuels
and engine architectures have to be tailored to the desired combustion process.

REFERENCES
152
REFERENCES
[1] Emission Standards, European Union, www.dieselnet.com, accessed September 2011
[2] European Environment Agency (EEA), www.eea.europa.eu, accessed September 2011
[3] Cheah, L., Heywood, J.B., “Meeting U.S. passenger vehicle fuel economy standards in
2016 and beyond”, 2010, Energy Policy 39 (2011) 454–466.
[4] Heywood, J.B., “Internal combustion engine fundamentals”, McGraw-Hill, New York
1988.
[5] Health Effects Institute, “The Future of Vehicle Fuels and Technologies: Anticipating
Health Benefits and Challenges”, Communication 16, 2011.
[6] Website link: weather.about.com, accessed September 2011
[7] Piacentini, M., “Fundamental aspects of NOx storage-reduction catalysts for automotive
lean combustion engines”, Dissertation ETH Nr. 16830, Zurich 2006.
[8] Caruso, S., “Diesel Injection Analysis for New Premium Fuel Research and Emission
Reduction”, Dissertation UniNa, Naples 2010.
[9] Sjöberg, M., Dec., J., “An investigation into lowest acceptable combustion temperatures
for hydrocarbon fuels in HCCI engines. Proceedings of the Combustion Institute, 30 (2).
2719-2726, 2005
[10] Mayer, A., “Particle Filter Retrofit for all Diesel Engines”, Book, Technology &
Engineering, 2008.
[11] Rounce, P., “Engine performance and particulate matter speciation for compression
ignition engines powered by a range of fossil and biofuels”, Dissertation, 2011.
[12] Arcoumanis, C., Kamimoto, T., “Flow and Combustion in Reciprocating Engines”,
Springer, ISBN: 978-3-540-64142-1, 2009 –pag. 359-373
[13] Burtscher, H., “Physical characterization of particulate emissions from diesel engines: a
review”. Aerosol Science 36 (2005) 896–932.
[14] D.B. Kittelson, “Engines and Nanoparticles: A Review”, J. Aerosol Sci. 29 575–588, 1998.
[15] Lee R, Pedley J, Hobbs C. “Fuel Quality Impact on Heavy Duty Diesel Emissions—a
Literature Review”, SAE Paper 982649, 1998.
[16] Website: www.greencarcongress.it , accessed September 2011.
[17] Kreith, F., “Mechanical Engineering Handbook”, CRC Press LLC, 1999.
[18] Dijkstra, R., Di Blasio, G., Boot, M., Beatrice, C., Bertoli, C., “Assessment of the effect of
low cetane number fuels on a light duty CI engine: Preliminary experimental
characterization in PCCI operating condition” , SAE 2011-24-0053.
[19] Guido, C., Beatrice, C., Di Iorio S, Napolitano, P., Di Blasio, G., Vassallo, A., and
Ciaravino C., “Assessment of Closed-Loop Combustion Control Capability for Biodiesel

REFERENCES
153
Blending Detection and Combustion Impact Mitigation for an Euro5 Automotive Diesel
Engine”, SAE 2011-01-1193, doi:10.4271/2011-01-1193.
[20] Guido, C., Beatrice, C., Di Iorio, S., Fraioli, V., Di Blasio, G et al., “Alternative Diesel
Fuels Effects on Combustion and Emissions of an Euro5 Automotive Diesel Engine”, SAE
Int. J. Fuels Lubr. 3(1):107-132, 2010, doi: 10.4271/2010-01-0472.
[21] Briani, M., Fraioli, V., Migliaccio, M., Di Blasio G., Lucchini, T., Ettore, D., “Multi-
Dimensional Modelling of Combustion in Compression Ignition Engines Operating with
Variable Charge Premixing Levels”, doi:10.4271/2011-24-0027, 2011.
[22] Di Blasio, G., Beatrice, C., Dijkstra, R., Boot, M., “Low cetane number renewable oxy-
fuels for premixed combustion concept application: experimental investigation on a light
duty diesel engine”. SAE Paper 12PFL-0689, 2012, submitted paper.
[23] Sheehan, J., Camobreco, V., Duffield, J., Graboski, M., and Shapouri, H., “An Overview
of Biodiesel and Petroleum Diesel Life Cycles”, NREL, 1998.
[24] R. Bosch GmbH, “Diesel-Engine Management”,4th
Edition, Bentley Publishers, 2005.
[25] R. Imarisio, D. Ivaldi, M.G. Lisbona, M.Tonetti, “Technologies towards Euro 6
Passenger Car Diesel Emissions Standards”, ATA Congress, 2006.
[26] Dec J.E., 2009, “Advanced compression-ignition engines ‒ understanding the in-cylinder
processes”, Proceedings of the Combustion Institute 32 (2009) 2727–2742.
[27] Yao, M., Zheng, Z., Liu, H., “Progress and recent trends in homogeneous charge
compression ignition (HCCI) engines”, Progress in Energy and Combustion Science, 2009.
[28] Yoshihara Y and Nishiwaki K (2004), “A numerical analysis of knocking phenomena in
an SI engine”, J. Combust. Soc. Jpn., Vol. 46, No. 136, pp. 71–81.
[29] Inagaki, K., Fuyuto, T, et al., “Dual-fuel PCI combustion controlled by in-cylinder
stratification of ignitability”, SAE Paper No. 2006-01-0028.
[30] Nakagome K., Shimazaki N., et al. “Combustion and emission characteristics of premixed
lean diesel combustion engine”, SAE Paper No. 970898.
[31] Eng JA., “Characterization of pressure waves in HCCI combustion”, SAE paper2002;01-
2859; 2002.
[32] Sakai A et al., “Improvements in premixed charge compression ignition combustion and
emissions with lower distillation temperature fuels”, Int. J. Engine Res., Vol. 6, No. 5, pp.
433–442 (2005).
[33] Stanglmaier RH, Roberts CE., “Homogeneous charge compression ignition (HCCI):
benefits, compromise, and future engine applications”, SAE paper 1999;01-3682; 1999.
[34] Peng Z., Zhao H. and Ladommatos N., “Effect of air/fuel ratios and EGR rates on HCCI
combustion of n-heptane, a diesel type fuel”, SAE Paper No. 2003-01-0747.
[35] Hasegawa R, Yanagihara H., “HCCI combustion in DI diesel engine”. SAE paper 2003-
01-0745.

REFERENCES
154
[36] Zhao F, Asmus TW, Assanis DN, Dec JE, Eng JA, Najt PM., “Homogeneous charge
compression ignition (HCCI) engines: key research and development issues”. USA:
Society of Automotive Engineers, Inc.; 2003.
[37] Onishi S, Jo SH, Shoda K, Jo PD, Kato S., “Active thermo-atmosphere combustion
(ATAC)-A new combustion process for internal combustion engines”, SAE Paper 790501,
1979.
[38] Yanagihara H., Proceedings of the IFP International Congress on a New Generation of
Engine Combustion Processes for the Future, Paris, 2001, pp. 34.
[39] M. Noguchi, Y. Tanaka, T. Tanaka, Y. Takeuchi, “A Study on Gasoline Engine
Combustion by Observation of Intermediate Reactive Products during Combustion”, SAE
Technical Paper 790840, (1979).
[40] Aoyama T, Hattori Y et al., “An experimental study on premixed-charge compression
ignition gasoline engine”, SAE Paper No. 960081.
[41] Yanagihara H., “A simultaneous reduction of NOx and soot in diesel engines under a new
combustion system (Uniform bulky combustion system UNIBUS)”, 17th international
Vienna motor symposium, Combustion Institute of Japan, 1996.
[42] Nakagome K, Shimazaki N et al., “Combustion and emission characteristics of premixed
lean diesel combustion engine”, SAE Paper No. 970898.
[43] Takeda Y et al., “Emission characteristics of premixed lean combustion with extremely
early staged fuel injection”, SAE Paper No. 961163.
[44] Sasaki S., Ito T. and Iguchi S., “Smoke-less rich combustion by low temperature oxidation
in diesel engines. Aachen colloquium automobile and engine technology”, Aachen, 767,
2000.
[45] Shimazaki N et al., “Dual mode combustion concept with premixed diesel combustion by
direct injection near top dead center”, SAE Paper No. 2003-01-0742.
[46] Harada A, Shimazaki N, Sator, S, Miyamoto T, Akagawa H, Tsujimura K. “The effects of
mixture formation on premixed lean diesel combustion”, SAE paper 980533; 1998.
[47] Kimura, S., Aoki, O., Ogawa, H., Muranaka, S.,Enomoto, Y., “New Combustion Concept
for Ultra-Clean and High-Efficiency Small DI Diesel”. SAE Technical Paper 1999-01-
3681, (1999).
[48] Hasegawa R., and Yanagihara H., “HCCI Combustion in DI Diesel Engine”, SAE
Technical Paper 2003-01-0745.
[49] Henle A, Bittlinger G, Benz C, Stein JO and Sattelmayer T., “Homogeneous Operating
Strategies in a DI Diesel Engine With Pent Roof Combustion Chamber and Tumble
Charge Motion: Studies on a Single-Cylinder Test-Engine and an Optical Access Engine”,
SAE Technical Paper 2005-01-0181, (2005).
[50] Haas S, Bargende M and Berner HJ, “Ideal Homogeneous Combustion versus Partly
Homogeneous Combustion for PC Diesel Engines”. SAE Technical Paper 2007-24-0016,
(2007).

REFERENCES
155
[51] L. Hildingsson, H. Persson, B. Johansson R. Collin, J.Nygren, M. Richter, M. Aldén R.
Hasegawa, H. Yanagihara, “Optical Diagnostics of HCCI and UNIBUS Using 2-D PLIF
of OH and Formaldehyde”, SAE Technical Paper 2005-010175, (2005).
[52] Akagawa, H., Miyamoto, T., Harada, A., Sasaki, S., Shimazaki, N., Hashizume, T.,
Tsujimura, K., “Approaches to Solve Problems of the Premixed Lean Diesel Combustion”,
SAE Technical Paper 1999-01-0183, (1999).
[53] Ra, Y., Reitz, R., “The Use of Variable Geometry Sprays With Low Pressure Injection for
Optimization of Diesel HCCI Engine Combustion”, SAE Technical Paper 2005-01-0148,
(2005).
[54] Simescu S., Fiveland S. and Dodge L., “An Experimental Investigation of PCCI-DI
Combustion and Emissions in a Heavy-Duty Diesel Engine”, SAE Technical Paper 2003-
01-0345.
[55] Midlam-Mohler S., Haas S., Guezennec Y., Bargende M, Rizzoni, G. and Berner HJ,
“Mixed-mode Diesel HCCI-DI with external mixture preparation”, FISITA 2004 World
Automotive Congress.
[56] Kim DS, Kim MY and Lee C., “Reduction of Nitric Oxides and Soot by Premixed Fuel in
Partial HCCI Engine”, Journal of Engineering for Gas Turbine and Power, Vol. 128,
pp.497-505, 2006.
[57] Canova M., Midlam-Mohler S., Guezennec Y., Rizzoni, G., Garzarella L., Ghisolfi M. and
Chiara F., “Experimental Validation for Control Oriented Modeling of Multi-Cylinder
HCCI Diesel Engines”, Proceedings of IMECE’06, ASME (2006).
[58] Canova M., Midlam-Mohler S., Guezennec Y. and Rizzoni G., “Theoretical and
Experimental Investigation on Diesel HCCI Combustion with External Mixture Formation,
International Journal of Vehicle Design”, Vol. 44, No. 1/2, (2007).
[59] Canova, M., Garzarella, L., Ghisolfi, M., Midlam-Mohler, S., Guezennec, Y., and Rizzoni,
G., “A mean-value model of a turbocharged HCCI diesel engine with external mixture
formation”, ICE05 7th International Conference on Engines for Automobile, (2005).
[60] Canova, M., Chiara, F., Flory, M., Midlam-Mohler, S., Guezennec, Y., Rizzoni, G.,
“Dynamics and Control of DI and HCCI Combustion in a Multi-Cylinder Diesel Engine”,
5th IFAC Symposium on Advances in Automotive Control, (2007).
[61] Lee CS, Lee KH, Kim DS, “Effect of premixed ratio on nitric oxide emission in diesel
engine”, SAE Technical Paper 2001-01-1806, (2001).
[62] Kim DS, Kim MY, Lee CS, “Effect of premixed gasoline fuel on the combustion
characteristics of compression ignition engine”, Energy Fuels 2004;18:1213–9, (2004).
[63] Kim DS, Kim MY, Lee CS, “Combustion and emission characteristics of partial
homogeneous charge compression ignition engine”, Comb. Sci. Technol. 2005;177:107–
25, (2005).
[64] Hisakazu Suzuki, Noriyuki Koike and Matsuo Odaka, “Combustion Control Method of
Homogeneous Charge Diesel Engines”, SAE 980509;

REFERENCES
156
[65] Kenji Shigetoyo, Mari Nagae, Akane Yoshida and Norimasa Iida, “Potential of Thermal
and Mixing Stratification for Reducing Pressure-rise rates in HCCI Engines”, HC2-1,
COMODIA 2008.
[66] Allen J, Law D., “Variable valve actuated controlled auto-ignition: speed load maps and
strategic regimes of operation”, SAE Technical Paper 2002-01-0422, (2002).
[67] Petter Strandh, Johan Bengtsson, Rolf Johansson, Bengt Johansson, “Variable valve
actuation for timing control of a homogeneous charge compression ignition engine”, SAE
Technical Paper 2005-01-0147, (2005).
[68] Fredrik Agrell, Hans-Erik Ångström, Bengt Eriksson, Jan Wikander, Johan Linderyd,
“Transient control of HCCI through combined intake and exhaust valve actuation”, SAE
Technical Paper 2003-01-3172, (2003).
[69] Christensen M, Hultqvist A, Johansson B., “Demonstrating the multi-fuel capability of a
homogeneous charge compression ignition engine with variable compression ratio”, SAE
Technical Paper 1999-01-3679, (1999).
[70] Ryan T., Callahan T., Mehta D., “HCCI in a variable compression ratio engine-effect of
engine variables”, SAE Technical Paper 2004-01-1971, (2004).
[71] Hyvonen J., Haraldsson G., Johansson B., “Operating range in a multi-cylinder HCCI
engine using variable compression ratio”, SAE Technical Paper 2003-01-1829, (2003).
[72] Green RM, Cernansky NP, Pitz WJ, Westbrook CK. “The role of low temperature
chemistry in the auto-ignition on n-butane”. SAE paper 872108; 1987.
[73] Addargarla S, Henig Y, Wilk RD, Miller DL, Cernansky NP., “Effect of fuel–air mixture
stressing on pre-ignition heat release in a knock research engine”, SAE paper 892082;
1989.
[74] Sabia P et al., “Modeling Negative Temperature Coefficient region in methane oxidation”,
Fuel (2011), doi:10.1016/j.fuel.2011.07.026, article in press.
[75] Dae S. K. and Chang S. L., “Effect of n-Heptane Premixing on Combustion
Characteristics of Diesel Engine”, Energy & Fuels 2005, 19, 2240-2246.
[76] Beatrice C., Di Iorio S., “State of the art of the technology of the “Diesel HCCI Port Fuel
Injection Engines”, FIRB 2006 RBIP069JBE_001, 2008.
[77] Najt PM, Foster DE. “Compression ignited homogeneous charge combustion”, SAE
paper 830264; 1983.
[78] Noguchi M, Tanaka T, Takeuchi Y., “A study on gasoline engine combustion by
observation of intermediate reactive products during combustion”, SAE paper 790840.
[79] Akihama K., Takatori Y. and Inagaki K., “Mechanism of the smokeless rich diesel
combustion by reducing temperature”. SAE Paper No. 2001-01-0655.
[80] Kamimoto T. and Bae M., “High combustion temperature for the reduction of particulate
in diesel engines”, SAE Paper No. 880423.

REFERENCES
157
[81] Mueller CJ, Upatnieks A. “Dilute clean diesel combustion achieves low emissions and
high efficiency while avoiding control problems of HCCI”, 11th
Annual diesel engine
emissions reduction (DEER) conference; 2005.
[82] Nakagome K, Shimazaki N et al., “Combustion and emission characteristics of premixed
lean diesel combustion engine”, SAE Paper No. 970898.
[83] Yanagihara H “A simultaneous reduction of NOx and soot in diesel engines under a new
combustion system (Uniform bulky combustion system UNIBUS)”, 17th international
Vienna motor symposium, Combustion Institute of Japan, 1996.
[84] Takeda Y et al. (1996) Emission characteristics of premixed lean combustion with
extremely early staged fuel injection. SAE Paper No. 961163.
[85] Kimura S, Ogawa Y, Matsui Y and Enomoto Y., “An experimental analysis of low
temperature and premixed combustion for simultaneous reduction of NOx and particulate
emissions in direct injection diesel engines”, Int. J. Engine Res., Vol. 3, No. 4, p. 249,
2002.
[86] Kimura S et al., “A new concept of combustion technology in small DI diesel engines”,
JSAE Paper No. 9732513. 1996.
[87] Sasaki S, Ito T and Iguchi S., “Smoke-less rich combustion by low temperature oxidation
in diesel engines”, Aachen colloquium automobile and engine technology, Aachen, 767,
2000.
[88] Idicheria, C. A. and Pickett, L. M., “Soot formation in diesel combustion under high-EGR
conditions”, SAE Paper No. 2005-01-3834.
[89] Kawamoto et al, “Combination of Combustion Concept and Fuel Property for Ultra-
Clean DI Diesel”, SAE Paper 2004-01-1868.
[90] Azimov U.B., Kim K.S., Jeong, D.S. and Lee Y.G., “Evaluation of low-temperature diesel
combustion regimes with n-heptane fuel in a constant volume chamber”, International
Journal of Automotive Technology, Vol.10, No.3, pp.265-276 (2009) doi:
10.1007/s12239−009−0031−3.
[91] Bertoli C., Beatrice C., Di Lorenzo A. (2006) “The evolution of the diesel combustion
system toward the near zero emission goal” Int. Journal of Vehicle Design, 41 (1-4), pp.
3-17. ISSN 0143-3369. Interscience Publishers Editor.
[92] Lu X., Han D., Huang Z., “Fuel design and management for the control of advanced
compression-ignition combustion modes”, Progress in Energy and Combustion Science 37
(2011) 741-783.
[93] Ryan III TW, Callahan TJ. “Homogeneous charge compression ignition of diesel fuel”.
SAE paper 961160; 1996.
[94] Gray III AW, Ryan III TW. “Homogeneous charge compression ignition (HCCI) of diesel
fuel”. SAE paper 971676; 1997.

REFERENCES
158
[95] Christensen M, Hultqvist A, Johansson B. “Demonstrating the multi fuel capability of a
homogeneous charge compression ignition engine with variable compression ratio”. SAE
paper 1999-01-3679; 1999.
[96] Junjun Ma, Xingcai Lü, Libin Ji, Zhen Huang, “An experimental study of HCCI-DI
combustion and emissions in a diesel engine with dual fuel”, International Journal of
Thermal Sciences 47 (2008) 1235–1242.
[97] Suyin Gan, Hoon Kiat Ng, Kar Mun Pang, “Homogeneous Charge Compression Ignition
(HCCI) combustion: Implementation and effects on pollutants in direct injection diesel
engines”, Applied Energy 88 (2011) 559–567.
[98] Su W., Zhang, “Mixing Enhancement by a Bump Ring in a Combustion Chamber for
Compound Combustion”, Sae Paper 2005-01-3721
[99] Dec JE., “Advanced compression-ignition engines-Understanding the in-cylinder
processes”, Proceedings of the Combustion Institute 32 (2009) 2727-2742.
[100] Lu XC., Chen W., Huang Z., “A fundamental study on the control of the HCCI
combustion and emissions by fuel design concept combined with controllable EGR. Part 2.
Effect of operating conditions and EGR on HCCI combustion”, Fuel 84 (2005) 1084-1092.
[101] Website link: www.cambustion.com, accessed October 2011.
[102] Boot M.D., Frijters P., Luijten C., Somers B., Baert R., Donkerhoek A.J., Klein-Douwel
R.J.H., Dam N., 2009, “Cyclic Oxygenates: A New Class of Second-Generation Biofuels
for diesel Engines?”, Eindhoven University of Technology, Energy & Fuels 23, 1808-
1817
[103] Bradley D., 2009, “Combustion and the design of future engine fuels”, JMES 50TH
ANNIVERSARY ISSUE PAPER
[104] Kalghatgi G.T., Risberg P., Ångström H., 2007, “Partially Pre-Mixed Auto-Ignition of
gasoline to Attain Low smoke and Low NOx at High Load in a Compression Ignition
Engine and Comparison with a diesel Fuel”, SAE 2007-01-0006
[105] Han D., Ickes A. M., Assanis D. N., Huang Z., Bohac S. V., “Attainment and Load
Extension of High-Efficiency Premixed Low-Temperature Combustion with Dieseline in a
Compression Ignition Engine”, Energy Fuels, 2010, 24 (6), pp 3517.
[106] Starck L., Lecointe B., Forti L., Jeuland N., 2010, “Impact of fuel characteristics on HCCI
combustion: Performances and emissions”, Fuel 89 (2010) 3069-3077.
[107] Prikhodko V. Y., Curran S. J., Barone T. L., Lewis S. A., Storey J. M., Cho K., Wagner R.
M., Parks J. E., “Emission Characteristics of a Diesel Engine Operating with In-Cylinder
Gasoline and Diesel Fuel Blending”, SAE 2010-01-2266.
[108] Hanson R. M., Kokjohn S. L., Splitter D. A., Reitz R. D., “An Experimental Investigation
of Fuel Reactivity Controlled PCCI Combustion in a Heavy-Duty Engine”, SAE 2010-01-
0864.
[109] Kweon C.-B., Foster D. E., Shibata G., “The Effects of Oxygenate and Gasoline-Diesel
Fuel Blends on Diesel Engine Emissions”, SAE 2010-01-0864.

REFERENCES
159
[110] Zhong S., Wyszynski M.L., Megaritis A., Yap D., Xu H., “Experimental Investigation
into HCCI Combustion Using Gasoline and Diesel Blended Fuels”, SAE 2005-01-3733.
[111] R. Dijkstra, G. Di Blasio, M. Boot, C. Beatrice, C. Bertoli, “Assessment of the effect of
low cetane number fuels on a light duty CI engine: Preliminary experimental
characterization in PCCI operating condition”, SAE 2011-24-0053.
[112] André M., Walter B., Bruneaux G., Foucher F., Mounaïm-Rousselle C., 2009,
“Optimizing Early Injection Strategy for Diesel PCCI Combustion”, SAE 2009-01-2731
[113] Lechner G.A., Jacobs T.J., Chryssakis C.A., Assanis D.N., 2005, “Evaluation of a Narrow
Spray Cone Angle, Advanced Injection Timing Strategy to Achieve Partially Premixed
Compression Ignition Combustion in a Diesel Engine”, SAE 2005-01-0167
[114] Risberg P., 2006, “Describing the Auto-Ignition Quality of Fuels in HCCI Engines”,
Doctoral thesis
[115] Kimura S., Aoki O., Kitahara Y., Aiyoshizawa E., 2001, “Ultra-Clean Combustion
Technology Combining a Low-Temperature and Premixed Combustion Concept for
Meeting Future Emission Standards”, SAE 2001-01-0200
[116] Shizio S., Takekazu I., 2000, “Smoke-less Rich Combustion by Low Temperature
Oxidation in Diesel Engines”, JSAE 100-00 17-20
[117] Donkerbroek A.J., Boot M.D, Luijten C.C.M., Dam N.J., ter Meulen J.J., 2010, “Flame
lift-off length and soot production of oxygenated fuels in relation with ignition delay in a
DI heavy-duty diesel engine”, Combustion and Flame 158 (2011) 525-538
[118] Beatrice C., Guido C., Avolio G., 2007, “Experimental Analysis of the Operating
Parameter Influence on the application of Low Temperature Combustion in the Modern
diesel Engines”, Istituto Motori Napoli, SAE 2007-01-1839
[119] Avolio G., Beatrice C., Bertoli C., 2005, “Development of a Single Cylinder Direct
Injection Diesel Engine for advanced combustion system studies”, Proceedings of 11th
Expo International Conference on High-Tech Engines and Cars, 26-27 May 2005, Modena,
Italy
[120] Kalghatgi G., Hildingsson L., Harrison A., Johansson B., 2010, “Some Effects of Fuel
Autoignition Quality and Volatility in Premixed Compression Ignition Engines”, SAE
2010-01-0607
[121] Kalghatgi G., Hildingsson L., Harrison A., Johansson B., 2010, “Low- NOx, low-smoke
operation of a diesel engine using “premixed enough” compression ignition – Effects of
fuel auto-ignition quality, volatility and aromatic content”, THIESEL 2010 Conference on
Thermo- and Fluid Dynamic Processes in diesel Engines
[122] Hildingsson L., Kalghatgi G., Tait N., Johansson B., Harrison A., 2009, “Fuel octane
effects in the partially premixed combustion regime in compression ignition engines”,
SAE 2009-01-2648
[123] https://www.avl.com/smoke-meter

REFERENCES
160
[124] Benajes J., Novella R., Garcia A., Domenech V., Durrett R., “An Investigation on Mixing
and Auto-ignition using Diesel and Gasoline in a Direct-Injection Compression-Ignition
Engine Operating in PCCI Combustion Conditions”, SAE 2011-37-0008 DOI:
10.4271/2011-37-0008.
[125] Hanson R., Splitter D., Reitz R., “Operating a Heavy-Duty Direct-Injection Compression-
Ignition Engine with Gasoline for Low Emissions”, SAE 2009 -01-1442, 2009.
[126] Donkerbroek A.J., Boot M.D., Luijten C.C.M., Dama N.J., Meulen J.J., “Flame lift-off
length and soot production of oxygenated fuels in relation with ignition delay in a DI
heavy-duty diesel engine”, Combustion and Flame 158 (2011) 525–538.
doi:10.1016/j.Combust. Flame.2010.10.003.
[127] Kittelson D. B., Watts W. F. & Arnold M., 1998, “Review of Diesel Particulate Sampling
Methods”, Department of Mechanical Engineering: University of Minnesota.
[128] Desantes J.M., Bermúdez V., García J.M., Fuentes E., 2005, “Effects of current engine
strategies on the exhaust aerosol particle size distribution from a Heavy-Duty Diesel
Engine”, Aerosol Science 36 1251–1276.
[129] Kitamura, T.; Ito, T.; Senda, J.; Fujimoto, H. “Mechanism of smokeless diesel combustion
with oxygenated fuels based on the dependence of the equivalence ratio and temperature
on soot particle formation”. Int. J. Engine Res. 2002, 3, 223-248.
[130] Sakurai, H.; Park, K.; McMurry, P. H.; Zarling, D. D.; Kittelson, D. B.; Ziemann, P. J.
“Size-dependent mixing characteristics of volatile and non volatile components in diesel
exhaust aerosols”. Environ. Sci. Technol. 2003, 37, 5487-5495.
[131] H. J. Jung, D. B. Kittelson and M. R. Zachariah, “Characteristics of SME Biodiesel-
Fueled Diesel Particle Emissions and the Kinetics of Oxidation”, Environ. Sci. Technol.
2006, 40, 4949-4955
[132] Ma, J., Lu, X., Ji, L., Huang, Z., “An experimental study of HCCI-DI combustion and
emissions in a diesel engine with dual fuel”, Int. Jou. of Thermal Sciences 47, 1235-1242,
2008.
[133] Zheng, Z., Yao, M., "Charge stratification to control HCCI: Experiments and CFD
modelling with n-heptane as fuel", Fuel 88, 354-365, 2009.
[134] Ranzi E., Gaffuri P., Faravelli T., Dagaut P., "A Wide Range Modeling Study of n-Heptane
Oxidation", Comb. Flame 103: 91-106 (1995).

APPENDIX A
Appendix A
Feature Method Petroleum
diesel GTL RME SME
n-
heptane Gasoline
Cyclo-
hexanone Ethanol
Density @ 15 °C
[kg/m3]
EN ISO
12185 840 777.5 883 884.4 684 720 950 790
Viscosity a 40 °C
[mm2/s]
EN ISO
3104 3.141 2.547 4.254 3.958 0.51 0.5-0.75 4.9 1.01
Oxydation Thermal
Stability a 110°C h EN 14112 - - 8.6 7.9 - - -
Cetane Number EN ISO
5165 56 73.9 52.3 48 56 ~10 ~10 <10
Low Heating Value
[MJ/kg]
ASTM
D3338 42.5 43.53 37.35 37.25 44 43 35 30
Distillation
[°C] IBP
203.1 322 320 98 - 155 78
°C 10% vol.
230.3 333.2 332.1 - 45 -
°C 50% vol. 280.1 265.9 337 335 - 105 -
°C 90% vol. 338.1 305.8 343.3 341.2 - 155 -
°C 95% vol. 312.2 347 345.6 - -
°C FBP 362 317.3 360 362 98 190 155 78
Carbon
[molar%] 5991 86.5 84.3 78.5 78.4 83.9 85-88 73.4 52.2
Hydrogen
[molar%] 5991 13.5 14.4 10.8 11.0 16.1 12-15 10.3 13.1
Nitrogen
[molar%]] 5991 - 1.3 0.2 0.2 0
Oxygen
[molar%] 5991 - 0.0 10.5 10.4 0 0 16.3 34.7
Table 6.1: Fuel properties

APPENDIX B
Appendix B
Combustion efficiency
1out in lost lostcomb
in in in
Q Q Q Q
Q Q Q
Thermodynamic efficiency
Indicated specific fuel consumption
Kay’s mixing rule with xi the mole fraction
mix i iCN x CN
1fuel
thermo
comb fuel combISFC LHV
fuel
ind
mISFC
P