premiums and discounts in the valuation of business interests · 01/07/2016 · james r. hitchner,...
TRANSCRIPT

James R. Hitchner, CPA/ABV/CFF, ASA
Premiums and Discounts in the
Valuation of Business Interests
International Business
Valuation Conference
Milano January 16, 2017

2
Jim Hitchner, CPA/ABV/CFF, ASA • Managing Director, Financial Valuation Advisors, Inc.
• CEO, Valuation Products and Services LLC • President, Financial Consulting Group LLC • Editor in Chief, Financial Valuation and Litigation Expert • 37 years in valuation services
• Inductee in the AICPA BV Hall of Fame
• Former member of the AICPA task force on BV standards • Coauthored over 20 courses; taught over 60 courses • Published over 100 articles; made over 200 presentations • Editor and/or coauthor of the books:
• Hitchner Pratt Fishman, A Consensus View, Q&A Guide to Financial Valuation
• Financial Valuation Applications and Models, 3rd edition • Financial Valuation Workbook, 3rd edition • Valuation for Financial Reporting: Fair Value, Business Combinations,
Intangible Assets, Goodwill, and Impairment Analysis, 3rd edition • PPC’s Guide to Business Valuations, 26th edition
Copyright 2017 Valuation Products and
Services, LLC

Definitions
• Control—the power to direct the management
and policies of a business enterprise.
• Control Premium—an amount or a percentage by which the pro rata value of a controlling interest exceeds the pro rata value of a noncontrolling interest in a business enterprise to reflect the power of control.
International Glossary of Business Valuation Terms
Copyright 2017 Valuation Products and
Services, LLC 3

Control
• Control Adjustment—A valuation adjustment to financial statements to reflect the effect of a controlling interest in a business. An example would be an adjustment to owners’ compensation that is in excess of market compensation.
AICPA Glossary of Additional Terms, Statements on Standards for Valuation Services, Appendix C
Copyright 2017 Valuation Products and
Services, LLC 4

Discount for Lack of Control
Minority Discount • Discount for Lack of Control—an amount or
percentage deducted from the pro rata share of value of 100% of an equity interest in a business to reflect the absence of some or all of the powers of control.
• Minority Discount—a discount for lack of control applicable to a minority interest.
International Glossary of Business Valuation Terms
Copyright 2017 Valuation Products and
Services, LLC 5

Important Questions
• What is the range of techniques available for distinguishing between control and minority interest values?
• If applying a discrete discount for lack of control, what are the characteristics of “control” cash flows and discount rates?
• If not applying a discrete discount for lack of control, what are the characteristics of “minority” cash flows and discount rates?
• What are the strengths and weaknesses of each treatment?
Copyright 2017 Valuation Products and
Services, LLC 6

TYPES OF DISCOUNTS
• Entity-level discounts – These factors are referred to collectively as enterprise
factors and affect control and minority owners • Key-person discounts • Contingent liability discounts (hazardous waste, etc.) • Customer/supplier base discounts (limited customers,
loss of suppliers, etc.)
• Shareholder-level discounts – Those that are relevant only to one class of investors,
usually at the minority level – Types of shareholder-level discounts include discounts for
lack of control, discounts for lack of marketability, and discounts for nonvoting status
7 Copyright 2017 Valuation Products and Services, LLC
Hitchner, James R., Financial Valuation Applications and Models, 3rd edition, 2011, Wiley, p. 370.
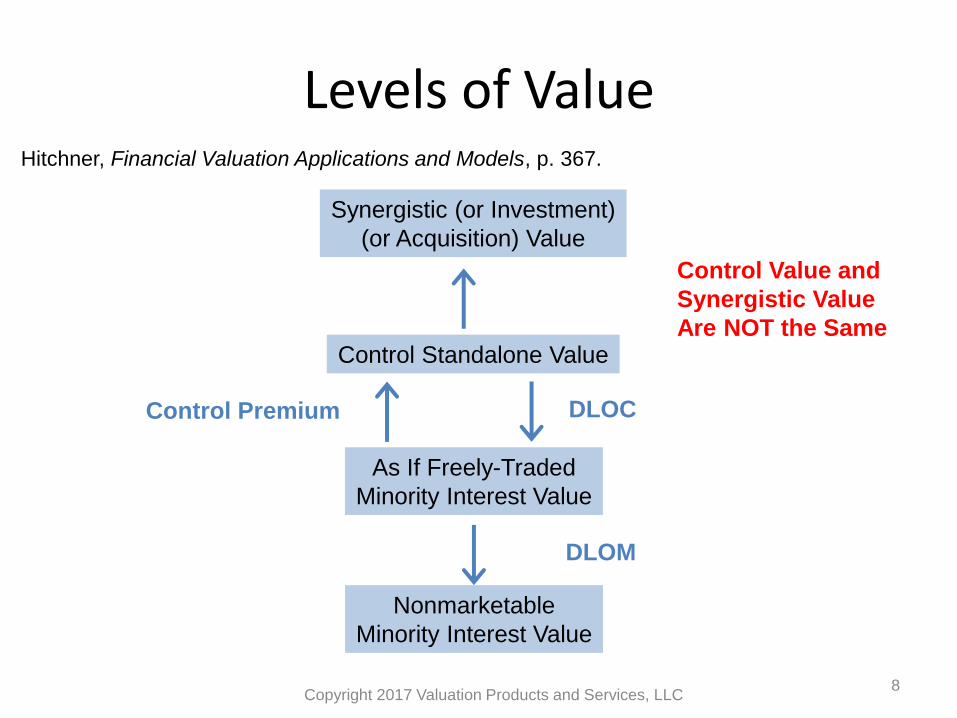
Levels of Value
Copyright 2017 Valuation Products and Services, LLC 8
DLOC Control Premium
Synergistic (or Investment)
(or Acquisition) Value
Control Standalone Value
As If Freely-Traded
Minority Interest Value
Nonmarketable
Minority Interest Value
DLOM
Control Value and
Synergistic Value
Are NOT the Same
Hitchner, Financial Valuation Applications and Models, p. 367.

Control Premium Studies and Databases
• Let’s talk about these studies and databases
• Let’s look at what they are
• Let’s look at what’s in them
• Let’s look at problems
• Let’s look at what various publications and analyses say on control premiums and lack of control discounts
Copyright 2017 Valuation Products and
Services, LLC 9

Control Premiums and Minority Discounts for Operating Companies - Myth Busters
• Is there a good source of data for minority discounts?
–No
• Is a minority discount the opposite of a control premium?
–No
• Are control premium studies a good source of data for calculating a minority discount?
–No 10
Copyright 2017 Valuation Products and
Services, LLC

Control Premiums for Operating Companies - Myth Busters
• Are control premiums derived from control premium studies useful and supportable?
–No
• What is the best way to calculate the value of control and the discount for lack of control?
–Not control premium studies
• Any questions?
Copyright 2017 Valuation Products and
Services, LLC 11

Let’s Get to the Bottom Line
Copyright 2017 Valuation Products and
Services, LLC 12
____________________________
____________________________
____________________________
____________________________
____________________________
____________________________
____________________________ Minority Discount
Control Premium
or the Top Line
Mergerstat

Copyright 2017 Valuation Products and
Services, LLC 13
Is Mergerstat the answer?

Converting a Control Premium to a Minority Discount - No Big Deal Just Invert the Control Premium
Copyright 2017 Valuation Products and
Services, LLC 14
40% premium = 29% minority interest
DLOC = 1 - ______1______
1 + premium
CP

Mergerstat Review 2013
• FactSet Mergerstat, LLC, Newark, New Jersey
• www.factset.com
• www.bvresources.com
15 Copyright 2017 Valuation Products and
Services, LLC

Mergerstat Review (p. x) • While we attempt to collect complete information on
each transaction, this is not possible in many cases, particularly with private companies. Therefore, the reader should use caution in drawing conclusions when the number of data points is low relative to the total number of transactions recorded.
• Furthermore, while we attempt to point out certain trends, each transaction has specific factors which affect its pricing.
• Therefore, the reader should examine each transaction on its own merit before drawing any conclusions. 16
Copyright 2017 Valuation Products and
Services, LLC

Mergerstat Review (p. 25)
• Control premiums (based on offering price)
– Base number of companies is 323
– Calculations based on seller’s closing market price five business days before initial announcement
– Excludes negative premiums
– Average is 46.2%
– Median is 37.1%
17 Copyright 2017 Valuation Products and
Services, LLC

Mergerstat Review (p. 81)
• 50 total industry classifications for premiums
Those with more than five transactions
• 2012 – Only 17 (34%)
• 2011 – Only 18 (36%)
• 2010 – Only 19 (38%)
• 2009 – Only 13 (26%)
• 2008 – Only 12 (24%)
• 2007 – Only 25 (50%)
18 Copyright 2017 Valuation Products and
Services, LLC

Mergerstat Review (p. 81) • Historically only five industries: “Banking and Finance,”
“Brokerage, Investment and Management Consulting,” “Computer Software, Supplies and Services,” “Drugs, Medical Supplies and Equipment” and “Miscellaneous Services” account for a large percentage of the transactions
– 2012 144/323 (45%)
– 2011 137/321 (43%)
– 2010 155/351 (44%)
– 2009 116/239 (49%)
– 2008 162/294 (55%)
– 2007 232/491 (47%)
– Six years 946/2,019 (47%)
– 10% of the industries had 47% of the transactions
19
Copyright 2017 Valuation Products and Services, LLC

FactSet Mergerstat® / BVR Control Premium Study™ (FAQs)
https://www.bvresources.com/products/deal-and-market-data
Mergerstat Control Premium
• Premium computed by comparing the price ultimately paid to the unaffected stock price
[ = (Purchase Price Per Share in Home Currency / Unaffected Price in Home Currency) - 1] (also known as the Mergerstat Unaffected Control Premium…)
• Time before announcement
– One day, one week, one month, two months
Copyright 2017 Valuation Products and Services, LLC 20

FactSet Mergerstat® / BVR Control Premium Study™ (FAQs)
Mergerstat Unaffected Price
• Target company's common stock price per share unaffected by the acquisition announcement
• Selected by Mergerstat after analyzing each transaction
Copyright 2017 Valuation Products and
Services, LLC 21

FactSet Mergerstat® / BVR Control Premium Study™ (FAQs)
• The premiums in the Mergerstat Review are only for US public targets.
• The premium information from the CPS comes from worldwide public targets where a controlling interest was acquired, and the transaction closes during the specific quarter in which it is tracked.
• The Mergerstat Review covers a much broader spectrum of M&A deals whereas the Mergerstat / BVR Control Premium Study focuses on premiums.
• …Mergerstat Review includes both closed and announced deals; FactSet Mergerstat/BVR Control Premium Study only includes closed deals.
Copyright 2017 Valuation Products and
Services, LLC 22

FactSet Mergerstat® / BVR Control Premium Study™
• Many of the same problems that are in the Mergerstat Review data are also in the FactSet Mergerstat/BVR Control Premium Study data
Copyright 2017 Valuation Products and
Services, LLC 23

Debt Matters: Equity vs. Invested Capital Control Premiums
• Assume a company sold for a control premium of 30% over it’s invested capital value ($130 over $100)
• Also assume it has debt/IC of 30% (pre-deal)
– Equals $30 of debt and $70 of equity
• This means the control premium of equity is 43%
($130 -$30)/$70 – 1 X 100
Copyright 2017 Valuation Products and
Services, LLC 24

Capital Structure Matters
Debt/IC CP-Equity CP-IC
0% 30% 30%
10% 33% 30%
20% 38% 30%
30% 43% 30%
40% 50% 30%
50% 60% 30%
Copyright 2017 Valuation Products and
Services, LLC 25

Okay – With All
This Knowledge - What Do
We Do Now?
Copyright 2017 Valuation Products and
Services, LLC 26
Go to Either Mergerstat Product? No Way

What do we do?
• This is not what is recommended in some of the leading valuation texts
• Most endorse the concept that control and minority are adjusted (or not) in the cash flows of the business
–Control cash flows result in control value and minority cash flows result in minority value
• Most strongly caution the use of control premium study data to determine control value
Copyright 2017 Valuation Products and
Services, LLC 27

What do we do?
• They also caution against adjusting the discount rate or capitalization rate for minority or control in an income approach
• Also, most, if not all, of the U.S. business valuation committees/organizations teach that control and minority value emanates from the cash flows
Copyright 2017 Valuation Products and
Services, LLC 28

What is the range of techniques available for distinguishing between control and minority interest values?
• Control value
• Minority value
• Adjust or do not adjust the cash flows
• Add a control premium or deduct a lack of control discount (DLOC)/minority interest discount (MID)
• Do both
Copyright 2017 Valuation Products and
Services, LLC 29

Okay, so it’s in the cash flows. Now what?
• Minority cash flows are minority value
• Control cash flows are control value
• Pretty simple, right?
• Not so fast
Copyright 2017 Valuation Products and
Services, LLC 30

Digging Deeper
• Okay, how does that concept fit valuation approaches/methods?
–Discounted cash flow method
–Capitalized cash flow method
–Guideline public company method
–Guideline company transaction method
–Net asset method
Copyright 2017 Valuation Products and
Services, LLC 31

Potential Problem Areas
• What if the cash flows need no adjustments, e.g., minority and control the same
– Is the value the same for minority and control?
Copyright 2017 Valuation Products and
Services, LLC 32
To

Potential Problem Areas
• What if minority cash flows are zero
– Is the value zero?
• What if control cash flows are $500,000 and minority cash flows are $100,000 and the cap rate is 20%
–Control value = $2,500,000
–Minority value = $500,000
– Is the minority discount 80%?
Copyright 2017 Valuation Products and
Services, LLC 33

If Applying a Discrete Discount for Lack of Control, What are the Characteristics of
“Control” Cash Flows and Discount Rates?
• For valuation analysts that use LOC discounts, most come from control premium data
• If you take a LOC discount, then the assumption must be that the cash flows are already on a control basis, correct?
• What makes the discount/cap rate control?
• What makes the cash flows control?
Copyright 2017 Valuation Products and
Services, LLC 34

Back to control premium studies - What do these have to do
with control premium studies?
• Commonly considered control rights, benefits,
and possible adjustments* – Excess compensation and fringe benefits
– Excess employee perquisites
– Excess rental payments to shareholders
– Excess intercompany fees and payments to a commonly controlled sister company
– Payroll-related taxes * Hitchner, Financial Valuation Applications and Models, pp. 124-125
Copyright 2017 Valuation Products and
Services, LLC 35

What do these have to do with control premium studies?
– Reimbursed expenses
– Nonbusiness travel and entertainment of shareholders and/or key individuals
– Related-party transactions
– Sales/purchases to/from related entities
– Capital structure
– Excess or insufficient interest on loans to/from shareholders
Copyright 2017 Valuation Products and
Services, LLC 36

BV Standards AICPA
• 13.c. The nature of the interest and ownership rights in the business, business interest, security, or intangible asset being valued, including control characteristics and the degree of marketability of the interest
• 28. Determine the type of ownership interest being valued and ascertain whether that interest exhibits control characteristics
Copyright 2017 Valuation Products and
Services, LLC 37
BV Standards AICPA • 40. During the course of a valuation engagement, the
valuation analyst should consider whether valuation adjustments (discounts or premiums) should be made to a pre-adjustment value
• Examples of valuation adjustments for valuation of a business, business ownership interest, or security include a discount for lack of marketability or liquidity and a discount for lack of control
• 58.a. The rationale underlying any normalization or control adjustments to financial information
Copyright 2017 Valuation Products and
Services, LLC 38

BV Standards USPAP
• 9-4(d) An appraiser must, when necessary for credible assignment results, analyze the effect on value, if any, of the extent to which the interest appraised contains elements of ownership control and is marketable and/or liquid
• 10-2(a)(iv) State the extent to which the interest appraised contains elements of ownership control, including the basis for that determination
Copyright 2017 Valuation Products and
Services, LLC 39

Summary
• Mergerstat information
• Cash flow adjustments – or not
• Recognized valuation treatises
• Potential problem areas
• Appraisal Foundation
• AICPA
• Disconnect between prerogatives of control and control premium data
• BV standards
Copyright 2017 Valuation Products and
Services, LLC 40

Conclusion • If a business is properly valued and includes the
applicable expectations of future cash flow, tacking on a 15% or 25% or 40% acquisition-based so-called premium for control will inappropriately inflate the value with no underlying economic or financial support
• This is also true when using a LOC discount based on these acquisition-based so-called premiums for control
• It’s all about the cash flows
Copyright 2017 Valuation Products and
Services, LLC 41

42
Some Selected Quotes on Merger Success Rates
Note: There Are Many More
43
William E. Schneider
• “Merger or Acquisition Failing? The Solution Lies in Your Strategic Focus,” William E. Schneider, © 2006-2008, Corporate Development Group, Inc.
• “The evidence is unmistakable. Mergers and acquisitions fail somewhere between 50% and 75% of the time…There are two main reasons: culture clash and leadership clash.”
• “Michael Porter analyzed 2,700 mergers and acquisitions by 33 major US companies over a 36-year period (1950 to 1986). Results: Failure rates between 50 and 75 percent. Major cause: culture and leadership clash.”

Bertoncelj, et al.
• “An integrated approach for a higher success rate in mergers and acquisitions,” Andrej Bertoncelj, Darko Kovač, Zb. rad. Ekon. fak. Rij. • 2007 • vol. 25 • sv. 1 • 167-188.
• “A global A.T. Kearney study suggests that 58 percent of all mergers, acquisitions, and other forms of corporate restructuring fail to produce results rather than create value (Habech et al., 2000).”
• “Similarly, a KPMG survey found that ‘83 percent of mergers were unsuccessful in producing any business benefits as regards shareholder value’ (KPMG, 1999).”
• “…analysis of hundreds of deals led Business Week to conclude that out of 150 deals valued at $500 million each or more, about half actually destroyed shareholder value (Feldman & Pratt).”
Copyright 2017 Valuation Products and Services, LLC 44

45
Bertoncelj, et al. • “A major McKinsey & Company study found that ‘61 percent of
acquisition programs were failures because the acquisition strategies did not earn a sufficient return (cost of capital) on the funds invested’ (Sirower, 1997).”
• “Between 55 and 77 percent of all mergers fail to deliver on the financial promise announced when the merger was initiated” and studies show that some 40 percent of cross-border mergers among large companies end in what is termed ‘total failure’ (Carleton and Lineberry, 2004).”
• “Even though most mergers and acquisitions are carefully designed, they still face major challenges. Nearly two-thirds of companies lose market share in the first quarter after a merger; by the third quarter, the figure is 90 percent (Harding and Rouse, 2007).”
Copyright 2017 Valuation Products and
Services, LLC

46
KPMG
• “Unlocking Shareholder Value: The Keys to Success, Mergers & Acquisitions: A Global Research Report,” KPMG, 1999.
• “The survey found that 82% of respondents believed the major deal they had been involved in had been a success. However, this was a subjective estimation of their success in achieving the deal objectives… and less than half had carried out a formal review process.”
• “When we measured each one against our independent benchmark, based on comparative share performance one year after deal completion, the result was almost a mirror opposite. We found that only 17% of deals had added value to the combined company, 30% produced no discernible difference, and as many as 53% actually destroyed value. In other words, 83% of mergers were unsuccessful in producing any business benefit as regards shareholder value.”

47
Sirower
Sirower, Mark, The Synergy Trap, the Free Press,1997
• Researched acquisitions from 1979 to 1990
• “My study reveals that 65 percent of major strategic acquisitions have been failures.”
• “Acquiring firms destroy value. That is a plain fact.”

ATKearney
• “M&A Deal Evaluation: Challenging Metrics Myths,” A.T. Kearney, 2013.
• “It is widely recognized that a significant percentage of M&A transactions fail to deliver value to shareholders. What goes wrong? How is it that acquisitions on average seem to create negligible returns? It can be tempting to blame poor merger integration for the meager returns…However, it may also be useful to consider if the deal was worth doing in the first place.”
Copyright 2017 Valuation Products and
Services, LLC 48

VSC Growth
• “Adding more potential to your business,” slide presentation, 2011, VSC Growth, http://www.slideshare.net/SteveCoote/vsc-growth-company-profile.
• “Approximately 70% of mergers and acquisitions fail to achieve expectations and more than half destroy value”
Copyright 2017 Valuation Products and
Services, LLC 49

Dr. Aswath Damodaran
• “The Value of Synergy,” Whitepaper, Dr. Aswath Damodaran, 2005, New York University Stern School of Business.
• “Synergy, we conclude, is so seldom delivered in acquisitions because it is incorrectly valued, inadequately planned for and much more difficult to create in practice than it is to compute on paper.”
• “Synergy, the increase in value that is generated by combining two entities to create a new and more valuable entity, is the magic ingredient that allows acquirers to pay billions of dollars in premiums in acquisitions.”
• “Often promised and seldom delivered is perhaps the most apt way of describing synergy in most acquisitions.”
Copyright 2017 Valuation Products and
Services, LLC 50

Dr. Aswath Damodaran
• “The Value of Synergy,” Whitepaper, Dr. Aswath Damodaran, 2005, New York University Stern School of Business.
• “While there is some evidence of synergy in the aggregate across all acquisitions, most mergers fail in delivering any synergy. Even if we accept the fact that there is value to synergy, acquiring firm stockholders get almost none of the benefits of the increased value; in fact, they overpay for synergy in most acquisitions.”
Copyright 2017 Valuation Products and
Services, LLC 51

Deloitte
• “M&A Trends Report 2014, A Comprehensive Look at the M&A Market,” Deloitte Development LLC, 2014.
• “Despite the acceleration of activity and inclination of companies to continue to combine with others, mergers and acquisitions don’t always work. Almost nine in 10 corporate survey respondents believe that at least some portion of their transactions did not generate the return on investment that they had anticipated.”
Copyright 2017 Valuation Products and
Services, LLC 52

Harvard Business Review
• “The Big Idea: The New M&A Playbook,” Clayton M. Christensen, Richard Alton, Andrew Waldeck, Harvard Business Review, March 2011.
• “…companies spend more than $2 trillion on acquisitions every year. Yet study after study puts the failure rate of mergers and acquisitions somewhere between 70% and 90%.”
• “…companies too often pay the wrong price and integrate the acquisition in the wrong way.”
Copyright 2017 Valuation Products and
Services, LLC 53

Italian Target Companies - All
Copyright 2017 Valuation Products and Services, LLC 54
Statistic Count Range Mean Median Harmonic
Mean
Coefficient of
Variation
Effective Date 78 5/15/1998 - 7/1/2016 N/A N/A N/A N/A
Net Sales LTM (USD)
78 $0 - $16,847 $1,660 $438 N/A N/A
EBITDA CashFlow LTM (USD)
78 ($1,782) - $10,511 $506 $67 N/A N/A
Deal Value ($mil-US)
78 $3 - $24,927 $1,595 $469 N/A N/A
MergerStat Control Premium
78 -73.0% - 432.4% 26.0% 10.6% N/A N/A
Implied Minority Discount
78 -270.9% - 81.2% 6.5% 9.6% N/A N/A
Price/Sales 68 0.01 - 7.45 1.98 1.33 0.34 0.90
Price/Income 40 0.21 - 35.17 18.34 18.38 5.32 0.44
Price/Book Value 60 0.16 - 8.35 2.42 1.90 1.41 0.72
Target Invested Capital/EBITDA
45 2.20 - 21.41 11.52 10.34 9.53 0.40

Italian Target Companies - Remove Negative Premiums
Copyright 2017 Valuation Products and Services, LLC
55
Statistic Count Range Mean Median Harmonic
Mean Coefficient of Variation
Effective Date 60 5/15/1998 - 7/1/2016 N/A N/A N/A N/A
Net Sales LTM (USD)
60 $0 - $16,847 $1,885 $572 N/A N/A
EBITDA CashFlow LTM (USD)
60 ($1,782) - $10,511 $609 $81 N/A N/A
Deal Value ($mil-US)
60 $3 - $24,927 $1,884 $597 N/A N/A
MergerStat Control Premium
60 0.1% - 432.4% 39.4% 19.9% N/A N/A
Implied Minority Discount
60 0.1% - 81.2% 19.7% 16.6% N/A N/A
Price/Sales 52 0.01 - 6.61 2.05 1.49 0.29 0.83
Price/Income 34 0.21 - 35.17 18.56 17.42 4.83 0.44
Price/Book Value 46 0.16 - 8.35 2.42 1.90 1.37 0.73
Target Invested Capital/EBITDA
34 2.20 - 21.17 11.57 10.59 9.39 0.41

Italian Target Companies; No Negative Premiums; Last 3 Years
Copyright 2017 Valuation Products and Services, LLC
56
Statistic Count Range Mean Median Harmonic
Mean Coefficient of Variation
Effective Date 11 11/20/2013 - 7/1/2016
N/A N/A N/A N/A
Net Sales LTM (USD) 11 $5 - $16,847 $2,377 $745 N/A N/A
EBITDA CashFlow LTM (USD)
11 ($1,782) - $267 ($63) $57 N/A N/A
Deal Value ($mil-US) 11 $8 - $2,262 $801 $552 N/A N/A
MergerStat Control Premium
11 0.1% - 259.9% 49.8% 23.2% N/A N/A
Implied Minority Discount
11 0.1% - 72.2% 24.4% 18.8% N/A N/A
Price/Sales 10 0.01 - 4.73 1.86 1.70 0.11 0.78
Price/Income 3 16.70 - 26.62 22.39 23.85 21.53 0.23
Price/Book Value 3 2.36 - 8.35 5.68 6.33 4.27 0.54
Target Invested Capital/EBITDA
9 8.83 - 21.17 15.99 15.25 14.69 0.28

Sample of Detail
Copyright 2017 Valuation Products and Services, LLC
57
SIC Business description Date % Sales EBITDA Value CP
8748 Operates as a management consulting firm 8/7/2015 59.7 $5 $1 $8 259.9%
7372 Provides software engineering and systems integration services
7/1/2016 55.7 $923 $108 $512 14.2%
6799 Provides insurance, financial, and real estate management services
1/2/2014 51.3 $16,847 ($1,782) $105 26.2%
5999 Operates duty free stores 8/7/2015 50.1 $2,633 $267 $1,430 15.8%
4581 Manages airport operations at the Torino airport 6/1/2015 51.0 $43 $9 $82 23.2%
4581 Operates as an aviation industry 11/20/2013 64.0 $745 $263 $2,262 63.3%
3845 Develops, manufactures, and markets products for cardiovascular care
10/19/2015 100.0 $845 $133 $1,571 32.1%
3631 Manufactures and distributes gas and electrical household appliances mainly for kitchen use
10/14/2014 60.4 $3,308 $205 $961 4.8%
3585 Engages in the production and sale of indoor climate control & refrigeration machinery, and radiators
12/23/2015 75.0 $384 $57 $552 88.6%
2834 Manufactures and develops biopharmaceutical products
2/21/2014 100.0 $49 $10 $992 0.1%
2512 Designs and manufactures both household and office furniture
3/25/2014 58.6 $366 $37 $335 19.3%