prelims fy18 feb 28 final web 7am.pptx - read-only
TRANSCRIPT

Preliminary Results 2018
Nicandro Durante
28th February 2019
1

Important Information The information contained in this presentation in relation to British American Tobacco p.l.c. (“BAT”) and its subsidiaries has been prepared solely for use at this presentation. Thepresentation is not directed to, or intended for distribution to or use by, any person or entity that is a citizen or resident or located in any jurisdiction where such distribution, publication,availability or use would be contrary to law or regulation or which would require any registration or licensing within such jurisdiction.
References in this presentation to ‘British American Tobacco’, ‘BAT’, ‘Group’, ‘we’, ‘us’ and ‘our’ when denoting opinion refer to British American Tobacco p.l.c. and when denotingtobacco business activity refer to British American Tobacco Group operating companies, collectively or individually as the case may be.
The information contained in this presentation does not purport to be comprehensive and has not been independently verified. Certain industry and market data contained in thispresentation has come from third party sources. Third party publications, studies and surveys generally state that the data contained therein have been obtained from sources believedto be reliable, but that there is no guarantee of accuracy or completeness of such data.
Forward-looking Statements
This presentation does not constitute an invitation to underwrite, subscribe for, or otherwise acquire or dispose of any BAT shares or other securities. This presentation contains certainforward-looking statements, made within the meaning of Section 21E of the United States Securities Exchange Act of 1934, regarding our intentions, beliefs or current expectationsconcerning, amongst other things, our results of operations, financial condition, liquidity, prospects, growth, strategies and the economic and business circumstances occurring fromtime to time in the countries and markets in which the Group operates.
These statements are often, but not always, made through the use of words or phrases such as “believe,” “anticipate,” “could,” “may,” “would,” “should,” “intend,” “plan,” “potential,”“predict,” “will,” “expect,” “estimate,” “project,” “positioned,” “strategy,” “outlook”, “target” and similar expressions.
It is believed that the expectations reflected in this presentation are reasonable but they may be affected by a wide range of variables that could cause actual results to differ materiallyfrom those currently anticipated.
The forward-looking statements reflect knowledge and information available at the date of preparation of this presentation and BAT undertakes no obligation to update or revise theseforward-looking statements, whether as a result of new information, future events or otherwise.
Among the key factors that could cause actual results to differ materially from those projected in the forward-looking statements are uncertainties related to the following: the impact ofcompetition from illicit trade; the impact of adverse domestic or international legislation and regulation; changes in domestic or international tax laws and rates; adverse litigation anddispute outcomes and the effect of such outcomes on the Group’s financial condition; changes or differences in domestic or international economic or political conditions; adversedecisions by domestic or international regulatory bodies; the impact of market size reduction and consumer down-trading; translational and transactional foreign exchange rateexposure; the impact of serious injury, illness or death in the workplace; the ability to maintain credit ratings and to fund the business under the current capital structure; the inability todevelop, commercialise and roll-out Potentially Reduced-Risk Products; and changes in the market position, businesses, financial condition, results of operations or prospects of theGroup.
2

Important Information Forward-looking Statements (continued)
Additional information concerning these and other factors can be found in BAT’s filings with the U.S. Securities and Exchange Commission (“SEC”), including the Annual Report onForm 20-F filed on 15 March 2018 and Current Reports on Form 6-K, which may be obtained free of charge at the SEC’s website, http://www.sec.gov, and BAT’s Annual Reports,which may be obtained free of charge from the British American Tobacco website www.bat.com.
Past performance is no guide to future performance and persons needing advice should consult an independent financial adviser. Readers are cautioned not to place undue relianceon such forward-looking statements.
Additional Information
All financial statements and financial information provided by or with respect to the US or Reynolds American Inc. (“RAI”) are initially prepared on the basis of U.S. GAAP andconstitute the primary financial statements or financial records of the US business/RAI. This financial information is then converted to International Financial Reporting Standards asissued by the IASB and as adopted by the European Union (IFRS) for the purpose of consolidation within the results of the BAT Group. To the extent any such financial informationprovided in this presentation relates to the US or RAI it is provided as an explanation of, or supplement to, RAI’s primary U.S. GAAP based financial statements and information.
Our vapour product Vuse, and oral products Grizzly, Camel Snus and Kodiak, which are only sold in the US, are subject to FDA regulation and no reduced-risk claims will be made tothese products without agency clearance.
No Profit or Earnings Per Share Forecasts
No statement in this presentation is intended to be a profit forecast and no statement in this presentation should be interpreted to mean that earnings per share of BAT for the currentor future financial years would necessarily match or exceed the historical published earnings per share of BAT.
Audience
The material in this presentation is provided for the purpose of giving information about BAT and its subsidiaries to investors only and is not intended for general consumers. BAT, itsdirectors, officers, employees, agents or advisers do not accept or assume responsibility to any other person to whom this material is shown or into whose hands it may come and anysuch responsibility or liability is expressly disclaimed. The material in this presentation is not provided for product advertising, promotional or marketing purposes. This material doesnot constitute and should not be construed as constituting an offer to sell, or a solicitation of an offer to buy, any of our products. Our products are sold only in compliance with the lawsof the particular jurisdictions in which they are sold.
Revision
For presentation purposes within this presentation, all prior periods have been revised to be consistent with the current reporting structure. All of the information in this presentation isin respect to continuing operations, revised for the fully retrospective adoption of IFRS 15.
Share
A number of share metrics are stated throughout this document please see Appendix note A4 for more details.
3

2018 ‐ A strong performance across all categories
Exceeding High Single Figure constant currency earnings^ growth, up 11.8%Exceeding High Single Figure constant currency earnings^ growth, up 11.8%
* Representative, adjusted and constant rate basis. See Appendix, notes A1, A2 and A3.^ Adjusted diluted earnings per share at constant rates. See Appendix, note A3.
Dividend up + 4% to 203.0pDividend up + 4% to 203.0p
Strong growth in the Strategic Portfolio, revenue up 8.5%*Strong growth in the Strategic Portfolio, revenue up 8.5%*
Outperforming in Combustibles: market share up +40bpsOutperforming in Combustibles: market share up +40bps
NGP revenue up +95%* to £901m*NGP revenue up +95%* to £901m*
Strong results across the US businessStrong results across the US business
Strong Strategic Portfolio revenue growth, up +8.5%*Strong Strategic Portfolio revenue growth, up +8.5%*
4

2018 Results Highlights
VOLUMEVOLUME
+25.2%
REVENUEREVENUE PROFIT FROM OPERATIONSPROFIT FROM OPERATIONS
5
REPORTEDREPORTED
ADJUSTED CURRENT^ADJUSTED CURRENT^
ADJUSTED CONSTANT*ADJUSTED CONSTANT*
‐2.3%
+3.5%
‐1.5%
+3.3% +45.2%
‐3.5% +4.0%
‐3.5%
^ Representative and adjusted basis. See Appendix, notes A1 and A2. * Representative, adjusted and constant rate basis. See Appendix, note A1, A2 and A3.
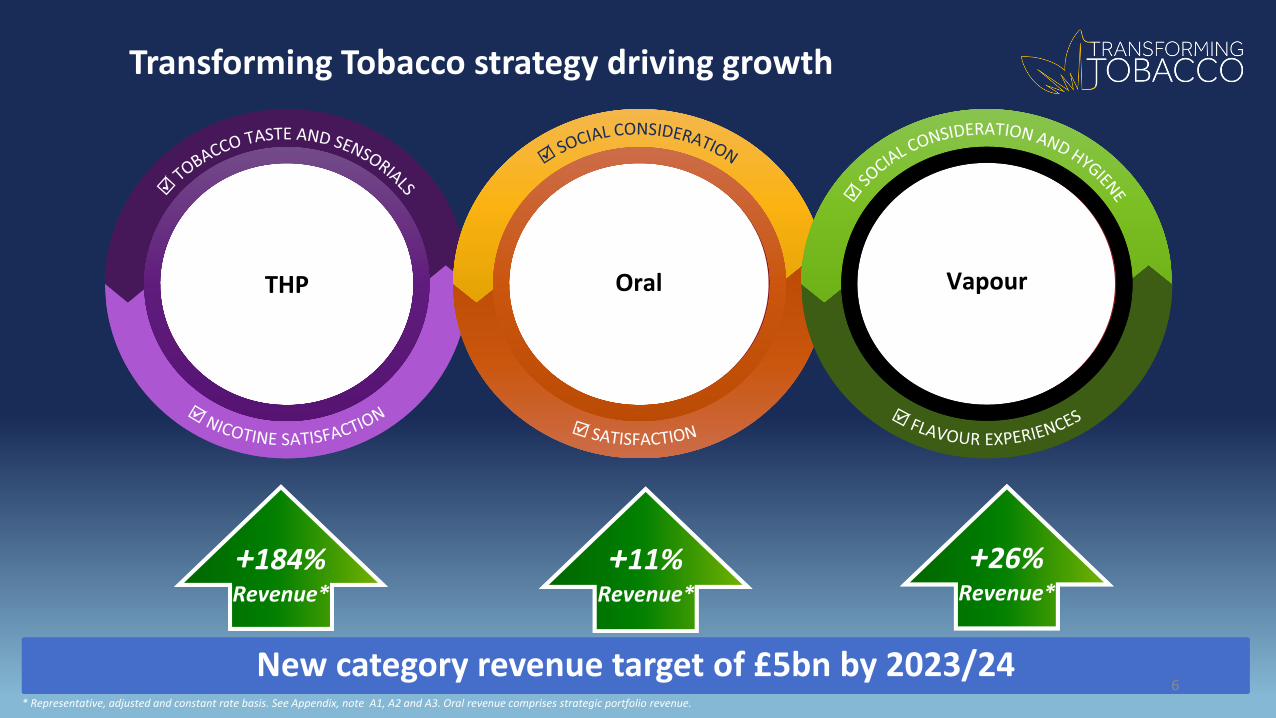
Transforming Tobacco strategy driving growth
THP Oral Vapour
+184%Revenue*
+26%Revenue*
+11%Revenue*
New category revenue target of £5bn by 2023/24New category revenue target of £5bn by 2023/246
* Representative, adjusted and constant rate basis. See Appendix, note A1, A2 and A3. Oral revenue comprises strategic portfolio revenue.

Consistent growth in earnings^ and dividends
7
Source: Company data
^ Adjusted diluted earnings per share at constant rates. See Appendix, note A3.
* Adjusted and constant rate basis. See Appendix, notes A2 and A3.
Dividends per shareCAGR: 12%
12% 10%15%
9% 9% 10% 11% 12% 10% 8% 10% 10% 9% 12%
5%
‐4%
10% 10% 5%
‐5% ‐4%‐12% ‐10%
9%5%
‐7%
4756
6684
100114
127 135 142 148 154169
195 203
2005 2006 2007 2008 2009 2010 2011 2012 2013 2014 2015 2016 2017 2018
Adjusted diluted EPS @ constant rates Translational fx impact on EPS Dividends per share (pence)
Earnings per share^ growth* Average growth 2005 ‐ 2018: 11% p. a.

We have the right strategy
8
THPFMC Oral
Product platformsMulti‐category
Vapour

Preliminary Results 2018
Jack Bowles
28th February 2019
9

Long term sustainable performance‐ Combustibles + THP
* Inclusive of Pall Mall performance in the US
+10bps ‐10bps +20bps‐20bps
Strategic Brand Global Market Share including THPStrategic Brand Global Market Share including THP US Strategic Brand Market ShareUS Strategic Brand Market Share
flat
2012 2013 2014 2015 2016 2017 2018
+40bps
+20bps
+110bps
+100bps
+110bps
+100bps
+10bps+40bps
+50bps+40bps
+120bps
Strategic brandMarket Share
Group Market Share
+200bps
+XX% +0.2%+50bps +20bps +10bps* +110bpsflat10

THP – Growth in Japan as our global footprint increases
CZECH
SERBIA CANADA
SWITZERLAND
CROATIAKAZAKHSTAN
UKRAINEPOLAND
GREECE BULGARIA
Japan
Source: Retail data (CVS BC) and BAT internal estimates * Share of THP NTO
Global footprint: Presence in markets comprising 96% of global THP market
SOUTH KOREA RUSSIA ROMANIA
11
ITALY
JAPAN
19.1%
22.4%23.1%
26.7%
4.0%
5.0%
3.5%
4.0%
4.5%
5.0%
5.5%
6.0%
6.5%
7.0%
7.5%
8.0%
8.0%
10.0%
12.0%
14.0%
16.0%
18.0%
20.0%
22.0%
24.0%
26.0%
28.0%
Jan‐18
Feb‐18
Mar‐18
Apr‐18
May‐18
Jun‐18
Jul‐1
8
Aug‐18
Sep‐18
Oct‐18
Nov
‐18
Dec‐18
Jan‐19
W1 Feb
Value Share of THP*
Volume Share of THP
Volume share in Total Tobacco

Vapour – New markets and new products driving growth
Global footprint
Vype ePen3 Vuse Alto
Francevalue share* 7.1%
UK National value share 3.9%
USNational value share 4.6%
Phased roll‐out now in ~70k outlets
UK Value retail share grew +20bps to 41%
Consumable volume grew^ by +36%
^ Representative basis. See Appendix, note A1
POL
GRE
USA UK CAN ITA GER
COLIRE GUA
FRA
BHRHUN KUW NZ
* Share relates to tracked channels12
38.6% 41.9%
27.6%
27.4%
10.8%
JAN18 FEB18 MAR18 APR18MAY18 JUN18 JUL18 AUG18 SEP18 OCT18 NOV18 DEC18 JAN19 FEB19
Competitor 1 VUSE Alto
Share of consumable kits
Source: 4 week average consumer offtake share. * Data to week of 9 Feb 2019

Oral – Strong pricing and portfolio growth
Successful launch in Sweden with a 4.5% share~
UK pilot currently underwayPositive early results
Modern oral revenue grew* +140%driven by EPOK
EPOK – achieved a 8% market share in Norway and 17% in Switzerland
Strategic portfolio revenue grew` +9% driven by strong pricing in the US
Modern Oral
LYFT – Zero tobacco nicotine pouches
Traditional Oral
~ Share relates to initial launch retail chain only
• US oral revenue growth` +8%• Volume down ‐2.3%^• Strong pricing• Value share +40bps
32.3
31.6
31.7
30.9
31.5
Q4'17 Q1'18 Q2'18 Q3'18 Q4'18
Grizzly quarterly avg share ‐ STR
^ Representative basis. See Appendix, note A1. ` Representative constant rate basis. See Appendix, notes A1 and A3.13
Source: Company data. STR share.

US
5.8%*
‐3.5%^
Adjusted Profit fromoperations
Revenue
Strategic brands volume
Volume
Volume share
Value share growth +25bps (Premium share +30bps)
Good pricing
Industry volumes impacted by gas prices, PY excise changes in California and the growth of the vapour category
Newport and Natural American Spirit – good premium share performances
FDA proposals – BAT has a long experience of managing regulatory change
^ Representative and adjusted basis. See Appendix, notes A1 and A2. * Representative, adjusted and constant rate basis. See Appendix, note A1, A2 and A3.
‐5.3%^
1.5%*
‐20bps
14

APME
Good revenue and profit from operations growth*, despite heavy investment in THP
Volume increase* driven by Pakistan and THP performance in Japan and South Korea
Strong market share growth driven by Kent, glo, Dunhill and Rothmans
1.2%*
5.7%*
6.3%^
0.7%^
Adjusted profit fromoperations
Revenue
Strategic brands volume
Volume
110bpsVolume share
^ Representative and adjusted basis. See Appendix, notes A1 and A2. * Representative, adjusted and constant rate basis. See Appendix, note A1, A2 and A3.
15

AMSSA
Revenue growth* driven by strong pricing across the region
Strong profit from operations growth* driven by Nigeria, Mexico and Chile
Industry volume decline^ partially driven by illicit trade growth, mainly in Brazil and South Africa
Strong Strategic Brand volume growth driven by Brazil
6.5%*
5.6%*
3.1%^
Adjusted profit fromoperations
Revenue
Strategic brands volume
Volume
Flat Volume share ‐20bps
^ Representative and adjusted basis. See Appendix, notes A1 and A2. * Representative, adjusted and constant rate basis. See Appendix, note A1, A2 and A3.
‐5.4%^
16

ENA
Good revenue and profit from operations growth
Good volume performances in Turkey, Egypt and Poland offset by market decline in Russia, Ukraine, Italy and France
Good pricing across the region
Strong Strategic brand market share growth driven by Rothmans and Kent 0.8%*
3.5%*
5.2%^
Adjusted profit fromoperations
Revenue
Strategic brands volume
Volume
Flat Volume share
^ Representative and adjusted basis. See Appendix, notes A1 and A2. * Representative, adjusted and constant rate basis. See Appendix, note A1, A2 and A3.
‐5.3%^
17

Preliminary Results 2018
Ben Stevens
28th February 2019
18
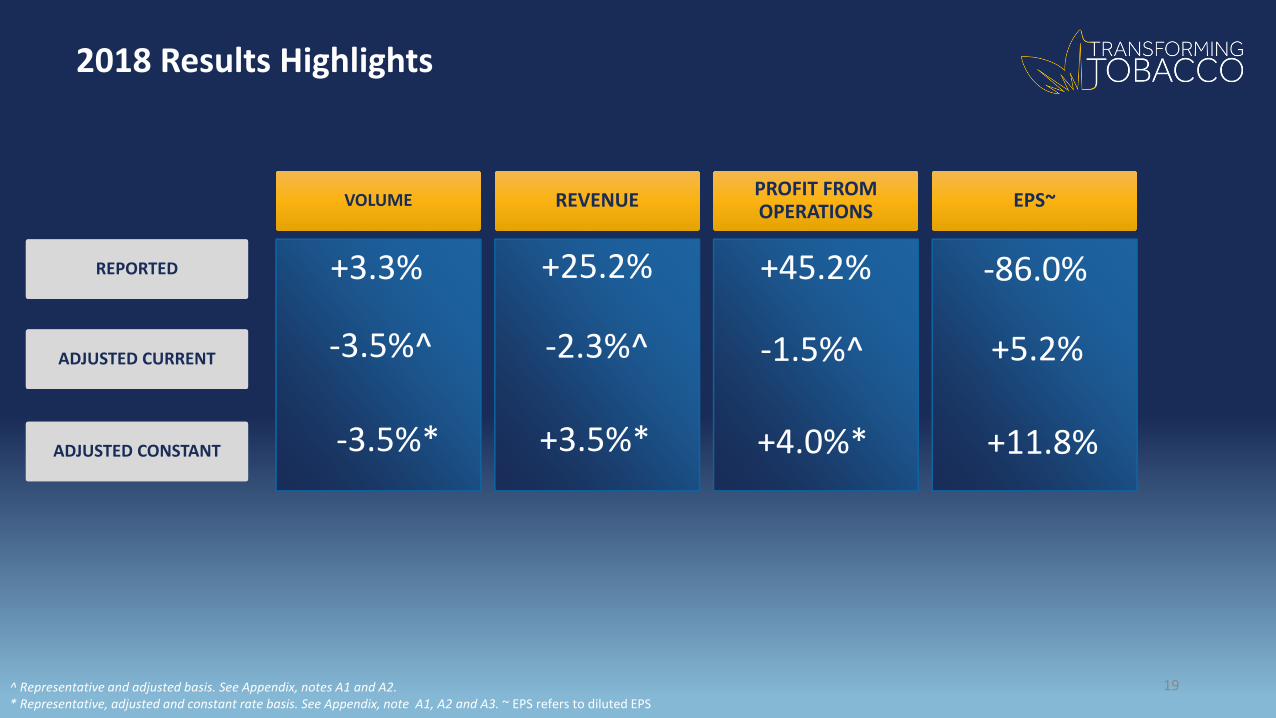
2018 Results Highlights
VOLUMEVOLUME
+25.2%
REVENUEREVENUE PROFIT FROM OPERATIONSPROFIT FROM OPERATIONS EPS~EPS~
19
REPORTEDREPORTED
ADJUSTED CURRENTADJUSTED CURRENT
ADJUSTED CONSTANTADJUSTED CONSTANT
‐2.3%^
+3.5%*
‐1.5%^
‐86.0%
+5.2%
+11.8%
+3.3% +45.2%
‐3.5%* +4.0%*
‐3.5%^
^ Representative and adjusted basis. See Appendix, notes A1 and A2. * Representative, adjusted and constant rate basis. See Appendix, note A1, A2 and A3. ~ EPS refers to diluted EPS

2018 Results – Adjusted Operating Margin % Up 40bps^
1.1
1.8
1.4
2017 Adjusted Margin
Representative adjustment
2017 Representative
AOM
Changes in the business
Incremental NGP impact
2018Adjusted Margin
41.1
42.242.6^
+0.4
^ Representative and adjusted basis. See Appendix, notes A1 and A2. 20

2018 Results – Adjusted Cash Generated from Operations
^ Representative and adjusted basis. See Appendix, notes A1 and A2. 21
£8,071m^£7,684m^
£845m
£75m £1,533m
£1,891m
£142m £601m
£523m
£1,684m
£214m
£10,347m^
Adj operatingprofit
Non cash items Working Capitalchg
Net Capex Pension fds ‐s'fall funding
Net interest Tax Dividends to NCI Adjusted CashGenerated from
Operations
Restructuringand settlements
Div fromassociates
Free cash flow

2018 Results – Adjusted Diluted EPS Growth Drivers
107.5
18.9
28.9
11.50.7
37.118.8
Non‐controllingInterests
296.7^
Taxation2017 FY Reported
Adjusted Profit from Operations
Number of shares
282.1^
2018 FY Current FX
2018 FY Constant FX
Associates FX ImpactNet Finance Cost
315.5*
+11.8% +5.2%
22^ Adjusted basis. See Appendix, note A2. * Adjusted and constant currency basis. See Appendix notes A2 and A3.

2018 Results – Leverage
Credit Rating^
Adjusted net debt/Adjusted EBITDA
Medium‐term target credit rating remains BBB+/Baa1, with the rating currently standing at BBB+/Baa2 stable (each, from S&P and Moody’s respectively).S&P & Moody’s
£1.6bn of debt paydown in 2018 Adjusted net debt/adjusted EBITDA at 4.0x on a current and approximately 3.6x
on a constant currency basis Target further deleveraging 0.4x‐0.5x, returning to the higher end of historic
adjusted net debt/adjusted EBITDA target of 1.5x to 2.5x in the medium term
23^ A credit rating is not a recommendation to buy, sell or hold securities. A credit rating may be subject to withdrawal or revision at any time. Each rating should be evaluated separately of any other rating.

24
44.6
41.7 41.7
43.4
41.9
1.7
Opening Adj Net Debt@ Constant
Adj Net Debt / Adj EBITDA@ Constant
Adjustmentfor Adj EBITDA@ Current
FX & OtherNon‐Cashadjustment
for Adj Net Debt@ Current
2018 Adj Net Debt@ Current
2018 Adj Net Debt@ Spot fX
2018 Results – Adjusted Net Debt / Adjusted EBITDA (£b)
4.0x 3.6x 4.0x+0.2x +0.2x 3.9xAdjusted Net Debt/ Adjusted EBITDA
Every instance of Net Debt and EBITDA on this slide is presented on an adjusted basis. As indicated, certain figures are also presented on a constant rate basis. See Appendix, notes A2 and A3.
Exchange rates $/£: 2017 average 1.289 Close: 1.3532018 average: 1.335 Close: 1.274Spot average: 1.33 Close 1.33 (27 Feb)

2018 Results – Summary
VolumeVolume FinancialsFinancials
c c c
Constant currency Constant currency Constant currency
Adjusted Revenue* Adjusted Profit* Adjusted Diluted EPS~Volume^
Strategic Cigarette Volume^
‐3.5% +3.5% +4.0% +11.8%
ShareShare
+XX%
c c c
Group Market Share
Strategic Brands Share
US Strategic Brands
+40bps +200bps
+4.8%
+10bps
25
^ Representative and adjusted basis. See Appendix, notes A1 and A2. * Representative, adjusted and constant rate basis. See Appendix, note A1, A2 and A3.~ Adjusted and constant rate basis. See Appendix, notes A2 and A3.

2018 ‐ A strong performance across all categories
Exceeding High Single Figure constant currency earnings^ growth, up 11.8%Exceeding High Single Figure constant currency earnings^ growth, up 11.8%
Dividend up + 4% to 203.0pDividend up + 4% to 203.0p
Strong growth in the Strategic Portfolio, revenue up 8.5%*Strong growth in the Strategic Portfolio, revenue up 8.5%*
Outperforming in Combustibles: market share up +40bpsOutperforming in Combustibles: market share up +40bps
NGP revenue up +95%* to £901m*NGP revenue up +95%* to £901m*
Strong results across the US businessStrong results across the US business
Strong Strategic Portfolio revenue growth, up +8.5%*Strong Strategic Portfolio revenue growth, up +8.5%*
26* Representative, adjusted and constant rate basis. See Appendix, notes A1, A2 and A3.^ Adjusted diluted earnings per share at constant rates. See Appendix, note A3.

Appendix
27
A1: Representative basisWhere appropriate, the Group is also presenting (as a supplement to the results) the 2018 performance against 2017, as though the Group had owned the acquisitions made in 2017 for the whole of that year. Comparison of results on this basis are termed “on a representative basis” and provide shareholders with a results comparison representative of the position as if the Group had owned the acquisitions throughout 2017 and 2018.
A2: Adjusting (Adj.)Adjusting items are significant items of certain financial measures which individually or, if of a similar type, in aggregate, are relevant to an understanding of the Group’s underlying financial performance because of their size, nature or incidence. In identifying and quantifying adjusting items, the Group consistently applies a policy that defines criteria that are required to be met for an item to be classified as adjusting. The Group believes that these additional measures, which are used internally, are useful to users of the financial information in helping them understand the underlying business performance.
A3: Constant currencyMovements in foreign exchange rates have impacted the Group's financial results. Measures are calculated based on a retranslation, at prior year’s exchange rates, of the current year’s results of the Group and where, applicable, its segments. Although the Group does not believe that these measures are a substitute for IFRS measures, the Group management board does believe that such results excluding the impact of currency fluctuations year on year provide additional useful information to investors regarding the Group's operating performance on a local currency basis.
A4: Share metricsKey Market offtake share: as independently measured by retail audit agencies (including Nielsen), shipment share estimates, and share of retail for the US business, based upon latest available validated data.Volume share: The retail sales volume of the product sold as a proportion of total retail sales volume in that category.Value share: The retail sales value of the product sold as a proportion of total retail sales value in that category.Exit share: The retail sales volume of the product as at a specific date sold as a proportion of total retail sales volume in that category at that date.Premium share: The retail sales volume of the premium product sold as a proportion of total retail sales volume of premium products in that category.

Top BAT Market Share Movements (1)
Market SOM FY18(%)
Movement(ppt)
Argentina 23.3 (0.4)
Australia 41.2 1.0
Bangladesh 67.1 1.6
Belgium 25.3 (0.7)
Brazil 77.6 (1.7)
Canada 48.6 (0.1)
Chile 95.9 0.1
Colombia 51.2 1.0
Czech Republic 22.0 0.5
Denmark 72.1 (0.5)
Market SOM FY18(%)
Movement(ppt)
France 17.3 (0.1)
KSA 38.9 9.3
Germany 20.4 (0.2)
Indonesia 8.0 0.5
Italy 18.7 0.0
Japan 16.3 2.4
Kazakhstan 16.9 0.2
Malaysia 56.3 0.0
Mexico 34.0 1.9
Netherlands 23.7 (1.2)
Source: Retail Audit except for Bangladesh, Belgium, Canada, Indonesia and Japan
28

Top BAT Market Share Movements (2)
Market SOM FY18(%)
Movement(ppt)
New Zealand 71.6 1.2
Pakistan 71.3 0.0
Poland 28.4 (0.1)
Russia 22.0 (0.3)
South Africa 78.3 (0.5)
South Korea 12.3 (1.4)
Market SOM FY18(%)
Movement(ppt)
Spain 11.4 0.2
Switzerland 37.0 (0.5)
Taiwan 9.9 (0.7)
Turkey 23.0 0.7
UK 9.4 (0.2)
Vietnam 21.3 (1.0)
Source: Retail Audit except for New Zealand, Switzerland and Vietnam
29

Preliminary Results 201828th February 2019
30