preliminary results of repeated … fileamong the first gps geodynamics projects in czech republic...
TRANSCRIPT
Acta Geodyn. Geomater., Vol. 8, No. 3 (163), 291–301, 2011
PRELIMINARY RESULTS OF REPEATED MEASUREMENTS IN LOCAL GEODYNAMIC NETWORK MORAVA
Otakar ŠVÁBENSKÝ 1)*, Michal WITISKA 1), Jan RATIBORSKÝ 2), Radim BLAŽEK 2), Lubomil POSPÍŠIL 1) and Josef WEIGEL 1)
1) Institute of Geodesy, Faculty of Civil Engineering, Brno University of Technology 2) Department of Geodesy and Land Consolidation, Faculty of Civil Engineering, CTU Prague *Corresponding author‘s e-mail: [email protected] (Received January 2011, accepted May 2011) ABSTRACT Among the first GPS geodynamics projects in Czech Republic the MORAVA network was founded in 1994 with aim todetermine the positional changes at border zone between the Bohemian Massif and the Carpathians. Initial project includedthree successive GPS campaigns in period 1994 – 1996, but was not continued because of lack of support. It had beenpossible to carry out new measurements in southern part of the MORAVA network including five stations, after gap of15 years. In the paper comparison of previous and contemporary results of epoch GPS measurements are presented, whichindicate block movement tendencies at the Bohemian Massif and the Western Carpathians border, thus confirming activity ofthe area up to present days. KEYWORDS: Southern Moravia., fault, tectonics, GPS displacements, movement tendencies
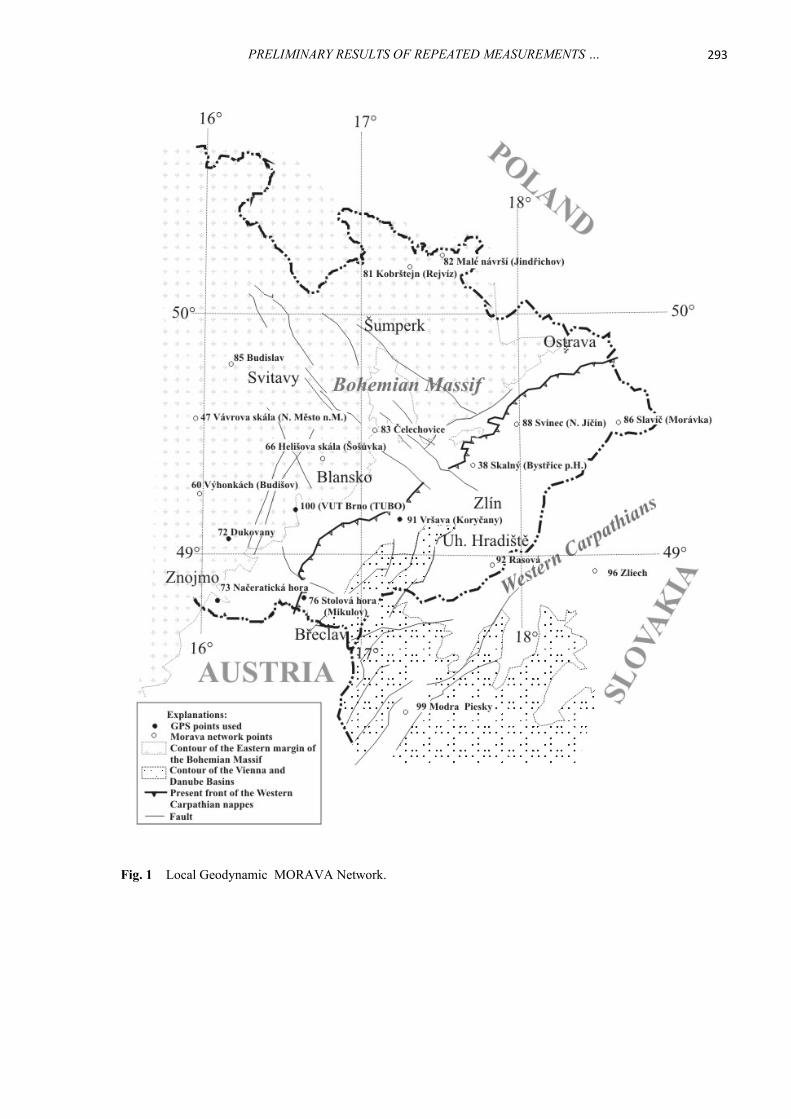
MORAVA NETWORK Layout – MORAVA network includes 19 points, 17 in Czech Republic (CR) and 2 in Slovak Republic (SR). 11 points are on side of the Bohemian Massif, and 8 points are on side of the Carpathian Arc (Fig. 1 and Table 1- Foldyna et al., 1997). Point 100 – TEME (Temelín) is outside in Figure 1.
Great care had been paid to selection of points location with respect to geological and geodetic aspects. Definite locations were determined after careful prospecting and after consultation with local special authorities. Monumentation – All points of the geodynamic network (with exception of one) are monumented so as to enable forced centring of GPS antennas. Most of the points are monumented directly on rock outcrops, with 0.30 m long underground part firmly attached into bedrock by concrete. Two points have markers welded to casing of deep boreholes. The centring rod of 0.28 m length is inserted into the underground part and the connection is fixed by screwed sleeve casing. The rod serves as carrier of GPS antenna. Individual rod is used on each network point in all measuring epochs.
Testing campaign had been carried out in December 1994, with only 8 occupied network points, also observed were the stations MOPI and TUBO. Observation time was 8 hours.
INTRODUCTION The local geodynamic MORAVA network was
established for the purpose of monitoring the supra-crustal blocks motions at the Bohemian Massif andthe Alpine-Carpathian Arc border, which is formed byNeogene and thick Quaternary sediments. The initialproject realized in years 1994-1996 passed as projectof Grant Agency of Czech Republic Nr. 105/94/J124.The applicants of the project were TechnicalUniversity (TU) Ostrava, Faculty of Mining andGeology, and Czech Technical University (CTU)Prague, Faculty of Civil Engineering.
In 2010, after 16 years pause, the project hadbeen partially continued by Brno University ofTechnology (BUT) internal research project whichincluded re-observation of 5 points at South Moravia,with permanent station TUBO as reference. Themeasurements followed the monitoring of movementtrends along the Čebín-Diendorf Tectonic Zone.
Basic results of the repeated GPS measurementsare presented in the paper, which revealed surprisinginformation about movements of some blocks at theBohemian Massif and the Western Carpathiansborder. Problems of the MORAVA network pointsmonumentation, identification and renewal,measurement methodology, and data processingprocedure are also discussed.
O. Švábenský et al.
292
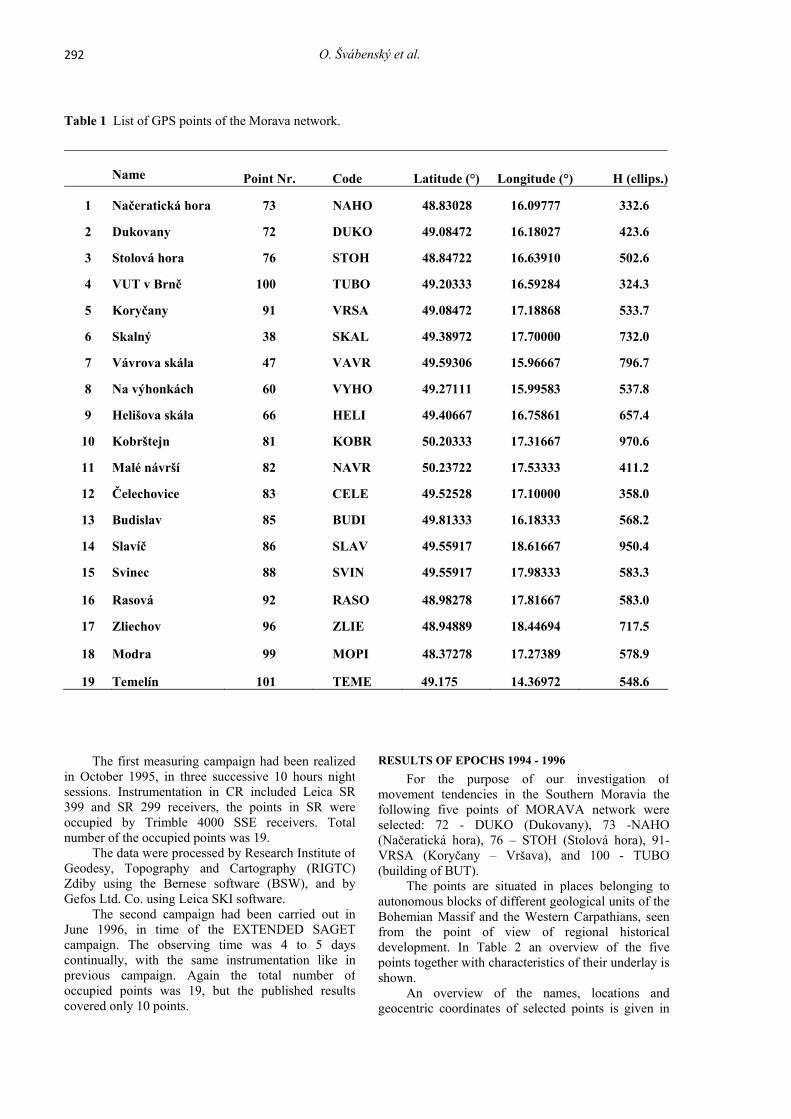
Table 1 List of GPS points of the Morava network.
Name Point Nr. Code Latitude (°) Longitude (°) H (ellips.)
1 Načeratická hora 73 NAHO 48.83028 16.09777 332.6
2 Dukovany 72 DUKO 49.08472 16.18027 423.6
3 Stolová hora 76 STOH 48.84722 16.63910 502.6
4 VUT v Brně 100 TUBO 49.20333 16.59284 324.3
5 Koryčany 91 VRSA 49.08472 17.18868 533.7
6 Skalný 38 SKAL 49.38972 17.70000 732.0
7 Vávrova skála 47 VAVR 49.59306 15.96667 796.7
8 Na výhonkách 60 VYHO 49.27111 15.99583 537.8
9 Helišova skála 66 HELI 49.40667 16.75861 657.4
10 Kobrštejn 81 KOBR 50.20333 17.31667 970.6
11 Malé návrší 82 NAVR 50.23722 17.53333 411.2
12 Čelechovice 83 CELE 49.52528 17.10000 358.0
13 Budislav 85 BUDI 49.81333 16.18333 568.2
14 Slavíč 86 SLAV 49.55917 18.61667 950.4
15 Svinec 88 SVIN 49.55917 17.98333 583.3
16 Rasová 92 RASO 48.98278 17.81667 583.0
17 Zliechov 96 ZLIE 48.94889 18.44694 717.5
18 Modra 99 MOPI 48.37278 17.27389 578.9
19 Temelín 101 TEME 49.175 14.36972 548.6
RESULTS OF EPOCHS 1994 - 1996 For the purpose of our investigation of
movement tendencies in the Southern Moravia thefollowing five points of MORAVA network were selected: 72 - DUKO (Dukovany), 73 -NAHO (Načeratická hora), 76 – STOH (Stolová hora), 91-VRSA (Koryčany – Vršava), and 100 - TUBO (building of BUT).
The points are situated in places belonging to autonomous blocks of different geological units of the Bohemian Massif and the Western Carpathians, seen from the point of view of regional historical development. In Table 2 an overview of the five points together with characteristics of their underlay is shown.
An overview of the names, locations and geocentric coordinates of selected points is given in
The first measuring campaign had been realizedin October 1995, in three successive 10 hours nightsessions. Instrumentation in CR included Leica SR399 and SR 299 receivers, the points in SR wereoccupied by Trimble 4000 SSE receivers. Totalnumber of the occupied points was 19.
The data were processed by Research Institute ofGeodesy, Topography and Cartography (RIGTC)Zdiby using the Bernese software (BSW), and byGefos Ltd. Co. using Leica SKI software.
The second campaign had been carried out inJune 1996, in time of the EXTENDED SAGETcampaign. The observing time was 4 to 5 dayscontinually, with the same instrumentation like inprevious campaign. Again the total number ofoccupied points was 19, but the published resultscovered only 10 points.
PRELIMINARY RESULTS OF REPEATED MEASUREMENTS …
293
Fig. 1 Local Geodynamic MORAVA Network.

O. Švábenský et al.
294
Table 2 Overview of the geological units under selected MORAVA network points.
72 DUKO (Dukovany) Gneisses and granulites of the Moldanubian Varied Group
73 NAHO (Načeratická hora) Granitoids of the Dyje massif (Brunovistulicum)
76 STOH (Stolová hora) Jurassic Limestone of the Waschberg-Ždánice unit
91 VRSA (Koryčany – Vršava) Soláň Formation of the Magura (Rača) unit
100 TUBO Granitoids of the Brno massif (Brunovistulicum)
Table 3 Approximate ITRF geocentric coordinates of the selected MORAVA network points.
Point 1995 Number/Location Name X [m] Y [m] Z [m] 72- Dukovany DUKO 4019778.6 1166352.0 4797078.1 73-Načeratická hora NAHO 4042237.1 1166561.0 4778124.2 76-Stolová hora STOH 4029954.3 1204373.2 4779337.2 91-Vršava VRSA 3997620.2 1236604.5 4798139.0
100-VUT Brno TUBO 4001470.6 1192345.3 4805795.3
Table 4 MORAVA network - Baseline lengths and differences 1994-1996 in meters.
Baseline 1994 1995 1996 Differences 1996-1995
Differences 1995-1994
TUBO-NAHO 55609.694 55609.690 55609.692 0.002 -0.004 TUBO-DUKO 32967.007 32967.005 32967.003 -0.002 -0.002 TUBO-STOH 40694.290 40694.276 -0.014 TUBO-VRSA 45081.215 45081.211 -0.004 NAHO-DUKO 29388.504 29388.500 29388.502 0.002 -0.004 NAHO-STOH 39775.637 39775.647 0.010 NAHO-VRSA 85424.564 85424.557 -0.007 STOH-DUKO 43172.848 43172.846 -0.002 STOH-VRSA 49374.679
DUKO-VRSA 73671.733 73671.725 -0.008
it is possible to corroborate existence of tectonic activity, but it is much more difficult to reliably quantify and orient the particular movement trends, especially from relatively short periods of monitoring. Recommended continuation of measurements in the MORAVA network using latest precise GNSS instrumentation and respecting the gained knowledge could be realized in 2010 – after more than 15 years.
Table 3 (Foldyna et al., 1997). Resulting baselinedistances in epochs 1994-1996 and respective baselinelength differences are shown in Table 4 (Foldyna etal., 1997).
The results gained from the campaigns indicateda possible relative movement of the Alpine-Carpathian segment with respect to the BohemianMassif. These findings led the authors to opinion that

PRELIMINARY RESULTS OF REPEATED MEASUREMENTS …
295
centring markers (with exception of the point VRSA with monumentation on casing of the geological borehole (Fig. 2), where the original antenna centring marker could be accessed only after removing of the cover extender).
• Measurement methodic - Within the remeasurements in part of the MORAVA network again the Leica instrumentation was used, namely the receivers SR520/530 and GX1230GG and the antennas LEIAT502, LEIAX1202GG a LEIAT504/504GG. Observing intervals were 24 hours. At three points (NAHO, STOH, VRSA) the antennas were attached to original special centring rod which is in more details described in Foldyna et al. (1997), Švábenský and Weigel (2005), at the point DUKO the antenna was centered with help of a tripod, and the point TUBO is a permanent GPS station included in EPN and CZEPOS structures.
• The data measured in campaigns 2009-2010 were processed by means of BSW 5.0 and concurrently by BSW 4.2 (according to the original processing of campaigns 1994-1996). Processing parameters were an elevation mask 10º, IGS precise orbits and earth rotation parameters, absolute antenna phase center offsets and variations, QIF strategy of ambiguity solution, troposphere parameters
NEW MEASUREMENTS IN SOUTHERN PART OF MORAVA NETWORK
In connection with other tasks resolved in period2009-2010 the Institute of Geodesy of BrnoUniversity of Technology (BUT) seized anopportunity to realize repeated measurements in part of the MORAVA geodynamic network, whichfollowed previous activities from the period 1994-1996. The measurements concerned the abovementioned 5 points situated in Southern Moraviaregion. The works could be successfully accomplishedi.e. thanks to courtesy of interested staff members ofthe Department of Geodesy and Land Consolidationof Czech Technical University in Prague (CTU) whosupplied besides the necessary information and theoriginal observation data from previous campaignsalso the original special antenna centring equipmentused in the previous MORAVA network campaigns. • Reobserved points - The five points at Southern
Moravia: 72-DUKO, 73-NAHO, 76-STOH, 91-VRSA, and 100-TUBO were selected for re-measurement. Firstly the preparativereconnaissance of the actual state of the pointsmonumentation markers had been realized,including the assessment of their usability.
• At all the points concerned it had been possible toidentify uniquely the original position of the
Fig. 2 Examples of point monumentations in the Morava network (Left - VRSA point, right – NAHO point).

O. Švábenský et al.
296
Table 5 MORAVA network - Baseline lengths.
Baseline
1995 [m]
2009 [m]
2010 [m]
Differences 1995-2010 [m]
Annual velocities [mm/year]
TUBO-NAHO 55609.6905 55609.6949 55609.6948 0.0043 0.3
TUBO-DUKO 32967.0045 32967.0015 -0.0030 -0.2
TUBO-STOH 40694.2764 40694.2862 0.0098 0.7
TUBO-VRSA 45081.2146 45081.2291 0.0145 1.0
NAHO-DUKO 29388.5003 29388.5046 0.0043 0.3
NAHO-STOH 39775.6470 39775.6456 -0.0014 -0.1
NAHO-VRSA 85424.5644 85424.5878 0.0234 1.6
STOH-DUKO 43172.8455 43172.8464 0.0009 0.1
STOH-VRSA 49374.6791 49374.7074 0.0283 1.9
DUKO-VRSA 73671.7331 73671.7474 0.0143 1.0
Session times 3 x 10 hours 22 hours 24 hours
1995 and 1996 were reprocessed. It allowed to compute the coordinates of some points which were not included in published results – i.e. points TUBO and VRSA in 1996 campaign.
It is clear from the Table 6 that there are no substantial differences between the results obtained with BSW 4.2 and 5.0 for this network – maximal baseline difference was 4 mm and maximal velocity difference was 0.3 mm/year.
The above presented results are preliminary in sense that only baseline lengths were computed with reference station TUBO positions constrained to ITRF coordinates (EUREF) for each particular epoch. Another reason was the lack of complete observation information for campaigns 1994-1996 – antenna heights were not exactly known (+/- 0.1 m uncertainties).
estimated for 2 hours intervals. The final solutionwas computed using iono-free frequencycombination. Differences in the results computedwith ambiguities resolved by QIF and narrowlane strategies were negligible.
Table 5 shows the resulting baseline lengthsbetween the five MORAVA network points from theprevious campaign 1995 (Foldyna et al., 1997), andfrom the remeasurement as well as the differencesbetween the results of previous and newmeasurements together with the estimation of annualvelocities (Fig. 3). The 1995 campaign was selectedas reference for the comparison because this campaign alone is the most complete and includes allthe 5 points concerned.
To check the consistency of previous and newprocessing results the original data from campaigns
Table 6 MORAVA network - Comparison of BSW 4.2 and 5.0 processing.
Baseline Difference BSW 4.2 - 5.0 [m] Annual Velocity [mm/year] Velocity Difference from to 1995.80 2010.57 BSW 4.2 BSW 5.0 BSW 4.2 - 5.0 [mm/year]
TUBO-NAHO -0.001 -0.002 0.3 0.2 -0.1 TUBO-DUKO 0.000 0.001 -0.2 -0.2 0.0 TUBO-STOH 0.000 -0.002 0.7 0.4 -0.3 TUBO-VRSA -0.003 -0.004 1.0 0.9 -0.1 NAHO-DUKO -0.001 -0.002 0.3 0.2 -0.1 NAHO-STOH -0.001 0.000 -0.1 0.0 0.1 NAHO-VRSA -0.004 -0.004 1.6 1.5 -0.1 STOH-DUKO 0.000 -0.004 0.1 -0.1 -0.2 STOH-VRSA -0.001 -0.002 1.9 1.9 0.0 DUKO-VRSA -0.003 -0.002 1.0 1.0 0.0

PRELIMINARY RESULTS OF REPEATED MEASUREMENTS …
297
A
B
Fig. 3 Estimated velocities of the selected GPS points of the MORAVA network. A. Differences of period 15 years, B. Annual velocities and the horizontal movement tendencies. Red arrow – direction of compression; blue arrow – direction of extension.
O. Švábenský et al.
298
growth strata of Badenian to Pannonian age (16.0 to 10 Ma). Outcrop and seismic data indicate that probably all of the listed deformations occurred contemporaneously with sinistral strike-slip faulting along NNE-to NE-striking wrench faults.
INTERPRETATION
The resulting changes over 15 years period were expressed in the form of baseline differences between single network points and subsequently divided into three categories: extension zones, compression zones, and stable zones where the annual velocity is under 0.5 mm (Figs. 3 and 4, Table 5).
The resulting preliminary horizontal differences were supplemented by map of recent vertical changes (Vyskočil and Pospíšil, 2009 - Fig. 5), from which the uplift of blocks located between main faults of NE-SW direction is observable. Tectonic zones alone are manifest of the subsidence tendencies. The compression between points at the Bohemian Massif (DUKO - TUBO - NAHO points) and points situated on the nappes of the Western Carpathians (VRSA -STOH points) is observable in Figure 4. In all other cases the extension movements were detected. The more detail analyses of the movements along single faults indicate the significant counter wise trend. On the Waizendorf fault it is possible to interpret dextral movement; the points NAHO and DUKO are drawing apart while the points DUKO and TUBO are drawing near. This tendency confirms the detail GPS measurements at the Znojmo polygon (Witiska, 2011).
Significant sinistral movement can be interpreted between the points STOH and VRSA, also between the points NAHO and VRSA (Fig. 6). One of possible explanations is the connection of the recent movement with the tectonic zone where many normal and thrusted faults can be observed (Ciprys and Thon, 1990; Němec, 1973). In addition, with this zone the opening of the Vienna Basin is connected and most of known faults reach to the crystalline basement formed by the Brunovistulicum here (Dudek, 1980).
CONCLUSION
Regarding the expected values of points positional changes it will be necessary to carry out the measurements in equal extent at least in 5 years period. In relation with the geologic development of the region it would be convenient to densify the network in some localities, in particular in the area between the points STOH and VRSA. Respecting the previous geodetic measurements it would be also beneficial to realize repeated gravity measurements on selected points.
In present time the idea of supplying new GPS measurements in greater extent of the MORAVA network is being negotiated. This task would be realized in cooperation with other expert groups from CTU Prague, Czech Academy of Sciences (CAS), Slovak University of Technology Bratislava,
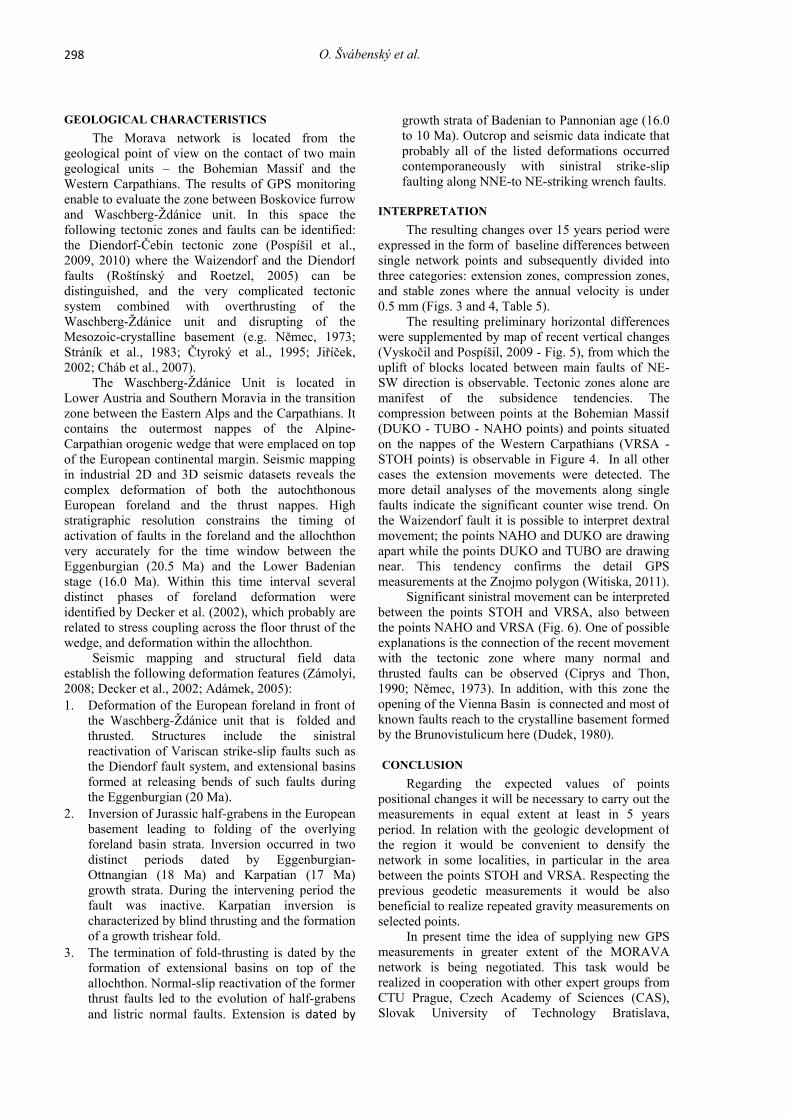
GEOLOGICAL CHARACTERISTICS The Morava network is located from the
geological point of view on the contact of two maingeological units – the Bohemian Massif and theWestern Carpathians. The results of GPS monitoringenable to evaluate the zone between Boskovice furrowand Waschberg-Ždánice unit. In this space thefollowing tectonic zones and faults can be identified: the Diendorf-Čebín tectonic zone (Pospíšil et al.,2009, 2010) where the Waizendorf and the Diendorffaults (Roštínský and Roetzel, 2005) can bedistinguished, and the very complicated tectonicsystem combined with overthrusting of theWaschberg-Ždánice unit and disrupting of theMesozoic-crystalline basement (e.g. Němec, 1973;Stráník et al., 1983; Čtyroký et al., 1995; Jiříček,2002; Cháb et al., 2007).
The Waschberg-Ždánice Unit is located inLower Austria and Southern Moravia in the transitionzone between the Eastern Alps and the Carpathians. Itcontains the outermost nappes of the Alpine-Carpathian orogenic wedge that were emplaced on topof the European continental margin. Seismic mappingin industrial 2D and 3D seismic datasets reveals thecomplex deformation of both the autochthonousEuropean foreland and the thrust nappes. Highstratigraphic resolution constrains the timing ofactivation of faults in the foreland and the allochthonvery accurately for the time window between theEggenburgian (20.5 Ma) and the Lower Badenianstage (16.0 Ma). Within this time interval severaldistinct phases of foreland deformation wereidentified by Decker et al. (2002), which probably arerelated to stress coupling across the floor thrust of thewedge, and deformation within the allochthon.
Seismic mapping and structural field dataestablish the following deformation features (Zámolyi, 2008; Decker et al., 2002; Adámek, 2005): 1. Deformation of the European foreland in front of
the Waschberg-Ždánice unit that is folded andthrusted. Structures include the sinistralreactivation of Variscan strike-slip faults such asthe Diendorf fault system, and extensional basinsformed at releasing bends of such faults duringthe Eggenburgian (20 Ma).
2. Inversion of Jurassic half-grabens in the Europeanbasement leading to folding of the overlyingforeland basin strata. Inversion occurred in twodistinct periods dated by Eggenburgian-Ottnangian (18 Ma) and Karpatian (17 Ma)growth strata. During the intervening period thefault was inactive. Karpatian inversion ischaracterized by blind thrusting and the formationof a growth trishear fold.
3. The termination of fold-thrusting is dated by theformation of extensional basins on top of theallochthon. Normal-slip reactivation of the formerthrust faults led to the evolution of half-grabensand listric normal faults. Extension is dated by

PRELIMINARY RESULTS OF REPEATED MEASUREMENTS …
299
Fig. 6 Final results of preliminary kinematic analyses in the South Moravia. Measured movement tendencies(Fig. 3B) combined with simplified tectonic map suggest the dextral movement along the Waizendorffault and sinistral displacement along the Bulhary - Steinberg-Schrattenberg (?) fault zone: Dashed anddotted lines - compression and extension movements respectively. Grey contour – Ždánice – Waschbergunit in Moravia. Arrows – trend of movement.
ACKNOWLEDGEMENT The contribution was elaborated with support of
Grant No. BD 12001028 of the Brno University of Technology and also with support of EU project reg. nr. CZ. 1.05/2.1.00/03.0097 within the regional center “AdMaS”. REFERENCES Adámek, J.: 2005, The Jurassic floor of the Bohemian
Massif in Moravia – geology and paleogeography. Czech Geol. Survey, Bull. Geosciences 80 (4), 291–305.
Ciprys, V. and Thon, A.: 1990, Deep-seated structures of the Bohemian Massif in the region between the Vranovice
University of Environmental and Life SciencesWroclaw, and others. Within the scope of thiscooperation new significant results and geodynamicinformation could be acquired and connection to otherexisting GNSS networks in the region could berealized.
In fine it is to say that the previous measuringcampaigns in the MORAVA local geodynamicnetwork were unique by the fact that in Czech andSlovak Republics never before operated so many GPSreceivers of one type (Leica) simultaneously. But themost valuable is the information about positionalchanges over the period of 15 years.

O. Švábenský et al.
300
1.
Pospíšil. L., Švábenský, O., Weigel, J. and Witiska, M.: 2010, Geological constraints on the GPS and precise levelling measurements along the Diendorf-Čebín tectonic zone. Acta Geodyn. Geomater., 7, 3 (159), 317–333.
Roštínský, P., and Roetzel, R.: 2005, Exhumed Cenozoic landforms on the SE flank of the Bohemian Massif in the Czech Republic and Austria. Zeitschr. Geomorphologie, Tübingen, Germany 49 (1), 23–45.
Stráník, Z., 1983, Outer Carpathians in South Moravian. 18th
European Colloquium Micropaleontology. Excursion guide, 1, GUDŠ Bratislava, 67–174.
Švábenský, O. and Weigel, J.: 2005, Impact of some site dependent factors on GPS displacement monitoring. Acta Geodyn. Geomater., 2 (3), 43–47.
Vyskočil, J. and Pospíšil, L.: 2009, Recent relief movements of Czech Republic, In: Hrnčiarová, T., et al., 2009, Landscape Atlas of the Czech Republic. Ministry of the Environment of the Czech Republic, The Silva Tarouca Research Institute for Landscape and Ornamental Gardening, p. r. i., Praha – Průhonice, 352 pp. Name and Number of the Project SK/600/01/03, ISBN 978-80-85116-5.
Witiska, M.: 2011. Geodetical measurement in the Tetčice, Znojmo and Morava networks. Proceedings of conference JUNIORSTAV 2011, section 6.1 Geodesy, FCE BUT Brno, CD Rom.
Zámolyi, A., Decker, K., Hölzel, M., Strauss, P. and Wagreich, M.: 2008, Kinematics and timing of deformation at the front of the Alpine-Carpathian wedge (Waschberg-Ždánice Unit, Austria-Czech Republic). EGU General Assembly 2008, Geophysical Research Abstracts, 10, EGU2008-A-04297.
graben and the Czechoslovak-Austrian frontier. In Eds Minaříková D. and Lobitzer H.. “Thirty years ofgeological cooperation between Austria andCzechoslovakia”, Chapt.: Structural geology andgeophysics, Federal Geol. Survey Vienna and Geol.Survey Prague, 18–23.
Čtyroký, P., Havlíček, P., Stráník, Z. and Pálenský, P.:1995, Geologic and natural-scientific map of CHKO and BR Pálava. 1:25.000. Czech Geologic InstitutePrague, (in Czech) .
Decker, K., Hinsch, R. and Peresson, H.: 2002, Activetectonics and the earthquake potential in EasternAustria. ENTEC Spring Workshop Vienna, Institut fürGeologie der Universität Wien, 12, April 2002.
Dudek, A.: 1980, The crystalline basement of the OuterCarpathians In Moravia - Brunovistulicum. Rozpr. Čs.akad. věd, řada mat-přír. Praha, 90 (8), 1–85.
Foldyna, J., Ratiborský, J., Kabeláč, J., Blažek, R., Grygar,R., Novák, J., Schenk, J., Gavlovský, E., Tyrner, M.,Kubečka, E. and Mikulenka, V.: 1997, Final report ofthe grant project GA CR Nr. 105/94/1124 –Monitoring the supracrustal blocks movements at theCzech Massif and Alpine-Carpathian Arc border byGlobal Positioning System (GPS) method. MS archiveVŠB – Technical University Ostrava and CTUPrague, 51 pp., (in Czech).
Cháb, J., Stráník, Z. and Eliáš, M.: 2007, Geological map of the Czech Republic 1:500.000. Czech GeologicalSurvey Prague.
Jiříček, R., 2002, The Evolution of the Mollase in theAlpino-Carpathian Foredeep and the Vienna Basin.EGRSE Journal, IX, 1-2, 178 pp.
Němec, F.: 1973, Geologie des autochthonen Paläogens anden südöstlichen Hängen der Böhmischen Masse inMähren. Sb. Geol. Věd, Geologie, řada G, sv. 24,125–174.
Pospíšil, L., Švábenský, O., Weigel, J. and Witiska, M.:2009, Geodetical and geophysical analyses ofDiendorf-Čebín tectonic zone. Acta Geodyn.Geomater., 6, 3 (155), 309–321.

O. Švábenský et al.: PRELIMINARY RESULTS OF REPEATED MEASUREMENTS …
Fig. 4 Final results of preliminary movement tendencies combined with tectonic map (ČGS -Praha): Red andblue arrows - extension and compression directions respectively. Red heavy line – the Bulhary fault.
Fig. 5 Map of preliminary movement tendencies in the South Moravian area. Polygon of horizontal velocitiessupplemented by vertical velocities (Vyskočil and Pospíšil, 2009). The extension zones in central zoneof the polygon correlate with uplifted zones, while the compression zones are combined with decreasesof vertical velocities.