preliminary results
DESCRIPTION
Preliminary Results. year ended 30 September 2013. Story of 2013. Introduction. Further potential. ABEC (India), Trade-Link & ECMI (Malaysia ). Supports acquisition strategy. Good growth in mid tier events. Expansion of business in Asia. 12% profit growth. Strong year. - PowerPoint PPT PresentationTRANSCRIPT

Preliminary Results...................................................................................................................
year ended 30 September 2013...................................................................................................................

Introduction .......................................................................................................................................
ITE Group plc – Preliminary Results for the year ended 30 September 2013
Good growth in mid tier events
Expansion of business in Asia
ITE’s first step into China
2014 sales looking good
Story of 2013
Strong year
Further potential
ABEC (India), Trade-Link & ECMI (Malaysia)
Chinacoat
7% like-for-like revenue growth
12% profit growth
Strong balance sheet Supports acquisition strategy
2

Financial Results...............................................................................................
2013
01

Financial Results 2013...................................................................................................................
ITE Group plc – Preliminary Results for the year ended 30 September 2013
Financial Highlights for the year to 30 September 2013
2013 2012
Audited Audited
Revenue £192.3m £172.3m
Gross profit margin 46% 45% Biennial impact
Administrative expenses £31.2m £26.6m
Headline profit before tax £59.4m £53.0m +12%
Headline diluted EPS 19.3p 16.9p
Dividend per share 7.0p 6.5p
Net trading +£12mBiennial +£4mAcquisitions +£4m
Net trading +£12mBiennial +£4mAcquisitions +£4m
+12%
+14%
+8%
4
+12% Investment in staff & infrastructure
Reduction in effective tax rate

Financial Results 2013...................................................................................................................
ITE Group plc – Preliminary Results for the year ended 30 September 2013
2012 Headline
PBT
Net Biennial
Effect
Timing
£M
Portfolio growth
Acquisitions 2013 Headline
PBT
53.0
3.8
(0.9)
59.4
5.5
1.5
30
40
50
60
2012 to 2013 Headline PBT Bridge
Overheads & FX & Financing
(3.5)
5

Financial Results 2013...................................................................................................................
ITE Group plc – Preliminary Results for the year ended 30 September 2013
Net cash Sept 12
Cash Flow from operations
Tax
£M
Acquisitions & def considerations
Net cash Sept 13
Dividends Other
62.1
13.0
66.2 (16.4)
23.5
(2.1)
(26.1)
ABEC £14.0mTrade-Link £4.1mECMI £1.7mTurkeybuild (20%) £5.0mOther £1.3m
ABEC £14.0mTrade-Link £4.1mECMI £1.7mTurkeybuild (20%) £5.0mOther £1.3m
(11.1)
10
20
30
40
70
60
50
80 112% of Headline PBT112% of Headline PBT
2012 to 2013 Cashflow Bridge
6

Financial Results 2013...................................................................................................................
ITE Group plc – Preliminary Results for the year ended 30 September 2013
Sales and Yield Analysis
Metres Revenue GrossProfit Yield
000s £m £m Per m²
2012
Results from Events 798 171.2 77.5
Non annual 2012 (74) (9.3) (3.4)
Recurring Events 724 161.9 74.1 224
2013
Acquisitions 25 3.8 1.9
Timing differences (15) (3.0) (0.9)
Organic growth 12 15.5 5.9
Recurring Events 746 178.2 81.0 239
2013Non annual 2013 47 13.2 7.2
Results from Events 793 191.4 88.2
7
25 launches£4m revenue25 launches£4m revenue

Financial Results 2013...................................................................................................................
ITE Group plc – Preliminary Results for the year ended 30 September 2013
Currency & Hedging
Currency of Sale 2014 (F) % 2013 %
Average Translation Rate
2014YTD
2013
EUR 40 40 1.19 1.20
RUB 30 30 52 49
GBP, YTL, US$ & other 30 30
Exposure to currency fluctuation over March-April-May
€ 1.17 in 2012€ 1.17 in 2012
Forward cover on €/£ €70m @ €1.20 (2014-2016)
Exposure to sterling strength, currently £: R54Exposure to sterling strength, currently £: R54
8
1 cent = £0.3m : 1 Ruble = £0.5m

Financial Results 2013...................................................................................................................
ITE Group plc – Preliminary Results for the year ended 30 September 2013
Trading Update – 2014 Contracted Revenue
54% 56% 52% 56% 56%
b
20
40
60
80
%
FY 2010 FY 2011 FY 2012 FY 2013
£93m£95m£74m
52% 53%55%56%
FY 2014*
£54m
56%
10
£106m
% booked to 29th November 2013 of Event Year
£m Sales Booking – FY2014
Event Financial Year* FY 2014% of Full year revenue is based on the analyst consensus of £193m
9

Strategy.................................................
2013
02

Strategy .................................................................................................................................................
ITE Group plc – Preliminary Results for the year ended 30 September 2013
‘Create sustainable growth in headline earnings per share’
By building sustainable positions of market leadership
in exhibitions in emerging markets
11

Strategy .................................................................................................................................................
ITE Group plc – Preliminary Results for the year ended 30 September 2013
Implementing Strategy
Strategy
Improve existing
positions
Expand to new geographies &
sectorsBuild brands
Invest in staff
12

.................................................................................................................................................
ITE Group plc – Preliminary Results for the year ended 30 September 2013
ABEC (28% ownership, call on 32% in 2015)
Revenue £11.0m PBT £2.5m
Events: sqm• Acetech
Mumbai 27,000Delhi 22,000Kolkata new for 2014 Bengaluru 9,000Ahmedabad 4,000
• Real Estate8,000
• Education 9,000• Lifestyle 2,500• Other 5,000
100%Delhi
Mumbai
Bengaluru Chennai
KolkataAhmedabad
StrategyIndia
13

ITE Group plc – Preliminary Results for the year ended 30 September 2013
Shanghai
Hong Kong
Guangzhou
Kuala Lumpur
Asia
MALAYSIA Trade-Link ITE(75% ownership)
100% Revenue £2.3m
ECMI ITE (50% ownership)MALAYSIA100% Revenue £0.9m
CHINA Sinostar ITE (50% ownership)
Revenue @£11.0m PBT £6.5m
Singapore
Yangon
Ho Chi Minh
Jakarta
Bangkok
StrategyS.E Asia
.................................................................................................................................................
100%
14

Strategy .................................................................................................................................................
ITE Group plc – Preliminary Results for the year ended 30 September 2013
Building & Interiors Oil & Gas Travel &
TourismFood & Drink
Transport & Logistics
Metal-working Beauty Paper Coatings
Russia
Turkey
Ukraine
Kazakhstan
Azerbaijan India
Southeast Asia
China
Expanding the Business
Pre-2012
Post-2012
Existing business
New business
Launches
15

Strategy .................................................................................................................................................
ITE Group plc – Preliminary Results for the year ended 30 September 2013
Maximising Opportunities
Synergy
Strengthen brand identities
Harmonise data & improve customer
intelligence
Develop ‘vertical’ expertise
Develop portfolio
management
16

ITE Beauty Events 2013
Baku
Krasnodar
Kuala Lumpur
Jakarta
Yangon
ThailandHo Chi Minh City
Kyiv
Novosibirsk
.................................................................................................................................................Strategy
ITE Group plc – Preliminary Results for the year ended 30 September 2013
Istanbul
17
Launch for 2014

Strategy .................................................................................................................................................
ITE Group plc – Preliminary Results for the year ended 30 September 2013
Sustainable Growth 2003 to 2013
Hea
dlin
e di
lute
d EP
S (p
ence
)
Hea
dlin
e pr
ofit b
efor
e ta
x (£
m)
2003 2004 2005 2006 2007 2008 2009 2010 2011 2012 20130
10
20
30
40
50
60
70
0
5
10
15
20
25
30
35
£59.4m
19.3p
18

Divisional Analysis..............................................................................................................
2013
03
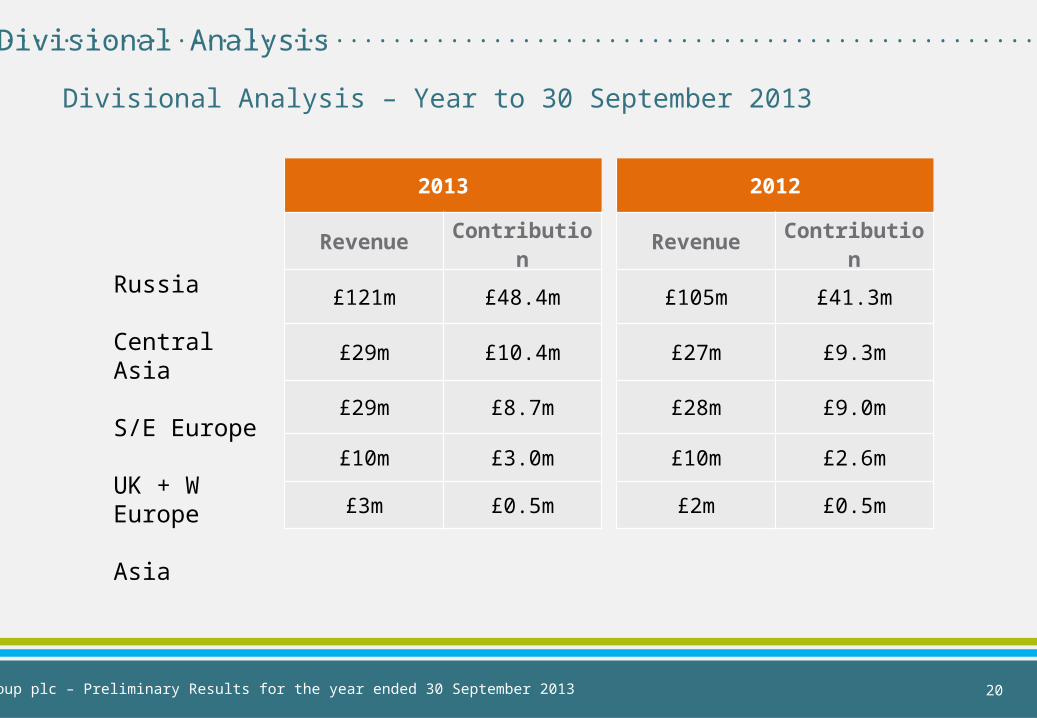
Divisional Analysis...........................................................................................................................
Divisional Analysis – Year to 30 September 2013
Russia
Central Asia
S/E Europe
UK + W Europe
Asia
2013
Revenue Contribution
£121m £48.4m
£29m £10.4m
£29m £8.7m
£10m £3.0m
£3m £0.5m
2012
Revenue Contribution
£105m £41.3m
£27m £9.3m
£28m £9.0m
£10m £2.6m
£2m £0.5m
ITE Group plc – Preliminary Results for the year ended 30 September 2013 20

Divisional Analysis...........................................................................................................................
Russia
2013 2012
m² ‘000 399 392
Revenue £121m £105m
L4L revenue growth 7%
ST. PETERSBURG
MosBuild resilienceMOSCOW
L4L revenue growth 15%
Good growth in industrial & mining portfolios
L4L revenue growth 13%
NOVOSIBIRSK
New venue expansion in 2016KRASNODAR
L4L revenue growth 27%
Volume & yield growth in new venue
ITE Group plc – Preliminary Results for the year ended 30 September 2013
Looking forward... Regional cloning
21

Divisional Analysis...........................................................................................................................
ITE Group plc – Preliminary Results for the year ended 30 September 2013
Central Asia
2013 2012
m² ‘000 82 80
Revenue £29m £27m
Looking forward... Steady growth
L4L revenue growth 10%
AZERBAIJAN
Construction reboundKAZAKHSTAN
L4L revenue growth 27%
More growth in new venue
L4L revenue decline (13%)
Significant timing differencesUZBEKISTAN
22

Divisional Analysis...........................................................................................................................
ITE Group plc – Preliminary Results for the year ended 30 September 2013
Eastern & Southern Europe
2013 2012
m² ‘000 252 269
Revenue £29m £28m
L4L revenue growth 2%
TURKEY
Beauty and Auto well integratedUKRAINE
L4L revenue flat
Portfolio rationalisation
Acquisition of Beauty Eurasia
Looking forward... More potential bolt-ons in Turkey
23

Divisional Analysis...........................................................................................................................
ITE Group plc – Preliminary Results for the year ended 30 September 2013
UK
2013 2012
m² ‘000 40 40
Revenue £10m £9m
L4L revenue growth 2%
Niche extensions trading well/mid market struggleUK
Looking forward... Extending niches overseas
Expansion overseas – The Hub (Hong Kong)
24

Divisional Analysis...........................................................................................................................
ITE Group plc – Preliminary Results for the year ended 30 September 2013
Asia
2013 2012
m² ‘000 18 18
Revenue £3m £2m
Looking forward... Geo-cloning & more acquisitions
INDIAABEC sales performing well
Re-focussing of ITE’s existing portfolio
Acquisition of ECMI & TradelinkSE ASIA
ECMI launch vehicle for clone events
Acquisition of ChinacoatCHINA
More acquisitions in pipeline
25

Summary ...............................................................................................................................................
ITE Group plc – Preliminary Results for the year ended 30 September 2013
Key messages
Good trading conditions & business momentum
Asian business to grow further
Investment in infrastructure & management
Building strength in key industry verticals
Strong balance sheet
26

Thank you.............................................................

Q & A....................................

Appendices...................................................................
2013
04

Appendices .........................................................................................................................................
ITE Group plc – Preliminary Results for the year ended 30 September 2013
Shareholder Structure at 27 October 2013
% No. of Shares(millions)
BlackrockSchrodersStandard LifeThreadneedle InvestmentsScottish WidowsLegal and GeneralOld MutualNBIMDirectors
ESOTOther Institutions and individuals
15.112.9 6.6 6.5 4.2 4.2 3.8 3.3 1.3
1.543.9
39.3 32.2 16.3 16.1 10.5 10.5 9.5 8.2 3.2
3.7107.8
Total Shares in issue 100 249.7
Options in the money: 0.1 0.2
Management including options in the money 1.6 3.4
Free float (Excluding Directors & ESOT) 97.2
Average daily trading volume (6 months) 0.3
30

Appendices .........................................................................................................................................
ITE Group plc – Preliminary Results for the year ended 30 September 2013
Key Exhibitions (in 2013 gross profit order)
Rank Event Location 2013 m² sold
2012 m² sold
1 MosBuild Moscow 68,700 66,100
2 MIOGE Moscow 24,000 22,800*
3 Turkeybuild (YAPI) Istanbul 36,200 36,100
4 World Food Moscow Moscow 24,900 24,400
5 Moscow International Travel & Tourism (MITT) Moscow 19,500 20,000
6 MODA UK (Spring & Autumn) Birmingham 35,400 36,000
* Last edition in 2011
Events by GP (2013):
45%31%
13%11%
31

Appendices .........................................................................................................................................
ITE Group plc – Preliminary Results for the year ended 30 September 2013
Consolidated Balance SheetSept -13
audited £‘mSept -12
audited £‘m
Non Current Assets
• Goodwill & Intangibles 122.3 131.0
• Other non-current assets 26.0 10.9
148.3 141.9
Current Assets
• Debtors due within 1 year 54.7 53.8
• Net Cash 23.5 13.0
78.2 66.8
Creditors
• Deferred Revenue & Creditors 100.9 92.4• Deferred Consideration 4.1 0.9
• Deferred Tax 11.4 14.4
• Provisions 0.8 1.2
117.2 108.9
Net Assets 109.3 99.8
£46.2m £38.6m
32

Appendices .........................................................................................................................................
ITE Group plc – Preliminary Results for the year ended 30 September 2013
Puts & calls £m Financial Years
Turkeybuild (20%) 4.6 2014
Summit (Turkmenistan) 1.0 2014
Scoop (Moda) (60%) 1.6 2014
ABEC (for extra 32%) TBC 2016
Tradelink 1.4 2015
ECMI TBC 2017 & 2019
£TBC
Future Consideration at Sept 2013
Deferred Consideration £m Financial Years
Jacket Required (UK) 0.3 2014
Beautex 0.2 2014
Tradelink 2.6 2014
ECMI 0.9 2014
Lentewenc 0.1 2014
4.1
33

Appendices .........................................................................................................................................
ITE Group plc – Preliminary Results for the year ended 30 September 2013
Venue relationships
Venue LocationTheme
ProtectionRates
AgreedPrepayments30 Sept 2013
Expocentre Moscow 2017 2015 -
Crocus Moscow 2015 2015 -
ExpoForum St Petersburg 2017 2017 -
Expocentre Novosibirsk 2021 2021 £2.2m
Expo City Yug Krasnodar 2016 2016 £0.4m
Atakent Almaty 2017 2017 £0.0m
IEC Kiev 2014 2014 £1.0m
Tuyap Istanbul 2014 2014 -
Uzexpocentre Tashkent 2019 2019 £0.2m
Expocentre Baku 2015 2015 £0.3m
TOTAL £4.1m
34

Appendices .........................................................................................................................................
ITE Group plc – Preliminary Results for the year ended 30 September 2013
Russia
Central Asia & Caucasus
2013 2012
62% 61%
15% 16%
Eastern & Southern Europe
15% 16%
UK & Western Europe
6% 6%
Asia 2% 1%
Construction
Oil & Gas
2013 2012
37% 42%
13% 7%
Food 10% 10%
Travel 8% 9%
Motor 5% 5%
Fashion
IT& Medical
Other
6% 6%
5% 5%
16% 16%
Revenue by Sector and Region
35

Financial Results 2013...................................................................................................................
ITE Group plc – Preliminary Results for the year ended 30 September 2013
2009 2010 2012
£M
20132011
£18M£20M
£24M
£30M
£26M
5
10
15
20
35
30
25
Overheads as % of revenue and Gross Profit
40
%
5
10
15
20
35
30
25
40
Overheads
% of Revenue
% of Gross Profit
36

Divisional Analysis...........................................................................................................................
ITE Group plc – Preliminary Results for the year ended 30 September 2013
GDP Growth in ITE’s Markets
2014 GDP growth forecast %
2015GDP growth forecast %
Russia 3.0 3.5
Kazakhstan 5.2 6.1
Azerbaijan 5.6 4.8
Uzbekistan 6.5 6.0
Ukraine 1.5 1.5
Turkey 3.5 4.3
UK 1.9 2.0
India 5.1 6.3
China 7.3 7.0
Source: IMF World Economic Outlook Database, Oct 2013
37