preliminary results 2016/17 strong food ... - tesco plc · preliminary results 2016/17 . serving...
TRANSCRIPT

Preliminary Results 2016/17
Serving Britain’s shoppers a little better every day
STRONG FOOD PERFORMANCE DRIVES SALES GROWTH PROFIT RECOVERY CONTINUES - AHEAD OF EXPECTATIONS
On a continuing operations basis
2016/17 2015/16 Change at
constant rates Change at
actual rates
Headline measures1:
Group sales2 £49.9bn £47.9bn 1.1% 4.3% Group operating profit before exceptional items3 £1,280m £985m 24.9% 29.9% Diluted EPS pre-exceptionals & IAS19 finance costs 7.90p 5.61p n/a 40.8% Retail operating cash flow4 £2,279m £2,088m n/a 9.1%
Net debt4,5 £(3,729)m £(5,110)m n/a down 27.0%
Statutory measures: Revenue
£55.9bn £53.9bn 0.8% 3.7% Operating profit £1,017m £1,072m (11.8)% (5.1)% Profit before tax £145m £202m (39.1)% (28.2)% Diluted EPS 0.81p 3.22p n/a (74.8)%
Headlines
Growth in sales2, volume, profit3 and cash4 • Group sales2 up 4.3% to £49.9bn • UK like-for-like sales6 up 0.9% - first reported full-year growth since 2009/10; UK food LFL up 1.3% • Positive volume growth in both UK & ROI and International • Group operating profit before exceptional items3 up 30% to £1,280m; UK & ROI up 60% to £803m • Step up in Group operating margin3 from 1.8% to 2.3%; on track for 3.5-4.0% ambition by 2019/20 • Retail operating cash flow4 up 9% to £2.3bn • Net debt4,5 of £(3.7)bn, down 27%; £1.9bn of debt repaid within the year • Statutory revenue up 3.7% to £55.9bn; PBT down year-on-year after £(235)m exceptional charge
booked post year-end following our agreement with SFO and FCA7 Six strategic drivers guiding our actions
• Brand health8 at strongest level in five years o Further improvement in core offer, including c.£300m investment in seven exclusive fresh food
brands in March 2016, contributing to sustained market outperformance in fresh food o Price of typical basket down 6% since Sept 2014; promotional participation down to 32% o Most improved food retailer for quality perception; record rating for staff helpfulness at 80% o Availability at record high; simpler range with 24% net reduction over two years
• Cost savings of £226m already achieved towards £1.5bn medium-term target; FY savings of £455m • Generated £2.3bn retail operating cash; £0.4bn underlying working capital9 inflow • More efficient mix across channels & products; improved service model in 1,500 stores • Released £0.5bn value10 from property; 1.0m sq. ft. space re-purposed; 16 stores re-purchased • Innovated to remove 14bn calories from soft drinks in two years; food donations up 148% as
FareShare FoodCloud now in all large UK stores; PayQwiq digital wallet used once every 5 seconds
Dave Lewis, Chief Executive: “Today, our prices are lower, our range is simpler and our service and availability have never been better. Our exclusive fresh food brands have strengthened our value proposition and our food quality perception is at its highest level for five years. At the same time, we have increased profits, generated more cash and significantly reduced debt. We are ahead of where we expected to be at this stage, having made good progress on all six of the strategic drivers we shared in October. We are confident that we can build on this strong performance in the year ahead, making further progress towards our medium-term ambitions. On top of this, our proposed merger with Booker will bring together two complementary businesses, driving additional value for shareholders by realising substantial synergies and enabling us to access the faster growing ‘out of home’ food market.”

2
Like-for-like sales performance6
1Q
2016/17 2Q
2016/17 3Q
2016/17 4Q
2016/17 1H
2016/17 2H
2016/17 FY
2016/17 UK & ROI 0.3% 0.9% 1.7% 0.6% 0.6% 1.3% 0.9% UK 0.3% 0.9% 1.8% 0.7% 0.6% 1.2% 0.9% ROI 0.3% 0.1% 0.5% (1.3)% 0.2% (0.4)% (0.1)%
International 3.0% 2.1% 0.6% (0.3)% 2.6% 0.1% 1.3%
Europe 2.8% 1.3% 0.7% (0.8)% 2.0% (0.1)% 0.9% Asia 3.3% 3.0% 0.4% 0.5% 3.2% 0.4% 1.8%
Group 0.9% 1.1% 1.5% 0.4% 1.0% 1.0% 1.0%
Headline Group results
A full Group income statement can be found on page 13 of this statement.
52 weeks ended 25 February 2017 On a continuing operations basis 2016/17 2015/16
Year-on-year change
(Constant exchange
rates)
Year-on-year change (Actual
exchange rates)
Group sales (exc. VAT, exc. fuel)2 £49,867m £47,859m 1.1% 4.3%
Fuel £6,050m £6,074m (1.0)% (0.4)%
Revenue (exc. VAT, inc. fuel) £55,917m £53,933m 0.8% 3.7%
Group operating profit before exceptional items3 - UK & ROI11 - International - Tesco Bank
£1,280m £803m £320m £157m
£985m £503m £320m £162m
24.9% 57.7%
(12.5)% (3.1)%
29.9% 59.6% 0.0% (3.1)%
Include exceptional items
£(263)m
£87m
Group operating profit £1,017m £1,072m (11.8)% (5.1)%
Group profit before tax before exceptional items and net pension finance costs
£842m £490m
71.8%
Group statutory profit before tax £145m £202m (28.2)%
Diluted EPS before exceptional items 6.75p 4.05p Diluted EPS before exceptional items and net pension finance costs
7.90p 5.61p
Diluted EPS 0.81p 3.22p
Basic EPS 0.81p 3.24p Capex12 £1.2bn £1.0bn
Net debt4,5 £(3.7)bn £(5.1)bn Cash generated from retail operations4 £2.3bn £2.1bn
A detailed analysis of discontinued operations can be found in Note 7 on page 32.
Notes 1. The Group has defined and outlined the purpose of its alternative performance measures, including its headline measures, in the Glossary on page 52. 2. Group sales exclude VAT and fuel. Sales growth shown on a comparable days basis. 3. Excludes exceptional items by virtue of their size and nature in order to reflect management’s view of the performance of the Group. 4. Net debt and retail operating cash flow exclude the impact of Tesco Bank, in order to provide further analysis of the retail cash flow statement. 5. Net debt includes both continuing and discontinued operations. 6. Like-for-like is a measure of growth in Group online sales and sales from stores that have been open for at least a year at constant foreign exchange rates. 7. SFO and FCA are acronyms for the Serious Fraud Office and the Financial Conduct Authority respectively. 8. As per YouGov BrandIndex, February 2017. 9. Working capital excluding the impact of exceptional items. 10. Value released from property relates to gross proceeds from property disposals in the year. 11. The elimination of intercompany transactions between continuing operations and the discontinued Turkey operation, as required by IFRS 5 and IFRS 10, has resulted in a
reduction to the prior period UK & ROI operating profit of £(2)m. 12. Capex is shown excluding property buybacks.

3
Creating value for our key stakeholders
Guided by the six strategic drivers we shared in October 2016, we have made strong progress this year with our focus on creating long-term, sustainable value for our key stakeholders. Customers • introduced seven new, exclusive fresh food brands, investing c.£300m, further removing reasons for
customers to shop elsewhere; these brands now feature in 64% of customers’ baskets • simpler, clearer and lower prices; multi-buy promotions reduced by a further 24% year-on-year;
typical customer basket 6% cheaper than in September 2014 • simpler product range with 24% net range reduction and 4,400 new products over two years • improvements across all key customer metrics; record sales-based availability of 96%, continue to be
rated first by customers for speed of service and score for staff helpfulness up to 80% • product and packaging innovation helping customers reduce waste, e.g. new, individual-portion
chicken packaging and new frozen fruit ranges
Colleagues • 83% of all colleagues recommend us as a ‘great place to work’, up from 81% last year • significant improvement in colleagues recommending us as a ‘great place to shop’ vs last year (+7 NPS) • more opportunities, with 4,000 colleague promotions; plan for 2,500 apprenticeships this year • two-thirds of colleagues believe their job has become simpler year-on-year • moved replenishment from nights to days in 195 stores, increasing number of colleagues available to
help customers at peak times • first UK colleague health month in January 2017 including 1.8m pieces of free fruit provided
Supplier partners • Supplier Viewpoint measure improved from 70% to 77% this year (UK: from 68% to 78%) • ranked as top overall retailer by the independently-run Advantage Report Mirror supplier survey • Supplier Network re-launched and now has 5,000 members; 94% rate network as beneficial • launched food waste hotline in March 2017 to quickly address potential waste in supply chain • 99.5% of small suppliers and 93% of largest suppliers moved to standardised payment terms; all to
move by end-August 2017
Shareholders • in October 2016, shared ambition to deliver Group operating margin of 3.5-4.0% by 2019/20,
underpinned by six strategic drivers including £1.5bn cost savings • generated £2.3bn retail operating cash flow, including underlying working capital inflow of £0.4bn • regained full ownership of another 16 UK stores, in line with aim to reduce exposure to fixed-uplift or
inflation-linked rental agreements; further seven large stores re-purchased in April 2017 • completed sale of our business in Turkey, avoiding incremental cash investment • proposed merger with Booker to enable access to larger, faster-growing market opportunity • intention to resume dividend payments in respect of the 2017/18 financial year; expected to grow
progressively, with aim of achieving target cover of around two times EPS over the medium-term
Looking ahead We made good progress over the last year, further strengthening our customer offer and delivering an improvement in profitability a little ahead of expectations. We are confident in the plans we have shared and in the progress we will make this year, including further steps towards reducing our costs by £1.5bn, generating £9bn retail cash from operations and improving Group operating margin to between 3.5% and 4.0% by 2019/20. With a much more competitive offer and supplier partnerships as strong as they have ever been, we are much better positioned to navigate challenging market conditions. In January, we announced that we had agreed the terms of a proposed merger with Booker, focused on unlocking new growth, particularly in the faster-growing ‘out of home’ food market. We are continuing to engage as planned with the Competition and Markets Authority in advance of seeking shareholder approval for the transaction, anticipated in late 2017/early 2018.

4
Financial Results
The results of Kipa, our business in Turkey, have been classified as discontinued operations in these results. We announced the sale of Kipa on 10 June 2016, with the transaction completing on 1 March 2017.
Sales:
On a continuing operations basis UK & ROI International1 Tesco Bank Group
Sales (exc. VAT, exc. fuel)
£37,692m £11,163m £1,012m £49,867m
change at constant exchange rates2 % 0.6% 2.1% 6.0% 1.1% change at actual exchange rates2 % 1.4% 15.2% 6.0% 4.3% Like-for-like sales (exc. VAT, exc. fuel) 0.9% 1.3% - 1.0% Statutory revenue (exc. VAT, inc. fuel) £43,524m £11,381m £1,012m £55,917m
Includes: Fuel £5,832m £218m - £6,050m 1. International consists of Central Europe (Czech Republic, Hungary, Poland and Slovakia), Thailand and Malaysia. 2. Sales change shown on a comparable days basis; statutory Group sales change was 1.0% at constant exchange rates and 4.2% at actual exchange rates.
Group sales grew by 1.1% at constant exchange rates with positive like-for-like growth in both the UK & ROI and International. At actual exchange rates, sales grew by 4.3% including a 3.2% foreign exchange translation benefit due to the weakness of Sterling. Further information on sales performance is included in Appendices 1 to 3 on page 61 of this statement.
In the UK and the Republic of Ireland (ROI), we have now seen five consecutive quarters of like-for-like sales growth.
In the UK, volumes grew 1.6% and transactions grew 1.7% as we continued to make fundamental improvements to all aspects of our offer. We saw annual positive like-for-like growth for the first time in seven years and outperformed the market across all categories on a volume basis. Volume outperformance was particularly strong in fresh food, where the exclusive brands we launched in March 2016 have helped to significantly strengthen our value proposition.
Significant product cost deflation in the first half of the year eased in the second half. In collaboration with our supplier partners, we have worked hard to minimise the impact of emerging inflationary cost pressures. Despite some inflation in a number of categories, the price of a typical customer basket remains around 6% cheaper than in September 2014 and promotional participation has fallen to 32% as we made a conscious decision to focus our investments on sustainable improvements rather than on short-term couponing and promotions. We achieved improvements in all key customer metrics, including colleague helpfulness and availability, where performance reached record levels.
In the Republic of Ireland, like-for-like sales fell by (0.1)% as we continued to invest in lowering prices. We have a leading position in the market in volume terms and have further grown volume share by making improvements across our customer offer, with a focus on fresh produce, meat and bakery.
International sales grew by 2.1% at constant exchange rates, including a 0.8% new store contribution driven by store openings in Thailand which more than offset the impact of store closures, primarily in Europe. International sales growth weakened in the second half due to an increasingly competitive environment in Europe, particularly Poland, and as we annualised a strong performance last year in Asia.
In the year, we grew like-for-like sales strongly in Thailand as we invested in both lowering prices and improving our fresh food proposition. We grew market share and were pleased to retain our number one position1 for customers for brand and trust. In Malaysia, top-line sales growth was held back by weak consumer spending across the market and a trend away from large stores towards convenience shopping, where we are currently under-represented.
1. According to BASIS Global Brand Image tracker, February 2017

5
In Central Europe, like-for-like sales grew in all markets apart from Poland which remains intensely competitive. Positive volume growth in the region was driven by a strong performance in fresh food where we improved quality and inspired customers with new ranges and events.
Group statutory revenue of £55.9bn includes sales of fuel, which were stable year-on-year. Fuel retail price deflation had eased by the end of the first half, returning to significant retail price inflation by the end of the second half.
Operating profit:
On a continuing operations basis UK & ROI International Tesco Bank Group
Operating profit before exceptional items £803m £320m £157m £1,280m change at constant exchange rates % 57.7% (12.5)% (3.1)% 24.9% change at actual exchange rates % 59.6% 0.0% (3.1)% 29.9% Operating profit margin before exceptional items
1.84% 2.81% 15.51% 2.29%
change at constant exchange rates (basis points) 67bp (46)bp (145)bp 44bp change at actual exchange rates (basis points) 68bp (42)bp (145)bp 46bp Operating profit £519m £421m £77m £1,017m
Group operating profit before exceptional items was £1,280m, up 24.9% on last year at constant exchange rates and up 29.9% at actual rates. Statutory operating profit of £1,017m includes the impact of exceptional items, which are described in more detail below and in Note 4 on page 28 of this statement.
Our full year UK & ROI operating profit before exceptional items was £803m, up 60% on last year, with margin growth of 68 basis points year-on-year. This improvement includes the impact of investments we have made in all aspects of our offer, particularly in lowering core prices and in the quality and price of the exclusive fresh food brands which we launched in March 2016. These investments enabled us to drive volume growth, generating positive operational leverage. In addition to managing costs more effectively year-on-year, we are also optimising the mix of our offer across channels and products. For example, within our beers, wines and spirits category we have focused on improving the relevance and profitability of our offer by broadening our range of speciality beers, increasing the prominence of own brand products and maintaining a strong, stable core price position in an extremely promotional market.
In a highly competitive environment, international operating profit before exceptional items was £320m, flat year-on-year at actual exchange rates and down by (12.5)% at constant exchange rates. Whilst we continued to invest in our offer in all of our markets, our response to intense competition in Poland weighed on profitability in Central Europe. We continued to focus on improving our store economics across the region, including simplifying management structures, reducing store administration and closing unprofitable store counters. We also opened a new distribution centre at Poznan in Poland, reducing transport costs for the country by 20%. From April 2017, we have separated the management of our international business, creating two new Executive Committee roles leading Asia and Central Europe, giving greater focus to each region.
The introduction of a new retail tax in Poland remains suspended pending the outcome of the European Commission’s investigation. We continue to be cautious about potential legislative changes in our European markets.
Further information on operating profit performance is included in Note 2, starting on page 22 of this statement.

6
Exceptional items in operating profit:
This year Last year
Net impairment of non-current assets and onerous lease provisions £(6)m £(423)m Net restructuring and redundancy costs £(199)m £(126)m Provision for customer redress £(45)m - Interchange settlement £57m - Property transactions £165m £156m Provision for SFO and FCA obligations £(235)m - Past service credit and associated costs arising on UK defined benefit pension scheme closure
- £480m
Total exceptional items in operating profit £(263)m £87m
Exceptional items are excluded from our headline performance measures by virtue of their size and nature, in order to reflect management’s view of the performance of the Group. In the current year, the net effect of exceptional items on operating profit is £(263)m.
Our annual impairment testing resulted in a net charge of £(6)m. This comprises a net £103m provision release relating to property, a net increase of £(56)m in onerous lease provisions and a net £(53)m impairment charge in goodwill and intangible assets, principally relating to dunnhumby subsidiary, Sociomantic.
Net restructuring and redundancy charges of £(199)m relate principally to changes to our distribution network and store colleague structures and working practices in the UK & ROI, and also includes a £(35)m charge relating to Tesco Bank business simplification.
The provision for customer redress of £(45)m was recognised in Tesco Bank in the first half, following updated guidance published by the Financial Conduct Authority, proposing an extension to the Payment Protection Insurance settlement deadline which is now set at August 2019.
Exceptional items include a credit of £57m in relation to a legal settlement in respect of interchange fees.
We generated net profits (pre-tax) of £165m from property transactions in the year, of which £91m related to the sale of the Letnany Shopping Mall and Liberec Forum Shopping Centre in the Czech Republic. We also sold a number of properties and development sites in the UK & ROI business.
An exceptional charge of £(235)m has been recorded as an adjusting post balance sheet event, following judicial approval on 10 April 2017 of a Deferred Prosecution Agreement between Tesco Stores Limited and the UK Serious Fraud Office regarding historic accounting practices and an agreement with the UK Financial Conduct Authority of a finding of market abuse in relation to the Tesco PLC trading statement announced on 29 August 2014.
Further detail on all exceptional items can be found in Note 4 on page 28 of this statement.
Joint ventures and associates:
This year Last year
Share of post-tax losses from JVs and associates before exceptional items
£(30)m £(21)m
Exceptional items: Impairment in Gain Land £(54)m - Insurance reserve adjustment £(23)m - Share of post-tax losses from JVs and associates £(107)m £(21)m

7
Losses from joint ventures and associates before exceptional items increased by £(9)m to £(30)m, due to lower profits recognised in our UK property joint ventures. After exceptional items, including an impairment of investment property within Gain Land, our associate in China, and an adjustment in insurance reserves in Tesco Underwriting, our share of post-tax losses from joint ventures and associates rose to £(107)m from £(21)m last year.
Further detail can be found in Note 12, starting on page 39 of this statement.
Finance income and finance costs:
This year Last year
Interest receivable and similar income £48m £29m IAS 32 and 39 ‘Financial instruments’ – fair value remeasurements
£61m -
Finance income £109m £29m Interest payable £(523)m £(490)m Capitalised interest £6m £6m IAS 32 and 39 ‘Financial instruments’ – fair value remeasurements
- £(19)m
IAS 19 net pension finance costs £(113)m £(155)m Finance costs £(630)m £(658)m Exceptional charge: Translation of Korea proceeds
£(244)m £(220)m
Statutory finance costs £(874)m £(878)m
Finance income rose to £109m, mainly due to the favourable effect of marking-to-market financial instruments. These are non-cash adjustments driven by changes in the market’s assessment of credit and debt risk.
Interest payable increased to £(523)m due to debt acquired as part of our February 2016 agreement to regain sole ownership of 49 stores and two distribution centres. The impact of this was partially offset by a £26m reduction in interest following the repayment of debt in the year.
Net pension finance costs of £(113)m reduced in line with the reduction in the opening IAS 19 pension deficit at the start of the 2016/17 financial year. Net pension finance costs are calculated by multiplying the opening net deficit by the opening discount rate each year. For 2017/18, they are expected to increase to c.£(165)m.
An exceptional non-cash loss of £(244)m arose on the translation of the proceeds from the sale of our Homeplus business in Korea which were held in GBP money market funds in a non-Sterling denominated subsidiary. This does not represent any economic cost to the Group.
Further detail can be found in Note 5 on page 30 of this statement.
Group tax:
This year Last year
Tax on profit before exceptional items £(185)m £(8)m
Tax on profit £(87)m
£54m
Tax on profit before exceptional items was £(185)m with an effective rate of tax for the Group of 25%. This tax rate is higher than the UK statutory rate primarily due to the impact of the 8% supplementary tax surcharge on bank profits, introduced in January 2016, and depreciation of assets that does not qualify for tax relief. The tax rate benefited from the impact on deferred tax of the expected reduction in the UK corporation tax rate from 18% to 17% in 2020.

8
On a statutory basis, including an exceptional credit of £98m principally relating to a lower book value than tax value of property disposals and tax relief on exceptional impairment and restructuring costs, the tax charge was £(87)m.
The effective tax rate on profit before exceptional items for the 2017/18 financial year is expected to be similar to this year, at around 25%.
Earnings per share:
On a continuing operations basis This year Last year
Diluted earnings per share before exceptional items and net pension finance costs
7.90p 5.61p
Diluted earnings per share 0.81p 3.22p
Basic earnings per share 0.81p 3.24p
Diluted earnings per share before exceptional items and net pension finance costs were 7.90p, 41% higher year-on-year principally due to our stronger profit performance. Statutory basic earnings per share from continuing operations were 0.81p, lower than last year driven by higher net exceptional costs.
Summary of total indebtedness1:
This year Last year Movement
Net debt (excludes Tesco Bank) £(3,729)m £(5,110)m £1,381m Discounted operating lease commitments £(7,440)m £(7,814)m £374m Pension deficit, IAS 19 basis (post-tax) £(5,504)m £(2,612)m £(2,892)m
Total indebtedness £(16,673)m £(15,536)m £(1,137)m 1. Total indebtedness is defined in the glossary, starting on page 52
Net debt (excluding Tesco Bank) reduced by £1.4bn to £(3.7)bn, as our retail operating cash flow and property and business disposal proceeds were greater than capital expenditure and other charges.
The reduction in discounted operating lease commitments includes a benefit from the buybacks we have completed in the UK. In the year, we regained sole ownership of 16 superstores from a number of different vendors, resulting in an annual rent saving of £22m.
The IAS 19 pension deficit measure, which relates to our closed UK defined benefit scheme, increased by £(2.9)bn to £(5.5)bn due to the reduction in bond yields. Despite this increase in the IAS 19 measure of our liabilities, the actual pension payments that are payable to members in the future have not changed.
During the year, we completed a de-risking programme which has reduced the future volatility of the scheme’s long-term funding.
At the last triennial valuation, the Trustee and the Company agreed a long-term funding plan where the Company is paying contributions of £270m a year to the UK defined benefit scheme. The next triennial actuarial valuation is effective as at 31 March 2017 and work is already underway. The Trustee is aiming to conclude the valuation as soon as is reasonably possible. Further detail can be found in Note 17 on page 46 of this statement.
We have a strong funding and liquidity profile underpinned by £4.4bn committed facilities and our key credit metrics (fixed charge cover, net debt/EBITDA and total indebtedness ratio) have improved over the year.

9
Summary retail cash flow:
This year Last year
Cash flow from continuing operations excluding working capital £1,695m £2,033m (Increase)/decrease in working capital - underlying decrease in working capital £387m £377m - impact from exceptional items £197m £(91)m - cash impact of new approach to supplier payments - £(231)m Cash generated from operations – continuing operations £2,279m £2,088m Cash generated from operations – discontinued operations £(1)m £493m Cash generated from operations £2,278m £2,581m Interest paid £(518)m £(422)m Corporation tax (paid)/received £(64)m £125m Net cash generated from retail operating activities £1,696m £2,284m Cash capital expenditure £(1,328)m £(1,004)m Free cash flow £368m £1,280m Other investing activities £1,620m £543m Net cash (used in)/from financing activities and intra-Group funding and intercompany transactions
£(1,342)m £(854)m
Net increase in cash and cash equivalents £646m £969m Include/(exclude) cash movements in debt items £1,114m £4,219m Fair value and other non-cash movements £(379)m £(1,817)m Movement in net debt £1,381m £3,371m
On an underlying basis, working capital improved by £387m driven by growing sales volumes, initiatives to reduce stockholding and the timing effect of a fuel payment. The reported total reduction in working capital also includes the net impact of exceptional items.
Excluding working capital, we generated £1.7bn of cash from continuing retail operations. The decrease of £(0.3)bn on the previous year primarily reflects the payment of a Turnaround bonus to colleagues in cash rather than shares and higher net exceptional costs than last year.
Interest paid was £(96)m higher than last year due to the debt acquired as part of our February 2016 agreement to regain sole ownership of 49 stores and two distribution centres. The impact of this was partially offset by £1.2bn of debt we redeemed in September 2016 and a further £0.7bn of debt we redeemed in January 2017.
The cash tax outflow of £(64)m reflects payments by our international businesses which more than offset a refund of taxes already paid in the UK, as we continue to agree and close historic enquiries into tax returns.
Cash movements of £1.1bn in debt items primarily reflect the redemption of three medium-term notes on their maturity.
A reconciliation between the Retail and Group cash flow can be found in Note 2, starting on page 22.

10
Capital expenditure and space:
Group UK & ROI International Tesco Bank
This year
Last year
YOY change
This year
Last year
This year
Last year
This year
Last year
Capital expenditure (£m) 1,180 970 210 731 676 403 254 46 40 Gross space added/ (reduced) (m sq ft)1,2
0.7 0.7 -
0.2 0.3 0.5 0.4 n/a n/a
Net space added/ (reduced) (m sq ft)1
(2.2) (1.0) (1.2)
(1.7) (0.8) (0.5) (0.2) n/a n/a
1. Excluding franchise stores. 2. ‘Gross space added’ excludes repurposing/extensions.
Capital expenditure (excluding buybacks) of £1.2bn was £0.2bn higher than last year reflecting our planned increase in spend to refresh more than 200 stores in the UK and to accelerate the store opening programme in Thailand. We now expect Group capital expenditure to be around £1.25bn in 2017/18. This is around £250m below our original estimate, as we continue to focus on capital spend that delivers attractive returns and move more of our planned technology spend to cloud-based services.
The net reduction of (2.2)m square feet includes (1.7)m square feet related to the disposal of Dobbies garden centres with the balance being net closures of space. In Asia, we opened 114 stores, primarily in our convenience format in Thailand. In Europe, we closed 23 stores.
This year we repurposed 1.0m square feet across the Group, improving the ease and relevance of the shopping trip for customers. This included 0.5m square feet in Thailand repurposed for new and existing partners, including five new branches of Decathlon Sports, exclusive in the market to Tesco Lotus, and four new cinemas. In the UK, we repurposed 0.1m square feet in 14 stores, introducing brands such as Miss Selfridge, Wallis and Holland & Barrett.
Further details of current and forecast space can be found in Appendix 5 starting on page 63.
Property:
This year Last year
UK & ROI International Group UK & ROI International Group
Property1 - fully owned - Estimated market value £13.1bn £6.7bn £19.9bn £13.3bn £6.4bn £19.7bn - NBV2 £12.6bn £5.1bn £17.8bn £12.6bn £5.0bn £17.6bn % net selling space owned 52% 74% 63% 52% 71% 61% % total property owned – by value3 50% 78% 57% 47% 75% 54%
1. Stores, malls, investment property, offices, distribution centres, fixtures and fittings and work-in-progress. Excludes joint ventures. 2. Property, plant and equipment excluding vehicles. 3. Excludes fixtures and fittings.
The estimated market value of our fully owned property has increased by £0.2bn to £19.9bn, retaining a surplus of £2.1bn over the net book value, as the repurchase of 16 stores in the UK and a foreign exchange translation effect more than offset the impact of the sale of Turkey and Dobbies garden centres.
Our Group freehold property ownership percentage, by value, has increased from 54% to 57% year-on-year, driven by both the UK & ROI and International. In International, the effect of the sale of our business in Turkey more than offset the impact of the sale of two large freehold shopping centres in the Czech Republic on the mix of freehold to leasehold.
In April 2017, we regained ownership of a further seven large stores in the UK with a freehold valuation of £219m in a transaction with British Land. Including the effect of this transaction, we have now increased our proportion of freehold ownership by value in the UK & ROI to 51%, up by 10% over two years. The

11
repurchase of stores to date has resulted in an annualised saving of £152m rent, predominantly in relation to fixed-uplift and index-linked rental agreements.
The Group operating lease charge reduced by 9% in the year to £1.0bn. We continue to seek opportunities to further reduce our exposure to index-linked and fixed-uplift rent inflation where the economics are attractive.
Tesco Bank:
This year Last year YOY change
Revenue £1,012m £955m 6.0% Operating profit before exceptional items
£157m £162m (3.1)%
Operating profit £77m £161m (52.2)% Lending to customers £9,961m £8,542m 16.6% Customer deposits £8,463m £7,397m 14.4% Net interest margin 4.0% 4.2% (0.2)% Risk asset ratio 20.0% 20.0% -
Tesco Bank continues to provide a simple and transparent product offer to serve the banking and insurance needs of Tesco customers. Active customer account numbers grew by 3.5%, with particularly strong growth in current accounts. We have continued to improve our customer offer by introducing a new premium credit card, simplifying the loan application process by introducing digital signatures, giving interest-rate guarantees on current accounts for new and existing customers and through a national roll-out of PayQwiq to all large stores, a digital wallet app that allows customers to pay with their phone in our shops.
Operating profit before exceptional items reduced by (3.1)% to £157m. This decline was due to the full year effect of the introduction of European Commission caps on interchange income which first came into effect in December 2015. Adjusting for this impact, we saw strong profit growth driven primarily by lending income. Exceptional items of £(80)m relating to Tesco Bank are detailed in Note 4 on page 28 and include an increase in the provision for customer redress and a restructuring charge.
Risk-weighted assets have risen in line with lending and the Core Tier 1 ratio has improved to 16.7%. The balance sheet remains strong and well-positioned to support future lending growth from both a liquidity and capital perspective.
An income statement for Tesco Bank can be found in Appendix 6 on page 66 of this statement. Balance sheet and cash flow detail for Tesco Bank can be found within Note 2 starting on page 22 of this statement. Tesco Bank’s full year results are also published today and are available at www.corporate.tescobank.com

12
Contacts
Investor Relations: Chris Griffith 01707 912 900
Media: Ed Young 01707 918 701
Philip Gawith, Teneo Blue Rubicon 0207 420 3143
This document is available at www.tescoplc.com/prelims2017.
A meeting for investors and analysts will be held today at 9.00am at London Stock Exchange, 10 Paternoster Square, London, EC4M 7LS. Access will be by invitation only. For those unable to attend, there will be a live webcast available on our website at www.tescoplc.com/prelims2017. This will include all Q&A and will also be available for playback after the event. All presentation materials, including a transcript, will be made available on our website.
A video featuring Dave Lewis, Chief Executive, Jason Tarry, Chief Product Officer and Alessandra Bellini, Chief Customer Officer, discussing the Preliminary Results and our fresh food offer is available now to download in video, audio and transcript form at www.tescoplc.com/prelims2017.
Disclaimer
This document may contain forward-looking statements that may or may not prove accurate. For example, statements regarding expected revenue growth and operating margins, market trends and our product pipeline are forward-looking statements. Phrases such as "aim", "plan", "intend", "anticipate", "well-placed", "believe", "estimate", "expect", "target", "consider" and similar expressions are generally intended to identify forward-looking statements. Forward-looking statements involve known and unknown risks, uncertainties and other important factors that could cause actual results to differ materially from what is expressed or implied by the statements. Any forward-looking statement is based on information available to Tesco as of the date of the statement. All written or oral forward-looking statements attributable to Tesco are qualified by this caution. Tesco does not undertake any obligation to update or revise any forward-looking statement to reflect any change in circumstances.

TESCO PLC
13
Group income statement
Notes
52 weeks ended 25 February 2017
52 weeks ended 27 February 2016
Before exceptional
items
£m
Exceptional items
(Note 4)
£m
Total
£m
Before exceptional
items
£m
Exceptional items
(Note 4)
£m
Total
£m
Continuing operations
Revenue 2 55,917 - 55,917 53,933 - 53,933
Cost of sales (52,899) (116) (53,015) (51,124) 35 (51,089)
Gross profit/(loss) 3,018 (116) 2,902 2,809 35 2,844
Administrative expenses (1,734) (261) (1,995) (1,836) 22 (1,814)
Profits/(losses) arising on property-related items (4) 114 110 12 30 42
Operating profit/(loss) 1,280 (263) 1,017 985 87 1,072
Share of post-tax profits/(losses) of joint ventures and associates
12 (30) (77) (107) (21) - (21)
Finance income 5 109 - 109 29 - 29
Finance costs 5 (630) (244) (874) (658) (220) (878)
Profit/(loss) before tax 729 (584) 145 335 (133) 202
Taxation 6 (185) 98 (87) (8) 62 54
Profit/(loss) for the year from continuing operations 544 (486) 58 327 (71) 256
Discontinued operations
Profit/(loss) for the year from discontinued operations 7 (37) (75) (112) 26 (153) (127)
Profit/(loss) for the year 507 (561) (54) 353 (224) 129
Attributable to:
Owners of the parent 515 (555) (40) 359 (221) 138
Non-controlling interests (8) (6) (14) (6) (3) (9)
507 (561) (54) 353 (224) 129
Earnings/(losses) per share from continuing and discontinued operations
Basic 9 6.32p (0.49)p 4.42p 1.70p
Diluted 9 6.31p (0.49)p 4.40p 1.69p
Earnings/(losses) per share from continuing operations
Basic 9 6.76p 0.81p 4.06p 3.24p
Diluted 9 6.75p 0.81p 4.05p 3.22p
The notes on pages 20 to 51 form part of this condensed consolidated financial information.

TESCO PLC
14
Group statement of comprehensive income/(loss)
Notes
52 weeks 2017
£m
52 weeks 2016
£m
Items that will not be reclassified to income statement
Remeasurements on defined benefit pension schemes 17 (3,567) 1,164
Tax on items that will not be reclassified 579 (300)
(2,988) 864
Items that may subsequently be reclassified to income statement
Change in fair value of available-for-sale financial assets and investments 80 5
Currency translation differences:
Retranslation of net assets of overseas subsidiaries, joint ventures and associates 764 168
Movements in foreign exchange reserve and net investment hedging on subsidiary disposed, reclassified and reported in the Group income statement
- (88)
Gains/(losses) on cash flow hedges:
Net fair value gains/(losses) 385 318
Reclassified and reported in the Group income statement (384) (292)
Change in hedge relationship - 186
Tax on items that may be reclassified (23) (30)
822 267
Total other comprehensive income/(loss) for the year (2,166) 1,131
Profit/(loss) for the year (54) 129
Total comprehensive income/(loss) for the year (2,220) 1,260
Attributable to:
Owners of the parent (2,206) 1,270
Non-controlling interests (14) (10)
Total comprehensive income/(loss) for the year (2,220) 1,260
Total comprehensive income/(loss) attributable to owners of the parent arises from:
Continuing operations (2,096) 1,485
Discontinued operations (110) (215)
(2,206) 1,270
The notes on pages 20 to 51 form part of this condensed consolidated financial information.

TESCO PLC
15
Group balance sheet
Notes 25 February 2017
£m 27 February 2016
£m Non-current assets Goodwill, software and other intangible assets 10 2,717 2,874 Property, plant and equipment 11 18,108 17,900 Investment property 64 78 Investments in joint ventures and associates 12 739 785 Other investments 823 1,078 Trade and other receivables 180 201 Loans and advances to customers 5,795 4,723 Derivative financial instruments 1,303 1,532 Deferred tax assets 707 49
30,436 29,220 Current assets Other investments 284 57 Inventories 2,301 2,430 Trade and other receivables 1,475 1,406 Loans and advances to customers 4,166 3,819 Derivative financial instruments 286 176 Current tax assets 13 15 Short-term investments 13 2,727 3,463 Cash and cash equivalents 13 3,821 3,082 15,073 14,448 Assets of the disposal group and non-current assets classified as held for sale 7 344 236
15,417 14,684 Current liabilities Trade and other payables (8,875) (8,293) Borrowings 15 (2,560) (2,826) Derivative financial instruments and other liabilities (61) (62) Customer deposits and deposits from banks (6,687) (5,906) Current tax liabilities (613) (419) Provisions 16 (438) (360) (19,234) (17,866) Liabilities of the disposal group classified as held for sale 7 (171) - Net current liabilities (3,988) (3,182) Non-current liabilities Trade and other payables (324) (275) Borrowings 15 (9,433) (10,711) Derivative financial instruments and other liabilities (607) (889) Customer deposits and deposits from banks (2,276) (1,573) Post-employment benefit obligations 17 (6,621) (3,175) Deferred tax liabilities (88) (135) Provisions 16 (685) (664)
(20,034) (17,422) Net assets 6,414 8,616 Equity Share capital 409 407 Share premium 5,096 5,095 All other reserves 601 (141) Retained earnings 332 3,265 Equity attributable to owners of the parent 6,438 8,626 Non-controlling interests (24) (10) Total equity 6,414 8,616 The notes on pages 20 to 51 form part of this condensed consolidated financial information.

TESCO PLC
16
Group statement of changes in equity All other reserves
Share capital
£m
Share premium
£m
Other
reserves £m
Capital redemption
reserve £m
Hedging reserve
£m
Translation reserve
£m
Treasury shares
£m
Retained earnings
£m
Total
£m
Non- controlling
interests £m
Total
equity £m
At 27 February 2016 407 5,095 40 16 211 (401) (7) 3,265 8,626 (10) 8,616
Profit/(loss) for the year - - - - - - - (40) (40) (14) (54)
Other comprehensive income/(loss)
Change in fair value of available–for–sale financial assets and investments
- - - - - - - 80 80 - 80
Currency translation differences - - - - - 764 - - 764 - 764
Remeasurements of defined benefit pension schemes
- - - - - - - (3,567) (3,567) - (3,567)
Gains/(losses) on cash flow hedges - - - - 1 - - - 1 - 1
Tax relating to components of other comprehensive income
- - - - 5 (13) - 564 556 - 556
Total other comprehensive income/(loss)
- - - - 6 751 - (2,923) (2,166) - (2,166)
Total comprehensive income/(loss)
- - - - 6 751 - (2,963) (2,206) (14) (2,220)
Transactions with owners
Purchase of treasury shares - - - - - - (24) - (24) - (24)
Share–based payments - - - - - - 9 28 37 - 37
Issue of shares 2 1 - - - - - - 3 - 3
Dividends - - - - - - - - - - -
Tax on items charged to equity - - - - - - - 2 2 - 2
Total transactions with owners 2 1 - - - - (15) 30 18 - 18
At 25 February 2017 409 5,096 40 16 217 350 (22) 332 6,438 (24) 6,414
The notes on pages 20 to 51 form part of this condensed consolidated financial information.

TESCO PLC
17
Group statement of changes in equity continued All other reserves
Share capital
£m
Share premium
£m
Other
reserves £m
Capital redemption
reserve £m
Hedging reserve
£m
Translation reserve
£m
Treasury shares
£m
Retained earnings
£m
Total
£m
Non- controlling
interests £m
Total
equity £m
At 28 February 2015 406 5,094 40 16 35 (488) (17) 1,985 7,071 – 7,071
Profit/(loss) for the year - - - - - - - 138 138 (9) 129
Other comprehensive income/ (loss)
Change in fair value of available–for–sale financial assets and investments
- - - - - - - 5 5 - 5
Currency translation differences - - - - - 81 - - 81 (1) 80
Remeasurements of defined benefit pension schemes
- - - - - - - 1,164 1,164 - 1,164
Gains/(losses) on cash flow hedges - - - - 212 - - - 212 - 212
Tax relating to components of other comprehensive income
- - - - (36) 6 - (300) (330) - (330)
Total other comprehensive income/(loss)
- - - - 176 87 - 869 1,132 (1) 1,131
Total comprehensive income/(loss)
- - - - 176 87 - 1,007 1,270 (10) 1,260
Transactions with owners
Purchase of treasury shares - - - - - - (5) - (5) - (5)
Share–based payments - - - - - - 15 273 288 - 288
Issue of shares 1 1 - - - - - - 2 - 2
Dividends - - - - - - - - - - -
Total transactions with owners 1 1 - - - - 10 273 285 - 285
At 27 February 2016 407 5,095 40 16 211 (401) (7) 3,265 8,626 (10) 8,616
The notes on pages 20 to 51 form part of this condensed consolidated financial information.

TESCO PLC
18
Group cash flow statement
Notes 52 weeks 2017
£m
52 weeks 2016
£m
Cash flows generated from/(used in) operating activities
Operating profit/(loss) of continuing operations 1,017 1,072
Operating profit/(loss) of discontinued operations (117) 102
Depreciation and amortisation 1,304 1,334
(Profit)/loss arising on sale of property, plant and equipment and intangible assets (78) 164
(Profit)/loss arising on sale of subsidiaries and other investments 3 -
(Profit)/loss arising on sale of joint ventures and associates (5) (1)
Impairment loss on goodwill 46 18
Net impairment loss/(reversal) on other investments (12) (7)
Net impairment loss/(reversal) on loans/investments in joint ventures and associates - 1
Net impairment loss/(reversal) on property, plant and equipment, intangible assets and investment property (5) 182
Adjustment for non-cash element of pensions charge 17 7 (395)
Additional contribution into pension schemes 17 (248) (223)
Share–based payments 15 283
Tesco Bank fair value movements included in operating profit 98 72
Retail (increase)/decrease in inventories 124 251
Retail (increase)/decrease in development stock 16 99
Retail (increase)/decrease in trade and other receivables (74) 20
Retail increase/(decrease) in trade and other payables 510 260
Retail increase/(decrease) in provisions 11 (280)
Tesco Bank (increase)/decrease in loans and advances to customers (1,529) (868)
Tesco Bank (increase)/decrease in trade and other receivables (24) (78)
Tesco Bank increase/(decrease) in customer and bank deposits, trade and other payables 1,474 463
Tesco Bank increase/(decrease) in provisions 25 (35)
(Increase)/decrease in working capital 533 (168)
Cash generated from/(used in) operations 2,558 2,434
Interest received/(paid) (522) (426)
Corporation tax received/(paid) (47) 118
Net cash generated from/(used in) operating activities 1,989 2,126
The notes on pages 20 to 51 form part of this condensed consolidated financial information.

TESCO PLC
19
Group cash flow statement continued
Notes
52 weeks 2017
£m
52weeks 2016
£m
Net cash generated from/(used in) operating activities 1,989 2,126
Cash flows generated from/(used in) investing activities
Purchase of property, plant and equipment, investment property and non-current assets classified as held for sale
(1,205) (871)
Purchase of intangible assets (169) (167)
Disposal of subsidiaries, net of cash disposed 19 205 3,237
Acquisition of subsidiaries, net of cash acquired 19 (25) (325)
Proceeds from sale of joint ventures and associates - 192
Proceeds from sale of property, plant and equipment, investment property, intangible assets and non-current assets classified as held for sale
512 350
Net (increase)/decrease in loans to joint ventures and associates 15 (1)
Investments in joint ventures and associates - (77)
Net (investments in)/proceeds from sale of short-term investments 736 (2,894)
Net (investments in)/proceeds from sale of other investments 141 (103)
Dividends received from joint ventures and associates 28 41
Interest received/(paid) 41 3
Net cash generated from/(used in) investing activities 279 (615)
Cash flows generated from/(used in) financing activities
Proceeds from issue of ordinary share capital 1 1
Increase in borrowings 185 586
Repayment of borrowings (2,036) (1,328)
Net cash flows from derivative financial instruments 475 154
Repayments of obligations under finance leases (12) (17)
Dividends paid to equity owners 8 - -
Net cash generated from/(used in) financing activities (1,387) (604)
Net increase/(decrease) in cash and cash equivalents 881 907
Cash and cash equivalents at beginning of the year 3,082 2,174
Effect of foreign exchange rate changes (131) 1
Cash and cash equivalents including cash held in disposal group at the end of the year 3,832 3,082
Cash held in disposal group 7 (11) -
Cash and cash equivalents at the end of the year 13 3,821 3,082
The notes on pages 20 to 51 form part of this condensed consolidated financial information.

TESCO PLC
20
Note 1 Basis of preparation This preliminary consolidated financial information has been prepared in accordance with the Disclosure and Transparency Rules of the UK Financial Conduct Authority, and the principles of International Financial Reporting Standards (IFRS) as adopted by the European Union. The accounting policies applied are consistent with those described in the Annual Report and Group Financial Statements 2017. The preliminary consolidated financial information has been prepared on a going concern basis. This preliminary consolidated financial information does not constitute statutory consolidated financial statements for the 52 weeks ended 25 February 2017 as defined under section 434 of the Companies Act 2006.
The Annual Report and Group Financial Statements for the 52 weeks ended 25 February 2017 were approved by the Board of Directors on 11 April 2017. The report of the auditor on those Group Financial Statements was unqualified, did not contain an emphasis of matter paragraph and did not contain any statement under section 498 of the Companies Act 2006. An abbreviated copy of the audit report can be found on page 56. The Annual Report and Group Financial Statements for 2017 will be filed with the Registrar in due course.
The Annual Report and Group Financial Statements for the 52 weeks ended 27 February 2016 were approved by the Board of Directors on 12 April 2016 and have been filed with the Registrar of Companies. The report of the auditor on those Group Financial Statements was unqualified, did not contain an emphasis of matter paragraph and did not contain any statement under section 498 of the Companies Act 2006.
The Directors consider that the Group has, at the time of approving the Group financial statements, adequate resources to continue in operational existence for the foreseeable future and have therefore continued to adopt the going concern basis in preparing the preliminary consolidated financial information.
Discontinued operations
In accordance with IFRS 5 ‘Non-current Assets Held for Sale and Discontinued Operations’, the net results of discontinued operations are presented separately in the Group income statement (and the comparatives restated) and the assets and liabilities of these operations are presented separately in the Group balance sheet. Refer to Note 7 for further details.
Standards issued but not yet effective
As of the date of authorisation of these financial statements, the following standards were in issue but not yet effective. The Group has not applied these standards in the preparation of the financial statements, and has not adopted any new or amended standards early:
• IFRS 9 ‘Financial instruments’ replaces IAS 39 ‘Financial instruments: Recognition and Measurement’ with the exception of macro hedge accounting. The standard is effective for accounting periods beginning on or after 1 January 2018. The standard covers three elements: – Classification and measurement. Changes to a more principle based approach to classify financial assets as either held at amortised
cost, fair value through other comprehensive income (FVOCI) or fair value through profit or loss, dependent on the business model and cash flow characteristics of the financial asset.
– Impairment. Moves to an impairment model based on expected credit losses based on a three stage approach. – Hedge accounting. The IFRS 9 hedge accounting requirements are designed to allow hedge accounting to be more closely aligned with
the Group’s underlying risk management. A new IASB project is in progress to develop an approach to better reflect dynamic risk management in entities’ financial statements.
The Group expects to continue applying the existing hedge accounting requirements of IAS 39 for its portfolio hedge accounting until this new approach is implemented.
The Group intends to quantify the potential impact of IFRS 9 once it is practicable to provide reliable estimates, which will be no later than in the Annual Report and Financial Statements for the year ended 24 February 2018. IFRS 9 is expected to result in a more significant impact for Tesco Bank than for the Retail business.
• IFRS 15, ‘Revenues from Contracts with Customers’ is effective for periods beginning on or after 1 January 2018. IFRS 15 introduces a five-step approach to the timing of revenue recognition based on performance obligations in customer contracts.
The Group recognises revenue from the following principal activities: - Retailing and associated activities; and - Retail banking and insurance services through Tesco Bank.
An assessment of the impact of IFRS 15 has been completed. Revenue recognition under IFRS 15 is expected to be consistent with current practice for the Group’s revenue, with the exception of Clubcard loyalty points, certain telecommunication contracts and certain bespoke contracts fulfilled by dunnhumby, where the timing of revenue recognition will change. Had the principles of IFRS 15 been applied in the current reporting period, it would not have had a significant impact on the financial statements.
• IFRS 16 ‘Leases’ is effective for annual periods beginning on or after 1 January 2019 subject to EU endorsement. IFRS 16 provides a single lessee accounting model, requiring lessees to recognise right of use assets and lease liabilities for all applicable leases.
IFRS 16 is expected to have a significant impact on the amounts recognised in the Group’s consolidated financial statements. On adoption of IFRS 16 the Group will recognise within the balance sheet a right of use asset and lease liability for all applicable leases. Within the income statement, rent expense will be replaced by depreciation and interest expense. This will result in a decrease in cost of sales and an increase in finance costs. The standard will also impact a number of statutory measures such as operating profit and cash generated from operations, and alternative performance measures used by the Group.
The full impact of IFRS 16 is currently under review, including understanding the practical application of the principles of the standard. It is therefore not practical to provide a reasonable estimate of the financial effect until this review is complete.

TESCO PLC
21
Note 1 Basis of preparation continued Alternative performance measures (APMs) In the reporting of financial information, the Directors have adopted various APMs, previously termed ‘Non-GAAP measures’, of historical or future financial performance, position or cash flows other than those defined or specified under International Financial Reporting Standards (IFRS).
These measures are not defined by IFRS and therefore may not be directly comparable with other companies’ APMs, including those in the Group’s industry.
APMs should be considered in addition to, and are not intended to be a substitute for, or superior to, IFRS measurements.
Purpose
The Directors believe that these APMs assist in providing additional useful information on the underlying trends, performance and position of the Group.
APMs are also used to enhance the comparability of information between reporting periods and geographical units (such as like-for-like sales), by adjusting for non-recurring or uncontrollable factors which affect IFRS measures, to aid the user in understanding the Group’s performance.
Consequently, APMs are used by the Directors and management for performance analysis, planning, reporting and incentive setting purposes and have remained consistent with prior year.
The key APMs that the Group has focused on this year are as follows:
• Group sales (previously termed Revenue exc. fuel): This is the headline measure of revenue for the Group. It excludes the impact of sales made at petrol filling stations due to the significant volatility of fuel prices. This volatility is outside the control of management and can mask underlying changes in performance.
• Like-for-like sales: This is a widely used indicator of a retailer’s current trading performance. It is a measure of growth in Group online sales and sales from stores that have been open for at least a year (but excludes prior year sales of stores closed during the year) at constant foreign exchange rates.
• Operating profit before exceptional items: This is the headline measure of the Group’s performance, and is based on operating profit before the impact of exceptional items. Exceptional items relate to certain costs or incomes that derive from events or transactions that fall within the normal activities of the Group but which, individually or, if of a similar type, in aggregate, are excluded by virtue of their size and nature in order to reflect management’s view of the performance of the Group.
• Retail operating cash flow: This is the operating cash flow of continuing operations, excluding the effects of Tesco Bank’s cash flows.
• Net debt: This excludes the net debt of Tesco Bank but includes that of the discontinued operations to reflect the net debt obligations of the Retail business.
• Diluted earnings per share from continuing operations before exceptional items and net pension finance costs: This relates to profit after tax before exceptional items from continuing operations, and net pension finance costs attributable to owners of the parent divided by the weighted average number of ordinary shares in issue during the financial period adjusted for the effects of potentially dilutive options.
Some of our IFRS measures are translated at constant exchange rates. Constant exchange rates are the average actual periodic exchange rates for the previous financial year and are used to eliminate the effects of exchange rate fluctuations in assessing performance. Actual exchange rates are the average actual periodic exchange rates for that financial year.
Refer to the Glossary (page 52) for a full list and comprehensive descriptions and purpose of the Group’s APMs.

TESCO PLC
22
Note 2 Segmental reporting The Group’s operating segments are determined based on the Group’s internal reporting to the Chief Operating Decision Maker (CODM). The CODM has been determined to be the Group Chief Executive, with support from the Executive Committee, as the function primarily responsible for the allocation of resources to segments and assessment of performance of the segments.
The principal activities of the Group are therefore presented in the following segments:
• Retailing and associated activities (Retail) in:
– UK & ROI – the United Kingdom and Republic of Ireland; and
– International – Czech Republic, Hungary, Poland, Slovakia, Malaysia and Thailand; and
• Retail banking and insurance services through Tesco Bank in the UK (Tesco Bank).
This presentation reflects how the Group’s operating performance is reviewed internally by management.
Excluded from the current year segmental information below are the retailing and associated activities of Turkey which have been classified as discontinued operations. Turkey’s performance in the comparative year has been excluded from segmental information. Refer to Note 7 for further detail.
The CODM uses operating profit before exceptional items, as reviewed at monthly Executive Committee meetings, as the key measure of the segments’ results as it reflects the segments’ underlying performance for the financial period under evaluation. Operating profit before exceptional items is a consistent measure within the Group as defined within Note 1. Refer to Note 4 for exceptional items. Inter-segment revenue between the operating segments is not material.
Income statement
The segment results and the reconciliation of the segment measures to the respective statutory items included in the Group income statement are as follows:
52 weeks ended 25 February 2017 At constant exchange rates
UK & ROI £m
International £m
Tesco Bank
£m
Total at constant
exchange £m
Foreign
exchange £m
Total at actual exchange
£m
Continuing operations
Group sales 37,424 9,892 1,012 48,328 1,539 49,867
Revenue 43,248 10,084 1,012 54,344 1,573 55,917
Operating profit before exceptional items* 793 280 157 1,230 50 1,280
Exceptional items (291) 87 (80) (284) 21 (263)
Operating profit/(loss) 502 367 77 946 71 1,017
Operating margin 1.8% 2.8% 15.5% 2.3% - 2.3%
52 weeks ended 25 February 2017 At actual exchange rates
UK & ROI £m
International £m
Tesco Bank
£m
Total at actual exchange
£m
Continuing operations
Group sales 37,692 11,163 1,012 49,867
Revenue 43,524 11,381 1,012 55,917
Operating profit before exceptional items* 803 320 157 1,280
Exceptional items (284) 101 (80) (263)
Operating profit/(loss) 519 421 77 1,017
Operating margin 1.8% 2.8% 15.5% 2.3%
Share of post-tax profits/(losses) of joint ventures and associates (107)
Finance income 109
Finance costs (874)
Profit/(loss) before tax 145 * Intercompany recharges totalling £2m (2016: £2m) between continuing operations and the Turkey discontinued operations have been eliminated.

TESCO PLC
23
Note 2 Segmental reporting continued
Income statement continued 52 weeks ended 27 February 2016 At actual exchange rates
UK & ROI £m
International £m
Tesco Bank
£m
Total at actual exchange
£m
Continuing operations
Group sales 37,189 9,715 955 47,859
Revenue 43,080 9,898 955 53,933
Operating profit before exceptional items* 503 320 162 985
Exceptional items 94 (6) (1) 87
Operating profit/(loss) 597 314 161 1,072
Operating margin 1.2% 3.2% 17.0% 1.8%
Share of post-tax profits/(losses) of joint ventures and associates (21)
Finance income 29
Finance costs (878)
Profit/(loss) before tax 202 * Refer to previous table for footnote.
Balance sheet
The following tables showing segment assets and liabilities exclude those balances that make up net debt (cash and cash equivalents, short-term investments, joint venture loans and other receivables, bank and other borrowings, finance lease payables, derivative financial instruments and net debt of the disposal group). Net debt balances have been included within the unallocated segment to reflect how the Group manages these balances. Intercompany transactions have been eliminated other than intercompany transactions with Tesco Bank in net debt.
At 25 February 2017 UK & ROI
£m International
£m
Tesco Bank
£m Unallocated
£m Total
£m
Goodwill, software and other intangible assets 1,293 322 1,102 - 2,717
Property, plant and equipment and investment property 12,893 5,206 73 - 18,172
Investments in joint ventures and associates 11 657 71 - 739
Non-current other investments - - 810 13 823
Non-current trade and other receivables(a) 23 20 - - 43
Non-current loans and advances to customers - - 5,795 - 5,795
Deferred tax asset 601 106 - - 707
Non-current assets(b) 14,821 6,311 7,851 13 28,996
Inventories and current trade and other receivables(c) 2,389 1,048 338 - 3,775
Current loans and advances to customers - - 4,166 - 4,166
Current other investments - - 156 128 284
Total trade and other payables (7,006) (1,951) (242) - (9,199)
Total customer deposits and deposits from banks - - (8,963) - (8,963)
Total provisions (914) (125) (84) - (1,123)
Deferred tax liability (7) (67) (14) - (88)
Net current tax (579) (13) (8) - (600)
Post-employment benefits (6,600) (21) - - (6,621)
Assets held for sale and of the disposal group(d) 100 46 - 187 333
Liabilities of the disposal group(d) - - - (95) (95)
Net debt (including Tesco Bank)(e) - - (722) (3,729) (4,451)
Net assets 2,204 5,228 2,478 (3,496) 6,414 (a) Excludes loans to joint ventures of £137m (2016: £149m) which forms part of Net debt. (b) Excludes derivative financial instrument non-current assets of £1,303m (2016: £1,532m). (c) Excludes net interest and other receivables of £1m (2016: £1m) which forms part of Net debt. (d) Excludes Net debt of the disposal group of £(65)m. Refer to Note 7. (e) Refer to Note 18.

TESCO PLC
24
Note 2 Segmental reporting continued Balance sheet continued At 27 February 2016
UK & ROI £m
International £m
Tesco Bank
£m Unallocated
£m Total
£m
Goodwill, software and other intangible assets 1,391 309 1,174 - 2,874
Property, plant and equipment and investment property 12,815 5,085 78 - 17,978
Investments in joint ventures and associates 5 704 76 - 785
Non-current other investments - - 927 151 1,078
Non-current trade and other receivables(a) 31 21 - - 52
Non-current loans and advances to customers - - 4,723 - 4,723
Deferred tax asset - 49 - - 49
Non-current assets(b) 14,242 6,168 6,978 151 27,539
Inventories and current trade and other receivables(c) 2,526 995 314 - 3,835
Current loans and advances to customers - - 3,819 - 3,819
Current other investments - - 57 - 57
Total trade and other payables (6,580) (1,736) (252) - (8,568)
Total customer deposits and deposits from banks - - (7,479) - (7,479)
Total provisions (837) (129) (58) - (1,024)
Deferred tax liability (64) (39) (32) - (135)
Net current tax (403) (3) 2 - (404)
Post-employment benefits (3,153) (22) - - (3,175)
Assets held for sale and of the disposal group(d) 165 71 - - 236
Liabilities of the disposal group(d) - - - - -
Net debt (including Tesco Bank)(e) - - (975) (5,110) (6,085)
Net assets 5,896 5,305 2,374 (4,959) 8,616 (a)-(e) Refer to previous table for footnotes. Other segment information
52 weeks ended 25 February 2017 UK & ROI
£m International
£m
Tesco Bank
£m
Total continuing operations
£m
Discontinued operations(b)
£m Total
£m
Capital expenditure (including acquisitions through business combinations):
Property, plant and equipment (a) 995 386 12 1,393 2 1,395
Investment property - - - - - -
Goodwill, software and other intangible assets 111 16 34 161 - 161
Depreciation and amortisation:
Property, plant and equipment (687) (349) (17) (1,053) (5) (1,058)
Investment property (1) - - (1) - (1)
Software and other intangible assets (117) (26) (101) (244) (1) (245)
Impairment:
Property, plant and equipment loss (12) (155) - (167) (106) (273)
Property, plant and equipment reversal 118 161 - 279 - 279
Investment property loss (2) (1) - (3) - (3)
Investment property reversal 3 1 - 4 - 4
Goodwill, software and other intangible assets loss (54) - - (54) - (54)
Goodwill, software and other intangible assets reversal - 1 - 1 - 1 (a) Includes £nil (2016: £1,742m) of property, plant and equipment acquired through business combinations. (b) Discontinued operations in this table represents amounts up until the point a disposal group is classified as such. This comprises those of Turkey in
the first four months of the year ended 25 February 2017 and the 12 months of the year ended 27 February 2016. In the year ended 27 February 2016, discontinued operations also comprises the results of Korea for the first six months of the year.

TESCO PLC
25
Note 2 Segmental reporting continued Other segment information continued 52 weeks ended 27 February 2016
UK & ROI £m
International £m
Tesco Bank
£m
Total continuing operations
£m
Discontinued operations(b)
£m Total
£m
Capital expenditure (including acquisitions through business combinations):
Property, plant and equipment(a) 2,300 231 8 2,539 60 2,599
Investment property 5 - - 5 - 5
Goodwill, software and other intangible assets 188 17 32 237 4 241
Depreciation and amortisation:
Property, plant and equipment (688) (279) (16) (983) (94) (1,077)
Investment property (2) - - (2) - (2)
Software and other intangible assets (145) (26) (75) (246) (9) (255)
Impairment:
Property, plant and equipment loss (164) (98) - (262) (1) (263)
Property, plant and equipment reversal 126 105 - 231 14 245
Investment property loss - (2) - (2) - (2)
Investment property reversal 7 - - 7 - 7
Goodwill, software and other intangible assets loss (177) (10) - (187) - (187) (a)-(b) Refer to previous table for footnotes. Cash flow statement The following tables provide further analysis of the Group cash flow statement, including a split of cash flows between Retail and Tesco Bank as well as an analysis of Retail continuing and discontinued operations.
Retail Tesco Bank Tesco Group
2017
£m 2016
£m 2017
£m 2016
£m 2017
£m 2016
£m Operating profit/(loss) of continuing operations* 940
911 77 161 1,017 1,072
Operating profit/(loss) of discontinued operations (117) 102 - - (117) 102
Depreciation and amortisation 1,186 1,243 118 91 1,304 1,334
ATM net income (43) (38) 43 38 - -
(Profit)/loss arising on sale of property, plant and equipment and intangible assets
(80) 165 2 (1) (78) 164
(Profit)/loss arising on sale of subsidiaries and other investments
7 - (4) - 3 -
(Profit)/loss arising on sale of joint ventures and associates (5) (1) - - (5) (1)
Impairment loss on goodwill 46 18 - - 46 18
Net impairment loss/(reversal) on other investments (12) (7) - - (12) (7)
Net impairment loss/(reversal) on loans/investments in joint ventures and associates
- 1 - - - 1
Net impairment loss/(reversal) on property, plant and equipment, intangible assets and investment property
(5) 182 - - (5) 182
Adjustment for non-cash element of pensions charge 7 (395) - - 7 (395)
Additional contribution into pension schemes (248) (223) - - (248) (223)
Share-based payments 14 273 1 10 15 283
Tesco Bank fair value movements included in operating profit - - 98 72 98 72
Cash flows generated from operations excluding working capital
1,690 2,231 335 371 2,025 2,602
(Increase)/decrease in working capital 588 350 (55) (518) 533 (168)
Cash generated from/(used in) operations 2,278 2,581 280 (147) 2,558 2,434
Interest received/(paid) (518) (422) (4) (4) (522) (426)
Corporation tax received/(paid) (64) 125 17 (7) (47) 118
Net cash generated from/(used in) operating activities 1,696 2,284 293 (158) 1,989 2,126 * Tesco Bank operating profit as per Bank income statement excluding ATM net income segmental adjustment.

TESCO PLC
26
Note 2 Segmental reporting continued
Cash flow statement continued Retail Tesco Bank Tesco Group
2017
£m 2016
£m 2017
£m 2016
£m 2017
£m 2016
£m
Net cash generated from/(used in) operating activities 1,696 2,284 293 (158) 1,989 2,126
Purchase of property, plant and equipment, investment property and non-current assets classified as held for sale
(1,199) (858) (6) (13) (1,205) (871)
Purchase of intangible assets (129) (146) (40) (21) (169) (167)
Alternative performance measure: Free cash flow 368 1,280 247 (192) 615 1,088
Disposal of subsidiaries, net of cash disposed 205 3,237 - - 205 3,237
Acquisition of subsidiaries, net of cash acquired (25) (325) - - (25) (325)
Proceeds from sale of joint ventures and associates - 192 - - - 192
Proceeds from sale of property, plant and equipment, investment property, intangible assets and non-current assets classified as held for sale
509 350 3 - 512 350
Net (increase)/decrease in loans to joint ventures and associates 15 (1) - - 15 (1)
Investments in joint ventures and associates - (77) - - - (77)
Net (investments in)/proceeds from sale of short-term investments
736 (2,894) - - 736 (2,894)
Net (investments in)/proceeds from sale of other investments 111 17 30 (120) 141 (103)
Dividends received from joint ventures and associates 28 41 - - 28 41
Interest received/(paid) 41 3 - - 41 3
Net cash generated from/(used in) investing activities 292 (461) (13) (154) 279 (615)
Proceeds from issue of ordinary share capital 1 1 - - 1 1
Increase in borrowings 185 286 - 300 185 586
Repayment of borrowings (2,036) (1,328) - - (2,036) (1,328)
Net cash flows from derivative financial instruments 475 154 - - 475 154
Repayment of obligations under finance leases (12) (17) - - (12) (17)
Dividends paid to equity owners - - - - - -
Net cash generated from/(used in) financing activities (1,387) (904) - 300 (1,387) (604)
Intra-Group funding and intercompany transactions 45 50 (45) (50) - -
Net increase/(decrease) in cash and cash equivalents 646 969 235 (62) 881 907
Cash and cash equivalents at the beginning of the year 2,528 1,558 554 616 3,082 2,174
Effect of foreign exchange rate changes (131) 1 - - (131) 1
Cash and cash equivalents including cash held in disposal group at the end of the year
3,043 2,528 789 554 3,832 3,082
Cash held in disposal group (11) - - - (11) -
Cash and cash equivalents at the end of the year 3,032 2,528 789 554 3,821 3,082

TESCO PLC
27
Note 2 Segmental reporting continued Cash flow statement continued Continuing operations Discontinued operations Retail
2017 £m
2016 £m
2017 £m
2016 £m
2017 £m
2016 £m
Operating profit/(loss) 940 911 (117) 102 823 1,013
Depreciation and amortisation 1,180 1,140 6 103 1,186 1,243
ATM net income (43) (38) - - (43) (38)
(Profit)/loss arising on sale of property, plant and equipment and intangible assets
(84) 167 4 (2) (80) 165
(Profit)/loss arising on sale of subsidiaries and other investments 7 - - - 7 -
(Profit)/loss arising on sale of joint ventures and associates (5) (1) - - (5) (1)
Impairment loss on goodwill 46 18 - - 46 18
Net impairment loss/(reversal) on other investments (12) (7) - - (12) (7)
Net impairment loss/(reversal) on loans/investments in joint ventures and associates
- 1 - - - 1
Net impairment loss/(reversal) on property, plant and equipment, intangible assets and investment property
(106) 195 101 (13) (5) 182
Adjustment for non-cash element of pensions charge 6 (401) 1 6 7 (395)
Additional contribution into pension schemes (248) (223) - - (248) (223)
Share-based payments 14 271 - 2 14 273
Cash flow generated from operations excluding working capital 1,695 2,033 (5) 198 1,690 2,231
(Increase)/decrease in working capital 584 55 4 295 588 350
Cash generated from/(used in) operations 2,279 2,088 (1) 493 2,278 2,581
Interest received/(paid) (499) (379) (19) (43) (518) (422)
Corporation tax received/(paid) (64) 167 - (42) (64) 125
Net cash generated from/(used in) operating activities 1,716 1,876 (20) 408 1,696 2,284
Purchase of property, plant and equipment, investment property and non-current assets classified as held for sale
(1,193) (770) (6) (88) (1,199) (858)
Purchase of intangible assets (129) (145) - (1) (129) (146)
Alternative performance measure: Free cash flow 394 961 (26) 319 368 1,280
Included within net impairment loss/(reversal) of property, plant and equipment and intangible assets for discontinued operations is £99m of impairment loss representing remeasurement to fair value less costs to sell of the Group’s Turkish operations. Refer to Note 7.
Note 3 Income and expenses
Continuing operations 2017
£m 2016
£m
Profit/(loss) before tax is stated after charging/(crediting) the following:
Property rental income, of which £38m (2016: £39m) relates to investment properties (358) (316)
Other rental income (50) (53)
Direct operating expenses arising on rental earning investment properties 20 20
Costs of inventories recognised as an expense 41,140 39,534
Inventory losses and provisions 1,337 1,252
Depreciation and amortisation 1,298 1,231
Operating lease expenses, of which £84m (2016: £102m) relates to hire of plant and machinery 1,043 1,142
Net impairment loss/(reversal) on property, plant and equipment and investment property (113) 26
Net impairment loss/(reversal) of goodwill, software and other intangible assets 53 187
Net impairment loss/(reversal) of investments in and loans to joint ventures and associates - 1

TESCO PLC
28
Note 4 Exceptional items
Income statement 52 weeks ended 25 February 2017 Profit/(loss) for the period included the following exceptional items:
Exceptional items included in:
Cost of sales
£m
Administrative expenses
£m
Property- related
items £m
Total exceptional
items included within
operating profit
£m
Share of JV and
associates profits/ (losses)
£m
Finance costs
£m Taxation
£m
Exceptional items within
discontinued operations
£m Net restructuring and redundancy costs(a)
(153) (26) (20) (199) - - 39 -
Net impairment (loss)/reversal of non-current assets and onerous lease provisions(b)
25 - (31) (6) (54) - 20 -
Provision for customer redress(c) (45) - - (45) - - - -
Interchange settlement(d) 57 - - 57 - - (11) -
Amounts provided in relation to DPA and FCA obligations(e)
- (235) - (235) - - - -
Property transactions(f) - - 165 165 - - 50 -
Insurance reserve adjustment(g) - - - - (23) - - -
Foreign exchange losses on GBP short term investments held in overseas entities (h)
- - - - - (244) - -
Exceptional items relating to discontinued operations(i)
- - - - - - - (75)
Total (116) (261) 114 (263) (77) (244) 98 (75) (a) This includes £164m relating to ongoing UK & ROI changes to the Group’s distribution network and to store colleague structures and working practices.
It also includes £35m relating to Tesco Bank business simplification and head office relocation cost. (b) Net impairment (loss)/reversal of non-current assets includes a reversal of £103m in property, plant and equipment and investment property, a net
£(53)m loss in goodwill, software and other intangible assets and a net charge of £(56)m of onerous lease provisions. Refer to Notes 10, 11 and 16 for further details on impairment. The £(54)m loss relates to the Group’s share of impairment in Gain Land Limited following a fair valuation exercise of its investment properties.
(c) Updated guidance from the Financial Conduct Authority (FCA) proposing an extension to the expected Payment Protection Insurance (PPI) settlement deadline, inclusion of items that had previously been out of scope for settlement and higher operational costs and claim rates than previously estimated, have resulted in a provision of £45m.
(d) This relates to settlement of a legal case in respect of interchange fees. (e) The Group has taken a total exceptional charge of £235m in respect of the Deferred Prosecution Agreement (DPA) of £129m, the expected costs of the
compensation scheme of £85m, and related costs. This has been recorded in the financial statements in the year to 25 February 2017 as an adjusting post balance sheet event. Refer to Notes 16 and 22 for further details.
(f) As part of the Group’s strategy to maximise value from property, the Group generated a profit on disposal of surplus properties and development sites of £74m. In addition, two malls in Central Europe were disposed of, generating a profit of £91m. There is a tax credit of £50m primarily due to a lower book value than tax value of assets disposed. Refer to item (b) overleaf for cash proceeds.
(g) The Group’s share of the results for the year of its joint venture, Tesco Underwriting, reflects an adjustment to insurance reserves following a revision to the Ogden tables, which are used to calculate future losses in personal injury and fatal accident claims.
(h) The Group received £2.5bn of proceeds from the sale of the Korean operations in GBP money market funds in an intermediate entity with a Euro functional currency. Over the year, this has generated a £244m loss which represents foreign exchange losses arising on the revaluation of these sterling-denominated funds into Euros. The loss does not represent an economic loss to the Group since there is an offset within other comprehensive income.
(i) On 10 June 2016, the Group announced the proposed sale of its Turkish operations. This charge includes: an impairment of £(99)m following a remeasurement of the assets and liabilities of the Turkish operations to fair value less costs to sell; £(3)m of costs to sell the Turkish operations and £27m of net adjustments on profits/(losses) of past disposals. Refer to Note 7 for further details.

TESCO PLC
29
Note 4 Exceptional items continued
Income statement continued 52 weeks ended 27 February 2016 Profit/(loss) for the period included the following exceptional items:
Exceptional items included in:
Cost of sales
£m
Administrative expenses
£m
Property- related
items £m
Total exceptional items included
within operating profit
£m
Finance costs
£m Taxation
£m
Exceptional items within
discontinued operations
£m Net impairment (loss)/reversal of non-current assets and onerous lease provisions
(314) - (109) (423) - 73 15
Net restructuring and redundancy costs (75) (34) (17) (126) - 9 -
Property transactions - - 156 156 - (20) -
Past service credit and other associated costs
424 56 - 480 - (86) -
Foreign exchange losses on GBP balances held in overseas entities
- - - - (220) - -
Release of overprovision of tax liabilities in prior years
- - - - - 86 -
Loss on disposal of Korean operations - - - - - - (168)
Total 35 22 30 87 (220) 62 (153)
Cash flow statement The table below shows the impact of exceptional items on the Group cash flow statement:
Cash flows from operating activities
Cash flows from investing activities
2017
£m 2016
£m 2017
£m 2016
£m Prior year restructuring costs and other exceptional costs including trading store redundancies(a)
(54) (251) - -
Current year restructuring costs and other exceptional costs including trading store redundancies(a)
(78) (63) - -
Utilisation of onerous lease provisions (113) (90) - - Property transactions(b) 36 218 490 - Provision for customer redress(c) (28) (34) - - Legal settlement 57 - - - Exceptional cash flows from discontinued operations 2 - - - Defined benefit pension scheme closure cost - (58) - - Property transactions – buy-back of property joint ventures, net of £15m cash acquired
- - - (139)
Total (178) (278) 490 (139) (a) Cash outflows on settlement of restructuring and redundancy costs. (b) The proceeds from property transactions totalled £526m comprising £490m net proceeds from the sale of two malls in Central Europe and other
properties in the UK & ROI, and £36m for development sites in UK & ROI. Refer to item (f) on the previous page. (c) Settlement of claims for customer redress in Tesco Bank.

TESCO PLC
30
Note 5 Finance income and costs Continuing operations
2017 £m
2016 £m
Finance income
Interest receivable and similar income 48 29
Financial instruments – fair value remeasurements 61 -
Total finance income 109 29
Finance costs
GBP MTNs and Loans (227) (176)
EUR MTNs (114) (122)
USD Bonds (93) (86)
Finance charges payable under finance leases and hire purchase contracts (8) (9)
Other interest payable (81) (97)
Capitalised interest (Note 11)* 6 6
Financial instruments – fair value remeasurements - (19)
Total finance costs before exceptional items and net pension finance costs (517) (503)
Net pension finance costs (Note 17) (113) (155)
Foreign exchange losses on GBP short-term investments held in overseas entities (Note 4) (244) (220)
Total finance costs (874) (878)
Net finance cost (765) (849) * A deferred tax liability is recognised in respect of capitalised interest at the applicable rate in the country in which the interest is capitalised.
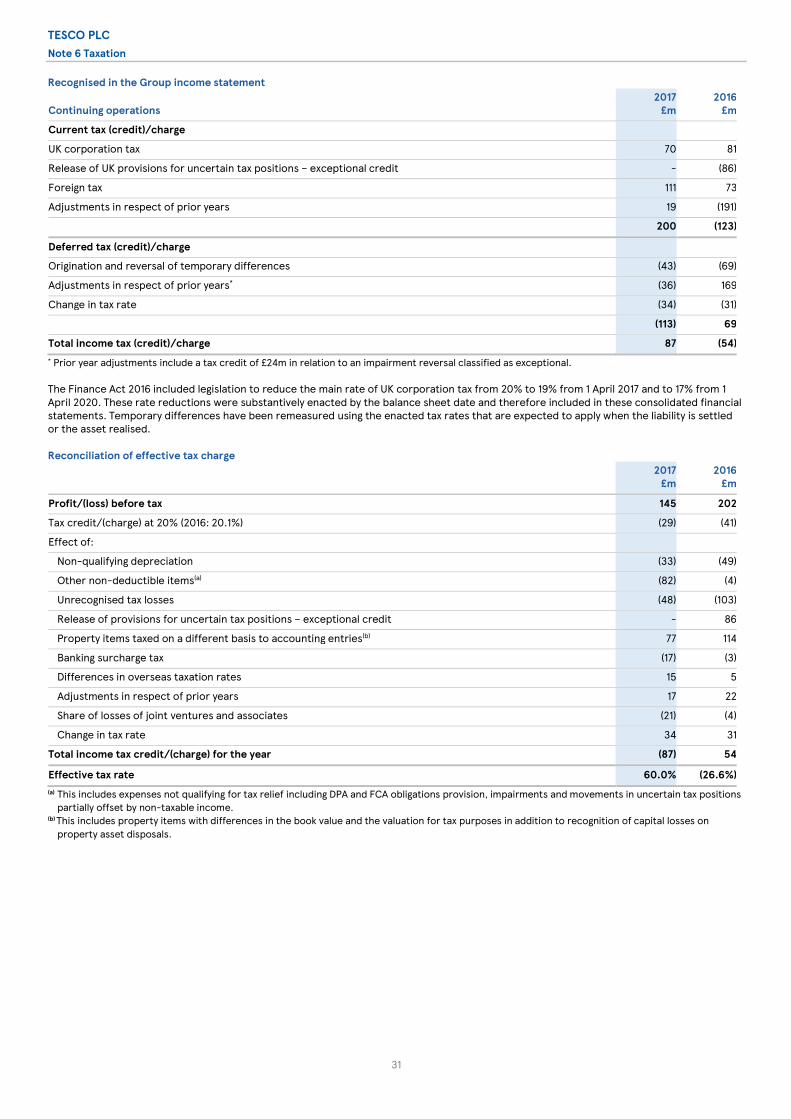
TESCO PLC
31
Note 6 Taxation Recognised in the Group income statement
Continuing operations 2017
£m 2016
£m
Current tax (credit)/charge
UK corporation tax 70 81
Release of UK provisions for uncertain tax positions – exceptional credit - (86)
Foreign tax 111 73
Adjustments in respect of prior years 19 (191)
200 (123)
Deferred tax (credit)/charge
Origination and reversal of temporary differences (43) (69)
Adjustments in respect of prior years* (36) 169
Change in tax rate (34) (31)
(113) 69
Total income tax (credit)/charge 87 (54) * Prior year adjustments include a tax credit of £24m in relation to an impairment reversal classified as exceptional. The Finance Act 2016 included legislation to reduce the main rate of UK corporation tax from 20% to 19% from 1 April 2017 and to 17% from 1 April 2020. These rate reductions were substantively enacted by the balance sheet date and therefore included in these consolidated financial statements. Temporary differences have been remeasured using the enacted tax rates that are expected to apply when the liability is settled or the asset realised. Reconciliation of effective tax charge
2017
£m 2016
£m
Profit/(loss) before tax 145 202
Tax credit/(charge) at 20% (2016: 20.1%) (29) (41)
Effect of:
Non-qualifying depreciation (33) (49)
Other non-deductible items(a) (82) (4)
Unrecognised tax losses (48) (103)
Release of provisions for uncertain tax positions – exceptional credit - 86
Property items taxed on a different basis to accounting entries(b) 77 114
Banking surcharge tax (17) (3)
Differences in overseas taxation rates 15 5
Adjustments in respect of prior years 17 22
Share of losses of joint ventures and associates (21) (4)
Change in tax rate 34 31
Total income tax credit/(charge) for the year (87) 54
Effective tax rate 60.0% (26.6%) (a) This includes expenses not qualifying for tax relief including DPA and FCA obligations provision, impairments and movements in uncertain tax positions
partially offset by non-taxable income. (b) This includes property items with differences in the book value and the valuation for tax purposes in addition to recognition of capital losses on
property asset disposals.

TESCO PLC
32
Note 6 Taxation continued Reconciliation of effective tax charge on alternative performance measures
2017
£m 2016
£m
Profit/(loss) before tax before exceptional items 729 335
Tax credit/(charge) at 20% (2016: 20.1%) (146) (67)
Effect of:
Non-qualifying depreciation (33) (30)
Other non-deductible items(a) (50) (4)
Unrecognised tax losses (14) (59)
Property items taxed on a different basis to accounting entries(b) (1) 102
Banking surcharge tax (17) (3)
Differences in overseas taxation rates (7) 8
Adjustments in respect of prior years 39 22
Share of losses of joint ventures and associates (5) (4)
Change in tax rate 49 27
Total income tax credit/(charge) for the year (185) (8)
Effective tax rate before exceptional items 25.4% 2.4%
Net pension finance costs 113 155
Tax charge at 20% (2016: 20.1%) (23) (31)
Change in tax rate 4 3
Total income tax credit/(charge) before exceptional items and net pension finance cost for the year (204) (36)
Effective tax rate before exceptional items and net pension finance costs 24.2% 7.3% (a) This includes expenses not qualifying for tax relief, impairments and movements in uncertain tax positions partially offset by non-taxable income. (b) This includes property items with differences in the book value and the valuation for tax purposes in addition to recognition of capital losses on
property asset disposals.
Note 7 Discontinued operations and non-current assets classified as held for sale Assets and liabilities of the disposal group and non-current assets classified as held for sale
25 February 2017
£m
27 February 2016
£m
Assets of the disposal group 198 -
Non-current assets classified as held for sale 146 236
Total assets of the disposal group and non-current assets classified as held for sale 344 236
Total liabilities of the disposal group (171) -
Total net assets of the disposal group and non-current assets classified as held for sale 173 236
The non-current assets classified as held for sale consist mainly of properties in the UK and Central Europe due to be sold within one year. Discontinued operations On 10 June 2016, the Group announced the proposed sale of its 95.5% controlling interest in Tesco Kipa Kitle Pazarlama Ticaret Lojistik ve Gıda Sanayi A.Ş. (referred to as Turkish operations or Turkey) to Migros Ticaret A.Ş (Migros). In accordance with IFRS 5 ‘Non-current Assets Held for Sale and Discontinued Operations’, the assets and liabilities related to the Turkish operations have been classified as a disposal group held for sale within the period. Local regulatory approval was granted on 9 February 2017 and the sale completed on 1 March 2017.
At year end, an impairment charge of £99m has been recognised in property, plant and equipment primarily based on the latest completion statement as at 1 March 2017 reflecting fair value less costs to sell. This impairment has been included as an exceptional item within discontinued operations. The gain/(loss) on disposal at completion will also reflect the impact of recycling of Turkey’s currency translation reserve; at the year end the recycling would have increased the loss on sale by £119m. The equivalent amount for the recycling of the currency translation reserve at the date of disposal will be recorded as a non-cash loss within discontinued operations in the year ending 24 February 2018.
The tables on the next page show the results of the discontinued operations which are included in the Group income statement, Group balance sheet and Group cash flow statement respectively. The comparative includes the Korean operations, which were sold on 22 October 2015 and disclosed as discontinued in the 2016 Annual Report.

TESCO PLC
33
Note 7 Discontinued operations and non-current assets classified as held for sale continued Income statement
2017 2016
Total(a)
£m Turkey
£m Korea
£m Total
£m
Revenue 543 500 3,526 4,026
Expenses(b) (580) (555) (3,404) (3,959)
Profit/(loss) before tax before exceptional items (37) (55) 122 67
Taxation - - (41) (41)
Profit/(loss) after tax before exceptional items (37) (55) 81 26
Net impairment (loss)/reversal of non-current assets and onerous lease provisions (99) 15 - 15
Costs to sell and other provisions - Turkey (3) - - -
Loss after tax on disposal of Korean operations - - (168) (168)
Net adjustments to profit/(loss) of past disposals 27 - - -
Total profit/(loss) after tax of discontinued operations(c) (112) (40) (87) (127) (a) These figures represent the income statement of Turkey for the current year and the net adjustments to profit/(loss) of past disposals of £27m. (b) Intercompany recharges totalling £2m (2016: £2m) between continuing operations and the Turkey discontinued operation have been eliminated and
intercompany recharges and intercompany loan interest totalling £48m between continuing operations and the Korea discontinued operation have been eliminated in 2016. These eliminations impact the performance of continuing and discontinued operations, reducing the profit/(loss) before tax of continuing operations by £2m (2016: £50m), whilst increasing the profit/(loss) before tax of Turkey and Korea discontinued operations by the same respective amounts.
(c) Total profit/(loss) after tax of discontinued operations includes a loss of £6m attributable to non-controlling interests (2016: loss of £2m). Loss per share impact from discontinued operations
2017 Pence/share
2016 Pence/share
Basic (1.30) (1.54)
Diluted (1.30) (1.53) Balance sheet Turkey
2017
£m
Assets of the disposal group
Goodwill and other intangible assets 9
Property, plant and equipment 121
Inventories 43
Trade and other receivables 14
Cash and cash equivalents 11
Total assets of the disposal group 198
Trade and other payables (88)
Borrowings (76)
Other liabilities (7)
Total liabilities of the disposal group (171)
Total net assets of the disposal group 27

TESCO PLC
34
Note 7 Discontinued operations and non-current assets classified as held for sale continued Cash flow statement
Turkey 2017
£m
Korea and Turkey
2016 £m
Net cash flows from operating activities (20) 408
Net cash flows from investing activities 13 (20)
Net cash flows from financing activities 21 8
Net cash flows from discontinued operations 14 396
Intra-Group funding and intercompany transactions (2) (108)
Net cash flows from discontinued operations, net of intercompany 12 288
Net cash flows from disposal of subsidiary - (366)
Net cash flows from discontinued operations, net of intercompany and disposal of subsidiary 12 (78)
Note 8 Dividends No dividend has been paid or is proposed in respect of the financial year ended 25 February 2017 (2016: £nil).
Note 9 Earnings/(losses) per share and diluted earnings/(losses) per share Basic earnings/(losses) per share amounts are calculated by dividing the profit/(loss) attributable to owners of the parent by the weighted average number of ordinary shares in issue during the financial year. Diluted earnings/(losses) per share amounts are calculated by dividing the profit/(loss) attributable to owners of the parent by the weighted average number of ordinary shares in issue during the financial year adjusted for the effects of potentially dilutive options. The dilutive effect is calculated on the full exercise of all potentially dilutive ordinary share options granted by the Group, including performance-based options which the Group considers to have been earned.
For the 52 weeks ended 25 February 2017 there were 20 million (2016: 26 million) potentially dilutive share options. As the Group has recognised a profit for the period from its continuing operations, dilutive effects have been considered in calculating diluted earnings per share.
2017 2016
Basic
Potentially dilutive share
options Diluted Basic
Potentially dilutive share
options Diluted
Profit/(loss) (£m)
Continuing operations(a) 66 - 66 263 - 263
Discontinued operations(b) (106) - (106) (125) - (125)
Total (40) - (40) 138 - 138
Weighted average number of shares (millions) 8,148 20 8,168 8,126 26 8,152
Earnings/(losses) per share (pence)
Continuing operations 0.81 - 0.81 3.24 (0.02) 3.22
Discontinued operations (1.30) - (1.30) (1.54) 0.01 (1.53)
Total (0.49) - (0.49) 1.70 (0.01) 1.69 (a) Excludes losses from non-controlling interest of £8m (2016: £7m). (b) Excludes losses from non-controlling interests of £6m (2016: £2m).

TESCO PLC
35
Note 9 Earnings/(losses) per share and diluted earnings/(losses) per share continued Alternative performance measure: Earnings/(losses) per share and diluted earnings/(losses) per share from continuing operations before exceptional items
2017 2016
Basic
Potentially dilutive share
options Diluted Basic
Potentially dilutive share
options Diluted
Profit/(loss) (£m)
Continuing operations(a) 551 - 551 330 - 330
Discontinued operations(b) (36) - (36) 29 - 29
Total 515 - 515 359 - 359
Weighted average number of shares (millions) 8,148 20 8,168 8,126 26 8,152
Earnings/(losses) per share (pence)
Continuing operations 6.76 (0.01) 6.75 4.06 (0.01) 4.05
Discontinued operations (0.44) - (0.44) 0.36 (0.01) 0.35
Total 6.32 (0.01) 6.31 4.42 (0.02) 4.40 (a) Excludes losses from non-controlling interest of £7m (2016: £3m). (b) Excludes losses from non-controlling interests of £1m (2016: £3m). Alternative performance measure: Diluted earnings/(losses) per share from continuing operations before exceptional items and net pension finance costs
2017 2016
Profit before tax from continuing operations before exceptional items (£m) 729 335
Add: Net pension finance costs (£m) 113 155
Profit before tax from continuing operations before exceptional items and net pension finance costs (£m) 842 490
Profit before tax from continuing operations before exceptional items and net pension finance costs attributable to the owners of the parent (£m)
845 494
Taxation on profit from continuing operations before exceptional items and net pension finance costs attributable to the owners of the parent (£m)
(200) (37)
Profit after tax from continuing operations before exceptional items and net pension finance costs attributable to the owners of the parent (£m)
645 457
Diluted weighted average number of shares (millions) 8,168 8,152
Diluted earnings per share from continuing operations before exceptional items and net pension finance costs (pence)
7.90 5.61
Refer to page 52 for further detail on the Group’s APMs.

TESCO PLC
36
Note 10 Goodwill, software and other intangible assets Goodwill, software and other intangible assets of £2,717m (2016: £2,874m) comprise £1,792m goodwill (2016: £1,827m), £879m software (2016: £975m) and other intangible assets of £46m (2016: £72m). Impairment of goodwill The goodwill balances, discount rates and long-term growth rates for each group of cash-generating units are shown below:
Balances
£m Pre-tax
discount rates Post-tax
discount rates Long- term
growth rates
2017 2016 2017 2016 2017 2016 2017 2016
Tesco Bank 802 802 12.0% 11.0% 9.1% 8.2% 3.0% 4.0%
UK* 735 796 9.3% 9.1% 7.5% 7.2% 2.0% 2.0%
Thailand 181 159 10.0% 10.1% 8.0% 8.1% 2.7% 2.6%
Malaysia 74 70 12.4% 12.3% 9.4% 9.4% 2.3% 2.1%
1,792 1,827 * Included in the UK prior year balance is £29m previously disclosed as Other. Goodwill arising on business combinations is not amortised but is reviewed for impairment on an annual basis, or more frequently if there are indications that goodwill may be impaired. Goodwill acquired in a business combination is allocated to groups of cash-generating units according to the level at which management monitor that goodwill.
Impairment reviews were performed by comparing the carrying value of goodwill with the recoverable amount of the cash-generating units to which goodwill has been allocated. Recoverable amounts for cash-generating units are the higher of fair value less costs of disposal, and value in use. The key estimates for the value in use calculations are those regarding discount rates, growth rates and expected changes in margins.
Management estimates discount rates using pre-tax rates that reflect the current market assessment of the time value of money and the risks specific to the cash-generating units. The pre-tax discount rates used to calculate value in use are derived from the Group’s post-tax weighted average cost of capital, as adjusted for the specific risks relating to each cash-generating unit.
Cash flow projections are based on the Group’s three year internal forecasts, the results of which are reviewed by the Board. Estimates of selling prices and direct costs are based on past experience and expectations of future changes in the market. The forecasts are extrapolated to five years based on management’s expectations, and beyond five years based on estimated long-term average growth rates as shown above. These long-term growth rates for the Retail business are based on inflation forecasts by recognised bodies. The long-term growth rate for Tesco Bank is based on inflation and GDP growth forecasts by recognised bodies.
Goodwill related to the Sociomantic acquisition of £46m, within the UK balance, was fully impaired in the year due to lower forecast cash flows for the business. This charge has been classified as an exceptional item within ‘Net impairment of non-current assets and onerous lease provisions’ within cost of sales.
The Group has carried out a sensitivity analysis on the impairment tests of each group of cash-generating units to which goodwill has been allocated. A reasonably possible increase in the discount rate or reduction in the long-term growth rate by one percentage point, would not indicate impairment in any group of cash-generating units apart from Malaysia where an increase in the discount rate by one percentage point would reduce the recoverable value by £90m to its carrying value of £74m.
Impairment of software and other intangible assets
A net impairment loss of £7m has been recognised against software and other intangible assets as part of the impairment review discussed in Note 11. This loss has been classified as an exceptional item within ‘Net impairment of non-current assets and onerous lease provisions’ within cost of sales. Of the prior year impairment loss of £169m, a loss of £154m was recognised principally as a result of an evaluation of the cash-generating unit for technology relating to online general merchandising as the Group moved towards a single online platform for customers.

TESCO PLC
37
Note 11 Property, plant and equipment
Land and buildings
£m Other(a)
£m Total
£m
Cost
At 27 February 2016 22,557 10,468 33,025
Foreign currency translation 727 327 1,054
Additions(b) 816 579 1,395
Reclassification (103) 58 (45)
Classified as held for sale (316) (6) (322)
Disposals (674) (594) (1,268)
Transfer to disposal group classified as held for sale (317) (151) (468)
At 25 February 2017 22,690 10,681 33,371
Accumulated depreciation and impairment losses
At 27 February 2016 7,198 7,927 15,125
Foreign currency translation 258 239 497
Charge for the year 419 639 1,058
Impairment losses 246 27 273
Reversal of impairment losses (246) (33) (279)
Reclassification (58) 11 (47)
Classified as held for sale (137) (1) (138)
Disposals (353) (539) (892)
Transfer to disposal group classified as held for sale (232) (102) (334)
At 25 February 2017 7,095 8,168 15,263
Net carrying value
At 25 February 2017 15,595 2,513 18,108
At 27 February 2016 15,359 2,541 17,900
Construction in progress included above(c)
At 25 February 2017 57 66 123
At 27 February 2016 121 63 184 (a) Other assets consist of fixtures and fittings with a net carrying value of £2,023m (2016: £2,145m), office equipment with a net carrying value of £161m
(2016: £144m) and motor vehicles with a net carrying value of £329m (2016: £252m). (b) Includes £6m (2016: £7m) in respect of interest capitalised, principally relating to land and building assets. The capitalisation rate used to determine
the amount of finance costs capitalised during the financial year was 4.9% (2016: 4.6%). Interest capitalised is deducted in determining taxable profit in the financial year in which it is incurred.
(c) Construction in progress does not include land. Assets held under finance leases Net carrying value includes assets held under finance leases, which are analysed below. These assets are pledged as security for the finance lease liabilities.
2017 2016 Land and buildings
£m
Other
£m
Land and buildings
£m
Other
£m Net carrying value 66 27 55 21 Land and buildings The net carrying value of land and buildings comprises: 2017
£m 2016
£m Freehold 13,175 13,005 Long leasehold – 50 years or more 404 491 Short leasehold – less than 50 years 2,016 1,863 Net carrying value 15,595 15,359 In the current year the Group reclassified property, plant and equipment with a net book value of £nil (2016: £8m) to development properties in inventories.

TESCO PLC
38
Note 11 Property, plant and equipment continued
Land and buildings
£m Other(a)
£m Total
£m
Cost
At 28 February 2015 25,298 11,493 36,791
Foreign currency translation 76 34 110
Additions (b) 364 493 857
Acquired through business combinations 1,725 17 1,742
Reclassification (93) 2 (91)
Classified as held for sale (715) (23) (738)
Disposals (515) (346) (861)
Transfer to disposal group classified as held for sale (3,583) (1,202) (4,785)
At 27 February 2016 22,557 10,468 33,025
Accumulated depreciation and impairment losses
At 28 February 2015 8,021 8,330 16,351
Foreign currency translation 93 49 142
Charge for the year 318 759 1,077
Impairment losses 263 - 263
Reversal of impairment losses (220) (25) (245)
Reclassification (28) (77) (105)
Classified as held for sale (475) (20) (495)
Disposals (295) (281) (576)
Transfer to disposal group classified as held for sale (479) (808) (1,287)
At 27 February 2016 7,198 7,927 15,125 (a)-(b) Refer to previous page for footnotes. Commitments for capital expenditure contracted for, but not incurred, at 25 February 2017 were £115m (2016: £215m), principally relating to store development. Impairment of property, plant and equipment The Group has determined that for the purposes of impairment testing, each store is a cash-generating unit. Cash-generating units are tested for impairment if there are indicators of impairment at the balance sheet date. Recoverable amounts for cash-generating units are the higher of fair value less costs of disposal, and value in use.
The key estimates for the value in use calculations are those regarding discount rates, growth rates and expected changes in margins. Management estimates discount rates using pre-tax rates that reflect the current market assessment of the time value of money and the risks specific to the cash-generating units. The discount rates are derived from the Group’s post-tax weighted average cost of capital, as adjusted for the specific risks relating to each geographical region and predominately range from 9% to 13% (2016: 9% to 12%). On a post-tax basis, the discount rates predominately range from 7% to 10% (2016: 7% to 9%).
Cash flow projections are based on the Group’s three year internal forecasts, the results of which are reviewed by the Board. Estimates of selling prices and direct costs are based on past experience and expectations of future changes in the market. The forecasts are extrapolated to five years based on management’s expectations, and beyond five years based on estimated long-term average growth rates. These long-term growth rates are based on inflation forecasts by recognised bodies and range from 1% to 3% (2016: 2% to 6%).
Fair values are determined with regard to the market rent for the stores or for alternative uses with investment yields appropriate to reflect the physical characteristics of the property, location, infrastructure, redevelopment potential and other factors. In some cases, fair values include residual valuations where stores may be viable for redevelopment. The key inputs to the valuation are the potential market rents and yields, both of which are largely based on rentals and yields for similar properties in that location. Fair values for the Group’s properties were determined with the assistance of independent, professional valuers where appropriate.
The net carrying value of £18,108m (2016: £17,900m) above comprises £13,338m (2016: £13,731m) of unimpaired assets and £4,770m (2016: £4,169m) of impaired assets. Of the impaired assets, £2,196m (2016: £1,805m) carrying value was supported by value in use and £2,574m (2016: £2,364m) was supported by fair value. Due to the individual nature of each property, these fair values are classified as Level 3 within the fair value hierarchy.
The total net impairment reversal of £6m includes an impairment loss of £106m relating to the Group’s decision to sell its Turkish operations. This impairment has been classified as an exceptional item relating to discontinued operations; refer to Note 4 and Note 7 for further details.
The remaining net impairment reversal of £112m (£279m reversal offset by £167m losses) relating to continuing operations largely reflects normal fluctuations expected from store level performance within the continuing challenging economic environment. These losses and reversals have been largely presented net at a country level to reflect the underlying trends in the businesses. The impairment reversal of £279m (2016: £231m) relates to properties in the UK & ROI of £118m (2016: £126m) and International of £161m (2016: £105m), whilst the impairment losses of £167m (2016: £263m) relate to properties in the UK & ROI of £12m (2016: £164m) and International of £155m (2016: £99m).

TESCO PLC
39
Note 11 Property, plant and equipment continued
Of the £112m net reversal relating to continuing operations, a £134m reversal within exceptional items related to trading stores has been classified as ‘Net impairment of non-current assets and onerous lease provisions’ included within cost of sales. In addition, a £30m charge within exceptional items related to construction in progress and closed stores has been classified as ‘Net impairment of non-current assets and onerous lease provisions’ included within profits/(losses) arising on property-related items. The remaining £8m reversal has not been included within exceptional items as it relates to the ongoing management of the property portfolio.
The prior period net impairment charge of £18m included a £14m reversal relating to the Turkish operations, which were classified as discontinued in the current financial year. Of the remaining £32m impairment charge related to continuing operations, an £80m release within exceptional items related to trading stores and online general merchandising hardware, which was classified as ‘Net impairment of non-current assets and onerous lease provisions’ included within cost of sales. In addition, a £90m charge within exceptional items related to construction in progress and closed stores was classified as ‘Net impairment of non-current assets and onerous lease provisions’ included within profits/(losses) arising on property-related items. An additional £34m charge within exceptional items relating to business rationalisation in the UK & ROI was classified as ‘Net restructuring and redundancy costs’ included within cost of sales. The remaining £12m reversal was not included within exceptional items.
The Group has carried out a sensitivity analysis on the impairment tests for its trading stores portfolio. A reasonably possible increase of one percentage point in the post-tax discount rates for each geographic region would increase impairment by £278m. A decrease by one percentage point would decrease impairment by £243m.
Note 12 Group entities The Group consists of the ultimate parent company, Tesco PLC, and a number of subsidiaries, joint ventures and associates held directly or indirectly by Tesco PLC.
Subsidiaries The accounting year ends of the subsidiaries consolidated in these financial statements are on or around 25 February 2017.
Interests in joint ventures and associates Principal joint ventures and associates The Group’s principal joint ventures and associates are:
Nature of relationship Business activity
Share of issued share
capital, loan capital and
debt secrurities
Country of incorporation
Principal area of operation
Gain Land Limited Associate Retail 20% British Virgin Islands
People’s Republic of China / Hong Kong
Included in ‘UK property joint ventures’ BLT Properties Limited* Joint venture Property investment 50% England United Kingdom The Tesco Coral Limited Partnership Joint venture Property investment 50% England United Kingdom The Tesco Blue Limited Partnership Joint venture Property investment 50% England United Kingdom The Tesco Atrato Limited Partnership Joint venture Property investment 50% England United Kingdom The Tesco Passaic Limited Partnership Joint venture Property investment 50% England United Kingdom The Tesco Navona Limited Partnership Joint venture Property investment 50% England United Kingdom The Tesco Sarum Limited Partnership Joint venture Property investment 50% England United Kingdom The Tesco Dorney Limited Partnership Joint venture Property investment 50% England United Kingdom The Tesco Property (No. 2) Limited Partnership
Joint venture Property investment 50% Jersey United Kingdom
Included in ‘Other joint ventures and associates’:
Tesco Mobile Limited Joint venture Telecommunications 50% England United Kingdom Tesco Underwriting Limited Joint venture Financial services 49.9% England United Kingdom Trent Hypermarket Limited Joint venture Retail 50% India India Tesco Lotus Retail Growth Freehold and Leasehold Property Fund
Associate Property investment 25% Thailand Thailand
* On 6 April 2017, the Group purchased the remaining 50% of equity interest in BLT Properties Limited. Refer to Note 22 for further details.
The accounting period end dates of the joint ventures and associates consolidated in these financial statements range from 31 December 2016 to 25 February 2017. The accounting period end dates for joint ventures differ from those of the Group for commercial reasons and depend upon the requirements of the joint venture partner as well as those of the Group. The accounting period end dates of the associates are different from those of the Group as they depend upon the requirements of the parent companies of those entities.
There are no significant restrictions on the ability of joint ventures and associates to transfer funds to the parent, other than those imposed by the Companies Act 2006, and for Tesco Underwriting Limited, regulatory capital requirements.

TESCO PLC
40
Note 12 Group entities continued
The UK property joint ventures involve the Group partnering with third parties in carrying out some property investments in order to enhance returns from property and access funding, whilst reducing risks associated with sole ownership. These property investments generally cover shopping centres and standalone stores. The Group enters into operating leases for some or all of the properties held in the joint ventures. These leases provide the Group with some rights over alterations and adjacent land developments. Some leases also provide the Group with options to purchase the other joint venturers’ equity stakes at a future point in time. In some cases the Group has the ability to substitute properties in the joint ventures with alternative properties of similar value, subject to strict eligibility criteria. In other cases, the Group carries out property management activities for third party rentals of shopping centre units.
The property investment activities are carried out in separate entities, usually partnerships or limited liability companies. The Group has assessed its ability to direct the relevant activities of these entities and impact Group returns and concluded that the entities qualify as joint ventures since decisions regarding them require the unanimous consent of both equity holders. This assessment included not only rights within the joint venture agreements, but also any rights within other contractual arrangements between the Group and the entities.
The Group made a number of judgements in arriving at this determination, the key ones being:
• since the provisions of the joint venture agreements require the relevant decisions impacting investor returns to be either unanimously agreed by both joint venturers at the same time, or in some cases to be agreed sequentially by each venturer at different stages, there is joint decision making within the joint venture;
• since the Group’s leases are priced at fair value, and any rights embedded in the leases are consistent with market practice, they do not provide the Group with additional control over the joint ventures or infer an obligation by the Group to fund the settlement of liabilities of the joint ventures;
• any options to purchase the other joint venturers’ equity stakes are priced at market value, and only exercisable at future dates, hence they do not provide control to the Group at the current time;
• where the Group has a right to substitute properties in the joint ventures, the rights are strictly limited and are at fair value, hence do not provide control to the Group; and
• where the Group carries out property management activities for third party rentals in shopping centres, these additional activities are controlled through joint venture agreements or lease agreements, and do not provide the Group with additional powers over the joint venture.

TESCO PLC
41
Note 12 Group entities continued
Summarised financial information for joint ventures and associates The summarised financial information below reflects the amounts presented in the financial statements of the relevant joint ventures and associates, and not the Group’s share of those amounts. These amounts have been adjusted to conform to the Group’s accounting policies where required. The summarised financial information for UK property joint ventures has been aggregated in order to provide useful information to users without excessive detail since these entities have similar characteristics and risk profiles largely based on their nature of activities and geographic market.
UK property joint ventures
Gain Land Limited
2017 £m
2016 £m
12 months to Dec
2016 £m
12 months to Dec
2015 £m
Summarised balance sheet Non-current assets(a) 4,060 4,158 4,471 4,712 Current assets (excluding cash and cash equivalents) 99 58 2,261 2,047 Cash and cash equivalents 48 38 631 581 Current liabilities(b) (301) (327) (6,208) (5,550) Non-current liabilities(b) (4,831) (4,572) (169) (153) Net (liabilities)/assets (925) (645) 986 1,637 Summarised income statement Revenue 292 296 9,081 8,408 Profit/(loss) after tax - (36) (626) (341) Reconciliation to carrying amounts: Opening balance – 49 511 582 Additions/(disposals) – (10) - - Foreign currency translation – - 47 (3) Share of profits/(losses)(c) 14 22 (125) (68) Dividends received from joint ventures and associates (14) (29) - - Deferred profits offset against carrying amounts(d) - (32) - - Closing balance - - 433 511 Group’s share in ownership 50% 50% 20% 20% Group’s share of net assets/(liabilities) (463) (323) 197 327 Goodwill - - 236 184 Deferred property profits offset against carrying amounts(d) (63) (64) - - Cumulative unrecognised losses(e) 175 143 - - Cumulative unrecognised hedge reserves(f) 351 244 - - Carrying amount - - 433 511 (a) The non-current asset balances of UK property joint ventures are reflected at historic depreciated cost to conform to the Group’s accounting
policies. The aggregate fair values in the financial statements of the joint ventures are £5,242m (2016: £5,415m). (b) The current and non-current liabilities of UK property joint ventures largely comprise loan balances of £4,121m (2016: £4,151m) and derivative swap
balances of £703m (2016: £487m) entered into to hedge the cash flow variability exposures of the joint ventures. The 2016 derivative balance of £487m reflects a £159m reduction due to valuation adjustments for credit risk not included in the prior year.
(c) The profit for the year for UK property joint ventures related to £14m dividends received from joint ventures with £nil carrying amounts £21m of losses and £107m of decreases in the fair values of derivatives arising from these entities have been included in cumulative unrecognised losses and cumulative unrecognised hedge reserves respectively. The loss of £(125)m for Gain Land Limited includes an impairment loss of £(54)m treated as an exceptional item. Refer to Note 4.
(d) Deferred profits that arose from the transfer of properties into the UK property joint ventures have been offset against the carrying amounts of the related joint ventures. £1m relating to The Brookmaker Limited Partnership has been released during the year as a result of the disposal.
(e) Cumulative unrecognised losses of £3m were disposed of relating to The Brookmaker Limited Partnership. (f) The 2016 cumulative unrecognised hedge reserves balances have been reduced by £79m to reflect valuation adjustments for credit risks. At 25 February 2017, the Group has £103m (2016: £115m) loans to UK property joint ventures and £nil (2016: £nil) to Gain Land Limited.

TESCO PLC
42
Note 12 Group entities continued
Other joint ventures and associates The Group also has interests in a number of other joint ventures and associates, excluding UK Property joint ventures and Gain Land Limited. These are not considered to be individually material to the Group.
Joint ventures Associates
2017 £m
2016 £m
2017 £m
2016 £m
Aggregate carrying amount of other joint ventures and associates 245
219
61
55 Group’s share of profits/(losses) for the year (7) 23 11 2
Impairment Management has performed impairment tests and sensitivity analysis on its investments in Gain Land Limited, Trent Hypermarket Limited and Tesco Underwriting Limited. The carrying values of Trent Hypermarket Limited of £112m (2016: £96m) and Tesco Underwriting Limited of £71m (2016: £76m) are included within ‘Other joint ventures and associates’ as discussed above.
The recoverable values of these investments were estimated taking into account forecast cash flows, equity valuations of comparable entities and/or recent transactions for comparable businesses. No impairment was recognised in the period for these investments. Sensitivity tests for reasonably possible increases in the discount rates of one percentage point would not indicate impairment in any of the investment.
Future changes in estimated cash flows, discount rates, competitive landscape, retail market conditions and other factors may result in impairment losses or reversals of impairment in future periods.
Note 13 Cash and cash equivalents and short-term investments
Cash and cash equivalents
2017 £m
2016 £m
Cash at bank and in hand 3,498 2,334 Short-term deposits 323 748 3,821 3,082 Short-term investments
2017 £m
2016 £m
Money market funds 2,727 3,463 Included in cash and cash equivalents is an amount of £777m that has been set aside for completion of the merger with Booker Group Plc. This cash is not available to the Group and must be held in ring-fenced accounts until released jointly by the Group and its advisors on satisfaction of the completion terms of the merger as set out in the offering circular dated 27 January 2017. Until that time, or if the merger is not completed, it remains an asset of the Group. At the balance sheet date it was invested with a single financial institution at a floating rate of interest. Interest accrues and is payable to the Group.
Note 14 Commercial income Consistent with standard industry practice, the Group has agreements with suppliers whereby volume-related allowances, promotional and marketing allowances and various other fees and discounts are received in connection with the purchase of goods for resale from those suppliers. Most of the income received from suppliers relates to adjustments to a core cost price of a product, and as such is considered part of the purchase price for that product. Sometimes receipt of the income is conditional on the Group performing specified actions or satisfying certain performance conditions associated with the purchase of the product. These include achieving agreed purchases or sales volume targets and providing promotional or marketing materials and activities or promotional product positioning. Whilst there is no standard industry definition, these amounts receivable from suppliers in connection with the purchase of goods for resale are generally termed commercial income. Commercial income is recognised when earned by the Group, which occurs when all obligations conditional for earning income have been discharged, and the income can be measured reliably based on the terms of the contract. The income is recognised as a credit within cost of sales. Where the income earned relates to inventories which are held by the Group at period ends, the income is included within the cost of those inventories, and recognised in cost of sales upon sale of those inventories.
Amounts due relating to commercial income are recognised within trade and other receivables, except in cases where the Group currently has a legally enforceable right of set-off and intends to offset amounts due from suppliers against amounts owed to those suppliers, in which case only the net amount receivable or payable is recognised. Accrued commercial income is recognised within accrued income when commercial income earned has not been invoiced at the balance sheet date.
Management consider the best indicator of the estimation undertaken is by reference to commercial income balances not settled at the balance sheet date and has therefore provided additional disclosures of commercial income amounts reflected in the balance sheet.

TESCO PLC
43
Note 14 Commercial income continued
Below are the commercial income balances included within inventories and trade and other receivables, or netted against trade and other payables. Amounts received in advance of income being earned are included in accruals and deferred income.
2017 £m
2016 £m
Current assets Inventories (75) (75) Trade and other receivables
Trade/other receivables 215 201 Accrued income 150 100
Current liabilities Trade and other payables
Trade payables 213 305 Accruals and deferred income (22) (43)
The 27 February 2016 accruals and deferred income disclosure, previously disclosed in Note 13 of the 2015/16 Preliminary Results, included amounts that were unrelated to commercial income and has therefore been amended accordingly.
Note 15 Borrowings
Current Par value Maturity 2017
£m 2016
£m
Bank loans and overdrafts – – 912 845
Loans from joint ventures – – 6 6
4% RPI MTN £310m Sep 2016 - 316
5.875% MTN €1,039m Sep 2016 - 877
2.7% USD Bond $500m Jan 2017 - 361
5.4478% Term Loan £382m Jan 2017 - 396
LIBOR + 0.5% Term Loan £488m Oct 2017 484 -
1.250% MTN €500m Nov 2017 423 -
5.5% USD Bond $850m Nov 2017 709 -
5.5457% Secured Bond (a)(b) £366m Feb 2029 15 14
Finance leases – – 11 11
2,560 2,826 (a)-(b) Refer to the next page for footnotes.

TESCO PLC
44
Note 15 Borrowings continued Non-current
Par value Maturity 2017
£m 2016
£m
LIBOR +0.5% Term Loan £488m Oct 2017 - 478
1.250% MTN €500m Nov 2017 - 394
5.5% USD Bond $850m Nov 2017 - 666
5.2% Tesco Bank Retail Bond £125m Aug 2018 129 132
3.375% MTN €750m Nov 2018 641 595
LIBOR + 0.45% Tesco Bank Bond £150m May 2019 150 150
1.375% MTN €1,250m Jul 2019 1,063 990
5.5% MTN £350m Dec 2019 353 353
1% RPI Tesco Bank Retail Bond(c) £67m Dec 2019 67 66
LIBOR + 0.65% Tesco Bank Bond £300m Apr 2020 299 299
2.125% MTN €500m Nov 2020 423 394
5% Tesco Bank Retail Bond £200m Nov 2020 210 211
LIBOR + 0.65% Tesco Bank Bond £350m May 2021 349 349
6.125% MTN £900m Feb 2022 896 896
5% MTN £389m Mar 2023 411 411
2.5% MTN €750m Jul 2024 640 595
3.322% LPI MTN(d) £323m Nov 2025 326 320
5.5457% Secured Bond(a)(b) £366m Feb 2029 339 353
6.067% Secured Bond(a) £200m Feb 2029 190 189
LIBOR + 1.2% Secured Bond(a) £50m Feb 2029 31 30
6% MTN £200m Dec 2029 253 257
5.5% MTN £200m Jan 2033 255 259
1.982% RPI MTN(e) £268m Mar 2036 270 265
6.15% USD Bond $1,150m Nov 2037 1,063 1,035
4.875% MTN £173m Mar 2042 175 175
5.125% MTN €600m Apr 2047 522 486
5.2% MTN £279m Mar 2057 275 275
Finance leases – – 103 88
9,433 10,711 (a) The bonds are secured by a charge over the property, plant and equipment held within the Tesco Property Limited Partnership, a 100% owned
subsidiary of Tesco PLC. The carrying amounts of assets pledged as security for secured bonds is £788m (2016: £838m). (b) This is an amortising bond which matures in February 2029. £15m (2016: £14m) is the principal repayment due within the next 12 months. The
remainder is payable in quarterly instalments until maturity in February 2029. (c) The 1% RPI Tesco Bank Retail Bond is redeemable at par, indexed for increases in the RPI over the life of the bond. (d) The 3.322% Limited Price Inflation (LPI) MTN is redeemable at par, indexed for increases in the RPI over the life of the MTN. The maximum indexation of
the principal in any one year is 5%, with a minimum of 0%. (e) The 1.982% RPI MTN is redeemable at par, indexed for increases in the RPI over the life of the MTN. Borrowing facilities The Group has the following undrawn committed facilities available at 25 February 2017, in respect of which all conditions precedent had been met as at that date:
2017
£m 2016
£m
Expiring in less than one year - 100
Expiring between one and two years - 2,200
Expiring in more than two years 4,427 2,700
4,427 5,000
The current year undrawn committed facilities include £1.8bn (2016: £2.4bn) of bilateral facilities and a £2.6bn (2016: £2.6bn) syndicated revolving credit facility. During the year, £1.8bn equivalent of bilateral facilities were refinanced in a tenor of three years to a final maturity of August 2019.
All facilities incur commitment fees at market rates and would provide funding at floating rates.

TESCO PLC
45
Note 16 Provisions
Property provisions
£m
Restructuring provisions
£m
Other provisions
£m Total
£m
At 28 February 2015 941 325 100 1,366
Foreign currency translation (1) 4 - 3
Amount released in the year (4) (77) - (81)
Amount provided in the year 154 166 - 320
Amount utilised in the year (188) (335) (34) (557)
Transfer to disposal group classified as held for sale (74) - - (74)
Unwinding of discount 47 - - 47
At 27 February 2016 875 83 66 1,024
Foreign currency translation 12 4 - 16
Amount released in the year (38) (18) - (56)
Amount provided in the year 99 196 136 431
Amount utilised in the year (141) (162) (28) (331)
Transfer to disposal group classified as held for sale - (5) - (5)
Unwinding of discount 44 - - 44
At 25 February 2017 851 98 174 1,123
The balances are analysed as follows:
2017
£m 2016
£m
Current 438 360
Non-current 685 664
1,123 1,024
Property provisions Property provisions comprise onerous lease provisions, including leases on unprofitable stores and vacant properties, dilapidations provisions and asset retirement obligation provisions. These provisions are based on the least net cost of fulfilling or exiting the contract.
The calculation of the value in use of the leased properties to the Group is based on the same assumptions for growth rates and expected change in margins as those for Group owned properties, as discussed in detail in Note 11, discounted at the appropriate risk free rate. The cost of exiting lease contracts is estimated as the present value of expected surrender premiums or deficits from subletting at market rents, assuming that the Group can sublet properties at market rents, based on discounting at the appropriate risk adjusted rate. For some leases, termination of the lease at the break clause requires the Group to either purchase the property or buy out the equity ownership of the property at fair value. No value is attributed to the purchase conditions since they are at fair value. It is also assumed that the Group is indifferent to purchasing the properties.
Based on the factors set out above, the Group has recognised a net onerous property provision charge in the year of £61m (2016: £150m), largely relating to onerous lease contracts for fully impaired properties and other onerous contracts relating to properties. The Group has performed sensitivity analysis on the onerous lease provisions. A reasonably possible increase of one percentage point in the risk-free rate would reduce the provision by £43m. A decrease of one percentage point would increase the provision by £50m.
Of the net onerous property provision charge, a £76m charge (2016: £151m) has been recognised as an exceptional item; £56m in cost of sales and £20m in property-related items. This is made up of £56m classified as ‘Net impairment of non-current assets and onerous lease provisions’ and £20m classified as ‘Net restructuring and redundancy costs’.
Onerous lease provisions will be utilised over the relevant lease terms, predominantly within the next 25 years.
Restructuring provisions Of the £178m net charge (£196m charge, £18m release) recognised in the year, £135m relating to ongoing UK & ROI changes to the distribution network and to store colleague structures and working practices has been classified as an exceptional item. Refer to Note 4 for further details. The exceptional charges are expected to be utilised in the next financial year.
Other provisions On 10 April 2017, the Group announced that its subsidiary, Tesco Stores Limited, had obtained Court approval and entered into a Deferred Prosecution Agreement (DPA) with the UK Serious Fraud Office (SFO) regarding historic accounting practices. On 28 March 2017, the Group also announced that it had agreed with the UK Financial Conduct Authority (FCA) to a finding of market abuse in relation to its trading statement announced on 29 August 2014. In making its finding, the FCA has expressly stated that it is not suggesting that the Tesco PLC Board of Directors knew, or could reasonably be expected to have known, that the information contained in that trading statement was false or misleading. The Group has agreed with the FCA (under its statutory powers) to establish a compensation scheme which will compensate certain net purchasers of Tesco ordinary shares and listed bonds between 29 August 2014 and 19 September 2014 inclusive. The Group has taken a total exceptional charge of £235m in respect of the DPA of £129m, the expected costs of the compensation scheme of £85m, and related costs. This has been recorded in the financial statements in the year to 25 February 2017 as an adjusting post balance sheet event.

TESCO PLC
46
Note 16 Provisions continued
Of the £235m, £91m is included in other current provisions to cover the cost of the compensation scheme and related costs. The remaining £144m has been recorded within accruals. These charges have been classified as an exceptional item within administrative expenses.
Other current provisions also include provisions for Tesco Bank customer redress in respect of potential complaints arising from the historic sales of Payment Protection Insurance (PPI), and in respect of customer redress relating to instances where certain of the requirements of the Consumer Credit Act (CCA) for post contract documentation have not been fully complied with. In each instance, management have exercised judgement as to both the timescale for implementing the redress campaigns and the final scope of any amounts payable. A charge of £45m has been recognised in the year as an exceptional item in cost of sales. Refer to Note 4 for further details.
Note 17 Post-employment benefits
Pensions The Group operates a variety of post-employment benefit arrangements, covering both funded and unfunded defined benefit schemes and funded defined contribution schemes. The most significant of these are the funded defined benefit pension schemes for the Group’s employees in the UK (now closed to future accrual) and the Republic of Ireland, and the funded defined contribution pension scheme for employees in the UK. Of these schemes, the UK defined benefit deficit represents 98% of the Group deficit (2016: 94%).
The principal plan within the Group is the Tesco PLC Pension Scheme (the ‘Scheme’), which is a funded defined benefit pension scheme in the UK, the assets of which are held as a segregated fund and administered by the Trustee.
The Career Average section of the Scheme ('Pension Builder') was closed to new members and future accrual on 21 November 2015. The Final Salary section of the Scheme, which was closed to new entrants in 2001, was also closed to future accrual on 21 November 2015. As a result of this closure a one off past service credit of £538m and other associated costs of £(58)m were recognised as exceptional items in the prior year. Refer to Note 4.
A defined contribution scheme, Tesco Retirement Savings Plan, was opened on 22 November 2015 and is open to all Tesco employees in the UK.
At 31 March 2014, the deficit valuation arising from the triennial actuarial assessment was £2.8bn. A plan to pay £270m a year was agreed with the Trustee to fund the UK pension deficit and to meet the expenses of the scheme. The expenses of the scheme were £22m (2016: £27m).
The next triennial actuarial valuation is effective as at 31 March 2017 and work is already underway. The Trustee is aiming to conclude the valuation as soon as is reasonably possible.
UK Principal assumptions The major assumptions, on a weighted average basis, used by the actuaries to value the defined benefit obligation as at 25 February 2017 were as follows:
2017 %
2016 %
Discount rate 2.5 3.8
Price inflation 3.2 2.9
Rate of increase in deferred pensions* 2.2 1.9
Rate of increase in pensions in payment*
Benefits accrued before 1 June 2012 3.0 2.7
Benefits accrued after 1 June 2012 2.2 1.9 * In excess of any Guaranteed Minimum Pension ('GMP') element. The main financial assumption is the discount rate. If the discount rate increased by 0.1% or 1.0%, the UK defined benefit obligation would decrease by approximately £526m or £4,536m respectively. If this assumption decreased by 0.1% or 1.0%, the UK defined benefit obligation would increase by approximately £545m or £6,541m respectively.

TESCO PLC
47
Note 17 Post-employment benefits continued Summary of movements in Group deficit during the financial year
Changes in the Group deficit, including movements of discontinued operations up to classification as held for sale, are as follows:
2017
£m 2016
£m
Deficit in schemes at beginning of the year (3,175) (4,842)
Current service cost (35) (570)
Past service credit - 535
Net pension finance cost(a) (113) (155)
Contributions by employer(b) 28 433
Additional contributions by employer 248 223
Foreign currency translation (12) (8)
Remeasurements (3,567) 1,164
Transfer to disposal group classified as held for sale 5 45
Deficit in schemes at the end of the year (6,621) (3,175)
Deferred tax asset 1,122 563
Deficit in schemes at the end of the year, net of deferred tax (5,499) (2,612) (a) Includes £nil (2016: £nil) discontinued operations up to reclassification as held for sale. (b) Contributions by employer include £nil (2016: £125m) of salaries paid as pension contributions.

TESCO PLC
48
Note 18 Analysis of changes in net debt
At 27 February
2016 £m
Cash flow
£m
Fair value and foreign
exchange movements
£m
Interest (charge)/
income £m
Other non-cash
movements £m
Reclassifications of movements in
net debt of the disposal group
£m
At 25 February
2017 £m
Total Group
Cash and cash equivalents 3,082 881 (131) - - (11) 3,821
Short-term investments 3,463 (736) - - - - 2,727
Joint venture loans 149 (15) - - 3 - 137
Interest and other receivables
1 (25) - 25 - - 1
Bank and other borrowings (13,253) 1,851 (372) (21) 10 73 (11,712)
Interest payables (185) 522 (18) (479) (10) 3 (167)
Finance lease payables (99) 12 (6) - (21) - (114)
Net derivative financial instruments
698 (475) 655 15 - - 893
Net derivative interest 59 (16) - (15) - - 28
Net debt of the disposal group
- - - - - (65) (65)
Total Group (6,085) 1,999 128 (475) (18) - (4,451)
Tesco Bank
Cash and cash equivalents 554 235 - - - - 789
Joint ventures loans 34 - - - - - 34
Bank and other borrowings (1,441) - 1 - - - (1,440)
Interest payables (1) 4 - (3) - - -
Net derivative financial instruments
(121) - 16 - - - (105)
Tesco Bank (975) 239 17 (3) - - (722)
Retail
Cash and cash equivalents 2,528 646 (131) - - (11) 3,032
Short-term investments 3,463 (736) - - - - 2,727
Joint ventures loans 115 (15) - - 3 - 103
Interest and other receivables
1 (25) - 25 - - 1
Bank and other borrowings (11,812) 1,851 (373) (21) 10 73 (10,272)
Interest payables (184) 518 (18) (476) (10) 3 (167)
Finance lease payables (99) 12 (6) - (21) - (114)
Net derivative financial instruments
819 (475) 639 15 - - 998
Net derivative interest 59 (16) - (15) - - 28
Net debt of the disposal group
- - - - - (65) (65)
Net debt (5,110) 1,760 111 (472) (18) - (3,729)
Net debt excludes the net debt of Tesco Bank but includes that of discontinued operations. Balances and movements in respect of the total Group and Tesco Bank are presented to allow reconciliation between the Group balance sheet and the Group cash flow statement.

TESCO PLC
49
Note 18 Analysis of changes in net debt continued Reconciliation of net cash flow to movement in Net debt
2017
£m 2016
£m Net increase/(decrease) in cash and cash equivalents 881 907
Elimination of Tesco Bank movement in cash and cash equivalents (235) 62
Retail cash movement in other Net debt items
Net increase/(decrease) in short-term investments (736) 2,894
Net increase/(decrease) in joint venture loans (15) 1
Net (increase)/decrease in borrowings and lease financing 1,863 1,059
Net cash flows from derivative financial instruments (475) (154)
Net interest paid on components of net debt 477 419
Change in Net debt resulting from cash flow 1,760 5,188
Retail net interest charge on components of net debt (472) (447)
Retail fair value and foreign exchange movements 111 113
Debt disposed on disposal of Korean operations - 97
Debt acquired on business combinations - (1,545)
Retail other non-cash movements (18) (35)
(Increase)/decrease in Net debt for the year 1,381 3,371
Opening Net debt (5,110) (8,481)
Closing Net debt (3,729) (5,110)
Note 19 Business combinations and disposals Business combinations The Group has paid £25m of deferred consideration in the year, related to its obligations under the purchase agreements for the acquisitions of Sociomantic Labs and Bzz Agent Limited from prior years. Disposals During the year, the Group sold its interests in Dobbies Garden Centres, Giraffe and Harris + Hoole and closed its Nutricentre business, further enhancing the focus of the UK retail business on its core strengths. The Group received £213m in cash, net of cash disposed, and recognised £1m in deferred consideration. Of the net cash received, £192m related to the sale of Dobbies Garden Centres. In total, the Group disposed of net assets of £243m and incurred costs to sell of £15m, £8m of which had been paid as at the year end. In addition, the Group disposed of a 6.9% interest (on a fully diluted basis) in Lazada Group S.A. (Lazada) for net cash consideration of US$115m (£81m), retaining an 8.8% shareholding. The total loss on these transactions amounted to £7m, which is included within operating profit before exceptional items. On 10 June 2016, the Group announced the proposed sale of its 95.5% controlling interest in its Turkish operations to Migros. The assets and liabilities related to the Turkish operations have been classified as a disposal group held for sale during the year and are presented within discontinued operations. Local regulatory approvals were obtained on 9 February 2017 and the sale completed on 1 March 2017. Refer to Note 7 and 22 for further information.
Note 20 Contingent liabilities There are a number of contingent liabilities that arise in the normal course of business which if realised are not expected to result in a material liability to the Group. The Group recognises provisions for liabilities when it is more likely than not that a settlement will be required and the value of such a payment can be reliably estimated.
As previously reported, law firms in the UK have announced the intention of forming claimant groups to commence litigation against the Group for matters arising out of or in connection with its overstatement of expected profits in 2014, and purport to have secured third party funding for such litigation. In this regard, the Group has received two High Court claims against Tesco PLC. The first was received on 31 October 2016 from a group of 112 investors and the second was received on 5 December 2016 from an investment company and a trust company. The merit, likely outcome and potential impact on the Group of any such litigation that either has been or might potentially be brought against the Group is subject to a number of significant uncertainties and therefore, the Group cannot make any assessment of the likely outcome or quantum of any such litigation as at the date of this disclosure.

TESCO PLC
50
Note 20 Contingent liabilities continued Prior to the disposal of its Korean operations (Homeplus), Tesco PLC provided guarantees in respect of 13 Homeplus lease agreements in Korea in the event of termination of the relevant lease agreement by the landlord due to Homeplus’ default. Entities controlled by MBK and CPPIB, as the purchasers of Homeplus, undertook to procure Tesco PLC’s release from these guarantees following the disposal of Homeplus, which currently remains outstanding. This liability decreases over time with all relevant leases expiring in the period between 2026 and 2033. Tesco PLC has the benefit of an indemnity from the purchasers of Homeplus for any claims made under such guarantees. The maximum potential liability under the lease guarantees as at 25 February 2017 is KRW575bn (£407m).
Note 21 Lease commitments Operating lease commitments – Group as lessee Future minimum lease commitments under non-cancellable operating leases are as follows:
2017
£m 2016
£m Within one year 1,199 1,296
Greater than one year but less than five years 3,767 3,918
After five years 7,395 7,831
Total minimum lease commitments 12,361 13,045
Future minimum lease commitments under non-cancellable operating leases after five years are analysed further as follows:
2017
£m 2016
£m Greater than five years but less than ten years 3,161 3,272
Greater than ten years but less than fifteen years 2,225 2,303
After fifteen years 2,009 2,256
Total minimum lease commitments – after five years 7,395 7,831
The Group has used operating lease commitments discounted at 7% (2016: 7%) of £7,440m (2016: £7,814m) in its calculation of total indebtedness. Total operating lease commitments in Turkey of £27m were included in 2016. The discounted operating lease commitment included in total indebtedness is not an appropriate proxy for the expected impact of recognising a lease liability under IFRS 16 ‘Leases’, primarily due to differences in the discount rates used and the treatment of additional lease rentals arising from contracts that contain extend or buy conditions, amongst other differences.
Operating lease commitments represent rentals payable by the Group for certain of its retail, distribution and office properties and other assets such as motor vehicles. The leases have varying terms, purchase options, escalation clauses and renewal rights. Purchase options and renewal rights, where they occur, are at market value. Escalation clauses are in line with market practices and include inflation linked, fixed rates, resets to market rents and hybrids of these.
The Group has lease-break options on certain sale and leaseback transactions. These options are exercisable if the Group exercises an existing option to buy back, at market value and at a specified date, either the leased asset or the equity of the other joint venture partner. No commitment has been included in respect of the buy-back option as the option is at the Group’s discretion. The Group is not obliged to pay lease rentals after that date, therefore minimum lease commitments exclude those falling after the buy-back date. The current market value of these properties is £2.9bn (2016: £3.2bn) and the total undiscounted lease rentals, if they were to be incurred following the option exercise date, would be £2.6bn (2016: £2.6bn) using current rent values, as shown below.
The additional lease rentals if incurred following the option exercise date would be as follows:
2017
£m 2016
£m Within one year 23 45
Greater than one year but less than five years 170 72
Greater than five years but less than ten years 709 686
Greater than ten years but less than fifteen years 670 718
After fifteen years 1,019 1,115
Total undiscounted contingent additional lease rentals 2,591 2,636
Total discounted contingent additional lease rentals at 7% 1,107 1,111
The lease break options are exercisable between 2017 and 2023. Operating lease commitments with joint ventures and associates In prior years, the Group entered into several joint ventures and associates, and sold and leased back properties to and from these joint ventures and associates. The terms of these sale and leasebacks varied. However, common factors included: the sale of the properties to the joint venture or associate at market value; options within the lease for the Group to repurchase the properties at market value; market rent reviews; and 20 to 30 full-year lease terms. The Group reviews the substance as well as the form of the arrangements when determining the classification of leases as operating or finance. All of the leases under these arrangements are operating leases.

TESCO PLC
51
Note 22 Events after the reporting period
On 1 March 2017, the Group announced the completion of the disposal of its 95.5% controlling stake in the Kipa business in Turkey following the receipt of all local regulatory approvals.
On 10 April 2017, the Group announced that its subsidiary, Tesco Stores Limited, had obtained Court approval and entered into a Deferred Prosecution Agreement (DPA) with the UK Serious Fraud Office (SFO) regarding historic accounting practices. On 28 March 2017, the Group also announced that it had agreed with the UK Financial Conduct Authority (FCA) to a finding of market abuse in relation to its trading statement announced on 29 August 2014. In making its finding, the FCA has expressly stated that it is not suggesting that the Tesco PLC Board of Directors knew, or could reasonably be expected to have known, that the information contained in that trading statement was false or misleading. The Group has agreed with the FCA (under its statutory powers) to establish a compensation scheme which will compensate certain net purchasers of Tesco ordinary shares and listed bonds between 29 August 2014 and 19 September 2014 inclusive. The Group has taken a total exceptional charge of £235m in respect of the DPA of £129m, the expected costs of the compensation scheme of £85m, and related costs. This has been recorded in the financial statements in the year to 25 February 2017 as an adjusting post balance sheet event.
On 6 April 2017, the Group unwound its joint venture with British Land Co PLC (British Land). The Group obtained sole control of BLT Properties Limited through the acquisition of British Land’s 50% interest in the joint venture. The acquisition increased the Group’s owned property portfolio by £0.2bn, comprising seven stores. British Land obtained sole control of one store and one retail centre, previously held in the joint venture.
Note 23 Proposed Booker Group transaction
On 27 January 2017, the Group announced that it had reached an agreement on the terms of a recommended share and cash merger with Booker Group Plc. The transaction is subject to shareholder and regulatory approvals.

TESCO PLC
52
Glossary – Alternative performance measures
Introduction In the reporting of financial information, the Directors have adopted various Alternative Performance Measures (APMs), previously termed ‘Non-GAAP measures’ of historical or future financial performance, position or cash flows other than those defined or specified under International Financial Reporting Standards (IFRS).
These measures are not defined by IFRS and therefore may not be directly comparable with other companies’ APMs, including those in the Group’s industry.
APMs should be considered in addition to, and are not intended to be a substitute for, or superior to, IFRS measurements.
Purpose The Directors believe that these APMs assist in providing additional useful information on the underlying trends, performance and position of the Group.
APMs are also used to enhance the comparability of information between reporting periods and geographical units (such as like-for-like sales), by adjusting for non-recurring or uncontrollable factors which affect IFRS measures, to aid the user in understanding the Group’s performance.
Consequently, APMs are used by the Directors and management for performance analysis, planning, reporting and incentive setting purposes and have remained consistent with prior year.
The key APMs that the Group has focused on this year are as follows:
• Group sales (previously termed Revenue exc. fuel): This is the headline measure of revenue for the Group. It excludes the impact of sales made at petrol filling stations due to the significant volatility of fuel prices. This volatility is outside the control of management and can mask underlying changes in performance.
• Like-for-like sales: This is a widely used indicator of a retailer’s current trading performance. It is a measure of growth in Group online sales and sales from stores that have been open for at least a year (but excludes prior year sales of stores closed during the year) at constant foreign exchange rates.
• Operating profit before exceptional items: This is the headline measure of the Group’s performance, and is based on operating profit before the impact of exceptional items. Exceptional items relate to certain costs or incomes that derive from events or transactions that fall within the normal activities of the Group but which, individually or, if of a similar type, in aggregate, are excluded by virtue of their size and nature in order to reflect management’s view of the performance of the Group.
• Retail operating cash flow: This is the operating cash flow of continuing operations, excluding the effects of Tesco Bank’s cash flows.
• Net debt: This excludes the net debt of Tesco Bank but includes that of the discontinued operations to reflect the net debt obligations of the Retail business.
• Diluted earnings per share from continuing operations before exceptional items and net pension finance costs: This relates to profit after tax before exceptional items from continuing operations, and net pension finance costs attributable to owners of the parent divided by the weighted average number of ordinary shares in issue during the financial period adjusted for the effects of potentially dilutive options.
Some of our IFRS measures are translated at constant exchange rates. Constant exchange rates are the average actual periodic exchange rates for the previous financial year and are used to eliminate the effects of exchange rate fluctuations in assessing performance. Actual exchange rates are the average actual periodic exchange rates for that financial year.
APM Closest equivalent
IFRS measure Adjustments to reconcile to IFRS measure
Note reference for reconciliation
Definition and purpose
Income statement Revenue measures
Group sales Revenue • Exclude sales made at petrol filling stations
Note 2 • Excludes the impact of sales made at petrol filling stations to demonstrate the Group’s underlying performance in the core retail and financial services businesses by removing the volatilities associated with the movement in fuel prices. This is a key management incentive metric.
Growth in sales No direct equivalent • Consistent with accounting policy Not applicable • Growth in sales is a ratio that measures year on-year movement in Group sales for continuing operations for 52 weeks. It shows the annual rate of increase in the Group's sales and is considered a good indicator of how rapidly the Group's core business is growing.
Like-for-like No direct equivalent • Consistent with accounting policy Not applicable • Like-for-like is a measure of growth in Group online sales and sales from stores that have been open for at least a year (but excludes prior year sales of stores closed during the year) at constant foreign exchange rates. It is a widely used indicator of a retailer’s current trading performance and is important when comparing growth between retailers that have different profiles of expansion, disposals and closures.

TESCO PLC
53
Glossary – Alternative performance measures continued APM Closest equivalent
IFRS measure Adjustments to reconcile to IFRS measure
Note reference for reconciliation
Definition and purpose
Profit measures
Operating profit before exceptional items
Operating profit* • Exceptional items Note 2 • Operating profit before exceptional items is the headline measure of the Group’s performance. It is based on operating profit before the impact of certain costs or incomes that derive from events or transactions that fall within the normal activities of the Group, but which are excluded by virtue of their size and nature in order to reflect management’s view of the performance of the Group. This is a key management incentive metric.
Operating margin No direct equivalent • Consistent with accounting policy Not applicable • Operating margin is calculated as operating profit before exceptional items divided by revenue. Progression in operating margin is an important indicator of the Group’s operating efficiency.
Profit before tax before exceptional items and net pension finance costs
Profit before tax • Exceptional items • Net pension finance costs
Note 9 • This measure excludes exceptional items and the net finance costs of the defined benefit pension deficit as the costs are impacted by corporate bond yields, which can fluctuate significantly and are reset each year based on often volatile external market factors.
Profits/(losses) arising on property-related items
No direct equivalent • Consistent with accounting policy Not applicable • Profits/(losses) arising on property-related items relates to the Group’s property activities including; gains and losses on disposal of property assets, development property built for resale and property joint ventures; costs resulting from changes in the Group’s store portfolio and distribution network, including pre-opening and post-closure costs; and income/(charges) associated with impairment of non-trading property and related onerous contracts.
• These items are disclosed separately to clearly identify the impact of these items versus the other operating expenses related to the core retail and financial services operations of the business. They are often one-time in nature and can have a disproportionate impact on profit between reporting periods.
Total finance costs before exceptional items and net pension finance costs
Finance costs • Exceptional items • Net pension finance costs
Note 5 • Total finance costs before exceptional items and net pension finance costs is the net finance costs adjusted for non-recurring one off items, and net pension finance costs, as the costs are impacted by bond yields, which can fluctuate significantly and are reset each year.
Diluted earnings per share from continuing operations before exceptional items
Diluted earnings per share
• Exceptional items • Discontinued operations
Note 9 • This relates to profit after tax before exceptional items from continuing operations, attributable to owners of the parent divided by the weighted average number of ordinary shares in issue during the financial period adjusted for the effects of potentially dilutive options.
• It excludes the impact of certain costs or income that derive from events or transactions that fall within the normal activities of the Group, but which are excluded by virtue of their size and nature in order to reflect management’s view of the performance of the Group.
Diluted earnings per share from continuing operations before exceptional items and net pension finance costs
Diluted earnings per share
• Exceptional items • Net pension finance costs • Discontinued operations
Note 9 • This relates to profit after tax before exceptional items from continuing operations, and net pension finance costs attributable to owners of the parent divided by the weighted average number of ordinary shares in issue during the financial period adjusted for the effects of potentially dilutive options.
• It excludes the impact of certain costs or income that fall within the normal activities of the Group, but which are excluded by virtue of their size and nature in order to reflect management’s view of the performance of the Group. It also excludes potentially volatile net pension finance costs.
Tax measures
Effective tax rate before exceptional items
Effective tax rate • Exceptional items and their tax impact
Note 6 • Effective tax rate before exceptional items is calculated as total income tax credit/(charge) excluding the tax impact of exceptional items divided by profit before tax before exceptional items. This provides an indication of the ongoing tax rate across the Group.

TESCO PLC
54
Glossary – Alternative performance measures continued APM Closest equivalent
IFRS measure Adjustments to reconcile to IFRS measure
Note reference for reconciliation
Definition and purpose
Effective tax rate before exceptional items and net pension finance costs
Effective tax rate • Exceptional items and their tax impact
• Net pension finance costs and their tax impact
Note 6 • Effective tax rate before exceptional items and net pension finance costs is calculated as total income tax credit/(charge) excluding the tax impact of exceptional items and net pension finance costs divided by the profit before tax before exceptional items and net pension finance costs.
Balance sheet measures
Net debt Borrowings less cash and related hedges
• Net debt from Tesco Bank Note 18 • Net debt excludes the net debt of Tesco Bank but includes that of the discontinued operations to reflect the net debt obligations of the Retail business. Net debt comprises bank and other borrowings, finance lease payables, net derivative financial instruments, joint venture loans and other receivables and net interest receivables/ payables, offset by cash and cash equivalents and short-term investments. It is a useful measure of the progress in generating cash and strengthening of our balance sheet position and is a measure widely used by credit rating agencies.
Total indebtedness Borrowings less cash and related hedges
• Net debt from Tesco Bank • Present value of future minimum
lease payments under non-cancellable operating leases.
• IAS19 deficit in the pension schemes
Page 8 of the Preliminary Results 2016/17
• Total indebtedness is the net debt plus the IAS19 deficit in the pension schemes (net of associated deferred tax) plus the present value of future minimum lease payments under non-cancellable operating leases to provide an overall view of the Group’s obligations. It is an important measure of the long term obligations of the Group and is a measure widely used by credit rating agencies.
Cash flow measures
Retail operating cash flow
Cash generated from operating activities
• Tesco Bank operating cash flow • Discontinued operations
Note 2 • Retail operating cash flow is the cash generated from operations of continuing operations, excluding the effects of Tesco Bank cash flows. It is a measure of the cash generation and working capital efficiency by the retail business, recognising that Tesco Bank is run and regulated independently from the retail operations, and a key measure to demonstrate the recovery of the retail operations. This is a key management incentive metric.
Free cash flow Cash generated from operating activities
• Purchase of property, plant and equipment, investment property and non-current assets classified as held for sale
• Purchase of intangible assets
Note 2 • Free cash flow is net cash generated from/(used in) operating activities less capital expenditure on property, plant and equipment, investment property and intangible assets. It is a measure of cash generation, working capital efficiency and capital discipline of the business.
* Operating profit is not defined per IFRS, however is a generally accepted profit measure.

TESCO PLC
55
Glossary – Other Capital expenditure (Capex) The additions to property, plant and equipment, investment property and intangible assets (excluding assets acquired under business combinations).
Capital employed Net assets plus net debt plus dividend creditor less net assets of the disposal groups and non-current assets classified as held for sale.
Enterprise Value This is calculated as market capitalisation plus net debt.
FTE FTE refers to full-time equivalents.
LPI LPI refers to Limited Price Inflation.
Market capitalisation The total value of all Tesco shares calculated as total number of shares multiplied by closing share price at year-end.
MTN MTN refers to Medium Term Note.
Net Promoter Score (NPS) This is a loyalty measure based on a single question requiring a score between 0-10. The NPS is calculated by subtracting the percentage of detractors (scoring 0-6) from the percentage of promoters (scoring 9-10). This generates a figure between -100 and 100 which is the NPS.
Return on capital employed (ROCE) Return divided by the average of opening and closing capital employed.
Return Profit before exceptional items and interest, after tax (applied at effective rate of tax).
RPI RPI refers to Retail Price Index.
Total shareholder return The notional annualised return from a share, measured as the percentage change in the share price, plus the dividends paid with the gross dividends reinvested in Tesco shares. This is measured over both a one and five year period.

TESCO PLC
56
Independent auditor’s report to the members of Tesco PLC on the Preliminary Announcement of Tesco PLC We confirm that we have issued an unqualified opinion on the full financial statements of Tesco PLC.
Our audit report on the Group Financial Statements sets out the following risks of material misstatement which had the greatest effect on our audit strategy; the allocation of resources in the audit; and directing the efforts of the engagement team, together with how our audit responded to those risks:
Store impairment review Risk description The Group held £18,108m (2015/16: £17,900m) of property, plant and equipment at 25 February 2017. Under IFRS, the Group is required to complete an impairment review of its store portfolio where there are indicators of impairment or impairment reversal. There continues to be judgement required in identifying indicators of impairment and determining the fair value of the Group’s store portfolio. Additionally, there is judgement is relation to triggering the reversals of impairments recognised in previous periods. In light of the continued competitive environment in which the Group operates and changes in the macro environment, there is a risk that the carrying value of stores and related fixed assets may be higher than the recoverable amount. Where a review for impairment, or reversal of impairment, is conducted, the recoverable amount is determined based on the higher of ‘value in use’ and ‘fair value less costs of disposal’: • value in use is calculated from cash flow projections and relies upon the Directors’ assumptions and estimates of future trading
performance, longer-term growth rates and discount rates utilised; and • fair value less costs of disposal is determined by reference to a sample of valuations completed by independent valuation specialists
where applicable. As a result of the Group’s impairment review completed during the year, an impairment release of £6m (2015/16: charge of £18m) was recognised. How the scope of our audit responded to the risk Our audit procedures included assessing the design and implementation of key controls around the impairment review processes, assessing the appropriateness of the methodology applied by the Directors in calculating the impairment charges and reversals, and the judgements applied in determining the cash generating units (“CGUs”) of the business, which the Group has determined as being individual stores and, in the UK, the general merchandising online business. As part of our procedures we have used data analytics to assist us in determining the completeness of the impairment indicator assessment. In relation to the completeness of the Group’s impairment review process, we have assessed the completeness of the Group’s impairment charges and impairment reversals with reference to CGU performance. In relation to the Group’s ‘value in use’ valuations, we have assessed the review completed by the Group by: • assessing the methodology applied in determining the value in use compared with the requirements of IAS 36 Impairment of Assets
and checking the integrity of the impairment model utilised by the Group; • challenging the key assumptions utilised in the cash flow forecasts with reference to historical trading performance, market
expectations and our understanding of the Group’s strategic initiatives; • assessing the long-term growth rates and discount rates applied to the impairment review for each country, comparing the rates
utilised to third party evidence and in relation to the discount rate, our independently estimated discount rates; and • completing sensitivity analysis in relation to key assumptions to consider the extent of change in those assumptions that either
individually or collectively would be required for the assets to be impaired, in particular property fair values, long term growth rates and discount rates applied.
In relation to the Group’s ‘fair value less costs of disposal’, we have challenged the assumptions used by the Group in determining the fair market value of the assets, including those completed by external valuers, using internal property valuation specialists and assessing whether appropriate valuation methodologies have been applied. Additionally, we assess the adequacy of the store impairment related disclosures. Key observations Whilst we note actions are required by the Group to achieve these forecasts over the medium term, we concluded that the assumptions in the impairment models were within an acceptable range, and that the overall level of net reversal of impairment was reasonable. We also agree that the disclosure of the net impairment as an exceptional item is in accordance with the Group’s policy on exceptional items.

TESCO PLC
57
Independent auditor’s report to the members of Tesco PLC on the Preliminary Announcement of Tesco PLC continued
Recognition of commercial income Risk description The Group has agreements with suppliers whereby volume-related allowances, promotional and marketing allowances and various other fees and discounts are received in connection with the purchase of goods for resale from those suppliers. As such, the Group recognises a reduction in cost of sales as a result of amounts receivable from suppliers. In accordance with IFRS, commercial income should only be recognised as income within the income statement when the performance conditions associated with it have been met, for example where the marketing campaign has been held. The variety and number of the buying arrangements with suppliers can make it complex to determine the performance conditions associated with the income, giving rise to a requirement for management judgement and scope for error in accounting for such income. As such we have identified this as a key risk. How the scope of our audit responded to the risk We obtained a detailed understanding and evaluated the design and implementation of controls that the Group has established in relation to commercial income. In addition, our substantive audit procedures across the Group’s retail operations included a combination of the following: • we tested whether amounts recognised were accurate and recorded in the correct period based on the contractual performance
obligations by agreeing a sample of individual supplier agreements; • commercial income balances included within inventories and trade and other receivables, or netted against trade and other payables
have been tested via balance sheet reconciliation procedures; • we circularised a sample of suppliers to test whether the arrangements recorded were complete and held discussions with a sample
of buyers to further understand the buying processes where required. Where responses from suppliers were not received, we completed alternative procedures such as agreement to underlying contractual arrangements;
• we used data analytics to profile commercial income, identifying deals which exhibited characteristics of audit interest upon which we completed detailed testing;
• we reviewed the steps taken by the Group to address the recommendations made by the Groceries Code Adjudicator (“GCA”) and reviewed the Group’s ongoing compliance with the Groceries Supplier Code of Practice (“GSCOP”). Additionally, we reviewed the reporting and correspondence to the supplier hotline in order to help identify any areas where further investigation was required; and
• we also considered the adequacy of the commercial income related disclosure within the Group’s financial statements. Key observations The results of our testing were satisfactory. We consider the disclosure given around supplier rebates to provide an appropriate understanding of the types of rebate income received and impact on the Group’s balance sheet as at 25 February 2017.
Pension obligation valuation Risk description The Group has a defined benefit pension plan in the UK. At 25 February 2017, the Group recorded a net retirement obligation before deferred tax of £6,621m (2015/16: £3,175m), comprising scheme assets of £13,196m (2015/16: £10,302m) and scheme liabilities of £19,817m (2015/16: £13,477m). The pension valuation is dependent on market conditions and assumptions made. The risk specifically relates to the following key assumptions: discount rate, inflation expectations and life expectancy assumptions. The setting of these assumptions is complex and requires the exercise of significant management judgement with the support of third party actuaries. How the scope of our audit responded to the risk We obtained a detailed understanding and evaluated the design and implementation of controls that the Group has established in relation to the pension obligation valuation process. In testing the pension valuation, we have utilised internal pension actuarial specialists to review the key actuarial assumptions used, both financial and demographic, and considered the methodology utilised to derive these assumptions. Furthermore, we have benchmarked and performed a sensitivity analysis on the key assumptions determined by the Directors. Key observations We are satisfied that the methodology and assumptions applied in relation to determining the pension valuation are within an acceptable range.

TESCO PLC
58
Independent auditor’s report to the members of Tesco PLC on the Preliminary Announcement of Tesco PLC continued
Contingent liabilities Risk description The Group has been under investigation by the Serious Fraud Office (SFO) in the UK following the commercial income misstatements identified in 2014/15. On 10 April 2017, the Group announced that its subsidiary, Tesco Stores Limited, had reached a Deferred Prosecution Agreement (DPA) with the SFO. In addition, Tesco PLC and Tesco Stores Limited accepted a finding of market abuse from the FCA, arising from the same circumstances and as a result will implement a compensation scheme. This brings greater certainty to the Group’s exposure and a £235m liability has been recognised accordingly. Additionally, in 2016/17 UK shareholder actions were initiated against the Group linked to the commercial income misstatements identified in 2014/15 which may result in legal exposures. Separately, the Group has other ongoing legal matters relating to previous corporate transactions which require management judgement to be applied in order to determine the likely outcome. As a result, judgement is required in assessing the nature of these exposures and their accounting and disclosure requirements. How the scope of our audit responded to the risk In assessing the potential exposures to the Group, we have completed a range of procedures including : • assessing the design and implementation of controls in relation to the monitoring of known exposures; • reading Board and other meeting minutes to identify areas subject to Group consideration; • meeting with the Group’s internal legal advisors in understanding ongoing and potential legal matters impacting the Group; • reviewing third party correspondence and reports; and • reviewing the proposed accounting and disclosure of actual and potential legal liabilities, drawing on third party assessment of open
matters. Key observations We concur that the liability recognised by management in respect of the DPA and the FCA compensation scheme and the disclosures in relation to the ongoing UK shareholder actions are appropriate.
In relation to other ongoing legal matters in respect of previous corporate transactions, we are satisfied no specific disclosure is required. Inventory valuation Risk description The Group carries inventory at the lower of cost and net realisable value. As at 25 February 2017, the Group held inventories of £2,301m (2015/16: £2,430m). The Group provides for obsolescence based on forecast inventory usage. This methodology relies upon assumptions made in determining appropriate provisioning percentages to estimates of future sales. How the scope of our audit responded to the risk We obtained a detailed understanding and evaluated the design and implementation of controls that the Group has established in relation to inventory valuation. We obtained assurance over the appropriateness of management’s assumptions applied in calculating the value of inventory provisions by: • critically assessing the Group’s inventory provisioning policy, with specific consideration given to aged inventory (especially for non-
food and general merchandising products) as well as stock turn calculations, including the impact of seasonality; • verifying the value of a sample of inventory to confirm whether it is held at the lower of cost and net realisable value, through
comparison to vendor invoices and sales prices; • within the UK business, using data analytics to identify unusual inventory usage characteristics, completing assumption tolerance
testing and recalculating the provision in totality based on the Group’s policy; and • reviewing historical accuracy of inventory provisioning with reference to inventory write-offs during the year in relation to stock loss
or other inventory adjustments. Key observations We concur that the total level of provision is within an acceptable range.

TESCO PLC
59
Independent auditor’s report to the members of Tesco PLC on the Preliminary Announcement of Tesco PLC continued
Management override of controls Risk description There are a number of areas within the Group financial statements which comprise accounting estimates by management and accordingly there is a risk that the Group’s results are influenced through management bias in determining such estimates. Additionally, the Group’s processes continue to be complex and reliant on legacy IT systems which lead to an increased risk of management override of controls. Specifically this risk lies in those areas with high levels of judgement such as commercial income, value-in-use calculations within the impairment reviews, inventory accounting and provisioning. Management also exercises judgement in the presentation of the Group’s income statement and the quality of the Group’s earnings. A risk exists that invalid journal entries are recorded to influence the results and/or the financial position as desired through the override of controls implemented to prevent the recording of inappropriate journals. How the scope of our audit responded to the risk In order to address this risk, in addition to the procedures set out in the commercial income, impairment and inventory risks above, we have completed audit procedures including: • assessing the design and implementation of controls which address the risk of management override, such as the ‘entity level’
controls which underpin the overall control environment for the Group; • auditing key areas of management estimate and judgement, including consideration of exceptional items disclosed by the Group and
the existence of any further potential exceptional items included within the Group’s underlying profit measures; • using data analytics, testing journal entries for fraud characteristics by testing the completeness of the journal population reviewed
and risk profiling the population to focus our work on journals of interest; • assessing transactions completed outside of the normal course of business; and • obtaining an understanding of the work of internal audit so as to assist us in directing our audit effort and obtaining greater
understanding of the controls in place across the Group. Key observations We have no matters to highlight in these areas. However, we note that consistent with other businesses of a similar scale to the Group, there are non-recurring income and expense items included within profit before exceptional items which do not meet the Group’s definition of exceptional items and which largely offset. We concur that these have been appropriately included within profit before exceptional items. Tesco Bank payment fraud Risk description In November 2016, Tesco Bank’s debit cards were the subject of an online fraudulent attack. The Group continues to work closely with the authorities and regulators on this incident. There is a risk that the Group has not identified and accounted for any liabilities which may arise from the incident. How the scope of our audit responded to the risk In assessing the potential exposures to the Bank, we have completed a range of procedures including: • understanding the cause of the issue, reviewing the incident reports prepared by external consultants and understanding
management’s response to findings; • understanding the status of discussions with authorities and regulators; • assessing the fraud losses and the treatment of associated recoveries from merchants; and • assessing whether the Group has appropriately identified and accounted for any other liabilities related to the payment fraud. Key observations We are satisfied that the Group has appropriately accounted for liabilities associated with the incident.

TESCO PLC
60
Independent auditor’s report to the members of Tesco PLC on the Preliminary Announcement of Tesco PLC continued
Retail technology environment, including IT security Risk description The Group’s retail operations utilise a range of information systems where in 2015/16 we identified deficiencies in certain IT controls. These deficiencies could have an adverse impact on the Group’s controls and financial reporting systems. The Group is undergoing the replacement of a number of the Group’s key systems and changes to key elements of the Group’s IT infrastructure. How the scope of our audit responded to the risk We have understood the Group’s replacement programme and the planned enhancements to the retail technology environment, including IT security. During the year we have assessed the design and implementation of the Group’s controls over the information systems that are important to financial reporting, including the changes made as part of the Group’s replacement programme. Where we noted deficiencies which affected applications and databases within the scope of our audit, we extended the scope of our substantive audit procedures. Key observations Although we note progress has been made during the year in enhancing the Group’s controls over the information systems described above, given the complexity of the underlying systems the remediation process is not yet complete and therefore weaknesses remain in the control environment. The historical weaknesses we noted last year in relation to user access and change management controls linked to the Group’s financial reporting systems are in the process of being remediated. These matters were addressed in the context of our audit of the financial statements as a whole, and in forming our opinion thereon, and we did not provide a separate opinion on these matters. Our liability for this report, and for our full audit report on the financial statements is to the Company's members as a body, in accordance with Chapter 3 of Part 16 of the Companies Act 2006. Our audit work has been undertaken so that we might state to the Company's members those matters we are required to state to them in an auditor's report and for no other purpose. To the fullest extent permitted by law, we do not accept or assume responsibility to anyone other than the Company and the Company's members as a body, for our audit work, for our audit report or this report, or for the opinions we have formed.
Deloitte LLP
Chartered Accountants and Statutory Auditor

TESCO PLC
61
Appendix 1 Total sales performance at actual rates (exc. VAT, exc. fuel)
1Q
2016/17 2Q
2016/17 3Q
2016/17 4Q
2016/17 1H
2016/17 2H
2016/17 FY
2016/17 UK & ROI 0.7% 1.7% 2.3% 0.7% 1.2% 1.5% 1.4% UK 0.3% 1.0% 1.4% 0.2% 0.7% 0.8% 0.7%
ROI 8.7% 15.3% 19.7% 11.9% 11.9% 15.6% 13.8%
International 5.6% 16.5% 23.2% 16.1% 10.9% 19.5% 15.2%
Europe 8.2% 15.1% 19.6% 12.3% 11.6% 15.7% 13.7%
Asia 2.8% 18.2% 27.7% 20.9% 10.1% 24.1% 17.1%
Tesco Bank 3.5% 7.2% 6.3% 6.9% 5.3% 6.6% 6.0% Group 1.8% 4.7% 6.5% 4.1% 3.3% 5.2% 4.3%
Appendix 2 Total sales performance at constant rates (exc. VAT, exc. fuel)*
1Q
2016/17 2Q
2016/17 3Q
2016/17 4Q
2016/17 1H
2016/17 2H
2016/17 FY
2016/17 UK & ROI 0.3% 1.0% 1.4% 0.1% 0.6% 0.6% 0.6%
UK 0.3% 1.0% 1.4% 0.2% 0.7% 0.7% 0.7%
ROI 0.2% (0.3)% 0.0% (1.7)% (0.1)% (0.9)% (0.5)%
International 3.6% 2.8% 1.5% 0.6% 3.2% 1.0% 2.1% Europe 2.4% 1.2% 0.1% (1.5)% 1.8% (0.7)% 0.5%
Asia 5.0% 4.8% 3.2% 3.2% 4.9% 3.2% 4.0%
Tesco Bank 3.5% 7.2% 6.3% 6.9% 5.3% 6.6% 6.0%
Group 1.1% 1.5% 1.5% 0.3% 1.3% 0.9% 1.1% * These results have been reported on a continuing operations basis and exclude the results from our operations in Turkey.
Growth rates are all based on comparable days.
Appendix 3 Country detail
Revenue
(exc. VAT, inc. fuel)
Local
currency (m)
£m Average
exchange rate Closing
exchange rate
UK 41,458 41,458 1.000 1.000
ROI 2,483 2,066 1.202 1.184
Czech Republic 43,017 1,324 32.49 31.98
Hungary 595,463 1,593 373.8 365.0
Poland 10,832 2,070 5.233 5.096
Slovakia 1,405 1,169 1.202 1.184
Malaysia 4,458 808 5.517 5.557
Thailand 204,059 4,378 46.61 43.66

TESCO PLC
62
Appendix 4 UK sales area by size of store
Store size (sq ft) February 2017 February 2016
No. of stores Million sq ft
% of total sq ft
No. of stores Million sq ft
% of total sq ft
0 – 3,000 2,507 5.2 13.1% 2,498 5.2 12.5%
3,001 – 20,000 288 3.4 8.6% 289 3.5 8.4%
20,001 – 40,000 283 8.2 20.5% 283 8.3 20.0%
40,001 – 60,000 182 9.4 23.5% 204 10.4 25.0%
60,001 – 80,000 120 8.6 21.5% 132 8.9 21.5%
80,001 – 100,000 45 4.2 10.6% 45 4.2 10.2%
Over 100,000 8 0.9 2.2% 9 1.0 2.4%
Total* 3,433 39.9 100.0% 3,460 41.5 100.0% * Excludes franchise stores.

TESCO PLC
63
Appendix 5 Actual Group space – store numbers(a)
2015/16 year
end 2016/17 year end
Net gain/ Reduction(b)
Openings Closures/ disposals
Repurposing/ extensions
Extra 252 252 - - - 14
Superstore 478 479 1 2 (1) -
Metro 177 176 (1) - (1) -
Express 1,732 1,740 8 17 (9) -
Dotcom only 6 6 - - - -
Total Tesco 2,645 2,653 8 19 (11) 14
One Stop(c) 779 780 1 23 (22) -
Dobbies 36 - (36) - (36) -
UK(c) 3,460 3,433 (27) 42 (69) 14
ROI 149 148 (1) - (1) - UK & ROI(c) 3,609 3,581 (28) 42 (70) 14
Czech Republic(c) 201 198 (3) - (3) 1
Hungary 208 206 (2) - (2) 2
Poland 440 429 (11) - (11) 1
Slovakia 161 154 (7) (7) 2
Europe(c) 1,010 987 (23) - (23) 6
Malaysia 62 71 9 9 - 6
Thailand 1,815 1,914 99 105 (6) 44
Asia 1,877 1,985 108 114 (6) 50
International(c) 2,887 2,972 85 114 (29) 56
Group(c) 6,496 6,553 57 156 (99) 70
UK (One Stop) 134 158 24 32 (8) -
Czech Republic 103 98 (5) - (5) -
Franchise stores 237 256 19 32 (13) - (a) Continuing operations. (b) The net gain/reduction reflects the number of store openings less the number of store closures/disposals. (c) Excludes franchise stores.

TESCO PLC
64
Appendix 5 continued Actual Group space – ‘000 sq ft(a)
2015/16 year
end 2016/17 year
end Net gain/ reduction
Openings Closures/ disposals
Repurposing/ Extensions(c)
Extra 17,846 17,748 (98) - - (98)
Superstore 14,002 14,075 73 96 (23) -
Metro 2,005 1,993 (12) - (12) -
Express 4,031 4,054 23 40 (17) -
Dotcom only 716 716 - - - -
Total Tesco 38,600 38,586 (14) 136 (52) (98) One Stop(b) 1,256 1,269 13 44 (31) -
Dobbies 1,652 - (1,652) - (1,652) -
UK(b) 41,508 39,855 (1,653) 180 (1,735) (98)
ROI 3,560 3,543 (17) - (17) - UK & ROI(b) 45,068 43,398 (1,670) 180 (1,752) (98)
Czech Republic(b) 5,558 5,479 (79) - (28) (51)
Hungary 6,931 6,896 (35) - (5) (30)
Poland 9,688 9,578 (110) - (85) (25)
Slovakia 3,969 3,859 (110) - (83) (27)
Europe(b) 26,146 25,812 (334) - (201) (133)
Malaysia 4,164 4,005 (159) 35 - (194)
Thailand 15,536 15,522 (14) 514 (26) (502)
Asia 19,700 19,527 (173) 549 (26) (696) International(b) 45,846 45,339 (507) 549 (227) (829)
Group(b) 90,914 88,737 (2,177) 729 (1,979) (927)
UK (One Stop) 185 212 27 39 (12) -
Czech Republic 96 92 (4) - (4) -
Franchise stores 281 304 23 39 (16) - (a) Continuing operations. (b) Excludes franchise stores. (c) Repurposing of gross selling space is not included in the above net selling space measure.

TESCO PLC
65
Appendix 5 continued Group space forecast to 24 February 2018 – ‘000 sq ft(a)
2016/17 year
end 2017/18 year
end Net gain/ reduction
Openings Closures/ disposals
Repurposing/ extensions
Extra 17,748 17,748 - - - -
Superstore 14,075 14,149 74 74 - -
Metro 1,993 1,993 - - - -
Express 4,054 4,112 58 60 (2) -
Dotcom only 716 716 - - - -
Total Tesco 38,586 38,718 132 134 (2) -
One Stop(b) 1,269 1,297 28 49 (21) -
UK(b) 39,855 40,015 160 183 (23) - ROI 3,543 3,584 41 40 - 1
UK & ROI(b) 43,398 43,599 201 223 (23) 1
Czech Republic(b) 5,479 5,049 (430) - (291) (139)
Hungary 6,896 6,800 (96) - - (96)
Poland 9,578 9,221 (357) - (167) (190)
Slovakia 3,859 3,630 (229) - (208) (21)
Europe(b) 25,812 24,700 (1,112) - (666) (446) Malaysia 4,005 3,891 (114) 65 (60) (119)
Thailand 15,522 15,622 100 436 (16) (320)
Asia 19,527 19,513 (14) 501 (76) (439)
International(b) 45,339 44,213 (1,126) 501 (742) (885)
Group(b) 88,737 87,812 (925) 724 (765) (884)
UK (One Stop) 212 277 65 65 - -
Czech Republic 92 92 - - - -
Franchise stores 304 369 65 65 - - (a) Continuing operations. (b) Excludes franchise stores.

TESCO PLC
66
Appendix 6 Tesco Bank income statement
2016/17(a)
£m 2015/16(a)
£m Revenue
Interest receivable and similar income 622 576
Fees and commissions receivable 390 379
1,012 955
Direct costs
Interest payable (175) (166)
Fees and commissions payable (23) (3)
(198) (169)
Gross profit 814 786
Other expenses:
Staff costs (165) (172)
Premises and equipment (76) (81)
Other administrative expenses (215) (212)
Depreciation and amortisation (96) (91)
Provisions for bad and doubtful debts (105) (68)
Operating profit before exceptional items 157 162
Restructuring and other exceptional items(b) (80) (1)
Operating profit 77 161
Net finance costs: movements on derivatives and hedge accounting 6 (8)
Net finance costs: interest (4) (4)
Share of profit/(loss) of joint venture(c) (16) (3)
Deduct: management charges - (1)
Profit before tax 63 145 (a) These results are for the 12 months ended 28 February 2017 and the previous period comparison is made with the 12 months ended 29
February 2016. (b) Restructuring and other exceptional items in 2016/17 consists of an increase in the provision for customer redress of £45m and business
simplification and head office relocation costs of £35m. (c) Share of profit/(loss) of joint venture includes a charge of £23m, representing the Group's share of losses incurred by Tesco Underwriting Limited (TU)
relating to the impact on TU's insurance reserves of a change in the Ogden tables, which are used to calculate future losses in personal injury and fatal accident cases. The £23m charge has been reported as an exceptional item in the Group income statement.