preliminary kaiser*hill data quality objectives · preliminary data qualil), ... (epa) guidance for...
TRANSCRIPT

KAISER*HILL C O M P A N Y
Preliminary Data Quality Objectives
Industrial Area Sampling and Analygis Plan

Preliminary Data Qualify Objectives for the Industrial Area Sampling and Analysis Plan
1.0
1.1
2.0
2.1
2.1.1 2.1.2 2.1.3 2.1.4 2.1.5 2.1.6 2.1.7
2.2
2.2.1 2.2.2 2.2.3
a;:;:: 2.2.6 2.2.7
2.3
2.3.1 2.3.2 2.3.3 2.3.4 2.3.5 2.3.6 2.3.7 3.0
TABLE OF CONTENTS INTRODUCTION ............................................................................................................................. 1
DATA QUALITY FILTER ............................................................................................................... 1
DATA QUALITY OBJECTIVES ..................................................................................................... 3
. . -% CHARACTERIZATION AND REMEDIATION OF IHSSS, PACS. AND UBC SITES ......-...... ...+.. The Problem ....................................................................................................................................... 5 Identification of Decisions ............................................. ; ................................................................... 5 Inputs to the Decisions ....................................................................................................................... 5 Study Boundaries .................. ; ..................................................................................................... ...... 7 Decision Rules .................................................................................................................................... 7 Tolerable Limits on Decision Errors .................................................................................................. 9 Optimization of Plan Design ............................................................................................................ 10
. . . . . . .
CONFIRMATION SAMPLING AND ANALYSIS ....... i ............................................................... 10
The Problem ..................................................................................................................................... 1 1 Identification of Decisions ........................... i ................................................................................... 11 Inputs to the Decisions ............................................................. ; ........................................................ 11 Study Boundaries ............................................................................................................................. 12 Decision Rules ................................................................................................................................. 13 Tolerable L m t s on Decision Errors ................................................................................................ 15 Optimization of Plan Design ............................................................................................................ 16
. . . . . . .
FINAL CHARACTERIZATION OF THE INDUSTRIAL, AREA FOR THE COMPREHENSIVE FUSK ASSESSMENT .................................................................................... 16
The Problem ..................................................................................................................................... 17 Identification of Decisions - ............................................................................................................... 17 Inputs to the Decisions ..................................................................................................................... 17 Decision Boundaries ........................................................................................................................ 19 Decision Rules ................................................................................................................................. 19 Tolerable L i m b on Decision Errors ................................................................................................ 22 Optunization of Plan Design ............................................................................................................ 22 REFERENCES ............................................................... : ................................................................ 22
. . . . _c
. . . . . . .
1

Prelitninaty Data Quality Objectives for the Industrial Area Sampling and Analysis Plan
List of Figures
Figure 1 Data Quality Filter for the Industrial Area Sampling and Analysis Plan and Comprehensive Risk Assessment ............................................................................................. 2
Figure 2 Characterization Sampling DQA Logic Flow. Diagram ................................................................. . . . . . . . . . . . . +.,8 ---:_
Figure 3 Confirmation Sampling DQA Logic Flow Diagram ................................................................. 14
Figure 4 Comprehensive Risk Assessment Sampling DQA Logic Flow Diagram .................................. 21
. -.: . . _ _ _-_I FW
. . . . . . . . . . . . . . . . . . . . ............ . . . . . . . . - . . I
List of Attachments
Attachment 1 Description of Existing Data Sets
.. 11

~~ ~~
Preliminary Data Qualil), Objectives for the Industrial Area Sampling and Analysis Plan
AL ALF
Am AOC AST CDPHE COC CRA DQO EDD EDDIE EPA ERA EU FY GIS H3 HI IA IASAP
E s IMP ISEDS LISS MARSSIM mrem NFA NLR PA PAC PCOC PMJM Pu QA RCRA RFCA WEDS WETS WVRI RMRS SME
a swD
Acronyms
Action Level Action Levels and Standards Framework for Surface Water, Ground Water, and Soils americium Area of Concern Analytical Services Toolkit
contaminant of concern Comprehensive Risk Assessment data quality objective electronic data deliverable Environmental Data Dynamic Information Exchange U.S. Environmental Protection Agency Ecological Risk Assessment exposure unit Fiscal Year Geographic Information System tritium Hazard Index Industrial Area IA Sampling and Analysis Plan Implementation Guidance Document Individual Hazardous Substance Site Integrated Monitoring Plan Integrated Sitewide Environmental Data System Laser-Induced Breakdown Spectroscopy Multi-Agency Radiation Survey and Site Investigation Manual millirem No Further Action no longer representative Protected Area Potential Area of Concern potential contaminant of concern Preble's meadow jumping mouse plutonium quality assurance Resource Conservation and Recovery Act Rocky Flats Cleanup Agreement Rocky Flats Environmental Database System Rocky Flats Environmental Technology Site RCRA Facility InvestigatiodRemedial Investigation Rocky Mountain Remediation Services, L.L.C. subject matter expert SoiVWater Database
- . _ _ - Colorado Department of Public Health and Environment --'.
-
... 111

Preliminary Data Quality Objectives for the Industrial Area Sampling and Analysis Plan
a
U UBC UCL V&V WSRIC
Acronyms (continued)
thorium uranium under building contamination upper confidence limit validation and verification Waste Stream and Residue Identification and Characterization
iv
Prelitninaty Data Quality Objectives for 'the Industrial Area Sampling and Analysis Plan
1.0 INTRODUCTION
Data quality objectives (DQOs) for the Rocky Flats Environmental Technology Site (WETS) Industrial Area (IA) Sampling and Analysis Plan (IASAP) provide key IA characterization and remediation decision rules. These DQOs are based on U.S. Environmental Protection Agency (EPA) Guidance for the Data Quality Objectives Process: - . - - - . (EPA, 1994). DQOs have been established to review existing IA data, identifjr data gaps, and define additional sampling and analysis. Data developed under these DQOs will:
- ---.
1. Establish the nature and extent of contamination within Individual Hazardous Substance Sites (IHSSs), Potential Areas of Concern (PACs), and Under Building Contamination (UBC) sites, and determine appropriate actions where Rocky Flats Cleanup Agreement (RFCA) Action Levels (ALs) are exceeded.
2. Confirm that remediation within IHSSs, PACs, and UBC sites was successfbl, and that No Further Action (NFA) can be justified.
3. Determine whether post-closure uses are protective based on the baseline risk assessment, referred to as the Comprehensive Risk Assessment (CRA), for final remedy selection.
4. Support final remedy selection analysis.
The IASAP DQOs apply to surface and subsurface soil encountered during characterization and remediation. A significant goal of the IASAP is to maximize resources by conducting sampling programs that support all appropriate decisions, including whether remediation is required, remediation objectives have been achievkd, or an NFA can be justified. Another goal of the IASAP is to provide data for the CRA. Therefore, to the extent possible, will be characterized only once, unless circumstances warrant otherwise.
- 2 area
- The IASAP DQOs complement those used in the WETS Integrated Monitoring Plan (IMP). The IMP and its set of DQOs focus on air, surface water, groundwater, and ecology, and will be used to support remediation decisions and the CRA. Project-specific IMP air, surface water, and groundwater monitoring data from stations surrounding remediation project locations will be used to identify additional areas that may require evaluation.
1.1 DATA QUALITY FILTER
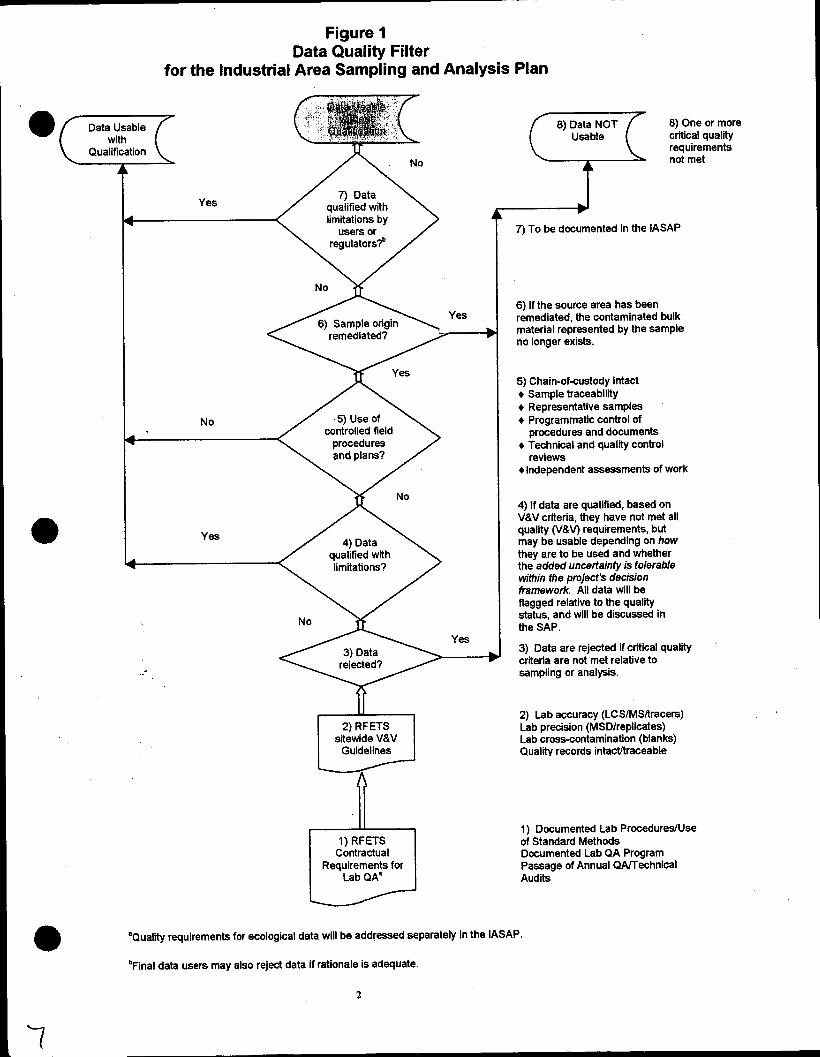
All data sets used for decisions will be assessed for quality (Le., evaluating the quality criteria associated with the data and any limitations of the data relative to theii use). The quality criteria are generally illustrated on Figure 1. Details of the data quality will be addressed in the IASAP. Data quality assessments will include evaluation of distributional
@f7 Data Usable
Figure 1 Data Quality Filter
for the Industrial Area Sampling and Analysis Plan
\ Qualification \
Yes 1
remediated?
No
t controlled field
YeS
I
YeS
I
2) RFETS sitewide V&V
1) RFETS Contractual
Requirements for Lab QA"
8) One or more critical qual i i requirements not met
8) Data MOT Usable
LI 7) To be documented in the IASAP
6) If the source area has been remediated, the contaminated bulk material represented by the sample no longer exists.
5) Chain-of-custody intact
+ Representative samples + Programmatic control of
procedures and documents + Technical and quality control
reviews *Independent assessments of work
Sample traceabiliiy
4) If data are qualified, based on V&V criteria, they have not met all quality (V&v) requirements, but may be usable depending on how they are to be used and whether the added uncertainty is tolerable within tne project's decision framework. All data will be flagged relative to the quality status, and will be discussed in the SAP.
3) Data are rejected if critical qual i i criteria are not met relative to sampling or analysis.
'
2) Lab accuracy (LCSIMSAracers) Lab precision (MSD/replicates) Lab crosscontamination (blanks) Quality records intacfftraceable
1) Documented Lab ProceduresIUse of Standard Methods Documented Lab QA Program Passage of Annual M e c h n i c a l Audits
"Quality requirements for ecological data will be addressed separately in the IASAP.
bFinal data users may also reject data if rationale is adequate.
2
Preliminary Data Quality Objectives for the Industrial Area Sampling and Analysis Plan
characteristics, variability, descriptive statistics, sampling adequacy, and uncertainty in measurements and decisions.
Formal validation and verification of historical data (of potential use in the IA) beyond that already performed, as illustrated in steps 1 and 2 of Figure 1, will not be performed; however, data will be qualified through the Data Quality Filter, as necessary. For example, individual sample results lacking validation qualifiers will be evaluated to determine whether
information that will be evaluated include, but are not limited to, the following:
-~ ...I adequate association exists between the validated and unvalidated data. Other types of ’ 1 - .z..->
0 Analytical results that are valid with qualification that may be potentially biased low;
0 Analytical results associated with soil locations that have since been remediated; and
Standard operating procedures in place during collection of the samples.
Specific criteria such as these will be itemized and systematically evaluated through research and database queries, and will be included in the IASAP. All data will be individually “flagged,” by record, in the digital data sets used to support the IASAP.
A description of existing data sets that will be reviewed for usability is included in Attachment 1. Data will be stored in a subset of project-approved data within the SoiVWater Database (SWD) and will become part of the Administrative Record. Data will be maintained pursuant to WETS quality assurance (QA) requirements. 0 2.0 DATA QUALITY OBJECTIVES
The DQO process is a series of planning steps based on the scientific method designed to
appropriate for the intended purpose. EPA has issued guidelines to help data users develop site- and project-specific DQOs (EPA 1994). The DQO process is intended to: -
ensure that the type, quantity, and quality of environmental data used in decisionmaking are ..
Clarify the study objective;
Define the most appropriate types of data to collect;
0 Determine the most appropriate conditions under which to collect the data; and
Specify acceptable levels of decision errors that will be used as the basis for establishing the quantity and quality of data needed to support the design.
The DQO process specifies project.decisions, the data quality required to support those decisions, specific data types needed, data collection requirements, and analytical techniques necessary to generate the specified data quality. The DQO process consists of seven steps.
3

Preliminary Data Quality Objectives for the Industrial Area Sampling and Analysis Plan
Each step influences choices that will be made later in the process. These steps are as follows: 0
Step 1: State the Problem;
Step 2: Identify the Decision;
Step 3: Identify the Inputs to the Decision; . . . . . . . . . . . . . . . . . . . . . - -.- -. . . . . . . . . . .... . . . . . . . . . . .
..?.. . ___-c: . . . . . . ~ . . . . . . .-.-. . . . . . -
._ . ,_;_ , . . _ : ' .. . . . .
Step 4: Define the Study Boundaries;
Step 5: Develop a Decision Rule;
Step 6 : Specify Tolerable Limits on Decision Errors; and
Step 7: Optimize the Design.
During the first six steps of the DQO process, the planning team develops decision performance criteria (i.e., DQOs) for the data collection design. All decision rules need to be considered, as appropriate. The final step of the process involves developing the data collection design based on the DQOs. The data collection design will be presented in the IASAP.
The DQOs will be refined and expanded as the IASAP is developed. For example, specific decision limits, null hypotheses, statistical tests, and methods to determine sample numbers and locations will be added. The three sets of DQOs discussed below include the following:
e 1.
2.
Characterization and remediation of IHSS, PAC, and UBC sites;
Confirmation sampling and analysis; and - 7 - - ":
- 3.
2.1
Final characterization of the IA for the CRA.
CHARACTERIZATION AND REMEDIATION OF MSSs, PACs, AND UBC SITES
The IA will be assessed with respect to RFCA requirements to ensure that human health and the environment are protected on an IHSS, PAC, and UBC site basis. Data collected will be used to define the nature and extent of contamination within IHSSs, PACs, and UBC sites. Comparison of data will be made on an Area of Concern (AOC) basis. The AOC for each IHSS, PAC, and UBC site will be based on existing and new characterization data. The boundaries of an AOC may be larger or smaller than the IHSS, PAC, or UBC site boundary. Data collected for each AOC, during characterization and remediation sampling, will be compared to the RFCA Tier I and Tier I1 A L s to determine whether action is required.
4

Preliminary Data Quality Objectives for the Industrial Area Sampling and Analysis Plan
2.1.1 The Problem
The nature and extent of contamination must be known with adequate confidence to make .
remedial decisions. Data of sufficient quality and quantity must be available to conduct an AL comparison, as specified in the RFCA Implementation Guidance Document (IGD), to assess whether an IHSS, PAC, or UBC site needs remediation or management.
a
2.1.2 Identification of Decisions -
*-- -1 The characterization and remediation questions that will be resolved are as follows: / .
1. Is each potential contaminant of concern (PCOC) and its nature and extent associated with an IHSS, PAC, or UBC site known with adequate confidence?
Is remediation necessary within an IHSS, PAC, or UBC site based on comparison of the characterization data to the RFCA Tier I ALs as specified in the IGD?
Is evaluation, management, or remediation of an IHSS, PAC, or UBC site required because of exceedances of RFCA Tier I1 ALs as specified in the IGD?
2.
3.
2.1.3 Inputs to the Decisions
Information needed to resolve the characterization and remediation questions in Section 2.1.2 is listed below:
0 1.
2.
3.
4.
a
IO
PCOCs (analytes as listed in the referenced analytical Line Item Codes) Target Compound List (Organics)
2 33 volatile organic compounds (SSOlB002 or -003) 2 64 semivolatile organic compounds (SS02B002) 21 pesticides (SS03B002) 7 arochlors (PCBs)(SS03B002) ' 12 herbicides (S W8 15 1 A) . - _,.
Target Analyte List: '
2 22 metals (SSO5CO39 or EPA 6200 or laser-induced breakdown spectroscopy) cyanide
Radionuclides (WETS-specific): ~2 2 3 5 ~ , 2 3 8 ~ , 24'americium ( ~ m 2 , 239~240plutonium (Pu) 233/234uanim (RCOlB003), tritium (H3) (RC02B002);
j2 thorium (Th) (RCOlB023), 'Th (RCOlB025), and
Method detection limits and practical quantitation limits/(below RFCA Tier II a s ) ;
Background concentrations for each inorganic and radionuclide PCOC;
RFCA Tier I and Tier I1 ALs for surface soil and subsurface soil as listed in the Action Levels and Standards Framework for Surface Water, Ground Water, and Soils (ALF) (Attachment 5 , RFCA). Comparison criteria include the following:

Preliminary Data Quality Objectives for the Industrial Area Sampling and Analysis Plan
a) Each soil data value will be compared to the appropriate AL. a b) Each soil data value will be compared to the background mean plus two standard
deviations.
c) Tier I exceedance is defined as: - Ratio of each soil data value to the Tier I AL is > 1, or
. . . . . . . - -,. .. 2--
- Sum of the ratios for either non-radionuclides or. radionuclides is,>-l. ,... >, . . . . :.i ............ -4-.::
d) Tier I1 exceedance is defined as: - Ratio of each soil data value to the Tier I1 AL is > 1 , or - Sum of the ratios for either non-radionuclides or radionuclides is > 1 ;
e) Below Tier I1 is defined as: - Ratio of each soil data value to the Tier I1 AL is < 1, or - Sum of the ratios for either non-radionuclides or radionuclides is < 1 ; .
,
f) For sites with soil data values exceeding Tier I ALs, the spatial extent of the AOC with respect to Tier I and Tier I1 ALs will be determined and the data will be aggregated. There is no lower limit on the size of an AOC, but no single AOC will exceed 10 acres. The process for determining the extent of the AOC and comparing analytical results is as follows:
- Compare data for inorganics and radionuclides to background mean plus two standard deviations,
- Compare data for organics to detection limits,
Establish AOCs based on the spatial distribution of data, _. -
- Average data over the AOC, as appropriate,
- Compare the 95 % upper confidence limit (UCL) of the mean for each PCOC to the Tier I and Tier I1 ALs, and
- When evaluation of a Tier I exceedance indicates an area of very limited extent (i.e., a hot spot), data aggregation may not be appropriate. The methodology for determining potential hot spots will be described in the CRA Methodology and IASAP.
5. Process knowledge and historical data, including information and data contained in technical memoranda, Resource Conservation and Recovery Act (RCRA) Facility Investigatioflemedial Investigation (RFIRI) reports, remedial action reports, IMP
6

Preliminaty Data Quality Objectives for the Industrial Area Sampling and Analysis Plan
reports, the Historical Release Report, Reconstruction of Historical Rocky Flats Operations and Identification of Release ‘Points, and other relevant documents; and
6 . IASAP-generated characterization data. 0
Existing and IAS AP-generated characterization data, which meet usability criteria and pass the Data Quality Filter (Section 1. l), will be used to assess the variability of PCOC and contaminant of concern (COC) concentrations and determine whether further sampling is necessary and a RFCA action is necessary.
2.1.4 Study Boundaries
Characterization and remediation decision boundaries that define when and where data will be collected are listed below.
- - . . . . . .. -.. .. . . . . . . . . . .. . . . . . . . . . . . . . . . . . . . . . . . . . > .:, .. ’ ..:; : . _ _ .---- . .
. . . . . . . . .
. . . . ; .
1. IHSS, PAC, and UBC site boundaries are listed in Table 2 and shown on Plates 1 and 2 of the Industrial Area Characterization and Remediation Strategy (DOE 1999). The actual boundary of an AOC will be determined from the spatial distribution of the sampling data (Section 2.1.3. [4][q). “White Space area” (areas in between IHSS, PAC, and UBC site boundaries) will be addressed after IHSS, PAC, and UBC site remediation (Sections 2.2 and 2.3).
2. The decisions listed in Section 2.1.2 will be applied to each IHSS, PAC, and UBC site located in the IA.
Soil will be assessed generally fiom the land surface to the top of the saturated zone or top of bedrock, as appropriate.
3.
4. Temporal boundaries will be consistent with IA project schedules. These boundaries will be refined as the IASAP is developed. i
2.1.5 Decision Rules
The characterization and remediation decision rules that describe how the data f i l l be evaluated are listed below. Because of the complexity of the decision rules, as well as the systematic manner in which they must be applied, Figure 2 illustrates the decision sequence.
1. If each PCOC has been adequately documented with respect to concentrations and three- dimensional locations for IHSSs, PACs, or UBC sites, the nature and extent are adequately defined. Otherwise, PCOCs have not been adequately characterized, and additional sampling and analysis are necessary.
2. If all analytical results are nondetects, a PCOC will be disqualified from further consideration; otherwise, the PCOC will be retained. AOCs will be determined based on PCOCs above detection limits.
7
Preliminary Data Quality Objectivesfor the Industrial Area Sampling and Analysis Plan
3.
a
4.
5 .
6.
7.
0
8.
9.
If all data values are below the background mean plus two standard deviations, then no action is necessary. Some inorganic and radionuclide concentrations may be below background levels but above Tier I1 ALs. Data values below background will not be carried over for further evaluation. AOCs will be determined based on PCOCs detected above background.
If each PCOC data point is below the Tier I1 AL, and the sum of the ratios of the concentrations of each PCOC to its respective Tier I1 AL for both nonradionuclides and radionuclides are below 1, then no evaluation, management, or remediation of the AOC is necessary in accordance with RFCA requirements.
If a single PCOC data point is above the Tier I1 AL, or the sum of the ratios of the concentrations for each PCOC to its respective Tier I1 AL for either nonradionuclides or radionuclides is greater than or equal to 1, the PCOC becomes a COC and aggregation (as in Section 2.1.3. [4][fJ) and evaluation as in decision rules 7, 8, and 9 is necessary in accordance with RFCA requirements.
If a single COC data point is above the Tier I AL, or the sum of the ratios of the concentrations for each COC to its respective Tier I AL for either nonradionuclides or radionuclides is greater than or equal to 1, additional data evaluation as a potential hot spot is necessary andor the data will be aggregated as in decision rules 7,8 , and 9.
If the ratio of the 95% UCL of the mean concentration for a single COC to its Tier I AL, or the sum of the ratios of the 95% UCL of the mean concentrations for all COCs to their respective Tier I ALs for both radionuclides and nonradionuclides within an AOC are greater than or equal to 1, action will be taken in accordance with RFCA requirements.
If the ratio of the 95% UCL of the mean concentration for a single COC to its respective AL or the' sum of the ratios of the 95% UCL of the mean concentrations for all COCs to their respective A L s for both radionuclides and nonradionuclides are greater than or equal to 1 for Tier I1 ALs and below 1 for Tier I ALs, then hrther evaluation of the site is required in accordance with RFCA requirements. -
If the ratio of the 95% UCL of the mean concentration for a single COC to its Tier I1 AL, and the sum of the ratios of the 95% UCL of the mean concentrations for all COCs to their respective Tier I1 A L s for both radionuclides and nonradionuclides are below 1, then the soil does not need to be further evaluated or managed per FWCA requirements.
2.1.6 Tolerable Limits on Decision Errors
Areas and associated PCOCs disqualified from further characterization or remediation based on process knowledge have no associated quantifiable decision error. Sample data requirements will be based on uncertainties of 10 percent or less for alpha (false positive) errors and 20 percent or less for beta (false negative) errors. The null hypothesis is that the AOC is contaminated. Characterization of data including the minimum detectable .relative differences and data variability will be evaluated for each AOC. e
9

Prelitninaty Data Quality Objectives for the Industrial Area Sampling and Analysis Plan
2.1.7 Optimization of Plan Design
Optimization of the data collection and remediation decision process will be conducted in consultation with the Colorado Department of Public Health and Environment (CDPHE) and EPA during development of the IASAP. Consistent with the iterative approach of the DQO process, decisions without adequate confidence will be revisited until enough data are gathered to make a decision. Existing data sets may be checked for sampling adequacy based on comparison with the EPA G-4 model (EPA 1994). Sampling requirements and densities will be based on the AOC as described in Section 2.1.3 and will be specified in the IASAP.
The following documents will be used as guidance in optimizing sampling and analysis requirements and QA in support of characterization activities:
a
- . .--- A- , .
e
e
e
e
e e
e
e
e
DOE, 1999, Industrial Area Characterization and Remediation Strategy, September.
EPA, 1989, Risk Assessment Guidance for Superfund, Volume I, Human Health Evaluation Manual (Part A ) , EPPi/54011-891002, December.
EPA, 1992, Guidance for Data Usability in Risk Assessment (Parts A&B), 9285.7- 09A&B, ApriVMay.
EPA, 1994, Guidance for the Data Quality Objective Process, EPA QNG-4, EPN600R-961055, September.
EPA, 1996, Soil Screening Guidance: Technical Background Document, EPN540R- 951128, May.
EPA, 1 997, Multi-Agency Radiation Survey and Site Investigation Manual (UARSSIM), NUREG-1 575, EPA 402-R-97-0 16, December.
EPA, 1998, Guidance for the Data Quality Assessment Process: Practical Methods for Data Analysis, EPA QNG-9 EPN600/R-961084, January. -
EPA, 1999, Guidance on Environmental Data VeriJication and Validation, Peer Review Draf, EPA QNG-8, August.
2.2 CONFIRMATION SAMPLING AND ANALYSIS
If an IHSS, PAC, UBC site, or White Space area requires remediation, confirmation samples will be collected to ensure that remediation has reduced COC concentrations to below the RFCA Tier I ALs. Sampling objectives will take into account the requirements for CRA sampling. This DQO supports the sampling and analysis required to confirm that remediation at an IHSS, PAC, UBC site, AOC, or White Space area has been successful, and an NFA finding can be justified using criteria contained in RFCA, Attachment 6, and the IGD.
IO
IS

Preliminary Data Quality Objectivesfor the Industrial Area Sampling and Analysis Plan
2.2.1 The Problem
Following remediation of any contaminated area, the concentrations of remaining contaminants, if any, are not known with adequate confidence to conclude that remediation was complete and successful.
Due to the nature of some remediation technologies, such as soil excavation and hauling with heavy equipment, the possibility exists that limited contaminated media could be released outside the remediation boundaries during field activities. IMP and project-specific
remediation area are appropriately managed and controlled.
. .. . . ... --- _I monitoring results will be evaluated to ensure that..any releases'of.contaminatiii;n .from the,:.- ..<~~:.::..z&;
2.2.2 Identification of Decisions
The confirmation sampling and analysis questions that will be resolved include the following:
1. Has contamination within an AOC been successfully remediated based on RFCA ALs and other mutually agreed-upon cleanup criteria?
Did any releases of contamination occur outside the remediation activity boundaries during the remediation activity (based on IMP and project-specific monitoring)?
2.
2.2.3 Inputs to the Decisions
Information needed to resolve the codinnation sampling and analysis questions in Section 0 2.2.2 are as follows.
1. COCs as determined by the AL screen in Section 2.1.5; . 2.
3.
4.
Post-remediation sampling locations based on RFCA and CRA requirements;
Monitoring results concurrent with remediation;
Method detection limits and practical quantitation limits (below RFCA Tier I1 ALs and CRA requirements);
.. .
-
5.
6.
Confirmation sample results (post-remediation concentrations);
RFCA Tier I and Tier I1 ALs for surface soil and subsurface soil as listed in the ALF (Attachment 5, RFCA). Comparison criteria include the following:
a) Each soil data value will be compared to the appropriate AL.
b) Each soil data value will be compared to the background mean plus two standard deviations.
c) Tier I exceedance is defined as: e . I 1
. ..

Preliniinaty Data Qualiy Objectives for the Industrial Area Sampling and Analysis Plan
f )
-
-
Tier I1 exceedance is defined as: - -
Below Tier I1 is defined as:
Ratio of each soil data value to the Tier I AL is > 1, or Sum of the ratios for either nonradionuclides or radionuclides is > 1.
Ratio of each soil data value to the Tier I1 AL is > 1, or Sum of the ratios for either nonradionuclides or radionuclides is > 1.
. . . .. . _. - - Ratio of each soil data value to the Tier. 11 AL is..< 1, 0;. .'.. . ' : /. ,:I..-:: .., . . . , . . . . . .. . . .. : - -.-:-,S- i_..
-
For sites with soil data values exceeding Tier I ALs, the spatial extent of the AOC with respect to Tier I and Tier I1 ALs will be determined and the data will be aggregated. There is no lower limit on the size of an AOC, but no single AOC will exceed 10 acres. The process for determining the extent of an AOC and comparing analytical results is as follows:
Sum of the ratios for either nonradionuclides or radionuclides is < 1.
Compare data for inorganics and radionuclides to background mean plus two standard deviations,
Compare data for organics to detection limits,
Establish AOCs based on the spatial distribution of the data,
Average data over the AOC, as appropriate,
Compare the 95% UCL of the mean for each PCOC to the Tier I and Tier I1 ALs, and
- . _ When an evaluation of a Tier I exceedance shows an area of very l imit4 e ~ e n t (i.e., a hot spot), data aggregation may not be appropriate. The methodology for determining potential hot spots will be described in the CRA Methodblogy and the IASAP.
7. Other mutually agreed-upon cleanup criteria.
Data will be reviewed and evaluated against usability criteria and must pass the Data Quality Filter (Section 1.1).
2.2.4 Study Boundaries
Decision boundaries that determine when and where data will be collected are listed below.
1. Identified IHSS, PAC, and UBC site boundaries are listed in Table 2, and shown on Plates 1 and 2 of the Industrial Area Characterization and Remediation Strategy (DOE 1999). The actual boundary of an AOC will be determined from the spatial distribution 0
12
11

Preliminary Data Quality Objectives for the Industrial Area Sampling and Analysis Plan
of the sampling data, as specified in the IGD. The AOCs determined in accordance with Section 2.1.3 will be used as areas for confirmation sampling and analysis immediately after remediation.
2.
3.
4.
5 .
6.
White Space areas will be sampled and addressed when monitoring data indicate contamination was spread during the remediation of adjacent sites. Otherwise, White Space areas will be addressed as part of the CRA.
COCs determined for each AOC inaccordance with- Section 2.115 .will be'compared to:; , ., -?.-:::: A L s or other mutually agreed-upon cleanup 'criteria.
: . i. . .. . -.. . . -.: . _ . . . . _ ... . . . . . . .
Confirmation sampling will cover the area remediated.
Soil will be assessed generally from the land surface to the top of the saturated zone or top of bedrock, as appropriate.
Temporal boundaries will be consistent with IA project schedules. These boundaries will be refined as the IASAP is developed and IA remediation proceeds. Confirmation sampling will be conducted after remediation'based on AL comparisons. Data from this confirmation sampling will be used to support the CRA (Section 2.3).
2.2.5 Decision Rules
The confirmation sampling and analysis decision rules that describe how the data will be evaluated are illustrated on Figure 3 and listed below.
1. The concentration and distribution of each COC, after the remedial action has been performed, must be adequately documented within the AOC boundaries of interest to evaluate the remediation using the following decision rules. Otherwise, post- remediation COCs have not been adequately characterized, and additional sampling and Bnalysis are necessary.
If all COC data values are below the background mean plus two standard dFviations, no further action is necessary. Some inorganic and radionuclide concentrations may be below background but above Tier I1 ALs. Data values that are below background will not be carried over for further evaluation.
2.
3. If each COC data point is below the Tier I1 AL, and the sum of the ratios of the concentrations for each COC to its respective Tier I1 AL for both nonradionuclides and radionuclides are below 1, then no evaluation, management, or remediation is necessary in accordance with RFCA requirements.
13

Preliminary Data Quality Objectivesfor the Industrial Area Satnpling and Analysis Plan
4. If a single COC data point is above the Tier I1 AL, or the sum of the ratios of the concentrations for each COC to its respective Tier I1 AL for either nonradionuclides or radionuclides is greater than or equal to 1, then aggregation (as in Section 2.1.3.[4] [fl) and evaluation as in decision rules 7, 8, and 9 is necessary in accordance with RFCA requirements.
If a single data point is above the Tier I AL, or the sum of the ratios of the concentrations for each COC to its respective Tier I AL for either nonradionuclides or 1 - - -:e. radionuclides is greater than or equal to 1, then additional evaluation as a potential hot spot is necessary and the data will be aggregated as described in decision rules 6,7, and 8.
a
.I _ . 5.
6. If the ratio of the 95% UCL of the mean concentration for a single COC to its respective Tier I AL, and the sum of ratios of the 95% UCL of the mean concentrations for all COCs to their respective Tier I ALs for both nonradionuclides and radionuclides within an AOC are greater than or equal to 1, then further evaluation, management, or remediation is necessary in accordance with RFCA requirements.
7. If the ratio of the 95% UCL of the mean concentration for a single COC to its respective AL, or the sums of the ratios of the 95% UCL of the mean concentration for all COCs within an AOC to their respective ALs is greater than or equal to 1 for Tier I1 ALs and below 1 for Tier I ALs, then further evaluation or management of the site is required in accordance with RFCA requirements.
8. If the ratio of the 95% UCL of the mean concentration for a single COC to its respective Tier I1 AL and the sum of the ratios of the 95% UCL of the mean concentration for all COCs to their respective Tier I1 ALs are below 1, then no further action is required in accordance with RFCA requirements.
-" 9. If IMP or project-specific monitoring (e.g., air monitoring or surface water sanipling)
corresponding with the IA remediation activity produces results that excedALs stated in the IMP, then the potential release of contaminants resulting fiom the respective remediation activity will be evaluated. Otherwise, the remediation activity was adequately controlled to prevent release of contaminants outside the immediate remediation boundaries.
2.2.6
Areas and associated COCs disqualified fiom W h e r characterization or remediation based on process knowledge have no associated quantifiable decision error. Sample data requirements will be based on uncertainties of 10 percent or less for alpha errors and 20 percent or less for beta errors. The null hypothesis is that the AOC is contaminated. Characterization of data including the minimum detectable relative differences and data variability will be evaluated for each AOC.
Tolerable Limits on Decision Errors

Preliniinaty Data Quality Objectives for the Industrial Area Sampling and Analysis Plan
~ ~~~ ~
2.2.7 Optimization of Plan Design
Optimization of the post-remediation data collection and decision process will be performed in consultation with CDPHE and EPA during development of the IASAP. Consistent with the iterative approach of the DQO process, decisions without adequate confidence will be revisited until enough data are gathered to make a decision. Existing data sets may be checked for sampling adequacy by comparison with the EPA G-4 model or MARSSIM.
e
Sampling requirements and densities will be based on the AOC as described in Section 2.1.3 and on CRA considerations. > A _ .
The following documents will be used as guidance in optimizing sampling and analysis requirements and QA in support of remediation and risk assessment activities:
a
a
a
a
a
a
a
DOE, 1999, Industrial Area Characterization and Remediation Strategy, September.
EPA, 1989, Risk Assessment Guidance for Superfund, Volume I , Human Health Evaluation Manual (Part A), EPA/54011-89/002, December.
EPA, 1992, Guidance for Data Usability in Risk Assessment (Parts A&B), EPA Publication 9285.7-09A&B, AprilMay.
EPA, 1994, Guidance for the Data Quality Objective Process, QNG-4 EPN600R- 961055, September.
EPA, 1996, Soil Screening Guidance: Technical Background Document, EPN540R- 951128, May.
EPA, 1 997, Multi-Agency Radiation Survey and Site Investigation Manual (MARSSIW, NUREG-1 575, EPA 402-R-97-0 16, Decembe;.
EPA, 1998, Guidance for the Data Quality Assessment Process: Practical Methods - for Data Analysis, QNG-9 EPA/600/R-96/084, January.
-~ - <
EPA, 1999, Guidance on Environmental Data Verijkation and Validation, Peer Review Draft, QNG-8, August.
2.3 FINAL CHARACTERIZATION OF THE INDUSTRIAL AREA FOR THE COMPREHENSIVE RISK ASSESSMENT
The IA must be assessed to ensure that the post-remediation state is protective of human health and the environment based on post-closure uses. Data will be collected to ensure that the nature and extent of any remaining contamination is known, so that a CR4 can be performed to ensure post-closure uses are protective. The CR4 will address direct surface soil, surface water, and air exposure pathways and offsite exposures; however, the .IASAP
16
a\

I .
Preliminary Data Quality Objectives for the Industrial Area Sampling and Analysis Plan
DQOs only address soil. Other media will be sampled and evaluated as part of the IMP or other WETS programs.
The nature and extent of soil contamination within AOCs, established in the IA during the characterization and remediation phases, will have been determined based on Sections 2.1 and 2.2 of this document. The nature and extent of soil contamination in most White Space areas will be unknown. The concentrations of COCs in soil in all areas within the IA must be determined with adequate confidence to be protective of post-closure uses.
Data used in the CRA will be evaluated based on exposure units @Us). The extent of the EUs will be determined in the CRA Methodology and will not depend on the size of the AOCs.
- -. - _ - -- . - _u
2.3.1 The Problem
Human and ecological receptors can be expected to randomly contact soil fiom any or all parts of the IA. ’ The previous DQOs address select areas of known contamination; however, there are areas within the IA for which no data are available. The post-remediation state of the IA must be assessed to determine whether it is adequately protective of the post-closure uses.
2.3.2 Identification of Decisions
The CRA questions that will be resolved are listed below:
1, Has each COC and its nature and extent within IHSSs, PACs, UBC sites, and their associated AOCs and White Space areas been identified with adequate confidence, based on site history (process knowledge) and analytical data?
2. Are long-term risks to receptors in an EU acceptable, based on post-closure uses?
3. Are long-term risks to onsite and offsite receptors via the air and surface water pathways acceptable, based on post-closure uses?
- <‘
-
4. Does residual contamination within an Ecological Risk Assessment (ERA) EU represent an acceptable ecological risk due to direct contact with abiotic media?
2.3.3 Inputs to the Decisions
The information needed to resolve the CRA’questions in Section 2.3.2 is listed below:
1. Characterization data fiom RIs, RFI/RI reports, corrective measure studies, remedial action reports, IMP reports, predemolition survey reports, and other projects and data sets, including IASAP-generated, historical, and IMP data (e.g., concentrations of COCs in surface and subsurface soil, surface water, groundwater, air, and biota) will be used as inputs to the decisions. IASAP data will include data collected for pre- and post- remediation AL comparisons (Sections 2.1 and 2.2). Data used in the CRA will be screened through the Data Quality Filter
17

Prelitninary Data Quality Objectives for the Industrial Area Sampling and Analysis Plan
2. All available historical information, sampling data, and risk assessment requirements, as documented in the CRA Methodology (to be determined), will be used to determine sampling locations and densities for White Space areas to support CRA decisions. Data used in the CRA will be screened through the Data Quality Filter.
a
3. These data will be processed using one or more numerical methods to provide a decision context. These methods may include:
PCOC filter (algorithm);
..... ?:I
, ___--. . . . . . . . ... . . . . . . . . . . . . . . :-+--: . . . . . . . . . . . . . . . . . . . . . . .........
.. . . . . .
0 Monte Carlo methods;
Air dispersion modeling;
Surface water, groundwater, or erosion modeling;
0 CRA modeling; and
ALF comparisons on an EU basis.
4. COCs as determined from sampling and remediation efforts.
5. Pre- and post-remediation sampling locations.
6. Method detection limits and practical quantitation limits (below RFCA Tier I1 ALs.and CRA requirements).
7.
All characterization (unless remediated) and confirmation data for environmental media in the IA that pass the Data Quality Filter will be used in the CRA. This will include data from historical investigations and actions, IA characterization, remediation confirmatiin, IMP monitoring, and additional samples to complete the nature and extent determination. All appropriate modeling results will be used in the assessment.
Acceptable human health and ecological risk levels for post-closure uses. .,
CRA data will meet at least one of the following criteria:
Data must pass the Data Quality Filter (Section 1.1);
Data must meet IMP DQO requirements; or
0 Data. used for CRA modeling must meet Actinide Migration Evaluation DQO requirements or be from a regulatory agency-approved modeling study.

Preliminary Data Quality Objectives for the Industrial Area Sampling and Analysis Plan
Data will be stratified using appropriate statistical methods to account for possible higher density sampling and higher levels of contamination in AOCs than in White Space areas.
2.3.4 Decision Boundaries
Decision boundaries to determine when and where data will be collected are listed below.
0
1.
2.
3.
4.
0 5.
6.
7.
8.
9.
The data associated with IHSSs, PACs, UBC sites, AOCs and White Space areas will be incorporated into EUs as designated in the CRA Methodology (to be determined).
EU sizes and factors will be documented in a CRA Methodology document to be produced during Fiscal Year (FY)OO and FYOl . The size of the EUs will be based on the potential land uses identified on Figure 1 of RFCA Attachment 5. The EUs will contain IHSSs, PACs, UBC sites, AOCs, and White Space areas, as appropriate.
,-. - _...._
For ecological characterization, the minimum grid spacing for selecting random samples within an ERA EU will be based on the average home range of the Preble's meadow jumping mouse (PMJM) (3.5 hectares in a linear-ovate configuration). Other grid spacing will be used in habitats not fiequented by the PMJM.
AL comparisons will be performed on aggregated data (Sections 2.1.3 and 2.2.3) for COCs contained in an EU to account for direct exposure, including contact with multiple contaminants.
Aggregate human health risks and doses, and ecological risks will be assessed for projected land uses in accordance with RFCA, and for adjacent areas including those downwind and downstream, as specified in the CRA Methodology (to be determined).
._
Soil will be assessed generally from the land surface to the top of the saturated zone or top of bedrock, as appropriate.
Temporal boundaries will be consistent with IA project schedules. These boundaries will be refined as the IASAP is developed and IA remediation proceeds (e.g, to consider the optimal season for various sample types).
-. I
The CRA modeling effort will include several out-year land use scenarios as defined in the CRA Methodology (to be determined).
The CRA will use characterization and confirmation data as appropriate from IHSSs, PACs, UBC sites, AOCs, and White Space areas.
2.3.5 Decision Rules
The decision rules that describe how the data will be evaluated are illustrated on Figure 4 and listed below:
_.":
19
a3

Preliminary Data Quality Objectivesfor the Industrial Area Sampling and Analysis Plan
2.
3.
1. If the nature and extent of chemicals, metals, and radionuclides are known for an EU with sufficient certainty, so that human health risks and doses and ecological risks can be adequately quantified, then additional sampling and analysis will not be performed. Otherwise, additional sampling and analysis will be performed.
If human health risks and doses and ecological risks are acceptable for the entire IA, then an NFA Corrective Action DecisionRecord of Decision will be developed. Otherwise, further evaluation, management, or remediation will be required.
The following criteria will be used to determine'whether the human heaith.risks and doses and ecological risks are acceptable:
. . . ... , 2 : : _-. . . . . .. . . . . . . .
Are human health carcinogenic risks for direct contact with chemicals, metals, and radionuclides (as determined by the AL screen) in soil in the EU and from air and surface water pathways due to contact, in estion, or inhalation, as determined by a forward risk assessment, greater than 10 for the appropriate land use? If yes, then evaluation, management, or remediation is necessary. If no, no further action, other than institutional control, is necessary.
B
Do human health non-carcinogenic hazards from chemicals and metals (as determined by the AL screen) in soil in the EU and air and surface water pathways due to contact, ingestion, or inhalation, as determined by a forward risk assessment, have a hazard index (HI) greater than 1 for the appropriate land use (e.g, open space or industrial land use)? If yes, then evaluation, management, or remediation is necessary. If no, no further action, other than institutional control, is necessary.
Is radiation dose to an individual from direct contact with radionuclides (as determined by the AL screen) in soil in the EU and air and surface water pathways due to contact, ingestion, inhilation, or external irradiation, as determined by a forward risk assessment, greater than the acceptable annual radiation dose limit of 15 millirems (mrem) for open space or industrial land use or 85 mrem for a hypothetical future resident, whichever is lower? €f yes, then evaluation, management, or remediation is necessary. If no, no further action, other than institutional control, is necessary.
Is radiation dose to an individual from radionuclides in air and surface water due to contact, ingestion, or inhalation, as determined by a forward risk assessment, greater than the acceptable annual radiation dose limit of 15 mrem for the offsite resident? If yes, then evaluation, management, or remediation is necessary. If no, no further action, other than institutional control, is necessary.
20

Prelitnitiary Data Quality Objectives for the Industrial Area Sampling and Analysis Plan
e) Is the 95% UCL of the mean concentration of a single COC within the ERA EU greater than the corresponding ecological risk level? If yes, then evaluation, management, or remediation is required to reduce the concentration. If the 95% UCL of the mean concentration is equal to or less than the corresponding risk level, then no further action, other than institutional control, is required.
I- ~
2.3.6
Sample data requirements will be based on uncertainties of 10 percent or less for alpha errors and 20 percent or less for beta errors. Characterization of data including the minimum detectable relative differences and data variability will be evaluated for each EU.
Tolerable Limits on Decision Errors -,. - L_- , I .
Sources of uncertainties in the risk assessments will be identified and minimized.
2.3.7 Optimization of Plan Design
Optimization of the post-remediation data collection and sampling requirements will be based on the EU for the appropriate land use, in consultation with CDPHE and EPA during development of the CRA Methodology.
The following documents will be used as guidance in defining the sampling and analysis requirements for the CRA:
EPA, 1989, Risk Assessment Guidance for Super-nd, Volume I , Human Health Evaluation Manual (Part A), EPA/54011-891002, December. e EPA, 1992, Guidance For Data Usability in Risk Assessment (Parts A&B), 9285.7- 09A&B, Aprillh4ay.
EPA, 1996, Soil Screening Guidance: Technical Background Document, EPN540fR- 951128, May
0
- 0 EPA, 1997, Multi-Agency Radiation Survey and Site Investigation Manual (MARSSIA4),
NUREG-1 575, EPA 402-R-97-016, December.
3.0 REFERENCES
DOE, 1999, Industrial Area Characterization and Remediation Strategy, September.
EPA, 1994, Guidance for the Data Quality Objective Process, QNG-4 EPN600/R-961055, September.
. -..:
22

. . . . ...... . . . . . . ?., . - . . . . . . . . . . . . . . . . . . . . . . . . . :.. . . . .., .. ..,:..: ,....-7E> . .
ATTACHMENT 1
DESCRIPTION OF EXISTING DATA SETS

Preliminary Data Quality Objectives for the Industrial Area Sampling and Analysis Plan
AIR MONITORING SYSTEMS DATABASE (AIR MANAGEMENT DATA SYSTEM) 0 Points of Contact
Carol Patnoe, Kaiser-Hill, x2440 Bob Nininger, Kaiser-Hill, x4663 Joann Euler, Radian, x6338
Platform and Location
Current: Version 2, in FoxPro, on Joann Euler's hard drive In the near future: Version 3, in Oracle and on network Data are now delivered as environmental data'deliverables (EDDs) (only recently).
. . . . . . . . . . . . .- -~ . . . . . . . . . . . . . . . . . . -.:_ . . . . . . _. .... __ ..4< . . . . . . . . . . . . . . . . . . . . . . . . . . . . . . . . . _.-- . . .-. _ . . .
Content
e
e
Routine: Data from effluent and ambient samplers, a tritium bubbler in the Building 776 stack, and meteorological stations. Effluent samplers are in a number of radionuclide- process building stacks. Ambient samplers are around the Site perimeter, in the buffer zone, near and in the Protected Area (PA), and near the 903 Pad. Samples are collected on oil impactor pads and fiberglass filters. Perimeter samples are collected monthly, and select on-site samples are collected weekly; all are screened for gross alpha. Weekly samples from the select stations are composited every 4 or 5 weeks and analyzed for isotopic concentrations of plutonium (Pu), americium (Am), and uranium (U).
Ambient data are presented in concentration reports, by size fiaction and location. Effluent data are presented by concentration and total isotopic release reports, by location, and isotope. All reports include propagated analytical uncertainties.
Amount and type of data collected has changed over the years, as well as the number of stations used and the frequency that samples have been collected and analyzed.
Special Projects: Data for individual projects (e.g., Trench -1) are not in the database. They are stored on spreadsheets.
-
Quarterly interpreted data sets for ambient and effluent air concentrations and meteorological summaries are being stored and stacked in the Integrated Sitewide Environmental Data System (ISEDS). Quarterly data summaries are on Environmental Data Dynamic Information Exchange (EDDIE) on the Internet.
Time Period Covered
System includes all data types and months since January 1997. Pre- 1997 data are on spreadsheets. The plan is to migrate data to database for a select, presently undefined, earlier period.
I

Preliminary Data Quality Objectives for the Industrial Area Sampling and Analysis Plan
a Quality Assurance Validation and Verification (V&V) codes are assigned to data from off-site laboratory. No V&V codes were assigned prior to Fiscal Year (FY)99, however all data have been reviewedqualified since analysis was conducted off-site (i.e., since April 1997). Some pre-1997 data may have been qualified; however, there is some concern regarding documentation. Starting to receive EDDs with qualifiers. Data from special projects are qualified. Other qualifiers are present in the database based on subject matter expert (SME) investigation regarding suspect traceability issues.
- - _ - A___
2

Preliminary Data Quality Objectives for the Industrial Area Sampling and Analysis Plan
SITEWIDE ECOLOGY DATABASE
Points of Contact e ,
e
Steve Nesta, Kaiser-Hill, x6386 Michelle Fink, Exponent, x4084
Platform and Location
Data are entered in an Access '97 database and stored in a data file on a Windows NT file server.
Content
Routine: Database contains data from all ecological monitoring activities (all . contractors). Monitoring activities include vegetation, Preble's Meadow Jumping Mouse, and other small mammal, aquatic, bird, and wildlife surveys. Data are mostly observational.
The database contains only raw data. Data are interpreted in various reports. However, key interpretations, such as vegetation coverages, and mouse coverages are available in the Site Geographic Information System (GIs) and the ecological GIS system. Typically, once the work is final, the interpreted map of vegetation or species distribution is filed in the Site GIS files with RMRS. Although the Ecology Group owns the data, the final interpreted data sets/GIS coverages are available to users for analysis purposes. Documentation of the data is kept in the RMRS GIS system according to their established filing system.
Special Projects: Some project-specific monitoring is conducted (e.g., to evaluate re- seeding performance associated with the Trench- 1 cover, or assess impacts of the plume barrier projects). Results are entered into the database and copies are provided to the RMRS GIS system. -
Time Period Covered
FY91 - present
Oualitv Assurance
Only data of a certain quality are stored in the database. The quality screen started in FY 99, but data from 1991 - 1998 were also screened. Criteria include the following:
Qualified field professional sign-off (1 = yes, 0 = no, counts for 2 points) Methods documented in p l q report, or procedure (1 = yes, 0 = no, counts for 1 point) Data proofreader sign-off (1 = yes, 0 = no, counts for 2 points)
0
0
0
3

Prelilninaiy Data Qirality Objectives for the Industrial Area Sampling and Anaksis Plan
QA procedures documented in plan, report, or procedure (1 = yes, 0 = no, counts for 1 point) Original datasheets available (1 = yes, 0 = no, counts for 1 point) Data quality qualifier equals sum of points assigned to each criterion. (Best = 7)
4
. . ... . . . . . . . . . - -.- :.:.
~.. .; -__. . . . . . . . . . . . . . . . . . . . . . . . . . . . . . . . i . . . ._I-?'- . . . . . . . .

Prelittiinaty Data Quality Objectivesfor the Industrial Area Sampling and Analysis Plan
SOILNATER DATABASE
Points of Contact
Marian Carr, Kaiser-Hill, x4488 Dave Poundstone, Kaiser-Hill x5011
Platform and Location
In Oracle and on a DEC Alpha (Unix-based) server. Data (EDDS) come into the Analytical Services Toolkit (AST) for verification and billing purposes, and are then transferred to Soil/Water Database (SWD) once cursory computer checking has been accomplished on EDD format. Some data from Building 559 laboratory may also be included, but is hand entered or imported from Excel spreadsheets. Schedules currently exist for EDDs from Building 559 laboratory for the various analytical suites. These EDDs will be delivered to the AST system and sent to the SWD SRT just like any other offsite laboratory customer.
- .. - .- 7--
The original hard copy data are located at the Federal Center. None of the analytical data in SWD is the "original and legal copy" of the data. All original analytical data resides in hard copy with the Analytical Services Division either on site or in the Federal Center. The original field data are in logbooks (hard copy) and the field data in SWD are copies of the information in the logbooks.
a Content
Primarily, SWD contains analytical and field data on soil (surface and subsurface), sediment, soil gas, surface water (analytical quality and flow data), and groundwater (quality and hydrogeology). There are some data.on wastes and air quality. There is a Data Package file, which is connected to a permhent analytical results table and a .
pending analytical results table. There are approximately 4 million pieces of data - more than 3.5 million in the permanent analytical results table, and fewer than 0.5 million in the pending analytical results table. -
Data in the pending table are there for various quality reasons that need to be resolved before the data can be delivered to the permanent tables. Some issues involve missing fields from old Rocky Flats Environmental Database System (WEDS) data, and some are more recent "errors" in current EDDs. Staff have been known to use both data sets for reporting. There is also a field event file, which is connected to a "bottle" (sample) file and field measurement file. Detailed diagrams are available that show filehable relationships.
During FYOO, a modified interface for AST and FieldCap (the SWD field data entry module) is being developed to eliminate known duplicate data entry issues that have the potential to impact both data quality and user efficiency.
a 5
I33

Preliminary Data Quality Objectives for the Industrial Area Sampling and Analysis Plan
Data from the WEDS were transferred into SWD (refer to WEDS below).
0 Time Period Covered
SWD was completed during October 1997 and first received EDDs from AST during April 1998. SWD contains all historical WEDS data, going back to 1989 and possibly as far back as 1986. A "dead" copy of WEDS (retired) exists for historical tracking purposes, but is no longer in use.
Quality Assurance
The SWD has quality assurance (QA) qualifiers available, including validation and laboratory result qualifiers. However, not all data in SWD have been qualified.
Data in the pending table are to be assessed and qualified, and then moved to the permanent table. Some data will be labeled as no longer representative (NLR). Current efforts by Analytical Services Division are underway to incorporate missing validation qualifiers on data sets from 1995 to 1998. Validation has already been performed on the data, however qualifiers were never entered.
Validation approaches, including data qualification criteris have varied over time, and older criteria may not be accepted today (GRRASP criteria used through 1997).
.. . . .. . ... ., .... . . . . . .._ . -. - .. Li.,
6

Preliniinury Datu Qua& Objectivesfor the Industrial Area Sampling and Analysis Plan
ROCKY FLATS ENVIRONMENTAL DATA SYSTEM
Points of Contact
Wendell Cheeks, Dyncorp, x7707
0
Platform and Location . . ..- -. .-. . . . . . ._. .. . . . .
Retired in FY99. Exists as historical reference copy 'on CD-ROM-only. J-Jar;d~copy d a h '.' . A ..z '.".'==' are archived at the Federal Center.
Content
Contained data on soil (surface and subsurface), sediment, surface water, and groundwater. Most transferred to SWD. Some data did not meet SWD quality requirements, and therefore, did not get transferred to the permanent SWD table (may still be in the SWD pending table). Some data may be missing (i-e., no longer in WEDS and not in SWD; only in hard copy and archived at the Federal Center). The "missing data" are not well defined. There is a possibility that (1) WEDS "expected" data but was incorrect (i.e., someone thought an EDD was expected but it never existed), and (2) data were sent in EDD on disks and was not incorporated into WEDS. There is also a possibility that ''private databases" exist with these "missing" EDDs.
WEDS still contains sample and data tracking information; however, additional programming would be required to meaningfully retrieve information.
0 Time Period Covered
1989 - April 1997; may include data as old as 19g6.
Quality Assurance
Variable. Some data were verified and validated; some were not. Some data reviewed by QA; some were not. Validation protocols need to be defined in SWD to ensure that users understand the approach used and the meaning o f the validation qualifier codes.
7
35
Preliminaty Data Qualiry Objectives for the Industrial Area Sampling and Analysis Plan
ACTINIDE MIGRATION EVALUATION STUDY
Point of Contact
Chris Dayton, Kaiser-Hill, x9887 Mike Peters, Rocky Mountain Compliance, x5884
- I . -- - .. Platform and Location
Available as Word documents in EDDIE. The data set is small and not stored in any database.
Content
The data set consists of actinide 'transport rates; related soil, water and air transport rates; results from solubility and other transport experiments, and some soil and water data. More data will be collected during FYOO and FYOl . Many of the data are results from modeling, which uses data from other data sets (e.g., air quality and SWD).
Time Period Covered
1997 - present
Oualitv Assurance
Results are verified and validated. Qualifier codes are not used. The quality of model results depends on the quality of data used from other data sets, validity of the model assumptions, and representativeness of the model input parameters.
8
36

Prelitninary Data Quality Objectives for the Industrial Area Sampling and Analysis Plan
ENVIRONMENTAL QUALITY INFORMATION SYSTEMS (EQuIS) DATABASE 0 Points of Contact
Steve Singer, RMRS x3387 Bob Koehler, RMRS x2461
Platform and Location
Data entered in Environmental Quality Information Systems (EquIS) Geology Database.
Content
EquIS is a Site-wide borehole and well log database containing subsurface and geologic descriptions and conditions. The database contains only raw data interpreted from various reports. Information fiom surface soils or shallow borings and excavations are not included. EquIS may also contain data from special projects if boreholes were logged.
Time Period Covered
1986 to Present
Quality Assurance e The Colorado Department of Public Health and Environment (CDPHE) converted data fiom existing Logger logs and fiom data entry. Most historic logs underwent quality control prior to the conversion process. The quality of the deliverable has not yet been evaluated and is therefore U n k n O W n .
9

Preliminary Data Qualily Objectivesfor the Industrial Area Sampling and Analysis Plan
GEOGRAPHIC INFORMATION SYSTEMS (GIS) DATABASE
Points of Contact a
Wendell Cheeks, RMRS x7707 Brian Blaser, DRI for RMRS x7068
Platform and Location
NT Server operating system located on GIS server
Content
The Geographic Information System software used WETS is ARC/INFO from ESFU. GIS is an organized collection of computer hardware, software, geographic data, and personnel designed to efficiently capture, store, update, manipulate, analyze, and display all forms of geographically referenced data.
Time Period Covered
199 1 to Present
Quality Assurance 0 Spatial Data Management Organization (SDMO) conducts the following QA activities: 0 Maintains a list of the most current production spatial data sets;
0 Performs all production spatial data set maintenance;
0 Provides proof maps of the spatial data set to the Originator of Data for review and approval;
Documents all changes to the production spatial data sets;
- 0
Obtains approval from the Originator of Data for new or changed production spatial data sets; and
Provides QC data documentation for each production spatial data set to WETS Technical Publications.
10

PreIiniinaty Data Qual@ Objectivesfor the Industrial Area Sampling and Analysis Plan
MISCELLANEOUS
Points of Contact
Subject Matter Experts (SMEs) (e.g., Steve Singer, RMRS, groundwater data, x3387; Bill Burdelik, RMRS, surface water data, x5 126; Nick Demos, RMRS, soil data, x4605) Project Managers Source One ..... -
. . . ...... . . . ... ...? _/,Y&. . . ,:. . . . . . . . . . . . . . . . . . . . . . . . . . . . . . . . . . . . : . . . . . . . ,. -.q7-L:.: . . . . . . . .
. . . .
Platform and Location
ISEDS - data exchange portal for regulatory agencies, contains interpreted data sets fiom decision documents SME Spreadsheets Project Reports (e.g., data summaries, Resource Conservation and Recovery Act (RCRA) Facility InvestigatiodRernedial Investigation (RFI/RI) reports, remediation reports, reports to regulators [monthly, quarterly and/or annual surface water, groundwater and air]) Project Files Administrative Record Historical Release Reports RCRA Operating Record (release data) Waste Stream Residue Identification and Characterization (WSRIC) (release data) Incidental Water Sampling Results Database Spill Cleanup Records Records Archived at the Federal Center EquIS Geology Database Global Positioning System data
Content
Raw and interpreted data, including data collected after WEDS was out of use and before SWD started receiving data (e.g., surface and subsurface soil, sediment, surface water, and groundwater).
Time Period Covered
Since environmental protection and restoration data were collected.. MeaningfuVuseful data could be as old as 10 to 15 years, or more.
Quality Assurance
Variable. Some data were verified and validated; some were not. Some data were reviewed by QA, some not. Also, QA criteria used likely varied.
1 1

ATTACHMENT 2
COMMENT RESPONSE

& w s to Colorado Department of Public Health and Environment C o m e on the Draft Preliminary Data Quality Objectives for the Industrial A @ Sampling and Analysis Plan
~~~ ~
Responses to CDPHE Comments on the Draft Preliminary Data Quality Objectives for the Industrial Area Sampling and Analysis Plan
- 1.
2.
3.
4.
Comment Section 1.1 - Data Quality Filter Text has been added to this section which explains that validation and verification of historical data will not be performed. This text goes on to describe a process which will “render the data valid.” This process seems to circumvent the Data Quality Filter for the IASAP by which data is validated and verified. The Site can hopefully make use of the available historical data, however, in order to be termed “valid” any data must pass the Data Quality Filter. Section 2.1 - Characterization and Remediation of IHSS, PAC, and UBC Sites. The agencies’ previous comment was not addressed. The following sentence should be added to the end of the section (or to Section 2.3): “This AL comparison will’ not, however, determine if designated land uses are acceptable, because Areas of Concern (AOCs) are not equivalent to the exposure units @Us) required for the CRA.” Section 2.1.1 - The Problem The problem should be stated in terms of data needs. The following is suggested: “The nature and extent of contamination must be known with adequate confidence to make remedial decisions. Data of sufficient quality and quantity must be available in order to perform an AL comparison as specified in the RFCA Implementation Guidance Document (IGD). Section 2.1.3 - Inputs to the Decisions Items 4)b), 4)e) and 4)f) involve comparison to background,
,
1
Response Text was added to Section 1.1, page 3 to address this comment. .
The Preliminary Data Quality Objectives (DQOs) for the IASAP are not intended to evaluate the acceptability of designated Rocky Flats Cleanup Agreement (RFCA) land use. Additional text on AOCs has been added to Sections 2.1,2.1.5, [2] and [3], and 2.3. Additional text on EUs has been added to Section 2.3.
The suggested text was added to Section 2.1.1 , page 5.
. .:
The comparison to background is needed because some :oncentrations may be below background but above RFCA Tier I1

a o n s e s to Colorado Department of Public Health and Environment C o m a on the Draft Preliminay Data Quality Objectives for the Industrial A# 4 Y Sampling and Analysis Plan
Comment which is an extra’step that is superfluous to an action level comparison.
Item 4) f ) implies that data will be aggregated only if there is an exceedance above the Tier I action level. This is contrary to the ALF, which requires removal or remediatiodmanagement for areas of contamination exceeding Tier I. The IGD states that data aggregation may be inappropriate for some areas with Tier I exceedances since hotspots might be overlooked. According to the IGD, aggregating data over an AOC is a tool to determine spatial extent of contamination in order to plan remedial actions. This tool cannot be used to render Tier I hotspots innocuous. Section 2.1.5 - Decision Rules All decision rules in this section pertain to AOCs, which were defined in the previous section. This focus on AOCs could be stated in the fvst paragraph. It is confusing in Decision Rule 1 to still be discussing IHSS, PAC or UBC site boundaries.
Decision Rule 3, comparison to background, is an extra step that is superfluous to an action level comparison.
Decision Rule 4 implies that if any data point within an AOC is below Tier 11, the AOC qualifies {or No Further Action. This rule should state: “If each data point is below the tier I1 AL y d the sum of the ratios of each soil data point to its respective Tier I1 AL for
Response Action Levels (ALs). Soil data values below background will not be carried forward for additional evaluation. Text has been added to Section 2.1.5, Decision Rule 3, to clarify this concept.
The text has been changed in Sections 2.1.3, [4][fJ and 2.2.3, [6][fl to indicate that data will be aggregated for sites with soil data values above Tier I1 ALs. Text has been added to these sections 2.1.3,4)f) and 2.2.3,6)f) to clarify that data aggregation may not be appropriate for some areas with Tier I exceedances.
Decision Rule 1 addresses whether an IHSS, PAC, or UBC site needs to be further characterized. The AOC will be determined based on existing or characterization data and cannot be determined until Decision Rule 1 is passed. Decision Rule 1 has been revised to eliminate the reference to site boundaries.
Soil data values below background will not be carried forward for additional evaluation. Text has been added to Section 2.1 S , Decision Rule 3, to clarify this concept.
The text in Sections 2.1.5 and 2.2.5, Decision Rules 4 was revised to include the suggested text.
2

a o n s e s to Colorado Department of Public Health and Environment C o m a on the Draft Preliminary Data Quality Objectives for the Industrial A r m Sampling and Analysis Plan
Comment both radionuclides and non-radionuclides - is below 1, then no evaluation, management, or remediation is necessary.” ~
Decision Rule 5 should state: “. . .are greater than or equal to 1 , then additional data evaluation. as described in Decision Rules 7. 8. and 9. is
- 6.
7.
3
7, necessary.
Decision Rule 7 reverses the logic in ALF regarding action level determination. Evaluations mentioned in Decision Rule 8 may indeed require remediation of soils below Tier I. This step should state, “. . .within an AOC are greater than or equal to 1, then the soil needs to be remediated or managed in accordance with RFCA requirements. Otherwise, the soil will be evaluated for Tier I1 exceedances as described in Decision Rule 8.” Sections 2.1.6, 2.2.6, and 2.3.6 - Tolerable Limits on Decision Errors As stated in our previous comment, the maximum uncertainties stated here may need to be reviewed, since the minimum detectable relative differences and the data variability are unknown. Sections 2.1.7 and 2.2.7 - Optimization of Plan Design Information on how to determine an AOC and on “sampling requirements and densities” is not fqund in Sections 2.1.5 or 2.2.5. Sections 2.1.3.4)f) and 2.2.3.6)f) discuss establishing an AOC, but more specific directions should be prescribed in this document, in the IASAP, or in the IGD. If these
Response
The text in Section 2.1.5, Decision Rule 5, has been changed to “greater than or equal to.” Additional text has been added Decision Rule 5 that incorporates t6e suggested text to clarify how aggregation and evaluation will be conducted. The text “greater than or equal to” has also been added to Section 2.1.5, Decision Rules 6,7, and 8, and Section 2.2.5, Decision Rules 4,5, 6, and 8.
The text in Section 2.1.5, Decision Rule 7, has been changed to “greater than or equal to.” Additional text has been added to this decision rule to state that an action will be taken according to RFCA requirements. All decisions rules must be considered; therefore, soil with concentrations below Tier I1 ALs will be evaluated for Tier I1 exceedances in accordance with Decision Rule 8. In addition, Figure 2 has been added to clarify the decision process.
Text has been added to Sections 2.1.6,2.2.6, and 2.3.6 to clarify that characterization of data will be evaluated.
The text has been revised in Sections 2.1.7 and 2.2.7 to reflect the correct reference for AOC determination.

onses to Colorado Department of Public Health and Environment c o m e on the Drafl Preliminary Data Quality Objectives for the Industrial A r m and Analysis Plan
~
8.
9.
- 10.
11.
-
Comment directions are outside this document, they should be referenced. Section 2.2.1 - The Problem The current IMP does not address sampling of contaminated media that may be released during a remediation project. .
IMP monitoring should not be the only way to make sure that contamination has not been spread outside of the remediation areas. Samples must also be taken as part of the remediation project along haul routes, etc.
Section 2.2.3 - Inputs to the Decisions. Steps 6)b), 6)e) and 6)f) involve comparisons to background, which is an extra step that is superfluous to an action level comparison. Section 2.2.4 - Decision Boundgries Confirmation sampling cannot be confined to the area remediated if there is any possibility of spreading of contamination during remediation.
The determination of AOCs and COCs are not described in Section 2.2.2 as stated in Items 1) and 3). Section 2.2.5 - Decision Rules Decision Rule 2, comparison to background is an extra step that is superfluous to an action level comparison.
Decision Rule 5 describes a process-pat would allow DOE to average away any exceedances above Tier I levels. This is not consistent with the ALF’s intent. See comment 4 above.
Response
The current (FY2000) IMP includes support for project-specific surface water, groundwater, and air monitoring. Soil sampling will be conducted if there is evidence to suggest a release has occurred based on IMP or other project-specific monitoring data. Otherwise, soil sampling of areas outside the AOC will be conducted as part of the CRA characterization sampling. Text has been added to Sections 2.2.1,2.2.2, and 2.2.5 to indicate that project-specific monitoring data willlalso be used to determine whether releases may have occurred. Soil data values below background will not be carried forward for additional evaluation. Text has been added to Section 2.2.5, Decision Rule 2, to clarify th is concept.
Soil sampling will be conducted if there is evidence to suggest a release has occurred based on IMP or other project-specific monitoring data. Otherwise, soil sampling of areas outside the AOC will be conducted as part of the CRA characterization sampling.
The text in Section 2.2.4, [ 13 and [3] has been revised to reflect the correct reference for AOC and COC determinations. Soil data values below background will not be carried forward for additional evaluation. Text has been added to Section 2.2.5, Decision Rule 2, to clarify this concept.
Text has been added to Section 2.2.3, [6][Q to clarify that data aggregation may not be appropriate for some areas with Tier I exceedances.
4

e o m e s to Colorado Department of Public Health and Environment C o m a on the Drafi Preliminary Data Quality Objectives for the Industrial A m Sampling and Analysis Plan
-
- 12.
- 13.
- 14.
Comment Decision Rule 6 should state, “further evaluation or management is required in accordance with RFCA requirements.” Section 2.3 - Final Characterization of the Industrial Area for the CRA In the CRA, the AOCs are based on Exposure Units developed for a particular land use. The text in this section does not make it clear that the AOCs for the CRA have a different basis than the AOCs used for IHSS Characterization. For example, the last sentence in this section refers to “white spaces”, which will not exist. separately from AOCs based on Exposure Units. An individual Exposure Unit may be entirely white space in order to aggregate the data in a stahtically valid way Section 2.3.3 - Inputs to the Decisions This section should clarify that the Data Filter will reject data that originated in areas that were subseqtiently remediated. . Section 2.3.5 - Decision Rules Establishing 1 O4 as the decision break point in Decision Rule 3)a) disregards CERCLA’s 1 O4 point of departure.
The alternative action statements for the five criteria. under
Response The text in Section 2.2.5, Decision Rule 6, has been revised to include the suggested text.
Additional text has been added to Sections 2.1,2.1.5, and 2.3 to clarify the AOC and EU descriptions.
Text has been added to Section 2.3.3, [l] to clarify that data used for the CRA will pass the Data Quality Filter.
The 1 O9 is appropriate in accordance yith the RFCA IGD. As referenced in the IGD, Section 3.6.3, Comprehensive Risk Assessment: the preamble to the National Contingency Plan (NCP) discusses risk in the remedy selection process in 40 Code of Federal Regulations (CFR) 300.430(e). The preamble at 55 FR8712 states, “EPA selects remedies resulting in cumulative risks that fall within a range o ~ I O - ~ to IO-6.” OSWER Directive 9355.0-30 (EPA 1991) more specifically states that, “#or sites where the cumulative site risk to an individual based on reasonable maximum exposure for both current andfirture land use is less than I 0-4, action is generally not warranted .... J ,
5

9

Fig ure3 Confirmation Sampling DQA Logic Flow Diagram
Decision: Determine Whether Remediation was Complete and Successful
I
. Rejectoats Are IA data m b l e ChnaEtetlzntlon Sample Amtytlcd BasedonlACata
Determine Roto for IHSSS, ma, and UBC s ib InlAGroup
Dkqualify COC fmm further
consideration ksthandetectionlitnits?
6valu*e or manage the mUm of a the Aoc as Ilecesoay -
. Takeation
I S t h e l l d l O
Evalulte or manage the AoC as necesary e S(lmOftheraHOSOfthe95!4
r 7 a r U Ws, and C 1 a d t h s u f w allcocsw
No

Figure 4 Comprehensive Risk Assessment Sampling DQA Logic Flew O h
Decisions Haseach W a n d Us natumand extent within IliSSs, PA-. UBC sites: and associated AOCs and White Space areas been Mentlfled W M adequata caffdence?
Am bngderm r M s to receptors in an EU acceptable. based on pastclosure Usas?
Are long-tam, rk4c!3 to onsite and off& receptors vh the alr and surface water pathways acceptable, based on post-dosUre uses?
Does mstdual contamination within an ERA N represent an accepghle ecologlcal ria due to direct contact with a b W media?

Figure 2 Characterization Sampling DQA Logic Flow Diagram
Decision: Determine the Nature and Extent of Contamination in IHSSs, PACs, and UBC Sites