preliminary investigation of biotic and abiotic factors ... nicola...preliminary investigation of...
TRANSCRIPT

Preliminary investigation of biotic and abiotic factors involved in carbon biogeochemical cycling in open water areas at Greenwoods Conservancy
and Thayer Farm, NY
Nicola A. McEnroe1 & Zachary Burriss2
INTRODUCTION Most carbon (C) biogeochemical studies and detailed limnological studies
have been carried out in boreal, temperate and tropical lakes, which are much larger and deeper than open water areas commonly found on most wetlands. Studies show that within most temperate lakes the net transfer is usually of C into the lake to support net algal productivity (Cole et al., 1994; Cole, 1999, Riera et al., 1999; Sobek et al., 2005). Whereas for many boreal and arctic lakes, C is released continually as carbon dioxide (CO2) throughout the year, most being “net heterotrophic” with allochthonous C suggested to be the primary driver of productivity (Striegl et al., 2001; Sobek et al., 2003; Hanson et al., 2004; Kritzberg et al., 2005). A recent study showed that a number of relatively small, shallow (< 1 m) open water pools on a northern peatland were sources of both CO2 and methane (CH4) (McEnroe et al., 2009). It was also demonstrated, that this same series of pools were supersaturated with CO2 and CH4 with respect to atmospheric equivalent values (McEnroe et al., submitted), similar to findings for other freshwater systems (Cole et al., 1994).
Limnological factors related to water column depth, such as light penetration
and temperature, and abiotic factors such as dissolved oxygen (DO) and dissolved organic carbon (DOC) concentrations are essential components of C biogeochemical cycling in freshwater ecosystems. In many wetlands, these relationships between C (CO2, CH4, DOC), water column physico-chemical and biological parameters have not yet been fully explored. Dissolved inorganic carbon (DIC) and DO are commonly measured to establish changes in metabolism within freshwater systems, however changing concentrations are not only dependent on metabolism but also on factors such as water temperature, exchange with atmosphere, abiotic reactions and inputs from precipitation and groundwater (Hanson et al., 2006). Constructing these C budgets is an important component in understanding wetland metabolism and biogeochemistry, as well as the assessment of gradients of DIC and DOC, profiles of temperature, light, DO and sediment characteristics. Such measurements can be used to monitor changing C dynamics over time and changing aquatic metabolic status. Results can also shed insight into questions about responses to climate driven environmental change. The objectives of this study were to establish the baseline conditions against which net changes in C biogeochemical cycling due to land-use and climate driven environmental change can be assessed and to establish the key biotic and abiotic factors involved. This study is a preliminary investigation towards establishing permanent sampling sites for C biogeochemical cycling in local wetland ecosystems.
1 Assistant Professor, Environmental Sciences Program, SUNY Oneonta, NY, 2009 recipient of Greenwoods Faculty research stipend 2 Undergraduate student, Environmental Sciences Program, SUNY Oneonta.

STUDY SITES Cranberry Bog is located within Greenwoods Conservancy in Burlington, NY.
The Conservancy is owned by the Petersen Family Trust and is a 1200+ acre nature preserve protected by conservation easements held by the Otsego Land Trust. Cranberry Bog is approximately 70 acres and has characteristics of both a bog and fen, with large open water areas and a floating Sphagnum spp. dominated mat (Figure 1). A series of small vernal pools were created in summer 2008 just north of the main entrance to the bog, along Seldom Seen Trail.
In Cranberry Bog, the major vegetation species found are Acer rubrum (red
maple), Alnus incana (speckled alder), Andromeda glaucophylla (bog rosemary), Aronia melanocarpa (black chokeberry), Chamaedaphne calyculata (leather-leaf), Drosera rotundifolia (roundleaf sundew), Eriophorum virginicum (cotton grass), Juncus stygius (moor rush), Pinus strobes (white pine), Rhyncospora alba (white beak-rush), Sarracina purpurea (pitcher plant), Spirea alba (meadowsweet), Thelypteris palustris (eastern marsh fern), Triadenum fraseri (marsh St. Johnswort), Vaccinium oxycoccos (small cranberry) (after Saba, 2002), with Nuphar lutea (yellow pond-lily) found in open water areas. Leather-leaf (Chamaedaphne calyculata) and speckled alder (Alnus incana), both native to Cranberry Bog, have formed dense thickets on the Sphagnum spp. dominated mats (Saba, 2002). These two species have tended to reduce the diversity of other bog plants such as Pogonia ophioglossoides (Rose pogonia) (O’Dea, pers.comm.). A wetland plant survey was undertaken at Zachow Road wetland in 2002 (Gray, 2003), a leather-leaf and speckled alder survey in 2002 (Harman, 2003), a deer browsing survey in 2003 (Burgess, 2004), a fish survey of Cranberry Bog in 2006 (Scorzafava, 2007) and a floral survey of Big Meadow in 2008 (Searles & Ryburn, 2009). No data were found on Cranberry Bog open water physico-chemical properties.
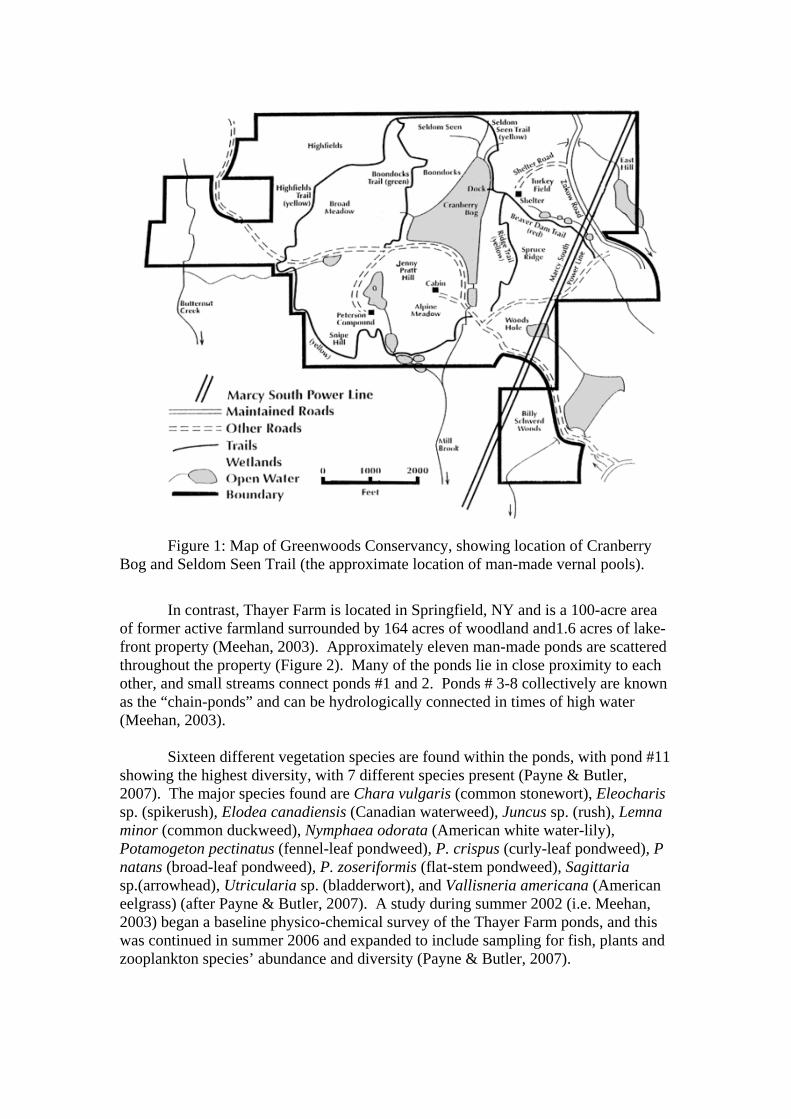
Figure 1: Map of Greenwoods Conservancy, showing location of Cranberry Bog and Seldom Seen Trail (the approximate location of man-made vernal pools).
In contrast, Thayer Farm is located in Springfield, NY and is a 100-acre area of former active farmland surrounded by 164 acres of woodland and1.6 acres of lake-front property (Meehan, 2003). Approximately eleven man-made ponds are scattered throughout the property (Figure 2). Many of the ponds lie in close proximity to each other, and small streams connect ponds #1 and 2. Ponds # 3-8 collectively are known as the “chain-ponds” and can be hydrologically connected in times of high water (Meehan, 2003).
Sixteen different vegetation species are found within the ponds, with pond #11
showing the highest diversity, with 7 different species present (Payne & Butler, 2007). The major species found are Chara vulgaris (common stonewort), Eleocharis sp. (spikerush), Elodea canadiensis (Canadian waterweed), Juncus sp. (rush), Lemna minor (common duckweed), Nymphaea odorata (American white water-lily), Potamogeton pectinatus (fennel-leaf pondweed), P. crispus (curly-leaf pondweed), P natans (broad-leaf pondweed), P. zoseriformis (flat-stem pondweed), Sagittaria sp.(arrowhead), Utricularia sp. (bladderwort), and Vallisneria americana (American eelgrass) (after Payne & Butler, 2007). A study during summer 2002 (i.e. Meehan, 2003) began a baseline physico-chemical survey of the Thayer Farm ponds, and this was continued in summer 2006 and expanded to include sampling for fish, plants and zooplankton species’ abundance and diversity (Payne & Butler, 2007).
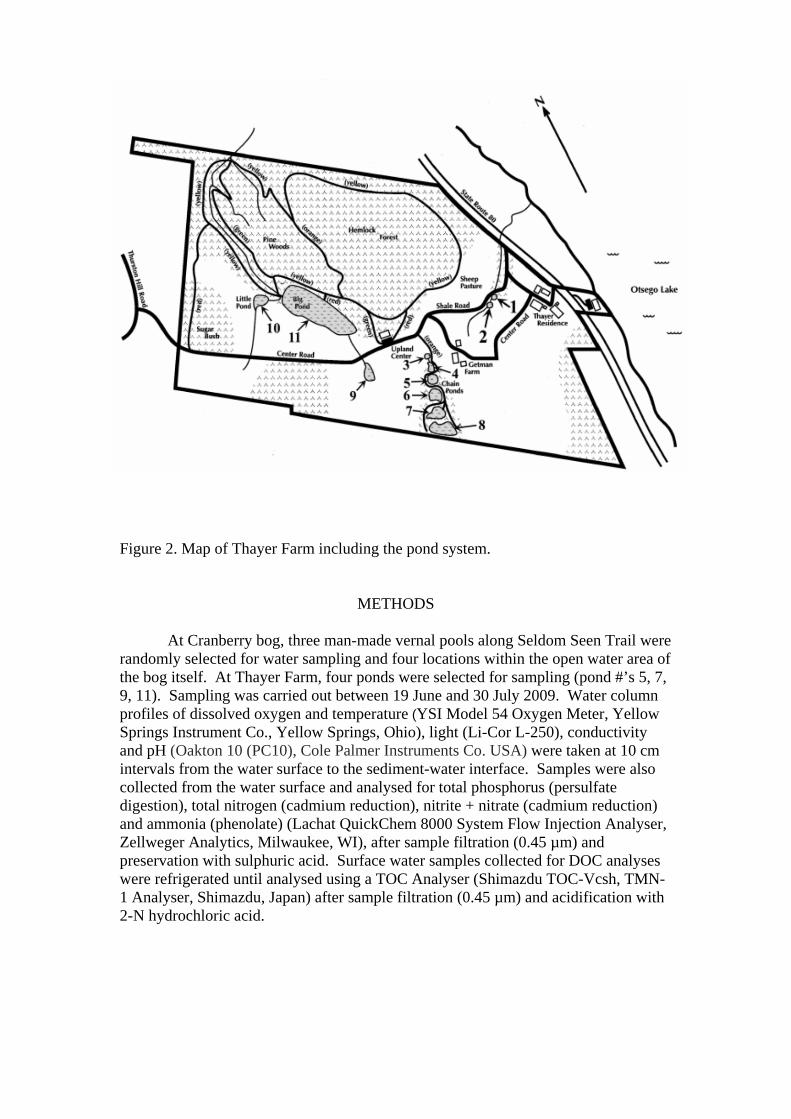
Figure 2. Map of Thayer Farm including the pond system.
METHODS
At Cranberry bog, three man-made vernal pools along Seldom Seen Trail were randomly selected for water sampling and four locations within the open water area of the bog itself. At Thayer Farm, four ponds were selected for sampling (pond #’s 5, 7, 9, 11). Sampling was carried out between 19 June and 30 July 2009. Water column profiles of dissolved oxygen and temperature (YSI Model 54 Oxygen Meter, Yellow Springs Instrument Co., Yellow Springs, Ohio), light (Li-Cor L-250), conductivity and pH (Oakton 10 (PC10), Cole Palmer Instruments Co. USA) were taken at 10 cm intervals from the water surface to the sediment-water interface. Samples were also collected from the water surface and analysed for total phosphorus (persulfate digestion), total nitrogen (cadmium reduction), nitrite + nitrate (cadmium reduction) and ammonia (phenolate) (Lachat QuickChem 8000 System Flow Injection Analyser, Zellweger Analytics, Milwaukee, WI), after sample filtration (0.45 µm) and preservation with sulphuric acid. Surface water samples collected for DOC analyses were refrigerated until analysed using a TOC Analyser (Shimazdu TOC-Vcsh, TMN- 1 Analyser, Shimazdu, Japan) after sample filtration (0.45 µm) and acidification with 2-N hydrochloric acid.
RESULTS & DISCUSSION
Physico-chemical characteristics
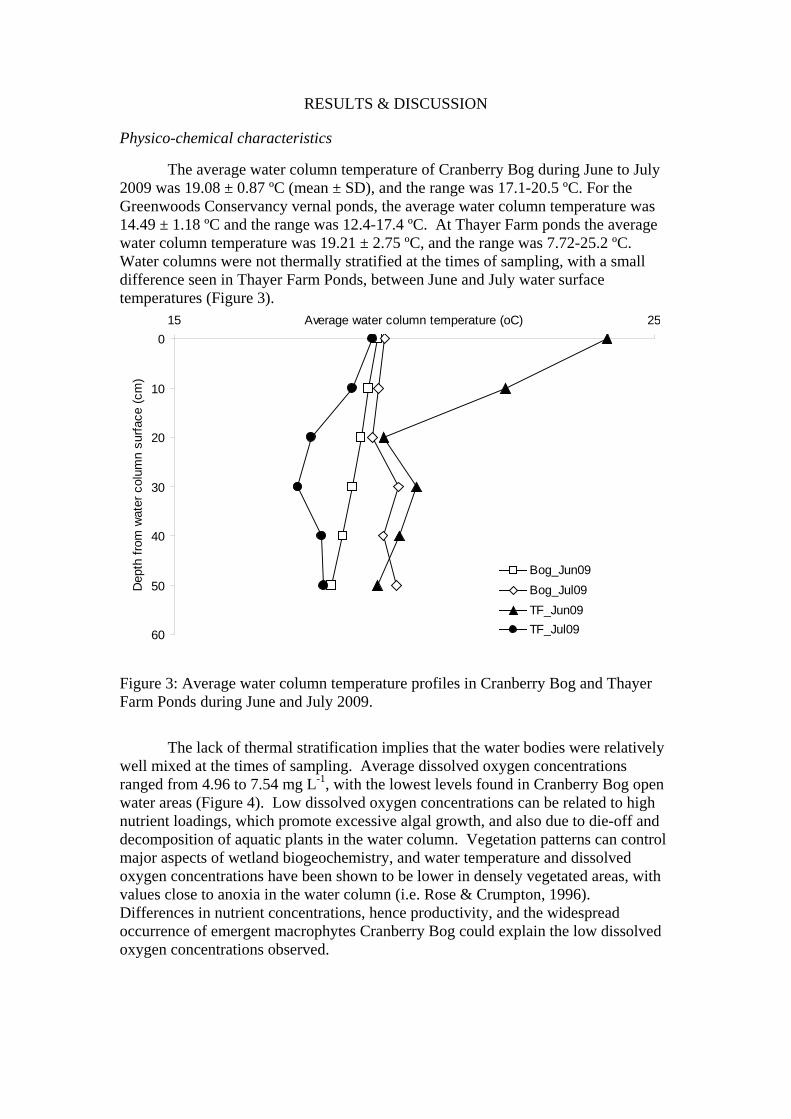
The average water column temperature of Cranberry Bog during June to July 2009 was 19.08 ± 0.87 ºC (mean ± SD), and the range was 17.1-20.5 ºC. For the Greenwoods Conservancy vernal ponds, the average water column temperature was 14.49 ± 1.18 ºC and the range was 12.4-17.4 ºC. At Thayer Farm ponds the average water column temperature was 19.21 ± 2.75 ºC, and the range was 7.72-25.2 ºC. Water columns were not thermally stratified at the times of sampling, with a small difference seen in Thayer Farm Ponds, between June and July water surface temperatures (Figure 3).
Figure 3: Average water column temperature profiles in Cranberry Bog and Thayer Farm Ponds during June and July 2009.
The lack of thermal stratification implies that the water bodies were relatively well mixed at the times of sampling. Average dissolved oxygen concentrations ranged from 4.96 to 7.54 mg L-1, with the lowest levels found in Cranberry Bog open water areas (Figure 4). Low dissolved oxygen concentrations can be related to high nutrient loadings, which promote excessive algal growth, and also due to die-off and decomposition of aquatic plants in the water column. Vegetation patterns can control major aspects of wetland biogeochemistry, and water temperature and dissolved oxygen concentrations have been shown to be lower in densely vegetated areas, with values close to anoxia in the water column (i.e. Rose & Crumpton, 1996). Differences in nutrient concentrations, hence productivity, and the widespread occurrence of emergent macrophytes Cranberry Bog could explain the low dissolved oxygen concentrations observed.
0
10
20
30
40
50
60
15 25Average water column temperature (oC)
Dep
th f
rom
wat
er c
olum
n su
rfac
e (c
m)
Bog_Jun09
Bog_Jul09
TF_Jun09
TF_Jul09

Figure 4: Average water column temperature (ºC) and average dissolved oxygen concentrations (mg/L) in Cranberry Bog, Greenwood Conservancy vernal pools and Thayer Farm Ponds during June to July 2009.
Overall, average June concentrations were higher in both Cranberry Bog and Thayer Farm ponds, with levels in the bog open water areas close to anoxia (4 mgL-1). There was some water column stratification > 20-30 cm deep in the bog open water areas in July 2009 and in the Thayer Farm ponds during both June and July 2009 with regards to dissolved oxygen concentrations (Figure 5).
Figure 5: Average dissolved oxygen profiles in Cranberry Bog and Thayer Farm Ponds during June and July 2009.
0
10
20
30
40
50
60
0 2 4 6 8 10 12
Average dissolved oxygen (mg/L)
Dep
th f
rom
wat
er c
olum
n su
rfac
e (c
m)
Bog_Jun09
Bog_Jul09
TF_Jun09
TF_Jul09

Average conductivity in these open water areas ranged from 58.43 to 178.49 µs cm-1, with the lowest conductivity found in the Cranberry Bog and the highest in the Thayer Farm ponds. The range of pH did not vary greatly during June and July, with Cranberry Bog open water areas at approximately pH 6, and the Greenwood Conservancy vernal pools and Thayer Farm ponds at approximately pH 7 (Table 1). Table 1: Average water column conductivity and pH between June and July 2009 (mean ± SD, range). Site Conductivity (us cm-1) pH (pH units) n Cranberry Bog 58.43 ± 77.04 (26-321) 6.64 ± 0.33 (6.1-7.32) 15 Greenwood Conservancy ponds
72.39 ± 18.49 (7.15-97.4) 7.02 ± 0.31 (6.46-7.57) 20
Thayer Farm ponds 178.49 ± 83.86 (14.7-347) 7.26 ± 0.42 (6.56-8.24) 20
Nutrients and dissolved organic carbon
The average ammonia concentration in Cranberry Bog during June and July 2009 was 0.03 ± 0.02 mg L-1 (mean ± SD) and the range was 0.02-0.07 mgL-1. For nitrate plus nitrite concentrations, values were 0.046 ± 0.01 mgL-1 (0.03-0.07 mgL-1), average total nitrogen concentrations were 0.51 ± 0.06 mgL-1 (0.4-0.6 mgL-1) and average total phosphorous concentrations were 23.10 ± 75 µgL-1 (15.36-42.96 µgL-1).
For Greenwoods Conservancy vernal pools, average ammonia concentrations were 0.03 ± 0.01 mgL-1 (0.02-0.05 mgL-1), average nitrate plus nitrite concentrations were 0.045 ± 0.009 mgL-1 (0.03-0.06 mgL-1), average total nitrogen concentrations were 0.44 ± 0.21 mgL-1 (0.2-0.8 mgL-1) and average total phosphorous concentrations were 102.7 ± 198.3 µgL-1 (26-758 µgL-1).
In Thayer Farm ponds, average ammonia concentrations were 0.03 ± 0.01
mgL-1 (0.02-0.06 mgL-1), average nitrate plus nitrite concentrations were 0.06 ± 0.03 mgL-1 (0.03-0.1 mgL-1), average total nitrogen concentrations were 0.49 ± 0.14 mgL-1 (0.2-0.7 mgL-1) and average total phosphorous concentrations were 161.8 ± 578 µgL-1 (14.36-3217 µgL-1) (Figures 6 & 7).
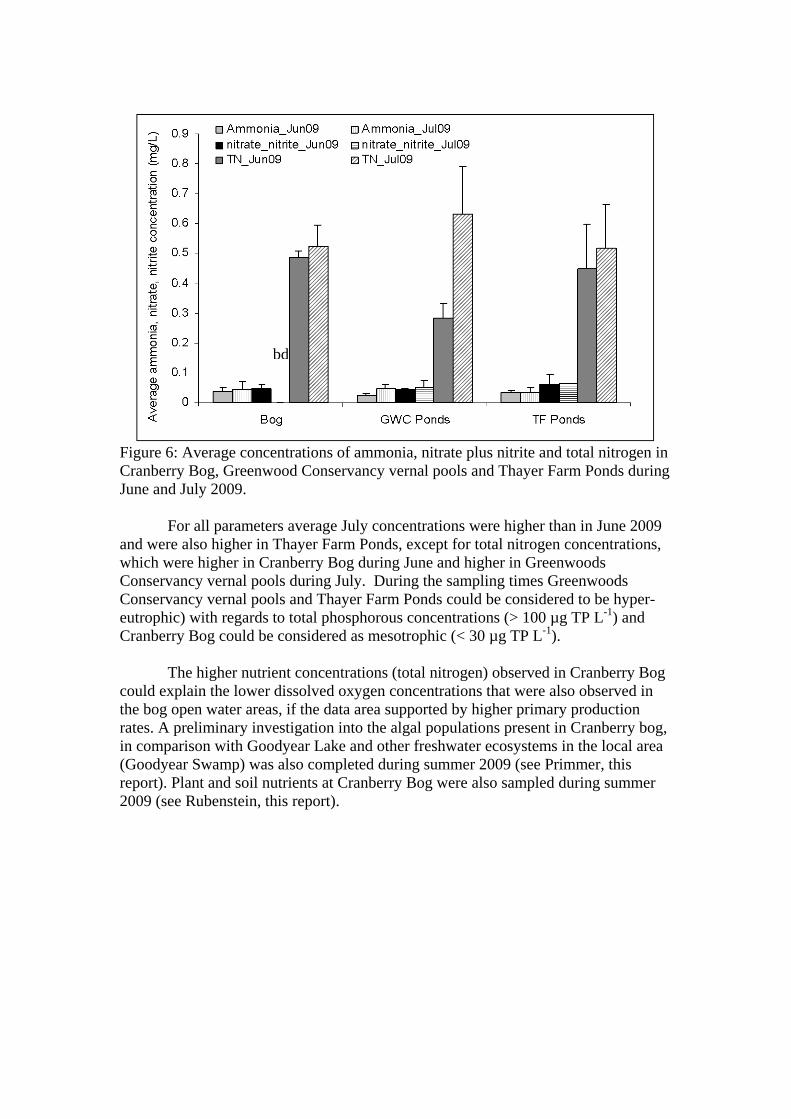
Figure 6: Average concentrations of ammonia, nitrate plus nitrite and total nitrogen in Cranberry Bog, Greenwood Conservancy vernal pools and Thayer Farm Ponds during June and July 2009.
For all parameters average July concentrations were higher than in June 2009 and were also higher in Thayer Farm Ponds, except for total nitrogen concentrations, which were higher in Cranberry Bog during June and higher in Greenwoods Conservancy vernal pools during July. During the sampling times Greenwoods Conservancy vernal pools and Thayer Farm Ponds could be considered to be hyper-eutrophic) with regards to total phosphorous concentrations (> 100 µg TP L-1) and Cranberry Bog could be considered as mesotrophic (< 30 µg TP L-1).
The higher nutrient concentrations (total nitrogen) observed in Cranberry Bog
could explain the lower dissolved oxygen concentrations that were also observed in the bog open water areas, if the data area supported by higher primary production rates. A preliminary investigation into the algal populations present in Cranberry bog, in comparison with Goodyear Lake and other freshwater ecosystems in the local area (Goodyear Swamp) was also completed during summer 2009 (see Primmer, this report). Plant and soil nutrients at Cranberry Bog were also sampled during summer 2009 (see Rubenstein, this report).
bd

Figure 7: Average total phosphorous concentrations in Cranberry Bog, Greenwood Conservancy vernal pools and Thayer Farm Ponds during June and July 2009.
Dissolved organic carbon concentrations in July ranged from 5.3 to 19.17 mg L-1, with the highest concentrations found in Greenwoods Conservancy vernal pools. Average concentrations in Cranberry Bog were 10.68 ± 0.53 mgL-1 (10.07-11.36 mgL-1), in Greenwoods Conservancy vernal pools 17.59 ± 1.42 mgL-1 (16.38-19.17 mgL-1) and in Thayer Farm ponds 7.45 ± 0.8 mgL-1 (5.3-8.11 mgL-1). All concentrations were above the value where freshwater ecosystems are suggested to be “net heterotrophic” (> 5 mgL-1).
Comparing past and present values for Thayer Farm ponds, there does not
appear to have been any major changes in basic water column physico-chemical characteristics since a baseline study in 2006 (water temperature, dissolved oxygen and conductivity) (Figure 8). However, average total nitrogen concentrations were higher in June 2009 compared to June 2006 and total phosphorous concentrations were lower in June 2009 compared to June 2006 (Table 2).
Hyper-eutrophic
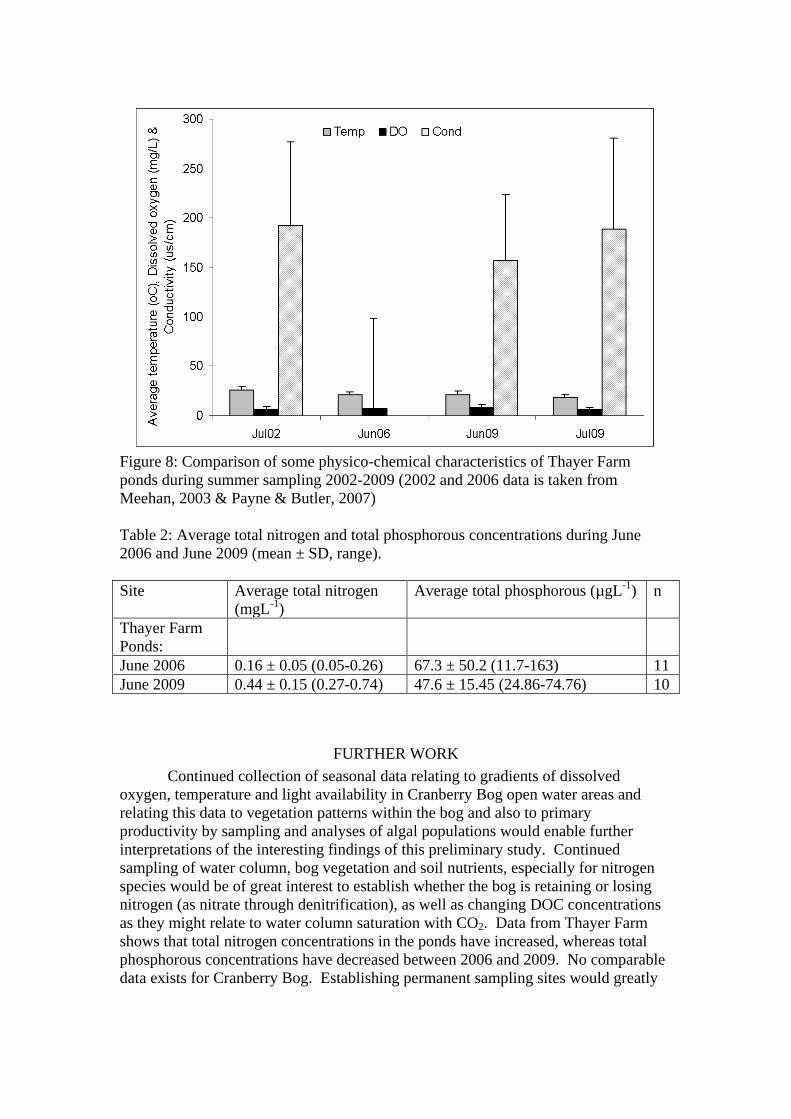
Figure 8: Comparison of some physico-chemical characteristics of Thayer Farm ponds during summer sampling 2002-2009 (2002 and 2006 data is taken from Meehan, 2003 & Payne & Butler, 2007) Table 2: Average total nitrogen and total phosphorous concentrations during June 2006 and June 2009 (mean ± SD, range). Site Average total nitrogen
(mgL-1) Average total phosphorous (µgL-1) n
Thayer Farm Ponds:
June 2006 0.16 ± 0.05 (0.05-0.26) 67.3 ± 50.2 (11.7-163) 11 June 2009 0.44 ± 0.15 (0.27-0.74) 47.6 ± 15.45 (24.86-74.76) 10
FURTHER WORK Continued collection of seasonal data relating to gradients of dissolved oxygen, temperature and light availability in Cranberry Bog open water areas and relating this data to vegetation patterns within the bog and also to primary productivity by sampling and analyses of algal populations would enable further interpretations of the interesting findings of this preliminary study. Continued sampling of water column, bog vegetation and soil nutrients, especially for nitrogen species would be of great interest to establish whether the bog is retaining or losing nitrogen (as nitrate through denitrification), as well as changing DOC concentrations as they might relate to water column saturation with CO2. Data from Thayer Farm shows that total nitrogen concentrations in the ponds have increased, whereas total phosphorous concentrations have decreased between 2006 and 2009. No comparable data exists for Cranberry Bog. Establishing permanent sampling sites would greatly

enhance the interpretation and explanation of future results relating to the biotic and abiotic factors involved in C biogeochemical cycling.
REFERENCES Burgess, H. 2004. Management of white-tailed deer (Odocoileus virinianus) at
Greenwoods Conservancy, Burlington, NY. In 36th Annual Report (2003), SUNY Oneonta Biol. Fld. Sta., SUNY Oneonta.
Cole J.J., Caraco N.F., Kling G.W. and Kratz T.K. 1994. Carbon dioxide
supersaturation in the surface waters of lakes. Science 265: 1568-1570. Cole, J.J. 1999. Aquatic microbiology for ecosystem scientists: New and recycled
paradigms in ecological microbiology. Ecosystems, 2: 215-225. Gray, M.S. 2003. Zackow Road Wetland Project: Wetland Plant identification and
delineation. In 35th Annual Report (2002), SUNY Oneonta Biol. Fld. Sta., SUNY Oneonta.
Hanson P.C., Pollard A.I., Bade D.L., Predick K., Carpenter S.R. and Foley J.A.
2004. A model of carbon evasion and sedimentation in temperate lakes. Global Change Biology, 10: 1285-1298.
Hanson, P.C., Carpenter, S.R., Armstrong, D.E., Stanley, E.H. and Kratz, T.K. 2006.
Lake dissolved inorganic carbon and dissolved oxygen: Changing drivers from days to decades. Ecological Monographs, 76(3): 343-363
Harman, J. 2003. Third year monitoring of leather-leaf (Chamaedaphne calyculata)
and speckeled alder (Alnus rugosa) cutting regime on plant biodiversity at Cranberry Bog. In 35th Annual Report (2002), SUNY Oneonta Biol. Fld. Sta., SUNY Oneonta
Kritzberg, E.S., Cole, J.J., Pace, M.M. and Graneli, W. 2005. Does autochthonous
primary production drive variability in bacterial metabolism and growth efficiency in lakes dominated by terrestrial C inputs? Aquatic Microbial Ecology, 38: 103-111.
McEnroe N.A., Roulet N.T., Moore T.R. and Garneau M. 2009. Do pool surface area
and depth control CO2 and CH4 fluxes from an ombrotrophic raised bog, James Bay, Canada? Journal of Geophysical Research – Biogeosciences, 114; GO1001, doi:10.1029/2007JG000639.
McEnroe N.A., Moore T.R and Roulet N.T. 2009. Spatial and temporal dynamics of
CO2 and CH4 in open water pools on an ombrotrophic raised bog, James Bay, Canada (submitted)
Meehan, H. 2003. Physiochemical survey of Thayer Farm Ponds. In 35th Annual
Report (2002), SUNY Oneonta Biol. Fld. Sta., SUNY Oneonta

Payne, A. & Butler, B. 2007. Water quality and species diversity survey of Thayer Farm ponds, summer 2006. In 39th Annual Report (2006), SUNY Oneonta Biol. Fld. Sta., SUNY Oneonta.
Riera J.L., Schindler J.E. and Kratz T.K. 1999. Seasonal dynamics of carbon dioxide
and methane in two clear water lakes and two bog lakes in northern Wisconsin, USA. Canadian Journal of Fisheries & Aquatic Science, 56: 265-274.
Rose, C. & Crumpton, W.G. 1996. Effects of emergent macrophytes on dissolved
oxygen dynamics in a prairie pothole wetland. Wetlands, 16(4): 495-502. Saba, A. 2002. The effects of leather-leaf (Chamaedaphne calyculata) and speckled
alder (Alnus rugosa) on plant biodiversity on Cranberry Bog. In 34th Annual Report 2001), SUNY Oneonta Biol. Fld. Sta., SUNY Oneonta.
Scorzafava, A. 2007. Fisheries surveys of Greenwoods Conservancy, 2006. In 39th
Annual Report (2006), SUNY Oneonta Biol. Fld. Sta., SUNY Oneonta. Searles, R. & Ryburn, A., 2009. Floristic Survey of Big Meadow, Greenwoods
Conservancy, summer 2008. In 41st Annual Report (2008), SUNY Oneonta Biol. Fld. Sta., SUNY Oneonta.
Sobek S.G.A., Algesten G., Bergstom A-K., Jansson M. and Tranvik L.J. 2003. The
catchment and climate regulation of pCO2 in boreal lakes. Global Change Biology, 9: 630-641.
Sobek S.G.A., Tranvik L.J. and Cole J.J. 2005. Temperature independence of carbon
dioxide supersaturation in global lakes. Global Biogeochemical Cycles, 19: GB2003.
Striegl R.G., Kortelainen P., Chanton J.P., Wickland K.P., Bugna G.C. and Rantakari
M. 2001. Carbon dioxide and partial pressure and 13C content of north temperate and boreal lakes at spring ice melt. Limnology & Oceanography, 46: 941-945.
ACKNOWLEDGEMENTS
This work was supported in part by a Faculty Research Grant (2009-2010) and
a Greenwoods Conservancy Research Stipend Award (Summer 2009) to Nicola A. McEnroe. Matt Albright and Holly Waterfield provided laboratory assistance. DOC samples were analysed at McGill University, Department of Geography, Montréal, Canada. Zachary Burris, Maribeth Rubenstien & Irene Primmer provided field assistance.