preliminary information memorandum november · pdf filethis preliminary information...
TRANSCRIPT
Faisalabad Electric Supply Company Preliminary Information Memorandum
November 2015

Important Notice and Disclaimer This preliminary information memorandum (“the Document”) has been compiled by the Financial Advisory Consortium comprising of United Bank Limited (lead Financial Advisor or the “FA”), Ernst & Young Ford Rhodes Sidat Hyder, HaidermotaBNR & Co, Lahmeyer International GmbH, Excelerate (Pvt.) Limited, (“the FA Consortium” ), based on the information provided by Faisalabad Electric Supply Company (“the Company”).
This Document is not a prospectus and does not constitute or form any part of any offer to sell or recommendation to subscribe for, underwrite or purchase securities, nor shall it, or any part of it, be relied upon in any way in connection with any contract for the acquisition of an equity interest in Company or any of its subsidiaries or any other affiliate nor shall its issue be taken as any form of commitment on the part of the Company to proceed with any transaction, and no representations are made in this Document. Any sale of securities will be made pursuant to a share purchase agreement and/or shareholders’ agreement or similar agreement(s) as described herein.
The information contained in this Document may be subject to updating, expansion, revision and amendment. However, neither the Company nor the FA Consortium undertake any obligation to update, expand, revise or amend any information or to correct any inaccuracies contained in this Document or to provide the Recipients with additional information.
To the best knowledge and belief of the management of the Company (“the Management”) (who have taken all reasonable care to ensure that such is the case), the information contained in this Document is in accordance with the facts and does not omit anything likely to affect the import of such information.
The FA Consortium, affiliated partnerships or bodies corporate, the partners, directors, principals, managers, employees or agents of any of them (the “Parties”) have not independently verified or validated the information and therefore do not make any undertaking, representation or provide any warranty, expressed or implied, as to the accuracy, reasonableness or completeness of the information contained in this document or of any other information relating to the Company or its subsidiaries whether written, oral or in a visual or electronic form (including, without limitation, in a magnetic or digital form) transmitted or made available to the Recipients or their respective Advisors.
An investment in the securities involves a certain degree of risk and could involve restrictions on transfer, and therefore, should be considered only by sophisticated investors who are able to bear the economic risks of their investment for an indefinite period of time and who can afford to sustain a loss of their investment in the securities.
This Document does not purport to be all-inclusive or contain all the information which a Recipient may require. In making an investment decision, each Recipient must rely on their own examination of the Company and the terms of the securities and any offering, including the merits and risks involved in making an investment in the Company. The Parties expressly disclaim any and all liability for, or based on or relating to any such information, including, without limitation, any information contained in, or errors in or omissions from, the Document or based on or relating to the Recipients’ use of the Document.
The Recipients should read and consider all of the information contained in this Document. The contents of this Document are not to be construed as legal, financial or tax advice. Each Recipient should consult their own legal advisor, financial advisor or tax advisor for legal, financial or tax advice. The Recipients are required to conduct their own due diligence, a data room will be available for this purpose, and seek their own advice prior to making any investment decision relating to the transaction.

02 Key Investment Highlights
04 Power sector overview
05 FESCO overview
06 Transaction timeline and key contacts
Table of contents
03 Pakistan Overview
01 Transaction Overview

01 Transaction Overview

Page 5
Transaction overview The Government of Pakistan intends to divest 74% of its shareholding in FESCO, along with management control …
Highlights ► FESCO currently serves over 3m customers in its service area, with an expected 900,000
more to be added by 2020.
► FESCO is one of the most efficient distribution companies with consistently one of the lowest T&D losses in Pakistan.
► Furthermore, it’s recovery ratio has consistently been amongst the highest, with complete recovery of the billed amount in FY14.
► The company has recently filed a Multi-Year Tariff petition (FY2016-20) with National Electric Power Regulatory Authority (NEPRA), based on Integrated Generation Transmission Distribution Plan (IGTDP), in August 2015 and is awaiting determination thereon.
► Total investment of over PKR 50b (including consumer contribution) is expected under the proposed investment plan where the Company is expected to expand operations and rehabilitate transmission and distribution lines over the five years ending in 2020.
Customer base
3.44m
T&D losses
11.3%
Total manpower
15,556
Recoverability
100%
Planned investments
> PKR 50b
New MYT tariff
CPI-X
FESCO operational setup
Operating area (sq. km) 44,247
Transmission lines (km) 5,994
HT lines (km) 38,096
LT lines (km) 25,715
Operating Circles 4
Operating divisions 21
Operating sub-divisions 115
Faisalabad
Determined revenue
US$ 1b
Distribution margin
US$ 115m
Preliminary Information Memorandum
Karachi
Islamabad
Lahore

02 Key Investment Highlights

FESCO - Key Investment Highlights OPERATIONAL PERFORMANCE
FESCO is one of the most efficient DISCOs with average transmission & distribution losses amounting to 10.8% over the last 3 years
10.76% 10.9%
11.26%
9
9.5
10
10.5
11
0
2,000
4,000
6,000
8,000
10,000
12,000
2012 2013 2014
(
%)
Units Purchased Units Sold % Losses
REVISED TARIFF PETITION A new, improved tariff methodology has been proposed for this transaction so that FESCO can properly benefit from its current operational efficiency and further improvements post privatisation. Following key aspects have been requested in the MYT petition and are subject to determination by NEPRA:
Incentive to introduce efficiency in operational performance – (X-factor)
Bifurcation of Operational & Maintenance Costs
Allowance of Repair & Maintenance costs (K-factor)
Allowance for extra-ordinary events, e.g. Floods (Z-factor)
One-time Reopeners
RECOVERY RATIO FESCO’s efficient billing system ensures highest recovery ratio among all distribution companies (FY 2014)
100.1% 97.7%
96.1% 96.0%
90.4%
87.1%
77%
82%
87%
92%
97%
102%
FESCO LESCO GEPCO MEPCO IESCO KESC
Recovery Ratio
UNDERSERVED DEMAND
As per Integrated Generation Transmission Distribution Plan (IGTDP), FESCO’s management expects a CAGR of 5.9% in energy demand and increase at a CAGR of 3.5% in customer base till 2020
3.59 3.76
3.93 4.13 4.35
0
5,000
10,000
15,000
0
1
2
3
4
2016 2017 2018 2019 2020
Energy Consumption (GWh) - RHS Customer Base - (No. Mn) LHS

03 Pakistan overview

Page 9
Introduction ► Pakistan is situated right at the junction of Central Asia, China, the
Middle East and South Asia. ► The population consists largely of working-age Pakistanis which
provides high-growth prospects but also the responsibility to the Country to provide employment opportunities with more than 30% falling in the 15-30 years age bracket..
► Cheaper oil prices have helped the Country withstand the political uncertainty and flooding in the province of Punjab in the last fiscal year. However, sustained cheap oil prices would substantially improve Pakistan’s economic outlook.
Growth prospects ► China – which is Pakistan’s biggest trade partner – signed an
agreement, the China Pakistan Economic Corridor (CPEC): a network of rail, road and pipelines between the two countries. The agreement consists of infrastructure expenditure of $45b.
► In order to boost the capital markets and instill investor confidence, the incumbent government has tried to make Pakistan a investment-friendly market and is making strides in attracting foreign direct investment in Pakistan.
► Furthermore, the Board of Investment has approved policies to create a more investment-friendly environment in Pakistan, with the focus on liberalization, deregulation and privatization being the foremost themes.
► As a result, total investment witnessed a growth of 10.2% in FY15 compared to 8.4% in the previous year. (Ministry of Finance)
► However, the biggest deterrent to Pakistan’s economic growth – the energy deficiency and persistent load-shedding – remains.
Impact of Chinese investment (CPEC)
GDP – FY15 (USD’b) 287
Total investment size (USD’b) 46
Total investment size (% of GDP) 16%
Energy Projects (USD’b) 33.79
Source: BMA Capital, DAWN
5.54
%
4.99
%
0.36
%
2.58
% 3.62
%
3.84
%
3.65
%
4.03
%
4.24
%
0.00%
1.00%
2.00%
3.00%
4.00%
5.00%
6.00%
FY07 FY08 FY09 FY10 FY11 FY12 FY13 FY14 FY15
GDP growth of Pakistan (FY07-15)
59% 21%
13%
3% 2% 2% Services
Agrculture
Manufacturing
Mining and quarying
Construction
Electricity generation anddistribution
Sector share of total GDP
Preliminary Information Memorandum
Economic overview Major trends indicate that the new Government has been largely successful in introducing economic reforms …

Page 10
Economic indicators have improved over the last two years ► Economic growth has gradually started picking up pace after the change
in the government. The government, after entering into an IMF program, has started a reform process which is likely to bear fruits in the years to come. Real GDP growth in FY15 turned out to be 4.24%, highest level in last 7 years.
► FY15 ended with significant improvement in the external accounts due to sharp decline in oil prices, strong financial flows and higher workers’ remittances.
► The country FX reserves have now crossed USD20 billion threshold for the first time in history. This latest impetus was provided by successful issue of Sukuks in the international market, divestment of Government holdings in UBL, PPL, ABL & HBL, reimbursements of CSF from the US and continued disbursement of funding from IMF.
► The current account deficit has reduced to mere USD109 million during 1Q FY16 as compared to USD 1,631 million in the same period last year as a result of lower trade deficit amid oil prices as well as realization of Coalition Support Fund proceeds from the US.
► Lower oil prices has also pulled down the inflation trajectory with YoY monthly CPI clocking at below 4% for past 10 months. 4M FY16 CPI is averaged at 1.6%.
► As a result of comfortable balance of payment as lower inflation trajectory, the State Bank has also lowered its Discount Rate cumulatively by 350bps during the last 12 months – providing further stimulus to kick start the economic engine.
Demography ► The total population of Pakistan as at FY15 stood at 188.2 million,
growing at 5 year CAGR of 2.06%. ► Pakistan has a very young population, over 30% of the population fall
within the age bracket of 15-30 years.
177.1
180.71
184.35
188.2
0.50%
0.75%
1.00%
1.25%
1.50%
1.75%
2.00%
170172174176178180182184186188190
2012 2013 2014 2015
Mill
ion
Total population Growth in population
Source: Business Monitor International Research
Total population
Declining Inflation Trajectory during the last year
Source: Pakistan Bureau of Statistics
Preliminary Information Memorandum
Economic indicators The economy is in a stable state with low inflation and increasing foreign exchange reserves …
0.0%
2.0%
4.0%
6.0%
8.0%
10.0%
12.0%

Page 11
Pakistan’s household consumption and savings pattern ► Total household consumption in Pakistan has increased to PKR8,368
billion (USD83 billion) as at FY14, as opposed to PKR7,332 billion (USD72 billion) during FY11, representing growth at a 3 year CAGR of 4.48%.
► From FY11 to FY14, consumer spending increased by PKR469 billion (USD4.6 billion), a growth of 5.9% over a year period.
► The pattern of consumer savings, on the other hand, is not very consistent. Total savings as at FY14 stood at PKR2,691 billion (USD26 billion) as opposed to PKR 2,927 billion (USD29 billion) in FY13, a decline of 8.06%.
► From FY10 to FY11, savings surged by a whopping 58% from PKR 1,738 billion (USD17.2 billion) to PKR 2,760 billion (USD27.2 billion).
Current monetary environment ► At present, Pakistan is following an accommodative monetary policy
stance in order to reinvigorate its economy. ► During the last 12 months, the SBP slashed the policy rate by
cumulative 350 basis points to 6.5 percent, lowest in 42 years. ► International agencies have upgraded outlook for Pakistan's economy
which in turn will further enhance confidence of the investor. Moody’s rating for Pakistan has been raised from “stable” to “positive”.
► Pakistan capital market made history for mega public offerings led by sale of shares by the GoP, and in terms of money raised through these offerings. Since new govt took over, KSE-100 index has moved from around 19k to 35k during little more than two years.
► In FY15, KSE-100 index posted a return of 17.5%. 6% surge of market capitalization in FY15, amounting to PKR7.5 trillion (USD74 billion).
7,332 7,701 7,894 8,363
2,760 2,678 2,927 2,691
-10.00%
0.00%
10.00%
20.00%
30.00%
40.00%
50.00%
60.00%
70.00%
0
1,000
2,000
3,000
4,000
5,000
6,000
7,000
8,000
FY11 FY12 FY13 FY14
PK
R b
illio
n
Household consumption expenditure Household savings
Growth in household consumption Growth in household savings
Household consumption and savings
-10
-5
0
5
10
15
20
25
2009 2010 2011 2012 2013 2014 2015f 2016f 2017f 2018f 2019f
Per
cent
Lending rate, %, ave Consumer price inflation, % y-o-y, avg
Real lending rate, %, aveSource: Business Monitor International Research
Source: Ministry of Finance
CPI, lending and real lending rates
Preliminary Information Memorandum
Consumption and monetary policy Household consumption is on the rise while interest rates are at their lowest for 42 years …

Page 12
Fiscal policies Decline in deficit and praise from the International Monetary Fund …
Fiscal policies and its effect ► GoP has carried out fiscal reforms in line with conditions set out by IMF.
The fiscal deficit has decreased and is expected to gradually decline further.
► Fiscal data indicates that the government was able to reduce its deficit from 8.8% to 5%. Also, the financing mix improved as increased external funding reduced the burden on the banking system, particularly on the Central Bank. Consequently, for the first time in the current IMF program, the country met all its quantitative (performance) targets for end-December 2014
► According to IMF, GoP met all five performance criteria relating to targets for international reserves, net domestic assets, reducing general borrowing, reducing borrowings for budgetary support from State Bank of Pakistan (SBP), and fulfilling the condition on debt swap arrangements.
► The government has been able to lower its fiscal deficit over the past two years however it still remains over 5% mark. More importantly, the financing mix of fiscal deficit has improved considerably as increased external funding reduced the pressure on the domestic system to some extent.
-10
-5
0
5
10
15
20
25
2007 2008 2009 2010 2011 2012 2013 2014 2015f 2016f 2017f 2018f 2019f
% o
f GD
P
Total revenue, % of GDP Total expenditure, % of GDP
Budget balance, % of GDP
Government expenditure, revenue and budget balance
Source: Business Monitor International Research
IMF praises macroeconomic stability ► Pakistan entered into an extended fund facility (EFF) program with IMF
on September 4, 2013. It is a 36-month extended arrangement under the Extended Fund Facility (EFF) for Special Drawing Rights (SDR) up to 4.4 billion (USD6.6b).
► Recent review by IMF was completed on 26th June 2015 and 8th tranche was released of SDR360 million (USD506 million).
► Pakistan has met all the conditions for the period January-March 2015 and did not require any waivers from IMF’s executive board, as has been historically the case.
► Important elements include quick reforms in the energy sector, broadening the tax base, restructuring of state-owned enterprises, and improving the business climate.
► The IMF in its review appreciated the stabilization policies that have reduced macroeconomic imbalance, the accumulation of reserves, submissions by the authorities to increase Central Bank independence, and the efforts to bring electricity tariffs towards cost recovery levels.
Preliminary Information Memorandum
Page 13
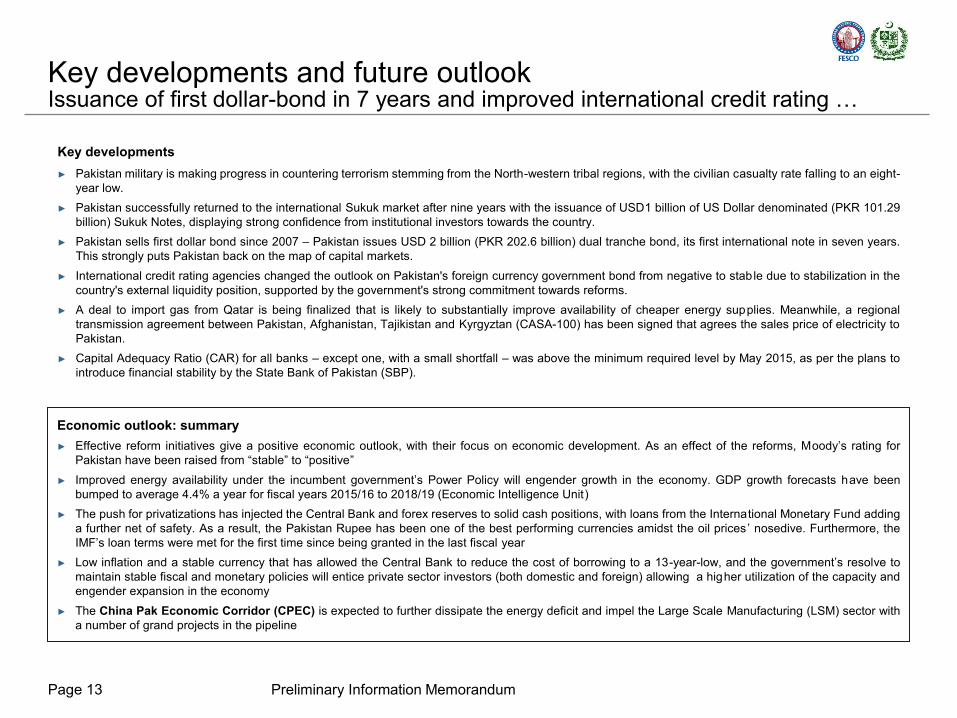
Key developments ► Pakistan military is making progress in countering terrorism stemming from the North-western tribal regions, with the civilian casualty rate falling to an eight-
year low. ► Pakistan successfully returned to the international Sukuk market after nine years with the issuance of USD1 billion of US Dollar denominated (PKR 101.29
billion) Sukuk Notes, displaying strong confidence from institutional investors towards the country. ► Pakistan sells first dollar bond since 2007 – Pakistan issues USD 2 billion (PKR 202.6 billion) dual tranche bond, its first international note in seven years.
This strongly puts Pakistan back on the map of capital markets. ► International credit rating agencies changed the outlook on Pakistan's foreign currency government bond from negative to stable due to stabilization in the
country's external liquidity position, supported by the government's strong commitment towards reforms. ► A deal to import gas from Qatar is being finalized that is likely to substantially improve availability of cheaper energy supplies. Meanwhile, a regional
transmission agreement between Pakistan, Afghanistan, Tajikistan and Kyrgyztan (CASA-100) has been signed that agrees the sales price of electricity to Pakistan.
► Capital Adequacy Ratio (CAR) for all banks – except one, with a small shortfall – was above the minimum required level by May 2015, as per the plans to introduce financial stability by the State Bank of Pakistan (SBP).
Economic outlook: summary ► Effective reform initiatives give a positive economic outlook, with their focus on economic development. As an effect of the reforms, Moody’s rating for
Pakistan have been raised from “stable” to “positive” ► Improved energy availability under the incumbent government’s Power Policy will engender growth in the economy. GDP growth forecasts have been
bumped to average 4.4% a year for fiscal years 2015/16 to 2018/19 (Economic Intelligence Unit) ► The push for privatizations has injected the Central Bank and forex reserves to solid cash positions, with loans from the International Monetary Fund adding
a further net of safety. As a result, the Pakistan Rupee has been one of the best performing currencies amidst the oil prices’ nosedive. Furthermore, the IMF’s loan terms were met for the first time since being granted in the last fiscal year
► Low inflation and a stable currency that has allowed the Central Bank to reduce the cost of borrowing to a 13-year-low, and the government’s resolve to maintain stable fiscal and monetary policies will entice private sector investors (both domestic and foreign) allowing a higher utilization of the capacity and engender expansion in the economy
► The China Pak Economic Corridor (CPEC) is expected to further dissipate the energy deficit and impel the Large Scale Manufacturing (LSM) sector with a number of grand projects in the pipeline
Preliminary Information Memorandum
Key developments and future outlook Issuance of first dollar-bond in 7 years and improved international credit rating …
04 Power sector overview

Page 15
Generation mix Generation & consumption per capita Forecasted demand
The sector is structured around a single-buyer model. The sector has been unbundled into individual service industries, however private sector participation is limited to generation while state owned monopolies exist in transmission and distribution segments.
0.51 0.52 0.54 0.55 0.56
0.43 0.43 0.43 0.44 0.45
0
0
0
0
0
1
1
2010a 2011f 2012f 2013f 2014f'0
00' K
WH
per
cap
ita
Generation Consumption
0
5
10
15
20
25
30
35
2009 2010 2011 2012 2013 2014F 2015F 2016F
GW
Demand
Gas 29.08%
FO & HSD 38.49%
Coal 0.04%
Hydel 28.85%
Nuclear 3.33%
Wind 0.21%
► Losses of 23-25% due to poor infrastructure, mismanagement and theft of electricity
► Domestic : 46% ► Commercial: 8% ► Industrial 30% ► Agriculture 10% ► Others : 6%
► 21,593 MW generation capacity as on 30th June 13
► 27 IPP’s contributing 30% of generation capacity
► 10 public sector and 2 private sector companies
► NEPRA has granted 9 distribution license to small power producers and 1 to captive power plants
Distribution Generation
Sector overview
Type of Consumers Transmission
Source: Business monitor international Source: Business monitor international Source: Business monitor international
Source: BMI Research and NEPRA
Current market structure of Sector
Preliminary Information Memorandum
Power and utilities overview Sector snapshot

Page 16
Issues Details
Supply shortfall Peak demand for electricity outstrips installed capacity by approximately 7,000MW.
Circular debt Circular debt constraints the flow of cash in the sector, ultimately disabling Pakistan State Oil (PSO) and other fuel importers from being able to make payments.
Fuel mix Current fuel mix for electricity generation is expensive due to higher reliance on RFO and HSD based generation
T&D losses T&D losses of 25% in the system, pilferage of electricity (costing PKR 140b annually) and poor recovery of sales (85%).
Subsidy reimbursements Tariffs are subsidized for consumers but distribution companies are not reimbursed in a timely manner.
Under-utilized capacity Under-utilization of current capacity due to lack of funds at the generation companies to purchase fuel.
Non-competitive generation Lack of competition at state-owned generation companies with a total installed capacity of 4,800MW.
Single-buyer model Single-buyer model disallows efficient purchase from generation companies and dispatch of electricity to distribution companies.
Obsolete technology Use of outdated technology hampers monitoring, estimation and subsequent planning.
Lack of private sector participation
Ownership of the P&U sector effectively lies with the government, which leads to interference in the normalization of tariffs/subsidies and inefficient market operations.
The Government proposes to close the supply-demand gap by 2017 through the following reforms and initiatives:
► Transformation of the current single-buyer model to a wholesale electricity market, with bilateral contracts and wheeling charges for transmission of electricity. Carve out of CPPA-G from the single transmission company to function as market operator for the wholesale market.
► Privatization of generation and distribution companies to induce efficient operations. This is proposed keeping in view the successful history of private sector participations in the power sector (KAPCO, K-Electric, etc.). Tariffs for privatized entities are to be conducive to promote efficiency.
► Restrict tariff subsidies to class of consumers that genuinely require them, foregoing the monthly clearances of credit to the CPPA. ► Reduce dependency on RFO and HSD: conversion of expensive plants to run on gas; incentivizing cheap power production through up-front tariffs for
wind, solar and bagasse plants; and increasing procurement of coal and gas through increased mining and construction of pipelines for gas. ► Upgrading the current T&D system to up-to-date global standards. These shall including regulated performance standards; better Demand-Side
Management through implementation of Time of Use metering systems and pricing signals (expensive but dedicated electricity for heavier users). ► Introduction of legislation to allow forceful disconnection of consumer connections upon failure to pay for power consumed and installation of pre-paid
meters upon reconnection following full payment of prior dues. Load-shedding to be focused only on areas with low-collection ratios.
Preliminary Information Memorandum
The need for reforms in P&U Reform is required due to supply shortfall and inefficient management of SOEs …

05 FESCO overview

Page 18
Introduction • FESCO Distributes and supplies electricity to about 3.21 million customers
within the civil districts of Faisalabad, Sargodha, Mianwali, Khoshab, Jhang, Bhakhar, Chiniot and Toba Tek Singh territory with a population over 27.5 million and around 44,247 sq.km area under a distribution license granted by NEPRA pursuant to the NEPRA Act.
• FESCO commercializes 8,607 MKWh of electric energy per year, with a peak demand of 2,747 MW.
Operational setup
• FESCO has 4 Operation Circles, 21 Operation Divisions, 115 Operation Sub Divisions, and 01 Grid System Operation (GSO) Circle, 4 S.S.T Divisions and 1 P&I Division, 30 SST Sub Divisions and 4 No. P&I Sub Divisions. It has 1 PD Construction, 3 Construction Divisions, 11 Construction Sub Divisions and 4 number Energy Loss Reduction (ELR) sub divisions.
• Initially there was only one Construction Directorate responsible for the construction and development of 11KV and below network. But during the year 2005-06, another construction Directorate namely Grid System Construction (GSC) was shifted from NTDC to FESCO, which became responsible for construction and development of 132 kV and 66 kV network of FESCO.
• GSC Directorate consists of 1 Construction Division, 3 Construction Sub Divisions and 2 T&I/Civil Sub Division.
• Operation Circles are managed by Managers, Operation Divisions are managed by Deputy Managers and Operation Sub Divisions are managed by Assistant Managers.
• During 2008-09 Project Management Directorate has been established headed by Chief Engineer Development for Power Distribution Enhancement Project (PDFIP) which is being financed mainly by Asian Development Bank (ADB).
• FESCO has one of the lowest T&D losses with a high collection rate and low T&D losses. It enjoys an advantageous consumer mix with a significant proportion of industrial and commercial consumers in its mix.
FESCO operational setup
Operating Circles 4
Operating divisions 21
Operating sub-divisions 115
Grid System operation circles 1
SST divisions 4
P&I division 1
SST sub-divisions 30
P&I sub-divisions 4
Technical overview Transmission System Description:
• The FESCO transmission system consists of 1,705 km of 132 kV, 1,292 km of 66 kV a total of 2,997 km of transmission lines. There are 58 Grid Stations of -132 kV, 24 Grid Stations of 66 kV and 16 Private Gird Stations (Total 98) in FESCO. Total number of Power Transformers are 160 with an installed Capacity of 3,159 (MVA).
• The length of HT Line (11kV) is 38,096 km and LT Line (400/230 volts) is 25,715 km.
Distribution System Description:
• The distribution system consists of 41,200 km of HT Lines and 25,436 km of LT lines a total of 66,636 km of lines. There are a total of 77,924 transformers
Preliminary Information Memorandum
FESCO Overview

Page 19
Revenue breakdown
• Revenue for the utility has increased at a CAGR of 27% during the FY12 to FY14 period.
• Share of subsidy in the total cost of power however has been decreasing from a peak of 39% in FY13 to stand at 18% at the end of 6mFY15.
• This is inline with GoP policy to successively reduce subsidy support afforded to the end consumer.
• In terms of consumer mix, residential consumers account for the highest volumes but contribute 31% in terms of nominal revenue whereas industrial consumers account for 49%.
• The mix bodes well for the utility in terms of recovery of dues as industrial and commercial consumers have a higher rate of recovery as compared to residential consumers.
72.65 73.26
105.86
61.66
14.71
47.53
34.59
13.94
17%
39%
25%
18%
0%
10%
20%
30%
40%
50%
0
40
80
120
160
FY12A FY13A FY14A 6mFY15A
PK
R m
Revenue from customers GoP subsidy
87.36
120.79
140.45
75.60
6mFY15 Customer mix
46%
5%
37%
3% 9%
Units sold
Domestic Commercial
Industrial Bulk
Agricultural Others
44%
7%
37%
3% 9%
Revenues from sale
Domestic Commercial
Industrial Bulk
Agricultural
FY14 Customer mix
31%
8% 49%
4% 8%
Revenues from sale
Domestic Commercial
Industrial Bulk
Agricultural Other
44%
5%
39%
3% 9%
Units sold
Domestic Commercial
Industrial Bulk
Agricultural Other
Source: Management information
Source: Audited financial statements and management information
Source: Audited financial statements and management information
Preliminary Information Memorandum
FESCO Overview

Page 20
Financial snapshot
Currency: PKR m FY12A FY13A FY14A 6mFY15A Revenue from customers 72,645 73,262 105,861 61,660 GoP Subsidy 14,713 47,526 34,589 13,938 Total Revenue 87,358 120,788 140,450 75,598 Cost of electricity (95,292) (95,584) (117,571) (57,373) Gross Profit (7,934) 25,204 22,879 18,225 Distribution costs 7,133 8,533 9,718 5,035 Administrative costs 2,112 1,527 1,653 854 Operating profit/ (loss) (17,170) 13,475 12,262 12,154 Profit/(Loss) after tax (15,149) 24,054 29,689 13,214 GoP Subsidy (% of total revenue) 16.8% 39.3% 24.6% 18.4% Revenue Growth 13.7% 38.3% 16.3% -* Gross margin (9.1)% 20.9% 16.3% 24.11% Operating margin (19.7)% 11.2% 8.7% 16.08% Net margin (17.3)% 19.9% 21.1% 17.5% Non current assets 43,819 78,700 80,229 80,428 Current assets 43,697 61,609 55,726 70,704 Total assets 87,516 140,309 135,955 151,132 Non current liabilities 57,175 60,556 54,819 56,077 Current liabilities 52,941 54,191 8,383 9,093 Net equity (incl. rev. surplus) (22,600) 25,563 72,752 85,967 Cash (used in)/generated from operations (610) 2,474 1,380 -* Cash generated from operations (% of revenue) (0.7%) 2.0% 1.0% -* Not Available* (Source: Audited Financial Statements)
Fixed Assets Break-up FY14
Liabilities and Equity
Source: Audited financial statements and management information
Source: Audited financial statements and management information
Preliminary Information Memorandum
Financial highlights Snapshot
11
4,7
47
63
,20
3
65
,15
5
25
,56
3
72
,75
2
85
,96
7
0
20,000
40,000
60,000
80,000
100,000
120,000
140,000
FY2013 FY2014 6M2015
Total Liabilities Total Equity
16.47% 1.67%
62.70%
18.64%
Freehold land
Building onfreehold land
Feeders [Up to11 KV]
Grids andequipment
Page 21
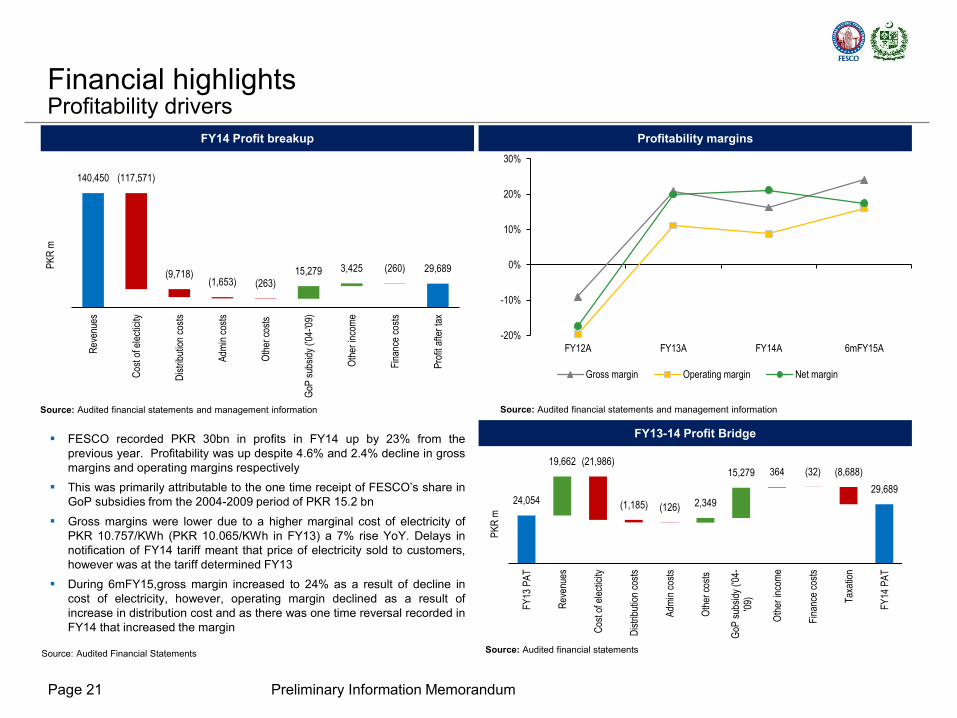
FY14 Profit breakup
• FESCO recorded PKR 30bn in profits in FY14 up by 23% from the previous year. Profitability was up despite 4.6% and 2.4% decline in gross margins and operating margins respectively
• This was primarily attributable to the one time receipt of FESCO’s share in GoP subsidies from the 2004-2009 period of PKR 15.2 bn
• Gross margins were lower due to a higher marginal cost of electricity of PKR 10.757/KWh (PKR 10.065/KWh in FY13) a 7% rise YoY. Delays in notification of FY14 tariff meant that price of electricity sold to customers, however was at the tariff determined FY13
• During 6mFY15,gross margin increased to 24% as a result of decline in cost of electricity, however, operating margin declined as a result of increase in distribution cost and as there was one time reversal recorded in FY14 that increased the margin
Profitability margins
Source: Audited Financial Statements
140,450 (117,571)
(9,718) (1,653) (263)
15,279 3,425 (260) 29,689
Rev
enue
s
Cos
t of e
lect
icity
Dis
trib
utio
n co
sts
Adm
in c
osts
Oth
er c
osts
GoP
sub
sidy
('0
4-'0
9)
Oth
er in
com
e
Fin
ance
cos
ts
Pro
fit a
fter
tax
PK
R m
FY13-14 Profit Bridge
24,054
19,662 (21,986)
(1,185) (126) 2,349
15,279 364 (32) (8,688)
29,689
FY
13 P
AT
Rev
enue
s
Cos
t of e
lect
icity
Dis
trib
utio
n co
sts
Adm
in c
osts
Oth
er c
osts
GoP
sub
sidy
('0
4-'0
9)
Oth
er in
com
e
Fin
ance
cos
ts
Tax
atio
n
FY
14 P
AT
PK
R m
Financial highlights Profitability drivers
-20%
-10%
0%
10%
20%
30%
FY12A FY13A FY14A 6mFY15A
Gross margin Operating margin Net margin
Source: Audited financial statements and management information Source: Audited financial statements and management information
Source: Audited financial statements
Preliminary Information Memorandum

Page 22
Power purchase
price
Tariff Structure
O&M cost
Depreciation
Return on rate (asset)
base
Other income
Prior year adjustments
Tariff determined
by the regulator
Subsidy paid by govt.
End consumer
tariff
These four components form the distribution margin of FESCO and covers the internal cost and
required return
Periodic adjustments
Fuel Charges Adjustments Pursuant to the provisions of Section 31(4) of the NEPRA Act 1997, NEPRA makes adjustments in the approved tariff on account of any variations in the fuel charges on a monthly basis. O&M Quarterly adjustments The O&M component of the power purchase cost is also adjusted on quarterly basis.
Tariff structure of FESCO is based on Return on Regulatory (RoR) Asset Base mechanism.
FESCO’s current tariff structure
Source: NEPRA tariff determinations
Tariff Analysis - FESCO Analysis of current tariff components
Preliminary Information Memorandum

Page 23
Key features of MYT petition filed for FESCO for FY16-20* The petition was filed on 10th August …
Features Details
Annual revenue cap, with O&M indexation as per “CPI-X” formula
► The tariff is based on the revenue cap methodology, with annual O&M cost indexation subject to the X-factor (efficiency), which is set at 0% for the first 3 years to allow the incoming private investor time to stabilize costs, and evenly increases to 1% between year 4 and year 5
O&M bifurcation ► O&M costs is split into controllable and non-controllable costs, with uncontrollable costs a pass through to the end-consumer
Allowance for extraordinary events ► A Z-factor (for extraordinary events) is introduced in the CPI-X formula, to provide relief to the operator from costs occurring due to uncontrollable or force majeure events which shall be passed through
Mechanism for determining repairs and maintenance
► To provide the operator autonomy over R&M costs, a K-factor at 3% of average closing cost of assets (on par with regional DISCOs) is allowed to FESCO
Annual WACC adjustments ► To incorporate the actual cost to the company, the return on equity – and hence, the WACC – shall be re-determined at the end of each year so as to reflect the actual macroeconomic and business risk of the DISCO
Additional losses reduction incentive
► Further incentive to increase efficiency through reduction in T&D losses is allowed for in the tariff. ► For every percentage point reduction below target T&D losses, the same number of percentage points shall be
added to the cost of equity.
Floor on return on equity ► A floor of 19% of return on equity is included in the tariff, as per the norms in the power sector where private investors are present.
Exclusion of Late Payment Surcharge
► Exclusion of LPS from the tariff is also proposed so that cash is not unnecessarily constricted due to the delay in payment delays from customers and payment for power purchased
Re-openers ► Provisions for revision of T&D losses, investment plan and the cost of debt (capital structure) are allowed in case the private investor wishes to re-assess these items
Options to provide relief operator from delay in payment of subsidies
► A mark-up of 300-350 bps on delayed payments of Tariff Differential Subsidies (TDS) to be allowed to the DISCO, similar to allowances for IPPs
► Alternatively, allowing the DISCO to adjust the TDS in advance from the power purchase cost with the CPPA
*Subject to approval by NEPRA
Preliminary Information Memorandum

06 Transaction timeline and key contacts

Page 25
Tentative transaction timeline
• Issuance of EOI & RSOQ November
• Bidder Due diligence • Submission of comments, clarifications on bidding documents from prequalified bidders • Pre-bid meeting
February
• Receipt and evaluation of SOQs • Announcement of Prequalified bidders and Issuance of bidding documents • Due diligence commencement
March
December - January
• Submission of earnest money / valuation and approval of reference price • Bidding / Approval & announcement of successful bidder / Issuance of LOA • Execution of SPA / Payment of purchase price/ Transfer of shares and management control April - May
• Data room closure and due diligence completion (subject to MYT determination by NEPRA) • Issuance of final bidding documents and announcement of bidding date
Preliminary Information Memorandum
Page 26
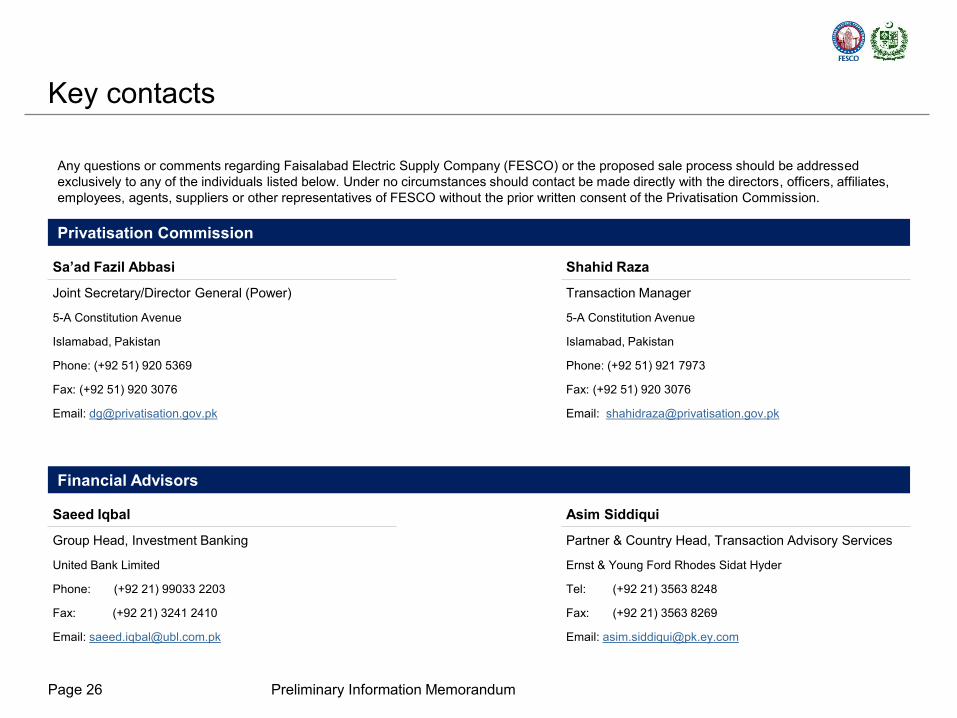
Key contacts
Privatisation Commission
Sa’ad Fazil Abbasi
Joint Secretary/Director General (Power)
5-A Constitution Avenue
Islamabad, Pakistan
Phone: (+92 51) 920 5369
Fax: (+92 51) 920 3076
Email: [email protected]
Shahid Raza
Transaction Manager
5-A Constitution Avenue
Islamabad, Pakistan
Phone: (+92 51) 921 7973
Fax: (+92 51) 920 3076
Email: [email protected]
Financial Advisors
Saeed Iqbal
Group Head, Investment Banking
United Bank Limited
Phone: (+92 21) 99033 2203
Fax: (+92 21) 3241 2410
Email: [email protected]
Asim Siddiqui
Partner & Country Head, Transaction Advisory Services
Ernst & Young Ford Rhodes Sidat Hyder
Tel: (+92 21) 3563 8248
Fax: (+92 21) 3563 8269
Email: [email protected]
Any questions or comments regarding Faisalabad Electric Supply Company (FESCO) or the proposed sale process should be addressed exclusively to any of the individuals listed below. Under no circumstances should contact be made directly with the directors, officers, affiliates, employees, agents, suppliers or other representatives of FESCO without the prior written consent of the Privatisation Commission.
Preliminary Information Memorandum