preliminary geotechnical evaluation geotechnical evaluation ... prior to construction of the new...
TRANSCRIPT

Appendix 5.4A Preliminary Geotechnical Report
PRELIMINARY GEOTECHNICAL EVALUATION REDONDO BEACH GENERATING STATION
1100 NORTH HARBOR DRIVE REDONDO BEACH, CALIFORNIA
PREPARED FOR: Power Engineers Collaborative
150 North Sunny Slope Road, Suite 110 Brookfield, Wisconsin 53005
PREPARED BY: Ninyo & Moore
Geotechnical and Environmental Sciences Consultants 475 Goddard, Suite 200 Irvine, California 92618
October 31, 2011 Project No. 208356001

October 31, 2011 Project No. 208356001
Mr. Horacio Larios Power Engineers Collaborative 150 North Sunny Slope Road, Suite 110 Brookfield, Wisconsin 53005
Subject: Preliminary Geotechnical Evaluation Redondo Beach Generating Station 1100 North Harbor Drive Redondo Beach, California
Dear Mr. Larios:
In accordance with your request and authorization, Ninyo & Moore has performed a preliminary geotechnical evaluation at the Redondo Beach Generating Station at 1100 North Harbor Drive in Redondo Beach, California. We understand that the results of this evaluation will be utilized in the project’s Application for Certification to the California Energy Commission. Our evaluation was conducted in general accordance with the scope of services presented in our proposal dated June 15, 2011. This report presents our findings, conclusions and recommendations regarding the site geologic conditions, potential geologic and seismic hazards, mitigation alternatives, and pre-liminary geotechnical design information.
We appreciate the opportunity to provide geotechnical consulting services for this project.
Sincerely, NINYO & MOORE
Michael E. Rogers, PG, CEG Senior Project Geologist
Soumitra Guha, PhD, GE Principal Engineer
Lawrence Jansen, PG, CEG Principal Geologist
EBP/MER/SG/LTJ/mlc/sc
Distribution: (1) Addressee (via e-mail)

Redondo Beach Generating Station October 31, 2011 Redondo Beach, California Project No. 208356001
TABLE OF CONTENTS
Page 1. INTRODUCTION ....................................................................................................................1
2. SCOPE OF SERVICES............................................................................................................1
3. SITE DESCRIPTION...............................................................................................................3
4. PROJECT DESCRIPTION ......................................................................................................4
5. SUBSURFACE EVALUATION AND LABORATORY TESTING......................................5
6. GEOLOGY...............................................................................................................................5 6.1. Regional Geology .........................................................................................................5 6.2. Site Geology .................................................................................................................6 6.3. Groundwater .................................................................................................................7
7. FAULTING AND SEISMICITY .............................................................................................8 7.1. Regional Seismicity ......................................................................................................8
8. POTENTIAL GEOLOGIC AND SEISMIC HAZARDS.......................................................10 8.1. Surface Fault Rupture .................................................................................................10 8.2. Seismic Ground Shaking ............................................................................................10 8.3. Liquefaction, Dynamic Settlement and Lateral Spreading.........................................11 8.4. Mass Wasting..............................................................................................................13 8.5. Slope Stability.............................................................................................................13 8.6. Subsidence ..................................................................................................................14 8.7. Compressible/Collapsible Soils ..................................................................................14 8.8. Expansive Soils...........................................................................................................15 8.9. Corrosive Soils............................................................................................................15 8.10. Groundwater ...............................................................................................................16 8.11. Geologic Resources ....................................................................................................17 8.12. Tsunami Run-Up ........................................................................................................18
9. PRELIMINARY CONCLUSIONS AND MITIGATION ALTERNATIVES ......................19 9.1. Hazard Mitigation.......................................................................................................19
9.1.1. Seismic Ground Shaking...................................................................................19 9.1.2. Liquefaction and Dynamic Settlement..............................................................19 9.1.3. Mass Wasting....................................................................................................20 9.1.4. Compressible Soils............................................................................................20 9.1.5. Expansive Soils .................................................................................................21 9.1.6. Corrosive Soils ..................................................................................................21 9.1.7. Groundwater......................................................................................................21 9.1.8. Tsunami Run-Up...............................................................................................22
9.2. Preliminary Earthwork Considerations.......................................................................23 9.3. Preliminary Foundation Criteria .................................................................................24
208356001 R Prelim Geo Eval (RBGS).doc i

Redondo Beach Generating Station October 31, 2011 Redondo Beach, California Project No. 208356001
10. LIMITATIONS.......................................................................................................................24
11. REFERENCES .......................................................................................................................27
Tables Table 1 – Principal Regional Active Faults......................................................................................9
Figures Figure 1 – Site Location Figure 2 – Site Aerial Photograph Figure 3 – Boring and CPT Locations Figure 4 – Regional Geology Figure 5 – Fault Locations Figure 6 – Seismic Hazard Zones Figure 7 – Tsunami Inundation
Appendices Appendix A – Boring and CPT Logs Appendix B – Laboratory Testing Appendix C – Liquefaction Analysis
208356001 R Prelim Geo Eval (RBGS).doc ii

Redondo Beach Generating Station October 31, 2011 Redondo Beach, California Project No. 208356001
1. INTRODUCTION
In accordance with your request and authorization, we have performed a preliminary geotechni-
cal evaluation for the proposed Redondo Beach Generating Station (RBGS) Re-powering Project
located at 1100 North Harbor Drive in Redondo Beach, California (Figure 1). AES Southland has
proposed upgrades to the existing facilities at the RBGS as part of a proposed re-powering pro-
ject. In accordance with the California Energy Commission (CEC) guidelines, we have
performed a geotechnical evaluation of the potential effects the project may have on the geologic
environment and the impacts associated with potential geologic and seismic hazards for inclusion
in the Application for Certification (AFC).
Our geotechnical evaluation was based on review of readily available geologic, groundwater and
seismic data, a site reconnaissance and subsurface exploration, laboratory testing and engineer-
ing analyses. Recommendations to mitigate potential geologic hazards are presented, as
appropriate. Preliminary geotechnical design considerations are also presented for planning pur-
poses.
2. SCOPE OF SERVICES
Our geotechnical services for the project included the following:
• Review of readily available geologic maps, published geotechnical literature, geologic and seismic data, groundwater data, aerial photographs, and in-house information.
• Review of geotechnical documents pertaining to the site and project plans provided to us by Power Engineers Collaborative.
• Preparation of a site Health & Safety Plan pertaining to our work at the facility.
• Geotechnical site reconnaissance to document the existing surficial conditions at the project site. During our site reconnaissance we marked the proposed boring and cone penetration test (CPT) locations for utility clearance by Underground Service Alert.
• A geophysical survey at the exploration locations to check for the presence of underground utilities.
• Attendance at a safety meeting with the facility safety officer prior to field exploration.
208356001 R Prelim Geo Eval (RBGS).doc 1
Redondo Beach Generating Station October 31, 2011 Redondo Beach, California Project No. 208356001
• Subsurface exploration consisting of the drilling, logging and sampling of two hollow-stem auger borings and performance of four CPTs. The borings were drilled to depths of up to ap-proximately 51½ feet. The CPTs were advanced to depths of up to approximately 46 feet. The borings were logged by a representative from our firm, and bulk, Standard Penetration Test, and relatively undisturbed soil samples were collected at selected intervals for labora-tory testing.
• Laboratory testing of selected soil samples, including tests to evaluate in–situ moisture con-tent and dry density, percentage of particles finer than the No. 200 sieve, shear strength, soil corrosivity, and sand equivalent.
• Data compilation and geotechnical analysis of field and laboratory data, including analyses to evaluate and provide recommendations pertaining to the following:
Suitability of the site for the proposed development from a geotechnical perspective.
General geologic and seismic conditions, including subsurface geology and soils and geologic resources anticipated at the site.
Groundwater conditions at the site and evaluation of the impact of groundwater on pro-posed improvements.
Potential geologic and seismic hazards affecting the site and evaluation of their poten-tial impacts on the project. The evaluation addressed potential surface ground rupture, seismic shaking, mass wasting, liquefaction, dynamic settlement, lateral spread, ground subsidence, tsunami run-up, and expansion or collapse of soil structures at the site.
Mitigation alternatives for potential seismic and geologic hazards.
Geologic resources of recreational, commercial or scientific value that may be impacted by the proposed project.
General earthwork considerations for the project, including preparation of structure pads, suitable fill material, excavations, and construction dewatering.
Preliminary corrosion potential of site soils.
Preliminary geotechnical engineering for alternative foundation systems.
• Preparation of this report presenting the results of our data review, subsurface exploration and preliminary engineering analysis, as well as our conclusions and recommendations rela-tive to the geotechnical aspects of the project’s conceptual design and construction to be included in the AFC.
208356001 R Prelim Geo Eval (RBGS).doc 2

Redondo Beach Generating Station October 31, 2011 Redondo Beach, California Project No. 208356001
3. SITE DESCRIPTION
The existing Redondo Beach Generating Station is located on a gently sloping coastal terrace
above the King Harbor marina in the northwest part of the City of Redondo Beach (Figure 1).
Topography of site ranges from an elevation from approximately 3 to 20 feet above mean sea
level (MSL). Five abandoned tank basin areas at the facility are recessed approximately 10 feet
below the surrounding areas. The five tanks were demolished roughly between 2006 and 2007.
The site is bordered by North Harbor Drive and the King Harbor marina to the west, Herondo
Street to the north, and commercial properties to the east and south (Figure 2).
The existing facilities at the site include the steam power generating plants, above-ground stor-
age tanks, abandoned tank pads, settling basins, pipelines, electrical switching and transmission
facilities, office and maintenance/storage buildings, and other appurtenant features. Other im-
provements include asphalt- and concrete-paved driveways, parking lots, and storage areas, and
minor landscaped areas.
A geotechnical evaluation for redevelopment of the RBGS facility was conducted at the site in
2001 by URS (URS, 2001). The report contains the following historical information regarding
site development:
• Review of 1940 aerial photographs showed that a portion of the north part of the property had been developed with a power plant, portions of the site were undeveloped, and an ellip-tical-shaped lake, estimated to be approximately six acres, was located on the site. The surface elevation of the lake was estimated to be near sea level.
• Borings later drilled in the 1940s beyond the extent of the lake encountered marsh deposits of varying thickness, suggesting that the lake had covered a larger area in the past. The ap-proximate limits of the exposed marsh as reported by Dames & Moore in 1946 are shown on Figure 3.
• By 1947, the original power plant had been removed and the lake had been filled.
• A new power plant with four stacks had been built at the site by 1952. According to a 1952 geotechnical report by others referenced in the URS report, the area occupied by the previ-ous lake had been backfilled to an elevation ranging from approximately 4 to 16 feet above MSL.
208356001 R Prelim Geo Eval (RBGS).doc 3

Redondo Beach Generating Station October 31, 2011 Redondo Beach, California Project No. 208356001
• The above-ground storage tanks that were formerly located on the recessed tank pads along the east and south sides of the site were constructed in phases between the 1940s and prior to 1970.
4. PROJECT DESCRIPTION
Based on review of conceptual plans, the proposed re-powering improvements will generally be
located in the northeast part of the facility (Figure 3). The proposed improvements will generally
be located in the areas of the abandoned tank pads, but some existing site improvements could be
demolished prior to construction of the new improvements. The preliminary plan concept shows
a scheme of four new power generating units in the northeast part of the site. The major equip-
ment to be installed includes combustion gas turbine generators, heat recovery steam generators
and their associated stacks, as well as a steam turbine generator. Other associated equipment will
include electrical equipment units, new water tanks, above-ground and buried piping and con-
duits, and related appurtenant structures and improvements. We understand that the project may
also include new retention basins up to 10 feet deep and construction of buildings for offices,
control rooms and/or electrical switchgear. We anticipate that the project would also involve new
pavements and hardscape improvements. In general, we anticipate that the proposed project im-
provements will be built at or near existing site grades. We anticipate that recessed tank basin
areas would be filled to elevations similar to other areas of the site. Earthwork associated with
the construction would include preparation of structure and equipment pads, pavement and hard-
scape areas, detention basins, and trench excavations for pipelines and utility lines up to
approximately 10 feet deep.
Based on review of general foundation load data provided to us, the major equipment loads (in-
cluding concrete mats) range from 330 to 25,700 kilopounds (kips) with bearing pressures
ranging from 1,300 to 3,300 pounds per square foot. The preliminary plans and data indicate that
some of the proposed equipment is sensitive to settlement, particularly the combustion gas tur-
bine generators, steam turbine generators and heat recovery steam generators. The plans indicate
a total settlement tolerance of generally less than approximately 1 inch, and differential settle-
ment tolerances of 0.2 percent slope between adjacent column support points for a building, and
¼ inch between equipment within the power block. Site-specific foundation plans for the pro-
208356001 R Prelim Geo Eval (RBGS).doc 4

Redondo Beach Generating Station October 31, 2011 Redondo Beach, California Project No. 208356001
posed improvements were not available for our review at the time of the preparation of this re-
port.
5. SUBSURFACE EVALUATION AND LABORATORY TESTING
Our subsurface exploration at the site was performed on August 10 and 11, 2011, and consisted
of the drilling, logging, and sampling of four small-diameter borings (B-1 through B-4), and per-
formance of four CPTs (CPT-1 through CPT-4). The locations of the exploratory borings and
CPTs are shown on Figure 3. Prior to exploration, a geophysical survey was performed at each
location to check for utility conflicts. In addition, the upper approximately 5 feet of the explora-
tory borings and CPT’s were hand-augered for utility clearance. The borings were drilled to a
depth of up to approximately 51½ feet below the ground surface. The borings were logged and
sampled by a representative from our firm. Bulk and relatively undisturbed soil samples were
obtained at selected depths for laboratory testing. The CPTs were advanced to a depth of up to
approximately 46 feet. Logs of the exploratory borings and CPTs are presented in Appendix A.
Laboratory testing of representative soil samples was performed to evaluate in-situ moisture con-
tent and dry density, percent of particles finer than the No. 200 sieve, direct shear strength, soil
corrosivity, and sand equivalent. The results of our in-situ moisture content and dry density tests
are presented on the boring logs in Appendix A. The remaining laboratory testing results are pre-
sented in Appendix B.
6. GEOLOGY
6.1. Regional Geology
The project site is located on a coastal terrace and mapped as being generally underlain by
fill and eolian (wind-blown) deposits. The regional geologic mapping indicates that the site
is underlain by younger and older dune sand deposits generally comprised of poorly to mod-
erately consolidated fine-grained sand (Dibblee, 1999). A regional geologic map is shown in
Figure 4.
208356001 R Prelim Geo Eval (RBGS).doc 5

Redondo Beach Generating Station October 31, 2011 Redondo Beach, California Project No. 208356001
The project site is situated in the Los Angeles Basin at the northwest end of the Peninsular
Ranges geomorphic province of southern California (Norris and Webb, 1990). Geologically,
the Los Angeles Basin and vicinity is a region divided into four structural blocks that include
uplifted zones and synclinal depressions. The structural blocks are generally bounded by
faults. The project site is situated in the Southwestern block bounded to the northeast by the
onshore segment of the Newport-Inglewood Fault Zone and on the southwest by the Palos
Verdes fault. Our review of geologic literature indicates that a segment of the Palos Verdes
fault is located about 1 mile southwest of the site. The on-shore segment of the Newport-
Inglewood fault is located approximately 7½ miles northeast of the site.
6.2. Site Geology
Our subsurface evaluation indicates that the site is underlain by fill, younger dune sand de-
posits, marsh deposits, and older dune sand deposits. Fill generally consisting of loose to
medium dense, silty sand and sand was encountered in each of our borings B-1 through B-4.
The fill extended to depths ranging from approximately 1 to 8 feet.
Younger dune sand deposits primarily consisting of loose to dense, sand, silty sand, and
clayey sand were encountered below the fill to the depths ranging from approximately 15 to
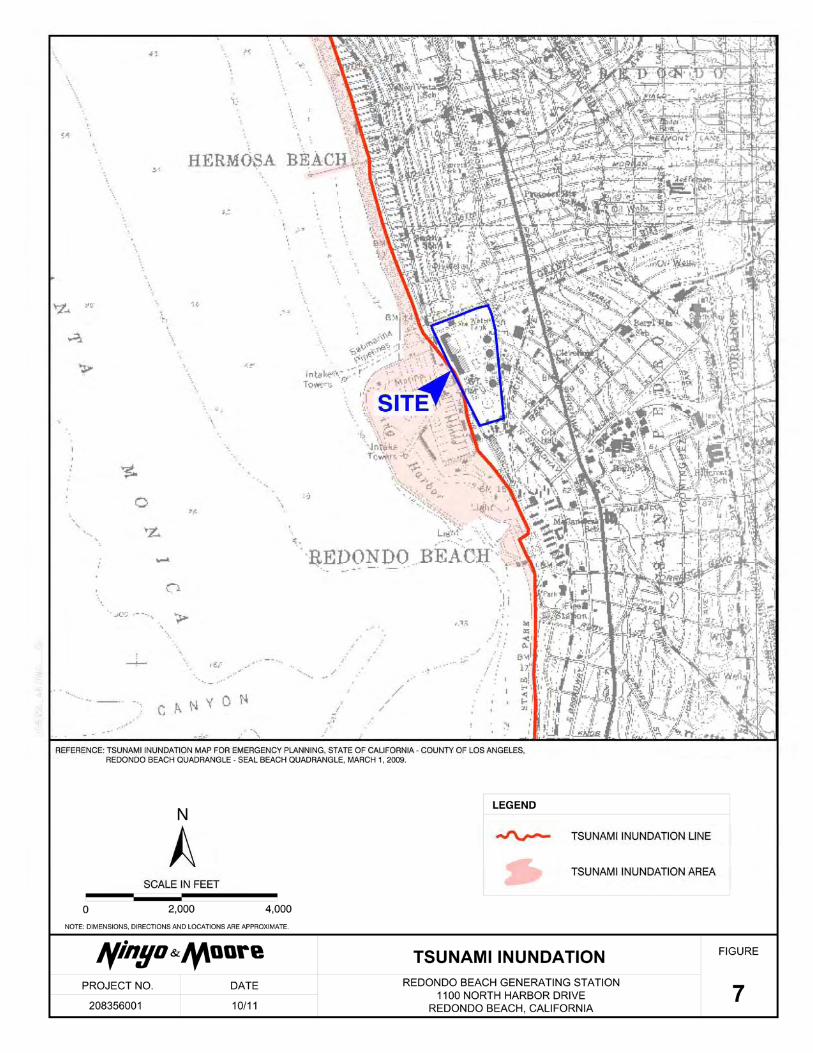
33 feet. Marsh deposits were encountered in our boring B-3 and B-4 in the central and
southern parts of the site interlayered within the younger dune sand deposits. The marsh de-
posits encountered from approximately 10 to 13 feet deep in B-3 comprised an
approximately 3 foot thick layer of firm, clayey silt. The marsh deposits encountered from
approximately 9 to 14 feet deep in B-4 comprised an approximately 5 foot thick layer of
soft, sandy clay. Older dune sand deposits primarily consisting of very dense, sand and silty
sand were encountered below the younger dune deposits and marsh deposits to the depths
explored of approximately 51½ feet. More detailed descriptions are presented on the boring
logs in Appendix A.
The 2001 URS geotechnical evaluation included 12 exploratory borings and 12 CPTs, and
presentation of previous data and mapping by other geotechnical consultants. Fill ranging
from approximately 2 to 10 feet thick was encountered by URS during their exploration at
208356001 R Prelim Geo Eval (RBGS).doc 6

Redondo Beach Generating Station October 31, 2011 Redondo Beach, California Project No. 208356001
the site and is reported to be up to approximately 20 feet thick in some places (URS, 2001).
Marsh deposits ranging from approximately 5 to 15 feet thick were also reportedly encoun-
tered by URS in areas located in the approximate center of the site. Marsh deposits were
reportedly not encountered in their exploration along the east side of the site.
6.3. Groundwater
Groundwater was observed in our exploratory borings at the time of drilling at depths rang-
ing from less than one foot to approximately 14 feet. The groundwater depth variability was
primarily due to the difference in the ground surface elevations of the borings. Shallow
groundwater was encountered in the borings located in the lower recessed tank areas (bor-
ings B-1 and B-2) and deeper groundwater was encountered at the borings where the ground
surface was more elevated (borings B-3 and B-4). The groundwater depths observed at the
time of drilling are not considered stabilized groundwater depths.
The elevation of groundwater encountered in our borings B-1, B-2 and B-3 was on the order
of 1 foot above MSL. The groundwater encountered in these borings was observed in sandy
materials, while in boring B-4, groundwater was encountered at a deeper elevation of ap-
proximately 6 feet below MSL in clayey materials, in which groundwater levels typically
take longer to stabilize. Dames & Moore reportedly recorded groundwater levels in 1952
ranging from 2 feet above to 1 foot below MSL, which were similar to groundwater levels
reported by URS in 2001 (URS, 2001).
The California Geologic Survey (CGS) Seismic Hazard Zone report for this area indicates
that the historic high groundwater in the vicinity of the site is approximately 10 feet below
the ground surface along the east and north sides of the site (CDMG, 1997). Fluctuations in
the depth to groundwater will occur due to tidal variations, seasonal precipitation, variations
in ground elevations, groundwater pumping and other factors.
208356001 R Prelim Geo Eval (RBGS).doc 7

Redondo Beach Generating Station October 31, 2011 Redondo Beach, California Project No. 208356001
7. FAULTING AND SEISMICITY
7.1. Regional Seismicity
The site is located in a seismically active area, as is the majority of southern California, and
the potential for strong ground motion in the project area is considered significant during the
design life of the proposed structures. Figure 5 shows the approximate site location relative
to the principal faults in the region. Based on our background review and site reconnais-
sance, the project site is not transected by known active or potentially active faults. The site
is not located within a State of California Earthquake Fault Zone (EFZ) (Hart and Bry-
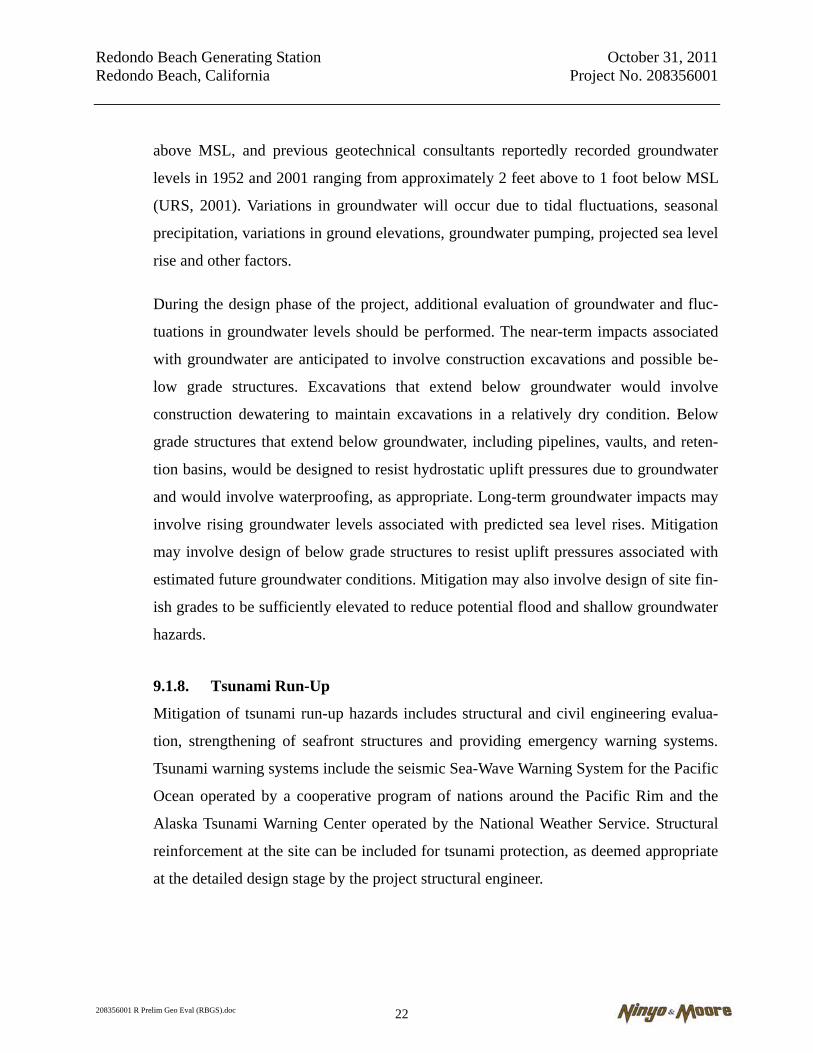
ant, 1997). The site is located within a State of California Seismic Hazard Zone as an area
considered susceptible to liquefaction (CDMG, 1999), as shown on Figure 6.
Known principal active faults within approximately 20 miles of the project site include the
Palos Verdes, Newport-Inglewood fault zone, Santa Monica, Puente Hills (blind thrust),
Malibu Coast, Hollywood, Upper Elysian Park (blind thrust), and Anacapa-Dume (Table 1).
The active San Andreas fault zone is located approximately 50 miles northeast of the site.
Mapped surface faults are shown on Figure 5. The San Joaquin Hills, Puente Hills, North-
ridge, and Upper Elysian Park blind thrust faults are not mapped. Blind thrust faults are low-
angle faults at depth that do not break the surface and are, therefore, not shown on Figure 5.
Although blind thrust faults do not have a surface trace, they can be capable of generating
damaging earthquakes and are included in Table 1.
Table 1 lists selected principal known active faults that may affect the project site, the maxi-
mum moment magnitude (Mmax) as published by the CGS (Cao, et al., 2003), and significant
historic earthquakes that have occurred on the fault. The approximate distances from the
faults to the site listed in the table were calculated by the computer program FRISKSP
(Blake, 2001).
208356001 R Prelim Geo Eval (RBGS).doc 8

Redondo Beach Generating Station October 31, 2011 Redondo Beach, California Project No. 208356001
Table 1 – Principal Regional Active Faults
Fault Approximate Fault
to Site Distance miles (km)1
Maximum Moment
Magnitude
(Mmax)2
Significant Historic Earthquakes3
Palos Verdes 1.1 (1.7) 7.3 -
Newport-Inglewood (L.A. Basin) 7.7 (12.4) 7.1 M6.4 Long Beach, 3/10/1933
Santa Monica 13.7 (22.1) 6.6 - Puente Hills (Blind Thrust) 14.7 (23.6) 7.1 - Malibu Coast 14.8 (23.8) 6.7 - Hollywood 16.2 (26.0) 6.4 - Upper Elysian Park (Blind Thrust) 17.6 (28.3) 6.4 - Anacapa - Dume 19.6 (31.6) 7.5 -
Northridge (East Oak Ridge) 21.1 (34.0) 7.0 M6.7 Northridge,
1/7/1994 Raymond 21.2 (34.1) 6.5 - Verdugo 23.1 (37.2) 6.9 -
Whittier 23.5 (37.8) 6.8 M5.9 Whittier Narrows,
(Workman Hill fault extension)
Sierra Madre 27.5 (44.3) 7.2 - San Joaquin Hills (Blind Thrust) 28.5 (45.9) 6.6 -
Clamshell – Sawpit Canyon 32.0 (51.5) 6.5 M5.8 Sierra Madre, 6/28/1991
San Jose 32.1 (51.6) 6.4 M4.7 Upland, 6/28/1988M5.4 Upland, 2/28/1990
Santa Susana 32.3 (52.0) 6.7 - San Gabriel 33.0 (53.1) 7.2 - Simi-Santa Rosa 35.9 (57.7) 7.0 -
Chino – Central Ave. (Elsinore) 35.2 (56.6) 6.8 M6 Elsinore, 5/15/1910
Holser 37.2 (59.8) 6.5 - Cucamonga 42.6 (68.6) 6.9 - San Cayetano 45.7 (73.5) 7.0 - Coronado Bank 48.3 (77.7) 7.6 - San Andreas – Mojave/1857 Rupture 50.7 (81.5) 7.4 M7.9 Fort Tejon, 1/9/1857Notes: 1 Blake, 2001. 2 Cao, et al., 2003. 3 Southern California Earthquake Center (SCEC), 2004.
208356001 R Prelim Geo Eval (RBGS).doc 9
Redondo Beach Generating Station October 31, 2011 Redondo Beach, California Project No. 208356001
8. POTENTIAL GEOLOGIC AND SEISMIC HAZARDS
The proposed project has been evaluated with respect to its potential impacts on the geologic en-
vironment and the potential impacts that geologic and seismic hazards may have on the proposed
project. The principal seismic hazards evaluated at the site are surface ground rupture, ground
shaking, seismically induced liquefaction, and various manifestations of liquefaction-related
hazards (e.g., dynamic settlement and lateral spreading). A brief description of these hazards and
other geologic hazards are discussed in the following sections. Where appropriate, recommenda-
tions to mitigate potential geologic hazards, as noted, are provided in subsequent sections.
8.1. Surface Fault Rupture
Surface fault rupture is the offset or rupturing of the ground surface by relative displacement
across a fault during an earthquake. Based on our review of referenced geologic and fault
hazard data, the site is not transected by known active or potentially active faults. The prop-
erty is not located in a State of California EFZ. Therefore, the potential for surface rupture is
relatively low.
8.2. Seismic Ground Shaking
Earthquake events from one of the regional active or potentially active faults near the project
area could result in strong ground shaking which could affect the project site. The level of
ground shaking at a given location depends on many factors, including the size and type of
earthquake, distance from the earthquake, and subsurface geologic conditions. The type of
construction also affects how particular structures and improvements perform during ground
shaking.
In order to evaluate the level of ground shaking that might be anticipated at the project loca-
tion, site-specific analysis was performed. The 2010 California Building Code (CBC)
recommends that the design of structures be based on the horizontal peak ground accelera-
tion (PGA) having a 2 percent probability of exceedance in 50 years which is defined as the
Maximum Considered Earthquake (MCE). The statistical return period for PGAMCE is ap-
proximately 2,475 years. Using the USGS (2011) ground motion calculator, the probabilistic
208356001 R Prelim Geo Eval (RBGS).doc 10

Redondo Beach Generating Station October 31, 2011 Redondo Beach, California Project No. 208356001
PGAMCE for the project site was calculated as 0.81g. The design PGA was estimated to be
0.54g using the USGS ground motion calculator. These estimates of ground motion do not
include near-source factors that may be applicable to the design of structures on site. The
guidelines of the governing jurisdictions and the 2010 CBC should be considered in project
design. These potential levels of ground shaking could impact the proposed re-powering pro-
ject without appropriate design mitigation and should be considered during the detailed
design phase of the project.
8.3. Liquefaction, Dynamic Settlement and Lateral Spreading
Liquefaction is the phenomenon in which loosely deposited granular soils located below the
water table undergo rapid loss of shear strength due to excess pore pressure generation when
subjected to strong earthquake-induced ground shaking. Ground shaking of sufficient dura-
tion results in the loss of grain-to-grain contact due to rapid rise in pore water pressure
causing the soil to behave as a fluid for a short period of time. Liquefaction is known gener-
ally to occur in saturated or near-saturated cohesionless soils at depths shallower than 50 feet
below the ground surface. Factors known to influence liquefaction potential include compo-
sition and thickness of soil layers, grain size, relative density, groundwater level, degree of
saturation, and both intensity and duration of ground shaking.
The project site is mapped in a State of California Seismic Hazard Zone as potentially lique-
fiable as shown on Figure 6 (CDMG, 1998). Our evaluation of the potential for liquefaction
included the results of the CPT soundings, the exploratory borings and our laboratory test
results of representative soil samples. The liquefaction analysis was based on the National
Center for Earthquake Engineering Research (NCEER) procedure (Youd, et al., 2001) de-
veloped from the methods originally recommended by Seed and Idriss (1982) using the
computer program LiquefyPro (CivilTech, 2008). Due to the variability in site elevations
and groundwater depths, a depth to groundwater of 2 feet was used in our analysis. A
PGADBE of 0.54g was used in our analysis for a design earthquake magnitude of 7.7. Our
analysis indicated that scattered saturated sandy alluvial layers between approximately 2 and
208356001 R Prelim Geo Eval (RBGS).doc 11
Redondo Beach Generating Station October 31, 2011 Redondo Beach, California Project No. 208356001
38 feet are potentially liquefiable during the design earthquake event. The results of the liq-
uefaction analysis are presented in Appendix C.
To evaluate the potential impact from liquefaction, we also performed analysis to estimate
the magnitude of dynamic settlement due to liquefaction. In order to estimate the amount of
post-earthquake settlement, the method proposed by Tokimatsu and Seed (1987) is generally
used in which the seismically induced cyclic stress ratios and corrected blow counts
(N-values) are correlated to the volumetric strain of the soil. The amount of soil settlement
during a strong seismic event depends on the thickness of the liquefiable layers and the den-
sity and/or consistency of the soils. Our analysis indicates that liquefaction-induced
settlement at the project site would be approximately 2 inches or less (Appendix C). Lique-
faction-induced settlement estimates by URS ranged from 1 to 7 inches in various locations
at the project site (URS, 2001).
Lateral spreading of the ground surface during an earthquake usually takes place along weak
shear zones that have formed within a liquefiable soil layer. Lateral spread has generally
been observed to take place in the direction of a free-face (i.e., retaining wall, slope, chan-
nel) but has also been observed to a lesser extent on ground surfaces with gentle slopes. An
empirical model developed by Youd, et al. (2002) is typically used to predict the amount of
horizontal ground displacement within a site. For sites located in proximity to a free-face,
the amount of lateral ground displacement is strongly correlated with the distance of the site
from the free-face. Other factors such as earthquake magnitude, distance from the earth-
quake epicenter, thickness of the liquefiable layers, and the fines content and particle sizes
of the liquefiable layers also affect the amount of lateral ground displacement. Based on
analysis of the sampler blow counts and generally discontinuous nature of the underlying
soil layers encountered in our exploration, the lateral spread hazard is not significant. Lateral
spread estimates by URS, however, ranged from less than one foot along the eastern bound-
ary of the site to as much as seven to ten feet along the western boundary of the project site
(URS, 2001).
208356001 R Prelim Geo Eval (RBGS).doc 12

Redondo Beach Generating Station October 31, 2011 Redondo Beach, California Project No. 208356001
8.4. Mass Wasting
Mass wasting is an erosional process by which soil or earth material is loosened or dissolved
and removed from its original location. Erosion can occur by varying processes and may oc-
cur at the project site where bare soil is exposed to wind or moving water (both rainfall and
surface runoff). The processes of erosion are generally a function of material type, terrain
steepness, rainfall or irrigation levels, surface drainage conditions, and general land uses.
Our subsurface exploration indicates that the near-surface soils at the project site are pre-
dominantly comprised of silty sand and sand. Sandy soils typically have low cohesion and
have a relatively higher potential for erosion from surface runoff. Surface soils with higher
amounts of clay or silt tend to be less erodible as the clay and silt acts as a binder to hold the
soil particles together.
Construction of the proposed project would result in ground surface disruption during demo-
lition, excavation, grading, and trenching that would create the potential for erosion to occur.
However, a Storm Water Pollution Prevention Program (SWPPP) incorporating Best Man-
agement Practices (BMPs) for erosion control would be prepared prior to the start of
construction. In addition, the topographic gradients at the project site are relatively gentle,
which would tend to reduce the potential for off-site runoff and erosion. During long-term
operation of the facility, surface drainage design provisions and site maintenance would
manage soil erosion at the site. Therefore, the potential impacts due to mass wasting and
erosion are considered to be relatively low.
8.5. Slope Stability
Landslides, slope failures, and mudflows of earth materials generally occur where slopes are
steep and/or the earth materials too weak to support themselves. Earthquake-induced land-
slides may also occur due to seismic ground shaking. The re-powering improvement area is
relatively flat and there are no significant slopes within the project limits, nor are slopes pro-
posed as part of the project development. The berm slopes that bound the recessed tank
basin areas are approximately 10 feet high and are inclined at 2:1 (horizontal to vertical) gra-
dients. Based on the low height and 2:1 inclination, these berm slopes are not considered to
208356001 R Prelim Geo Eval (RBGS).doc 13

Redondo Beach Generating Station October 31, 2011 Redondo Beach, California Project No. 208356001
have a potential for significant sliding or failure, other than shallow erosion. Therefore, there
is a low potential for impacts related to landslides or mudflows within the limits of the re-
powering improvement area.
8.6. Subsidence
Subsidence is characterized as a sinking of the ground surface relative to surrounding areas,
and can generally occur where deep soil deposits are present. Subsidence in areas of deep
soil deposits is typically associated with regional groundwater withdrawal or other fluid
withdrawal from the ground such as oil and natural gas. Subsidence can result in the devel-
opment of ground cracks and damage to foundations, buildings and other improvements.
Subsidence related to historic oil and gas withdrawal that has resulted in significant ground
subsidence has been documented in areas of the City of Long Beach. The site is not located
in an area of significant oil or gas development. A few scattered oil wells are present within
approximately 2,000 feet east of the site, but major oil field developments are located in Tor-
rance and Wilmington three miles or more to the east and southeast. Based on our
background review, the project site is not located in an area of known historic subsidence.
Therefore, the potential for subsidence is relatively low.
8.7. Compressible/Collapsible Soils
Compressible soils are generally comprised of soils that undergo consolidation when ex-
posed to new loading, such as fill or foundation loads. Soil collapse is a phenomenon where
the soils undergo a significant decrease in volume upon increase in moisture content, with or
without an increase in external loads. Buildings, structures and other improvements may be
subject to excessive settlement-related distress when compressible soils or collapsible soils
are present.
Based on our subsurface exploration and background review, the project site is underlain ex-
isting fill soils, alluvial deposits, marsh deposits, and older dune sand deposits. Older,
undocumented fill soils are considered potentially compressible. In addition, some relatively
softer (firm) marsh deposits and soft clayey alluvium were encountered, which are consid-
208356001 R Prelim Geo Eval (RBGS).doc 14

Redondo Beach Generating Station October 31, 2011 Redondo Beach, California Project No. 208356001
ered potentially compressible. Due to the high groundwater levels encountered at the site
and the reported historically high groundwater, it is our opinion that the site soils are not
susceptible to hydro-collapse. Due to the presence of potentially compressible soils at the
site, the potential impacts of settlement could be significant without appropriate mitigation
during detailed project design and construction.
8.8. Expansive Soils
Expansive soils include clay minerals that are characterized by their ability to undergo sig-
nificant volume change (shrink or swell) due to variations in moisture content. Sandy soils
are generally not expansive. Changes in soil moisture content can result from rainfall, irriga-
tion, pipeline leakage, surface drainage, perched groundwater, drought, or other factors.
Volumetric change of expansive soil may cause excessive cracking and heaving of structures
with shallow foundations, concrete slabs-on-grade, or pavements supported on these materi-
als. Constructing project improvements on soils known to be potentially expansive could
have a significant impact to the project. Based on our subsurface exploration, the near-
surface soils at the project site are predominantly comprised of silty sand and sand. These
soils typically have a low expansion potential. However, clayey (expansive) soils have been
encountered at the site, and the site-specific potential for expansive soils at the location of
the proposed improvements should be evaluated during the detailed design stage of the pro-
ject in order to provide recommendations to mitigate the potential impacts of expansive
soils.
8.9. Corrosive Soils
The project site is located in a geologic environment that could potentially contain soils that
are corrosive to concrete and metals. Corrosive soil conditions may exacerbate the corrosion
hazard to buried conduits, foundations, and other buried concrete or metal improvements.
Corrosive soil could cause premature deterioration of these underground structures or foun-
dations. Constructing project improvements on corrosive soils could have a significant
208356001 R Prelim Geo Eval (RBGS).doc 15

Redondo Beach Generating Station October 31, 2011 Redondo Beach, California Project No. 208356001
impact to the project. Recommendations should be provided by a corrosion engineer during
the detailed design phase of the project to mitigate the potential impacts of corrosive soils.
The corrosion potential of the on-site soil was evaluated for its effect on steel and concrete
structural members. Laboratory testing was performed on a representative soil sample to
evaluate pH, minimum electrical resistivity, and chloride and soluble sulfate content. The pH
and minimum electrical resistivity test were performed in accordance with California Test
(CT) 643, and sulfate and chloride test was performed in accordance with CT 417 and 422,
respectively.
The pH of the tested sample was measured at approximately 7.6, the electrical resistivity
was measured at approximately 19,260 ohm-centimeters, the chloride content was measured
at approximately 40 parts per million (ppm), and the sulfate content was measured at ap-
proximately 0.001 percent. Based on the laboratory test results and Caltrans (2003)
corrosion criteria, the project site can be classified as a non-corrosive site, which is defined
as having earth materials with less than 500 ppm chlorides, a sulfate concentration of
0.20 percent (i.e., 2,000 ppm) or less, a pH of more than 5.5, or an electrical resistivity of
more than 1,000 ohm-centimeters.
8.10. Groundwater
Based on our background review, historic high groundwater levels at the site have been
mapped at a depth of approximately 10 feet (CDMG, 1997). During our subsurface explora-
tion groundwater was encountered at depths ranging from less than one foot to
approximately 14 feet below the ground surface. The groundwater depth variability encoun-
tered in the borings was primarily due to the difference in the ground surface elevations of
the borings. However, the elevation of groundwater encountered in our borings B-1, B-2 and
B-3 was similar, on the order of 1 foot above MSL. Further, Dames & Moore reportedly re-
corded groundwater levels in 1952 ranging from approximately 2 feet above to 1 foot below
MSL, and URS recorded similar groundwater levels in 2001 (URS, 2001). Based on the re-
ported data by Dames & Moore and URS, and the groundwater levels encountered by Ninyo
& Moore, the groundwater at the project site has been documented at an elevation ranging
208356001 R Prelim Geo Eval (RBGS).doc 16

Redondo Beach Generating Station October 31, 2011 Redondo Beach, California Project No. 208356001
from approximately 2 feet above to 1 foot below MSL. Groundwater levels will vary and
may be influenced by tidal fluctuations, precipitation, irrigation, groundwater pumping, pro-
jected sea level rise and other factors.
Construction activities for the proposed project are anticipated to consist of possible in-situ
ground improvement or driven piles for structure foundations. Based on site conditions and
our preliminary foundation analysis, deep foundation excavations are not anticipated. Based
on preliminary project plans, excavations up to approximately 10 feet deep are anticipated at
the site for basin construction, pavements, slabs-on-grade, pipelines, and removal and re-
placement of soils supporting associated project improvements. Based on our subsurface
exploration and the reported historic groundwater levels, groundwater may be encountered
during excavation activities in the lower areas of the site. Groundwater, if encountered,
could have potential impacts on excavations and construction activities for the project.
Therefore, the potential impacts of groundwater should be evaluated prior to detailed design
and construction, particularly in areas of deeper excavations.
8.11. Geologic Resources
The potential for geologic resources of recreational, commercial or scientific value to be af-
fected by the proposed project was evaluated. The California Geological Survey and the
State Mining and Geology Board (SMGB) classify the regional significance of mineral re-
sources in accordance with the California Surface Mining and Reclamation Act of 1975. The
SMGB uses a classification system that divides land into four Mineral Resource Zones
(MRZ) that have been designated based on quality and significance of mineral resources
(CDMG, 1983). According to the State of California (CDMG, 1994), the project site is lo-
cated in an area classified as MRZ-3, which is defined as “areas containing mineral the
significance of which can not be evaluated from available data.” Based on our background
review and subsurface exploration, the project site is underlain by sand, silt and clay allu-
vial/estuarine and marine sediments that are not considered to have significant recreational,
commercial or scientific value.
208356001 R Prelim Geo Eval (RBGS).doc 17

Redondo Beach Generating Station October 31, 2011 Redondo Beach, California Project No. 208356001
Rock exposures or other prominent geologic features were not observed on the surface at the
project site and are not anticipated at shallow depth. The existing topography of the project
site is comprised of gently sloping to relatively flat natural gradients, and prominent topog-
raphic features were not observed at the site. The existing power plant improvements
generally cover the ground surface at the site. The project site is underlain by alluvial and
dune sand sediments that are not considered to have significant recreational, commercial or
scientific value. Further, there is an abundance of these sediments at the site and in the sur-
rounding vicinity. The proposed construction will result in minor grading and trenching
activities, and is not anticipated to significantly alter the existing topography or remove sig-
nificant materials from the site. Therefore, geologic resources of recreational, commercial or
scientific value will not be affected by the proposed project.
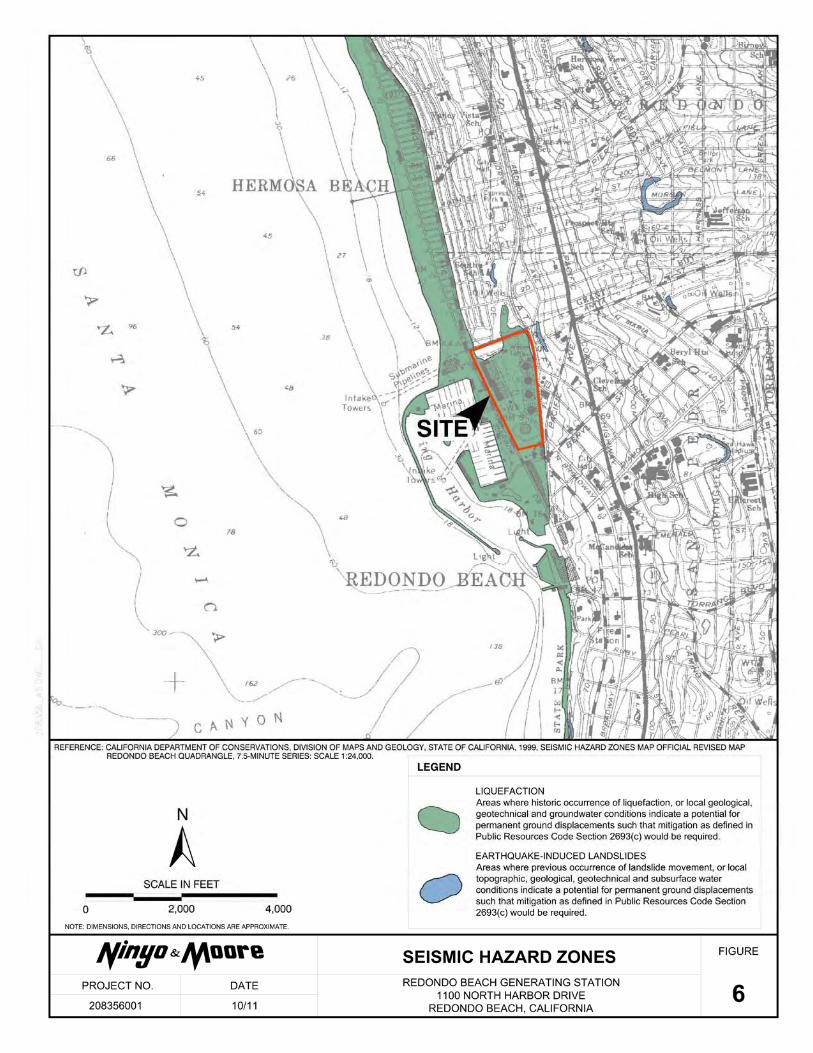
8.12. Tsunami Run-Up
Tsunamis are open-sea waves generated by earthquakes that can impact low-lying coastal
areas. Water surge caused by tsunamis is measured by distance of run-up on the shore. As
shown on Figure 7, the project site is not located in a State of California Tsunami Inundation
Area mapped for susceptibility to tsunami run-up hazard (California Emergency Manage-
ment Agency, 2009). Therefore, there is a low potential for Tsunami run-up at the site.
However, the western side of the site is located along the border of a tsunami run-up hazard
zone, and it may be appropriate to evaluate the potential effects of tsunami run-up hazard for
this part of the site during the detailed design phase of the project.
Tsunamis are relatively uncommon hazards in California. During historic time, eleven tsu-
namis have occurred in California large enough to cause damage (State of California, 2005).
In southern California, a significant tsunami was associated with the 1960 Chile Earthquake,
which caused damage in ports and harbors from San Diego to Crescent City. Damage oc-
curred in the Long Beach-Los Angeles Harbor, where 5-foot-high waves surged back and
forth in channels, causing damage to small boats and yachts. Tsunami tidal surge occurred in
the Long Beach Harbor due to the Magnitude 8.8 Chile earthquake in February 2010, and
minor effects were reported in California due to the March 2011, Japan Tsunami.
208356001 R Prelim Geo Eval (RBGS).doc 18

Redondo Beach Generating Station October 31, 2011 Redondo Beach, California Project No. 208356001
9. PRELIMINARY CONCLUSIONS AND MITIGATION ALTERNATIVES
Based on the results of our geotechnical evaluation, the project site is considered suitable for the
proposed improvements from a geotechnical perspective. The potential geologic and seismic
hazards described above may be mitigated by employing sound engineering practice in the de-
sign and construction of the new power generating facilities and associated improvements. This
practice includes the implementation of appropriate geotechnical recommendations during the
design and construction of the improvements at the site. Typical methods to mitigate potential
significant hazards that may be encountered during the construction of the improvements are de-
scribed in the following sections. Prior to design, a detailed subsurface geotechnical evaluation
should be performed to address the site-specific conditions at the locations of the planned im-
provements and to provide detailed recommendations for design and construction.
9.1. Hazard Mitigation
Mitigation alternatives for potentially significant impacts at the project site are provided in
the following sections.
9.1.1. Seismic Ground Shaking
Mitigation of the potential impacts of seismic ground shaking can be achieved through
project design. During the detailed design phase, site-specific seismic design parameters
would be developed from detailed geotechnical evaluation for use by the project struc-
tural engineer. Structural elements of the project can then be designed to resist or
accommodate appropriate site-specific ground motions and to conform to the current
seismic design standards.
9.1.2. Liquefaction and Dynamic Settlement
Mitigation alternatives for potential dynamic settlement related to liquefaction include
supporting structures on deep pile foundations that extend through the liquefiable zones
into competent material. Alternatively, densification of the liquefiable soils using in-situ
ground improvement techniques such as vibro-replacement stone columns, rammed ag-
gregate piers or compaction grouting would mitigate the liquefaction hazard and the
208356001 R Prelim Geo Eval (RBGS).doc 19

Redondo Beach Generating Station October 31, 2011 Redondo Beach, California Project No. 208356001
new structures could then be supported on shallow foundation systems. From a geo-
technical engineering perspective, each of these alternative methods is considered
feasible, and would reduce the liquefaction hazard impact to acceptable levels.
9.1.3. Mass Wasting
Construction for the proposed project is anticipated to create the potential for soil ero-
sion during excavation, grading, and trenching activities. However, with the
implementation of BMPs incorporated in the project SWPPP during construction, wa-
ter- and wind-related soil erosion can be limited and managed within construction site
boundaries. Examples of these procedures include the use of erosion prevention mats or
geofabrics, silt fencing, sandbags, plastic sheeting, and temporary drainage devices.
Positive surface drainage should be provided at construction sites to allow surface run-
off to flow away from site improvements or areas susceptible to erosion, such as
embankments. To mitigate wind-related erosion, wetting of soil surfaces and/or cover-
ing exposed ground areas and soil stockpiles could be considered during construction
operations, as appropriate. The use of soil tackifiers may also be considered to reduce
the potential for water- and wind-related soil erosion, as appropriate.
During long-term operation of the project, soil erosion can be mitigated through appro-
priate site drainage design and maintenance practices. Erosion protections such as
positive drainage gradients, paved surfaces, vegetation, desilting basins and other fea-
tures can be provided to reduce soil erosion. Drainage design would address reducing
concentrated run-off conditions that could cause erosion and affect the stability of pro-
ject improvements.
9.1.4. Compressible Soils
To mitigate potential settlement at the site, the major power generating structures can be
supported on pile foundations or in-situ ground improvement zones designed to limit
settlement to acceptable levels so that structures are not adversely impacted. To mitigate
potential settlement for other relatively light minor structures, new pavements and hard-
208356001 R Prelim Geo Eval (RBGS).doc 20

Redondo Beach Generating Station October 31, 2011 Redondo Beach, California Project No. 208356001
scape, loose/soft soils encountered at the subgrade and foundation levels of these im-
provements during construction can be removed and replaced with suitable compacted
fill, based on detailed design stage recommendations.
9.1.5. Expansive Soils
The potential for expansive soils to impact project improvements can be mitigated by
techniques such as removal of near-surface expansive soils and replacement with low
expansive material during construction, or designing project improvements to resist the
effects of expansive soils.
9.1.6. Corrosive Soils
The project site is generally located in a sandy soil environment and soils obtained dur-
ing our subsurface explorations can be classified as non-corrosive. However, the project
site is located in a geologic environment that could potentially contain soils that are cor-
rosive to concrete and metals, and the potential for corrosive soils should be further
evaluated during the detailed design phase of the project. If needed, mitigation of corro-
sive soil conditions may involve the use of concrete resistant to sulfate exposure.
Corrosion protection for metals may be needed for underground foundations or struc-
tures in areas where corrosive groundwater or soil could potentially cause deterioration.
Typical mitigation techniques include epoxy and metallic protective coatings, the use of
alternative (corrosion resistant) materials, and selection of the appropriate type of ce-
ment and water/cement ratio. Specific measures to reduce the potential effects of
corrosive soils would be developed in the detailed design phase.
9.1.7. Groundwater
The subject property includes variable topography with ground surface elevations rang-
ing from approximately 0 to 20 feet above MSL. Due to the difference in the ground
surface elevations of the borings, groundwater was encountered at depths ranging from
less than one foot to approximately 14 feet below the ground surface. The elevation of
groundwater encountered in our borings B-1, B-2 and B-3 was on the order of 1 foot
208356001 R Prelim Geo Eval (RBGS).doc 21
Redondo Beach Generating Station October 31, 2011 Redondo Beach, California Project No. 208356001
above MSL, and previous geotechnical consultants reportedly recorded groundwater
levels in 1952 and 2001 ranging from approximately 2 feet above to 1 foot below MSL
(URS, 2001). Variations in groundwater will occur due to tidal fluctuations, seasonal
precipitation, variations in ground elevations, groundwater pumping, projected sea level
rise and other factors.
During the design phase of the project, additional evaluation of groundwater and fluc-
tuations in groundwater levels should be performed. The near-term impacts associated
with groundwater are anticipated to involve construction excavations and possible be-
low grade structures. Excavations that extend below groundwater would involve
construction dewatering to maintain excavations in a relatively dry condition. Below
grade structures that extend below groundwater, including pipelines, vaults, and reten-
tion basins, would be designed to resist hydrostatic uplift pressures due to groundwater
and would involve waterproofing, as appropriate. Long-term groundwater impacts may
involve rising groundwater levels associated with predicted sea level rises. Mitigation
may involve design of below grade structures to resist uplift pressures associated with
estimated future groundwater conditions. Mitigation may also involve design of site fin-
ish grades to be sufficiently elevated to reduce potential flood and shallow groundwater
hazards.
9.1.8. Tsunami Run-Up
Mitigation of tsunami run-up hazards includes structural and civil engineering evalua-
tion, strengthening of seafront structures and providing emergency warning systems.
Tsunami warning systems include the seismic Sea-Wave Warning System for the Pacific
Ocean operated by a cooperative program of nations around the Pacific Rim and the
Alaska Tsunami Warning Center operated by the National Weather Service. Structural
reinforcement at the site can be included for tsunami protection, as deemed appropriate
at the detailed design stage by the project structural engineer.
208356001 R Prelim Geo Eval (RBGS).doc 22

Redondo Beach Generating Station October 31, 2011 Redondo Beach, California Project No. 208356001
9.2. Preliminary Earthwork Considerations
We anticipate that site preparation for construction of the proposed re-powering improve-
ments in the northeast part of the site would involve filling recessed tank basin areas to
elevations similar to other areas of the site. In other areas of the site, we anticipate that the
proposed project improvements will be built at or near existing site grades and earthwork as-
sociated with the construction would be relatively minor. Earthwork associated with
construction of the project is anticipated to include preparation of structure and equipment
pads, pavement and hardscape areas, detention basins, and trench excavations for pipelines
and utility lines up to approximately 10 feet deep.
Based on our subsurface exploration, we anticipate that the materials encountered in near-
surface excavations will be comprised predominantly of sand and silty sand, and these mate-
rials would be appropriate for re-use as structural fill. We recommend that backfill materials
be in conformance with the “Greenbook” (Standard Specifications for Public Works Con-
struction) specifications for structure backfill. Interbedded gravel was encountered in our
exploratory excavations, and may be encountered during excavations at the site. We antici-
pate that excavations within materials at the project site will be feasible with conventional
grading equipment; however future excavations may encounter gravel and the contractor
should anticipate these conditions.
Soils with a petroleum odor were encountered near the ground surface in boring B-1. These
soil samples were field screened for the presence of volatile organic compounds using a
calibrated organic vapor meter equipped with a photoionization detector (PID). The PID
reading recorded at approximately 1 foot in B-1 was approximately 17 parts per million
(ppm). Contaminated soils may be encountered during construction at the project site. Contami-
nated soils should be appropriately handled, stored, tested and disposed of in accordance
with Occupational Safety and Health Administration (OSHA) and other regulatory agency
guidelines.
Based on available information, we anticipate that granular (sandy) soils will be encountered
within the construction areas. Sandy soils generally have relatively little cohesion and have a
208356001 R Prelim Geo Eval (RBGS).doc 23

Redondo Beach Generating Station October 31, 2011 Redondo Beach, California Project No. 208356001
high potential for caving. In our opinion, temporary slopes above the water table should be
stable at an inclination of 1½:1 (horizontal to vertical) for excavations deeper than 4 feet but
not more than 10 feet below existing grade. Some surficial sloughing may occur, and tempo-
rary slopes should be evaluated in the field by Ninyo & Moore in accordance with OSHA
criteria.
9.3. Preliminary Foundation Criteria
The site includes variable soil conditions which may be suitable for alternative foundation
systems. Areas with predominantly dense, sandy soil may be suitable for shallow mat foun-
dations, supported on a zone of compacted soil (over-excavation and re-compact). These
conditions are anticipated in the northeasterly portions of the site. Areas which include com-
pressible clay deposits (southern and central site areas) or where liquefaction settlement is
excessive are anticipated to involve driven pre-cast pile foundations or mat foundations
when combined with in-situ ground improvement. Additional exploration will be appropriate
to further delineate the distribution of sand and clay deposits on site. Relatively light minor
structures, new pavements and hardscape areas may be supported on suitable compacted fill,
placed in accordance with detailed geotechnical recommendations.
For preliminary planning purposes, 14-inch-diameter piles extending to approximately 40
feet with an axial capacity of 90 kips can be considered. Ground improvement techniques
such as vibro-replacement stone columns, rammed aggregate piers or compaction grouting
would mitigate the compressible soils and liquefaction hazard, and the new structures could
then be supported on shallow mat foundation systems within the ground improvement zones.
10. LIMITATIONS
The field evaluation, laboratory testing, and geotechnical analyses presented in this geotechnical
report have been conducted in general accordance with current practice and the standard of care
exercised by geotechnical consultants performing similar tasks in the project area. No warranty,
expressed or implied, is made regarding the conclusions, recommendations, and opinions pre-
sented in this report. There is no evaluation detailed enough to reveal every subsurface condition.
208356001 R Prelim Geo Eval (RBGS).doc 24

Redondo Beach Generating Station October 31, 2011 Redondo Beach, California Project No. 208356001
Variations may exist and conditions not observed or described in this report may be encountered
during construction. Uncertainties relative to subsurface conditions can be reduced through addi-
tional subsurface exploration. Additional subsurface evaluation will be performed upon request.
Please also note that our evaluation was limited to assessment of the geotechnical aspects of the
project, and did not include evaluation of structural issues, environmental concerns, or the pres-
ence of hazardous materials.
This document is intended to be used only in its entirety. No portion of the document, by itself, is
designed to completely represent any aspect of the project described herein. Ninyo & Moore
should be contacted if the reader requires additional information or has questions regarding the
content, interpretations presented, or completeness of this document.
This report is intended for inclusion in the Application of Certification for the project and for
preliminary design purposes. It does not provide sufficient data for detailed design or accurate
construction cost estimates. Prior to the design phase of the project, additional geotechnical
evaluation of the site should be performed. The purpose of additional geotechnical evaluation
would be to develop additional subsurface data and prepare detailed design and construction rec-
ommendations for the project.
Our preliminary conclusions and recommendations are based on a review of readily available
geotechnical literature, review of preliminary plans provided to us, and an analysis of the ob-
served conditions. If geotechnical conditions different from those described in this report are
encountered, our office should be notified, and additional recommendations, if warranted, will be
provided upon request. It should be understood that the conditions of a site could change with
time as a result of natural processes or the activities of man at the subject site or nearby sites. In
addition, changes to the applicable laws, regulations, codes, and standards of practice may occur
due to government action or the broadening of knowledge. The findings of this report may, there-
fore, be invalidated over time, in part or in whole, by changes over which Ninyo & Moore has no
control.
208356001 R Prelim Geo Eval (RBGS).doc 25

Redondo Beach Generating Station October 31, 2011 Redondo Beach, California Project No. 208356001
This report is intended exclusively for use by the client. Any use or reuse of the findings, conclu-
sions, and/or recommendations of this report by parties other than the client is undertaken at said
parties’ sole risk.
208356001 R Prelim Geo Eval (RBGS).doc 26

Redondo Beach Generating Station October 31, 2011 Redondo Beach, California Project No. 208356001
11. REFERENCES
Blake, T.F., 2001, FRISKSP (Version 4.00), A Computer Program for the Probabilistic Estima-tion of Peak Acceleration and Uniform Hazard Spectra Using 3-D Faults as Earthquake Sources.
California Building Code, 2010 Edition, dated July.
California Department of Conservation, Division of Mines and Geology (CDMG), 1983, Guide-lines for Classification and Designation of Mineral Lands, Special Publication 51.
California Department of Conservation, Division of Mines and Geology, 1994, Update of Min-eral Land Classification of Portland Cement Concrete Aggregate in Ventura, Los Angeles, and Orange Counties, California, Part II – Los Angeles County, Miller R.V., Open File Report 94-14.
California Department of Conservation, Division of Mines and Geology, 1997, Guidelines for Evaluating and Mitigating Seismic Hazards in California: Special Publication 117, 74 pp.
California Department of Conservation, Division of Mines and Geology, State of California, 1998, Seismic Hazard Evaluation of the Redondo Beach 7.5-Minute Quadrangle, Los Angeles, California: Open-File Report 98-22.
California Department of Conservation, Division of Mines and Geology, State of California, 1999, Seismic Hazard Zones Official Map, Redondo Beach Quadrangle, 7.5-Minute Se-ries: Scale 1:24,000, Open-File Report 98-22, dated March 25.
California Emergency Management, 2009, Tsunami Inundation Map for Emergency Planning, Redondo Beach Quadrangle: Scale 1:24,000, dated March 1.
California Energy Commission, 2008, California Code of Regulations, Title 20, Public Utilities and Energy, dated August.
California Environmental Resources Evaluation System (CERES), 2005a, The California Envi-ronmental Quality Act, Title 14; California Code of Regulations, Chapter 3; Guidelines for Implementation of the California Environmental Quality Act, Article 9; Contents of Environmental Impact Reports, Final Text dated May 25, Website: http://ceres.ca.gov/ topic/env_law/ceqa/guidelines/art9.html.
California Environmental Resources Evaluation System (CERES), 2005b, The California Envi-ronmental Quality Act, CEQA Guidelines Appendices, Appendix G – Environmental Checklist Form, Final Text dated May 25, Website: http://ceres.ca.gov/topic/env_law/ ceqa/guidelines/appendices.html.
Cao, Tianqing, Bryant, William A., Rowshandel, Badie, Branum, David, and Wills, Christopher J., 2003, The Revised 2002 California Probabilistic Seismic Hazard Maps, Adapted by California Geological Survey (CGS), dated June.
City of Long Beach, Department of Planning and Building, 1988, Seismic Safety Element, City of Long Beach General Plan: dated October.
208356001 R Prelim Geo Eval (RBGS).doc 27

Redondo Beach Generating Station October 31, 2011 Redondo Beach, California Project No. 208356001
CivilTech Corporation, 2008, LiquefyPro, Version 5.5, Liquefaction and Settlement Analysis, dated March.
County of Los Angeles Department of Regional Planning, 1990, Los Angeles County Safety Ele-ment: Scale 1 inch = 2 miles.
Dibblee, T.W., Jr., 1999, Geologic Map of the Palos Verdes Peninsula and Vicinity Redondo Beach, Torrance and San Pedro Quadrangles, Los Angeles County, California: Dibblee Geological Foundation, DF-70, Scale 1:24,000.
Google Earth, 2011, Website: http://earth.google.com.
Hart, E.W., and Bryant, W.A., 1997, Fault-Rupture Hazard Zones in California, Alquist-Priolo Special Studies Zone Act of 1972 with Index to Special Studies Zones Maps: California Division of Mines and Geology, Special Publication 42.
Jennings, C.W., and Bryant, 2010, Fault Activity Map of California: California Division of Mines and Geology, California Geologic Data Map Series, Map No. 6, Scale 1:750,000.
Ninyo & Moore, 2011, Revised Proposal for Geotechnical Consulting Services, Three Power Plants located in Redondo Beach, Alamitos, and Huntington Beach, California, dated June 15.
Norris, R.M., and Webb, R.W., 1990, Geology of California: John Wiley & Sons, 541 pp.
Power Engineers Collaborative, undated, Plot Plans, Redondo Beach Generating Station, Redondo Beach, California, Arrangement Sheets FP10, MHI2 – 2X1R1, MHI2 – 2X1R2.
Seed, H.B., and Idriss, I.M., 1982, Ground Motions and Soil Liquefaction During Earthquakes, Earthquake Engineering Research Institute Monograph, Oakland, California.
Southern California Earthquake Center, 1999, Recommended Procedures for Implementation of DMG Special Publication 117 Guidelines for Analyzing and Mitigating Liquefaction Hazards in California.
Southern California Earthquake Center, 2004, Index of Faults of California: http:// www.data.scec.org/fault_index/, dated June 17.
State of California Coastal Conservancy, 2009, Policy Statement on Climate Change, Adopted June 4.
State of California Seismic Safety Commission, 2005, The Tsunami Threat to California, dated December.
Tokimatsu, K., and Seed, H.B., 1987, Evaluation of Settlements in Sands Due to Earthquake Shaking, Journal of the Geotechnical Engineering Division, ASCE, Vol. 113, No. 8, pp. 861-878.
United States Geological Survey, 1963 (Photorevised 1981), Redondo, California Quadrangle Map, 7.5 Minute Series: Scale 1:24,000.
208356001 R Prelim Geo Eval (RBGS).doc 28

Redondo Beach Generating Station October 31, 2011 Redondo Beach, California Project No. 208356001
United States Geological Survey, 2011, Earthquake Ground Motion Parameter Java Application, Java Ground Motion Parameter Calculator – Version 5.1.0; http://earthquake.usgs.gov/hazards/designmaps/javacalc.php.
URS, 2001, Preliminary Geotechnical Investigation, Redevelopment of AES Redondo Beach Property, 1100 North Harbor Drive, Redondo Beach, California, dated March.
Youd, T.L., and Idriss, I.M. (Editors), 1997, Proceedings of the NCEER Workshop on Evaluation of Liquefaction Resistance of Soils, Salt Lake City, Utah, January 5 through 6, 1996, NCEER Technical Report NCEER-97-0022, Buffalo, New York.
Youd, T.L., Hanse, C.M., and Bartlett, S.F., 2002, Revised MLR Equations for Predicting Lateral Spread Displacement, Journal of Geotechnical and Geoenvironmental Engineering, Vol-ume 128, Number 12, pp. 1007-1017, dated December.
Youd, T.L., Idriss, I.M., Andrus, R.D., Arango, I., Castro, G., Christian, J.T., Dobry, R., Finn, W.D., Harder, L.F., Hynes, M.E., Ishihara, K., Koester, J.P., Liao, S.S.C., Marcuson, W.F., Martin, G.R., Mitchell, J.K., Moriwaki, Y., Power, M.S., Robertson, P.K., Seed, R.B., and Stokoe, K.H., II., 2001, Liquefaction Resistance of Soils: Summary Report from the 1996 NCEER and 1998 NCEER/NSF Workshops on Evaluation of Liquefaction Resistance of Soils, Journal of Geotechnical and Geoenvironmental Engineering: American Society of Civil Engineering 124(10), pp. 817-833.
Ziony, J.L., and Yerkes, R.F., 1985, Evaluating Earthquake and Surface-Faulting Potential, in Zi-ony, J.I., (ed.), Evaluating Earthquake Hazards in the Los Angeles Region, An Earth-Science Perspective: United States Geological Survey Professional Paper 1360.
AERIAL PHOTOGRAPHS
Source Date Flight Numbers Scale
USDA 11-4-1952 AXJ-4K 131-132 1:20,000
208356001 R Prelim Geo Eval (RBGS).doc 29


&
&
&
&
&
&
&
&
&
&
&
&
&
&
&
&
&
&
&
&
&
&
&
&
&
&
&
&
&
&
PacificOcean
NEWPORT - INGLEWOOD FAULT ZONE
PALOS VERDES FAULT ZONE
SANTA MONICA
FAULT
HOLLYWOOD
FAULT RAYMOND FAULT
WHITTIER FAULT
SIERRA MADRE FAULT ZONECLAMSHELL SAWPIT
CANYON FAULT
SAN FERNANDOFAULT
VERDUGO FAULT
MALIBU COAST FAULT
SIMI FAULT
OAKRIDGEFAULT
SAN CAYETANOFAULT
SAN GABRIEL FAULT ZONE
SIERRA MADREFAULT ZONE
·|}þ60§̈¦710
§̈¦5
§̈¦10
§̈¦5
§̈¦405
§̈¦405
§̈¦110
§̈¦710
§̈¦10
§̈¦105
CHATSWORTH FAULT
CHARNOCK FAULT
CHINO - CENTRAL
AVE. FAULT
SAN JOSE FAULT
CUCAMONGA FAULT
§̈¦405
§̈¦5
§̈¦5
·|}þ91·|}þ91
§̈¦15
OFFSHORE ZONE
OF DEFORMATION
SITE
Irvine
Orange
Pomona
Downey
Ontario
Van Nuys
Alhambra
PasadenaGlendale
Torrance
El Monte
Fullerton
Santa Ana
Inglewood
West CovinaLos Angeles
Simi Valley
Laguna Beach
Santa Monica
Newport Beach
GIS DATA SOURCE: CALIFORNIA GEOLOGICAL SURVEY (CGS); ENVIRONMENTAL SYSTEMS RESEARCH INSTITUTE (ESRI)
±10 0 10
Miles
REFERENCE: JENNINGS, 1994, FAULT ACTIVITY MAP OF CALIFORNIA AND ADJACENT AREAS
NOTE: ALL DIMENSIONS, DIRECTIONS, AND LOCATIONS ARE APPROXIMATE
LEGENDFAULT ACTIVITY:
QUATERNARY (POTENTIALLY ACTIVE)
HISTORICALLY ACTIVE
HOLOCENE ACTIVE
LATE QUATERNARY (POTENTIALLY ACTIVE)
COUNTY BOUNDARIES
FAULT LOCATIONS FIGURE
PROJECT NO. DATE
208356001 10/11
REDONDO BEACH GENERATING STATION1100 NORTH HARBOR DRIVE
REDONDO BEACH, CALIFORNIA5
2083
5600
1_Fa
ult L
oc.g
is-R
BG
S....
...G
K

Redondo Beach Generating Station October 31, 2011 Redondo Beach, California Project No. 208356001
APPENDIX A
BORING AND CPT LOGS
Field Procedure for the Collection of Disturbed Samples Disturbed soil samples were obtained in the field using the following methods.
Bulk SamplesBulk samples of representative earth materials were obtained from the exploratory borings. The samples were bagged and transported to the laboratory for testing.
The Standard Penetration Test (SPT) SamplerDisturbed drive samples of earth materials were obtained by means of a Standard Penetra-tion Test sampler. The sampler is composed of a split barrel with an external diameter of 2 inches and an unlined internal diameter of 1-3/8 inches. The sampler was driven into the ground 18 inches with a 140-pound hammer falling freely from a height of 30 inches in gen-eral accordance with ASTM D 1586. The blow counts were recorded for every 6 inches of penetration; the blow counts reported on the logs are those for the last 12 inches of penetra-tion. Soil samples were observed and removed from the sampler, bagged, sealed and transported to the laboratory for testing.
Field Procedure for the Collection of Relatively Undisturbed Samples Relatively undisturbed soil samples were obtained in the field using the following method.
The Modified Split-Barrel Drive Sampler The sampler, with an external diameter of 3.0 inches, was lined with 1-inch-long, thin brass rings with inside diameter of approximately 2.4 inches. The sample barrel was driven into the ground with the weight of a hammer in general accordance with ASTM D 3550. The driving weight was permitted to fall freely. The approximate length of the fall, the weight of the hammer, and the number of blows per foot of driving are presented on the boring logs as an index to the relative resistance of the materials sampled. The samples were removed from the sample barrel in the brass rings, sealed, and transported to the laboratory for testing.
Field Procedure for Cone Penetration Tests (CPTs) The CPTs were performed in general accordance with ASTM D 3441. The cone penetrometer assembly used for this project consisted of a conical tip and a cylindrical friction sleeve. The conical tip had an apex angle of 60 degrees and a diameter of approximately 1.4 inches resulting in a projected cross-sectional area of approximately 1.5 square inches. The cylindrical friction sleeve was approximately 5.3 inches long and had an outside diameter of approximately 1.4 inches, resulting in a surface area of approximately 23 square inches. The interior of the CPT
208356001 R Prelim Geo Eval (RBGS).doc 1

Redondo Beach Generating Station October 31, 2011 Redondo Beach, California Project No. 208356001
probe was instrumented with strain gauges that allowed simultaneous measurement of cone tip and friction sleeve resistance during penetration. The cone was hydraulically pushed into the soil using the reaction mass of a specially designed 23-ton truck at a constant rate of approximately 4 feet per minute while the cone tip resistance and sleeve friction resistance were recorded at an approximately 2-inch interval and stored in digital form. The computer generated logs presented in the following pages include cone resistance, friction resistance, friction ratio, equivalent SPT blow counts, and interpreted soil types.
208356001 R Prelim Geo Eval (RBGS).doc 2

TYPICAL NAMES
GW Well graded gravels or gravel-sand mixtures, little or no fines
GP Poorly graded gravels or gravel-sand mixtures, little or no fines
GM Silty gravels, gravel-sand-silt mixtures
GC Clayey gravels, gravel-sand-clay mixtures
SW Well graded sands or gravelly sands, little or no fines
SP Poorly graded sands or gravelly sands, little or no fines
SM Silty sands, sand-silt mixtures
SC Clayey sands, sand-clay mixtures
ML Inorganic silts and very fine sands, rock flour, silty or clayey fine sands or clayey silts with slight plasticity
CL Inorganic clays of low to medium plasticity, gravelly clays, sandy clays, silty clays, lean clays
OL Organic silts and organic silty clays of low plasticity
MH Inorganic silts, micaceous or diatomaceous fine sandy or silty soils, elastic silts
CH Inorganic clays of high plasticity, fat clays
OH Organic clays of medium to high plasticity, organic silty clays, organic silts
Pt Peat and other highly organic soils
U.S. Standard Sieve Size
Grain Size in Millimeters
BOULDERS Above 12" Above 305
COBBLES 12" to 3" 306 to 76.2
GRAVEL 3" to No. 4 76.2 to 4.76
Coarse 3" to 3/4" 76.2 to 19.1
Fine 3/4" to No. 4 19.1 to 4.76
SAND No. 4 to No. 200 4.76 to 0.075
Coarse No. 4 to No. 10 4.76 to 2.00
Medium No. 10 to No. 40 2.00 to 0.420
Fine No. 40 to No. 200 0.420 to 0.075SILT & CLAY Below No. 200 Below 0.075
SYMBOL
U.S.C.S. METHOD OF SOIL CLASSIFICATION
FIN
E-G
RA
INED
SO
ILS
(Mor
e th
an 1
/2 o
f soi
l <
No.
200
siev
e si
ze)
U.S.C.S. METHOD OF SOIL CLASSIFICATION
CO
AR
SE-G
RA
INED
SO
ILS
(Mor
e th
an 1
/2 o
f soi
l >
No.
200
Sie
ve S
ize)
MAJOR DIVISIONS
HIGHLY ORGANIC SOILS
GRAVELS (More than 1/2 of coarse
fraction > No. 4 sieve size
SANDS (More than 1/2 of coarse
fraction < No. 4 sieve size
SILTS & CLAYSLiquid Limit <50
SILTS & CLAYSLiquid Limit >50
GRAIN SIZE CHARTRANGE OF GRAIN
CLASSIFICATION
PLASTICITY CHART
CH
CL M H & OH
M L & OLCL - M L
0
10
20
30
40
50
60
70
0 10 20 30 40 50 60 70 80 90 100LIQ UID LIMIT (LL), %
PLA
STIC
ITY
IND
EX (P
I), %
Updated Nov. 2011

0
5
10
15
20
XX/XX
SM
CL
Bulk sample.
Modified split-barrel drive sampler.
No recovery with modified split-barrel drive sampler.
Sample retained by others.
Standard Penetration Test (SPT).
No recovery with a SPT.
Shelby tube sample. Distance pushed in inches/length of sample recovered in inches.
No recovery with Shelby tube sampler.
Continuous Push Sample.
Seepage.Groundwater encountered during drilling.Groundwater measured after drilling.
MAJOR MATERIAL TYPE (SOIL):Solid line denotes unit change.
Dashed line denotes material change.
Attitudes: Strike/Dipb: Beddingc: Contactj: Jointf: FractureF: Faultcs: Clay Seams: Shearbss: Basal Slide Surfacesf: Shear Fracturesz: Shear Zonesbs: Shear Bedding Surface
The total depth line is a solid line that is drawn at the bottom of the boring.
BORING LOGExplanation of Boring Log Symbols
PROJECT NO. DATE FIGURE
DE
PTH
(fee
t)
Bul
kS
AM
PLE
SD
riven
BLO
WS/
FOO
T
MO
ISTU
RE
(%)
DR
Y D
EN
SIT
Y (P
CF)
SY
MB
OL
CLA
SS
IFIC
ATI
ON
U.S
.C.S
.
BORING LOG EXPLANATION SHEET
Rev. 11/11

0
5
10
15
20
27
52
67
9.6
17.9
14.0
116.6
SM
SP
SM
SP
SP-SM
FILL:Dark brown, moist, loose, silty SAND; petroleum odor.PID Reading = 17.1 parts per million.@ 1.5': Groundwater measured during drilling.YOUNGER DUNE SAND DEPOSITS:Gray to dark gray, saturated, medium dense, poorly graded SAND; petroleum odor inupper few feet.
Yellowish brown.
OLDER DUNE SAND DEPOSITS:Yellowish brown, saturated, very dense, silty SAND.
Yellowish brown, saturated, very dense, poorly graded SAND; coarse-grained.
Olive brown, saturated, very dense, poorly graded SAND with silt; medium-grained.
BORING LOGREDONDO BEACH GENERATING STATION
1100 N. HARBOR DRIVE, REDONDO BEACH, CALIFORNIAPROJECT NO.
208356001DATE
10/11FIGURE
A-1
DE
PTH
(fee
t)
Bul
kSA
MPL
ESD
riven
BLO
WS
/FO
OT
MO
ISTU
RE
(%)
DR
Y D
ENSI
TY (P
CF)
SYM
BOL
CLA
SS
IFIC
ATI
ON
U.S
.C.S
.
DESCRIPTION/INTERPRETATION
DATE DRILLED 8/11/11 BORING NO. B-1
GROUND ELEVATION 3' (MSL) SHEET 1 OF
METHOD OF DRILLING 8" Hollow-Stem Auger (Martini Drilling)
DRIVE WEIGHT 140 lbs. (Auto. Trip Hammer) DROP 30"
SAMPLED BY EBP LOGGED BY EBP REVIEWED BY MER
3

20
25
30
35
40
34
63
45
45
SP-SM
SP
OLDER DUNE SAND DEPOSITS: (Continued)Olive brown, saturated, very dense, poorly graded SAND with silt; medium-grained.
Trace gravel.
Light yellowish brown.
Light yellowish brown, saturated, very dense, poorly graded SAND.
BORING LOGREDONDO BEACH GENERATING STATION
1100 N. HARBOR DRIVE, REDONDO BEACH, CALIFORNIAPROJECT NO.
208356001DATE
10/11FIGURE
A-2
DE
PTH
(fee
t)
Bul
kSA
MPL
ESD
riven
BLO
WS
/FO
OT
MO
ISTU
RE
(%)
DR
Y D
ENSI
TY (P
CF)
SYM
BOL
CLA
SS
IFIC
ATI
ON
U.S
.C.S
.
DESCRIPTION/INTERPRETATION
DATE DRILLED 8/11/11 BORING NO. B-1
GROUND ELEVATION 3' (MSL) SHEET 2 OF
METHOD OF DRILLING 8" Hollow-Stem Auger (Martini Drilling)
DRIVE WEIGHT 140 lbs. (Auto. Trip Hammer) DROP 30"
SAMPLED BY EBP LOGGED BY EBP REVIEWED BY MER
3

40
45
50
55
60
89/11"
90
84/11"
SP
SP-SM
OLDER DUNE SAND DEPOSITS: (Continued)Light yellowish brown, saturated, very dense, poorly graded SAND; medium-grained.
Light yellowish brown, saturated, very dense, poorly graded SAND with silt; coarse-grained.
Total Depth = 51.4 feet.Groundwater measured at approximately 1.5 feet during drilling.Backfilled with bentonite grout on 8/11/11.
Note:Groundwater may rise to a level higher than that measured in borehole due to seasonalvariations in precipitation and several other factors as discussed in the report.
BORING LOGREDONDO BEACH GENERATING STATION
1100 N. HARBOR DRIVE, REDONDO BEACH, CALIFORNIAPROJECT NO.
208356001DATE
10/11FIGURE
A-3
DE
PTH
(fee
t)
Bul
kSA
MPL
ESD
riven
BLO
WS
/FO
OT
MO
ISTU
RE
(%)
DR
Y D
ENSI
TY (P
CF)
SYM
BOL
CLA
SS
IFIC
ATI
ON
U.S
.C.S
.
DESCRIPTION/INTERPRETATION
DATE DRILLED 8/11/11 BORING NO. B-1
GROUND ELEVATION 3' (MSL) SHEET 3 OF
METHOD OF DRILLING 8" Hollow-Stem Auger (Martini Drilling)
DRIVE WEIGHT 140 lbs. (Auto. Trip Hammer) DROP 30"
SAMPLED BY EBP LOGGED BY EBP REVIEWED BY MER
3

0
5
10
15
20
17
24
50
10.3
13.7
16.4
SM
SP
SP-SM
FILL:Dark brown, moist to saturated, loose, silty SAND; trace gravel.@ 0.3': Groundwater measured during drilling.YOUNGER DUNE SAND DEPOSITS:Yellowish brown, saturated, medium dense, poorly graded SAND; coarse-grained; fewgravel.
Dense; trace gravel.
OLDER DUNE SAND DEPOSITS:Light olive brown, saturated, very dense, poorly graded SAND with silt; medium-grained; faint laminations.
BORING LOGREDONDO BEACH GENERATING STATION
1100 N. HARBOR DRIVE, REDONDO BEACH, CALIFORNIAPROJECT NO.
208356001DATE
10/11FIGURE
A-4
DE
PTH
(fee
t)
Bul
kSA
MPL
ESD
riven
BLO
WS
/FO
OT
MO
ISTU
RE
(%)
DR
Y D
ENSI
TY (P
CF)
SYM
BOL
CLA
SS
IFIC
ATI
ON
U.S
.C.S
.
DESCRIPTION/INTERPRETATION
DATE DRILLED 8/11/11 BORING NO. B-2
GROUND ELEVATION 1' (MSL) SHEET 1 OF
METHOD OF DRILLING 8" Hollow-Stem Auger (Martini Drilling)
DRIVE WEIGHT 140 lbs. (Auto. Trip Hammer) DROP 30"
SAMPLED BY EBP LOGGED BY EBP REVIEWED BY MER
3

20
25
30
35
40
59
49
35
53
SP-SM
SP
OLDER DUNE SAND DEPOSITS: (Continued)Light olive brown, saturated, very dense, poorly graded SAND with silt; medium-grained; trace gravel.
Olive brown, saturated, very dense, poorly graded SAND; medium to coarse-grained.
Medium-grained.
Medium to coarse-grained.
BORING LOGREDONDO BEACH GENERATING STATION
1100 N. HARBOR DRIVE, REDONDO BEACH, CALIFORNIAPROJECT NO.
208356001DATE
10/11FIGURE
A-5
DE
PTH
(fee
t)
Bul
kSA
MPL
ESD
riven
BLO
WS
/FO
OT
MO
ISTU
RE
(%)
DR
Y D
ENSI
TY (P
CF)
SYM
BOL
CLA
SS
IFIC
ATI
ON
U.S
.C.S
.
DESCRIPTION/INTERPRETATION
DATE DRILLED 8/11/11 BORING NO. B-2
GROUND ELEVATION 1' (MSL) SHEET 2 OF
METHOD OF DRILLING 8" Hollow-Stem Auger (Martini Drilling)
DRIVE WEIGHT 140 lbs. (Auto. Trip Hammer) DROP 30"
SAMPLED BY EBP LOGGED BY EBP REVIEWED BY MER
3

40
45
50
55
60
42
59
43
SP-SM OLDER DUNE SAND DEPOSITS: (Continued)Olive-brown, saturated, very dense, poorly graded SAND with silt.
Total Depth = 51.5 feet.Groundwater measured at approximately 0.3 feet during drilling.Backfilled with bentonite grout on 8/11/11.
Note:Groundwater may rise to a level higher than that measured in borehole due to seasonalvariations in precipitation and several other factors as discussed in the report.
BORING LOGREDONDO BEACH GENERATING STATION
1100 N. HARBOR DRIVE, REDONDO BEACH, CALIFORNIAPROJECT NO.
208356001DATE
10/11FIGURE
A-6
DE
PTH
(fee
t)
Bul
kSA
MPL
ESD
riven
BLO
WS
/FO
OT
MO
ISTU
RE
(%)
DR
Y D
ENSI
TY (P
CF)
SYM
BOL
CLA
SS
IFIC
ATI
ON
U.S
.C.S
.
DESCRIPTION/INTERPRETATION
DATE DRILLED 8/11/11 BORING NO. B-2
GROUND ELEVATION 1' (MSL) SHEET 3 OF
METHOD OF DRILLING 8" Hollow-Stem Auger (Martini Drilling)
DRIVE WEIGHT 140 lbs. (Auto. Trip Hammer) DROP 30"
SAMPLED BY EBP LOGGED BY EBP REVIEWED BY MER
3
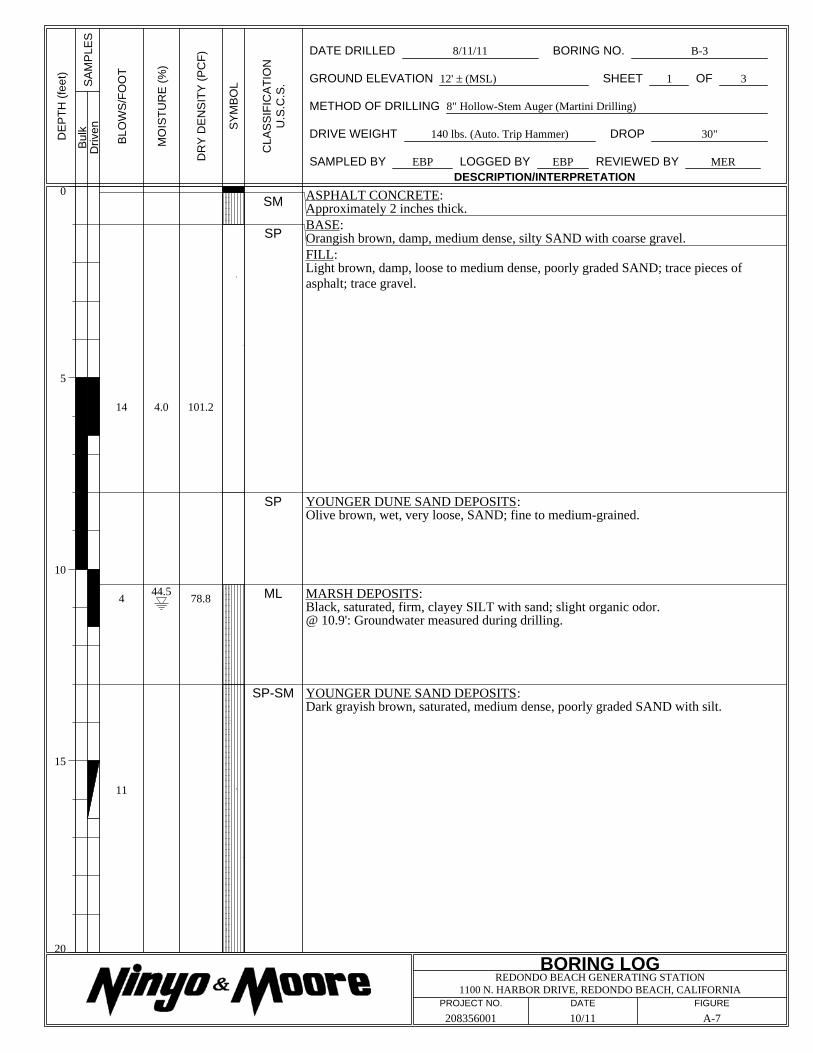
0
5
10
15
20
14
4
11
4.0
44.5
101.2
78.8
SM
SP
SP
ML
SP-SM
ASPHALT CONCRETE:Approximately 2 inches thick.BASE:Orangish brown, damp, medium dense, silty SAND with coarse gravel.FILL:Light brown, damp, loose to medium dense, poorly graded SAND; trace pieces ofasphalt; trace gravel.
YOUNGER DUNE SAND DEPOSITS:Olive brown, wet, very loose, SAND; fine to medium-grained.
MARSH DEPOSITS:Black, saturated, firm, clayey SILT with sand; slight organic odor.@ 10.9': Groundwater measured during drilling.
YOUNGER DUNE SAND DEPOSITS:Dark grayish brown, saturated, medium dense, poorly graded SAND with silt.
BORING LOGREDONDO BEACH GENERATING STATION
1100 N. HARBOR DRIVE, REDONDO BEACH, CALIFORNIAPROJECT NO.
208356001DATE
10/11FIGURE
A-7
DE
PTH
(fee
t)
Bul
kSA
MPL
ESD
riven
BLO
WS
/FO
OT
MO
ISTU
RE
(%)
DR
Y D
ENSI
TY (P
CF)
SYM
BOL
CLA
SS
IFIC
ATI
ON
U.S
.C.S
.
DESCRIPTION/INTERPRETATION
DATE DRILLED 8/11/11 BORING NO. B-3
GROUND ELEVATION 12' (MSL) SHEET 1 OF
METHOD OF DRILLING 8" Hollow-Stem Auger (Martini Drilling)
DRIVE WEIGHT 140 lbs. (Auto. Trip Hammer) DROP 30"
SAMPLED BY EBP LOGGED BY EBP REVIEWED BY MER
3
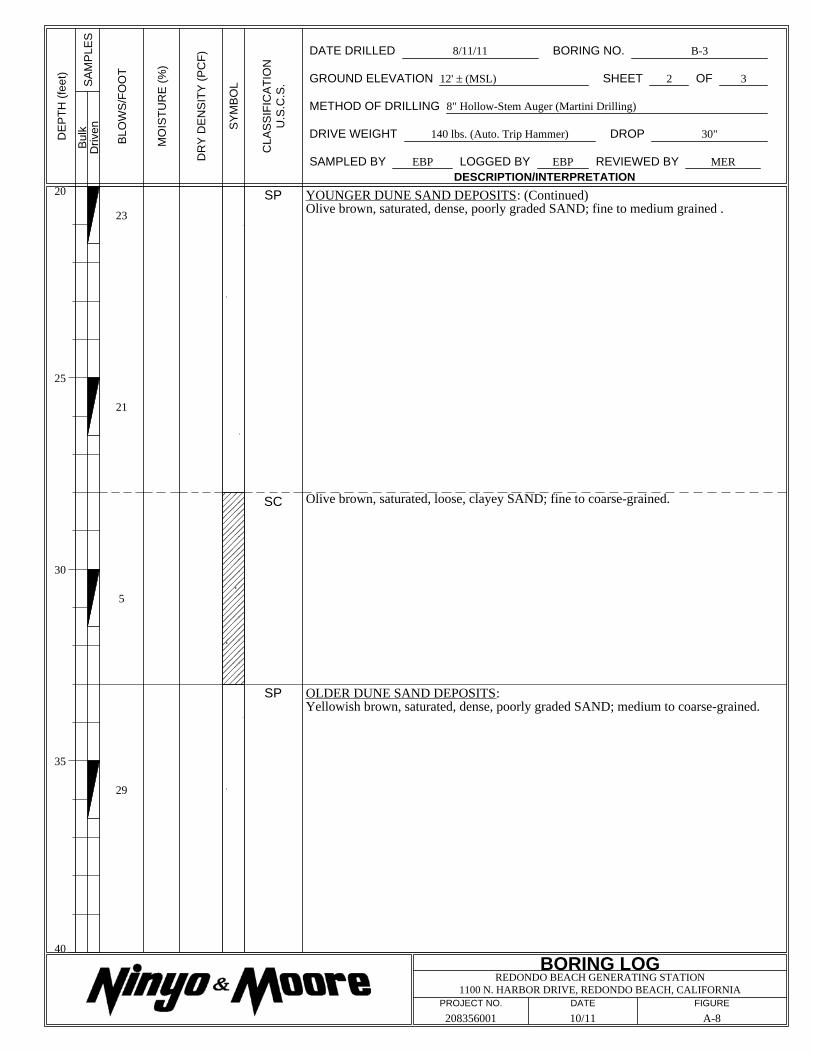
20
25
30
35
40
23
21
5
29
SP
SC
SP
YOUNGER DUNE SAND DEPOSITS: (Continued)Olive brown, saturated, dense, poorly graded SAND; fine to medium grained .
Olive brown, saturated, loose, clayey SAND; fine to coarse-grained.
OLDER DUNE SAND DEPOSITS:Yellowish brown, saturated, dense, poorly graded SAND; medium to coarse-grained.
BORING LOGREDONDO BEACH GENERATING STATION
1100 N. HARBOR DRIVE, REDONDO BEACH, CALIFORNIAPROJECT NO.
208356001DATE
10/11FIGURE
A-8
DE
PTH
(fee
t)
Bul
kSA
MPL
ESD
riven
BLO
WS
/FO
OT
MO
ISTU
RE
(%)
DR
Y D
ENSI
TY (P
CF)
SYM
BOL
CLA
SS
IFIC
ATI
ON
U.S
.C.S
.
DESCRIPTION/INTERPRETATION
DATE DRILLED 8/11/11 BORING NO. B-3
GROUND ELEVATION 12' (MSL) SHEET 2 OF
METHOD OF DRILLING 8" Hollow-Stem Auger (Martini Drilling)
DRIVE WEIGHT 140 lbs. (Auto. Trip Hammer) DROP 30"
SAMPLED BY EBP LOGGED BY EBP REVIEWED BY MER
3

40
45
50
55
60
43
69
77
SP
SP-SM
OLDER DUNE SAND DEPOSITS: (Continued)Yellowish brown, saturated, very dense, poorly graded SAND; coarse-grained; tracegravel.
Yellowish brown, saturated, very dense, poorly graded SAND with silt; coarse-grained;trace gravel.
Olive brown; fine-grained; faint laminations.
Total Depth = 51.0 feet.Groundwater measured at approximately 10.9 feet during drilling.Backfilled with bentonite grout and capped with 6 inches of concrete on 8/11/11.
Note:Groundwater may rise to a level higher than that measured in borehole due to seasonalvariations in precipitation and several other factors as discussed in the report.
BORING LOGREDONDO BEACH GENERATING STATION
1100 N. HARBOR DRIVE, REDONDO BEACH, CALIFORNIAPROJECT NO.
208356001DATE
10/11FIGURE
A-9
DE
PTH
(fee
t)
Bul
kSA
MPL
ESD
riven
BLO
WS
/FO
OT
MO
ISTU
RE
(%)
DR
Y D
ENSI
TY (P
CF)
SYM
BOL
CLA
SS
IFIC
ATI
ON
U.S
.C.S
.
DESCRIPTION/INTERPRETATION
DATE DRILLED 8/11/11 BORING NO. B-3
GROUND ELEVATION 12' (MSL) SHEET 3 OF
METHOD OF DRILLING 8" Hollow-Stem Auger (Martini Drilling)
DRIVE WEIGHT 140 lbs. (Auto. Trip Hammer) DROP 30"
SAMPLED BY EBP LOGGED BY EBP REVIEWED BY MER
3

0
5
10
15
20
8
2
8
1.9
32.9
11.7
103.1
SM
SP
SM
CH
SM
SC
FILL:Light brown, dry, loose, silty SAND; few gravel.
YOUNGER DUNE SAND DEPOSITS:Light brown, moist, loose, poorly graded SAND; fine to medium-grained; trace gravel.
Light brown, damp, loose, silty SAND; fine-grained.
MARSH DEPOSITS:Light gray, greenish gray, and dark olive gray, moist, soft, silty, sandy CLAY.
YOUNGER DUNE SAND DEPOSITS:Dark brown, saturated, medium dense, silty SAND with clay.
Dark brown, saturated, medium dense, clayey SAND.
BORING LOGREDONDO BEACH GENERATING STATION
1100 N. HARBOR DRIVE, REDONDO BEACH, CALIFORNIAPROJECT NO.
208356001DATE
10/11FIGURE
A-10
DE
PTH
(fee
t)
Bul
kSA
MPL
ESD
riven
BLO
WS
/FO
OT
MO
ISTU
RE
(%)
DR
Y D
ENSI
TY (P
CF)
SYM
BOL
CLA
SS
IFIC
ATI
ON
U.S
.C.S
.
DESCRIPTION/INTERPRETATION
DATE DRILLED 8/11/11 BORING NO. B-4
GROUND ELEVATION 8' (MSL) SHEET 1 OF
METHOD OF DRILLING 8" Hollow-Stem Auger (Martini Drilling)
DRIVE WEIGHT 140 lbs. (Auto. Trip Hammer) DROP 30"
SAMPLED BY EBP LOGGED BY EBP REVIEWED BY MER
3

20
25
30
35
40
17
18
36
74
SC
SP-SM
SP
SP-SM
YOUNGER DUNE SAND DEPOSITS: (Continued)Dark brown, saturated, medium dense, clayey SAND.
Yellowish brown, saturated, medium dense, poorly graded SAND with silt; medium tocoarse-grained.
OLDER DUNE SAND DEPOSITS:Olive brown, saturated, very dense, poorly graded SAND; medium-grained; faintlaminations.
Yellowish brown, saturated, very dense, poorly graded SAND with silt.
BORING LOGREDONDO BEACH GENERATING STATION
1100 N. HARBOR DRIVE, REDONDO BEACH, CALIFORNIAPROJECT NO.
208356001DATE
10/11FIGURE
A-11
DE
PTH
(fee
t)
Bul
kSA
MPL
ESD
riven
BLO
WS
/FO
OT
MO
ISTU
RE
(%)
DR
Y D
ENSI
TY (P
CF)
SYM
BOL
CLA
SS
IFIC
ATI
ON
U.S
.C.S
.
DESCRIPTION/INTERPRETATION
DATE DRILLED 8/11/11 BORING NO. B-4
GROUND ELEVATION 8' (MSL) SHEET 2 OF
METHOD OF DRILLING 8" Hollow-Stem Auger (Martini Drilling)
DRIVE WEIGHT 140 lbs. (Auto. Trip Hammer) DROP 30"
SAMPLED BY EBP LOGGED BY EBP REVIEWED BY MER
3

40
45
50
55
60
51
41
50/4"
SP-SM
SP
OLDER DUNE SAND DEPOSITS: (Continued)Olive brown, saturated, very dense, poorly graded SAND with silt; medium-grained.
Light grayish brown, saturated, very dense, poorly graded SAND; coarse-grained.
Total Depth = 51.4 feet.Groundwater measured at approximately 14.0 feet while drilling.Backfilled with bentonite grout on 8/11/11.
Note:Groundwater may rise to a level higher than that measured in borehole due to seasonalvariations in precipitation and several other factors as discussed in the report.
BORING LOGREDONDO BEACH GENERATING STATION
1100 N. HARBOR DRIVE, REDONDO BEACH, CALIFORNIAPROJECT NO.
208356001DATE
10/11FIGURE
A-12
DE
PTH
(fee
t)
Bul
kSA
MPL
ESD
riven
BLO
WS
/FO
OT
MO
ISTU
RE
(%)
DR
Y D
ENSI
TY (P
CF)
SYM
BOL
CLA
SS
IFIC
ATI
ON
U.S
.C.S
.
DESCRIPTION/INTERPRETATION
DATE DRILLED 8/11/11 BORING NO. B-4
GROUND ELEVATION 8' (MSL) SHEET 3 OF
METHOD OF DRILLING 8" Hollow-Stem Auger (Martini Drilling)
DRIVE WEIGHT 140 lbs. (Auto. Trip Hammer) DROP 30"
SAMPLED BY EBP LOGGED BY EBP REVIEWED BY MER
3

Ninyo & Moore GeotechnicalProject AES Generating Stations Operator RS/JC Filename SDF(434).cptJob Number 208356001 Cone Number DSG1023 GPSHole Number CPT-01 Date and Time 8/10/2011 7:37:17 AM Maximum Depth 33.30 ftWater Table Depth 2.00 ft
Net Area Ratio .8
Cone Size 10cm squared Soil Behavior Referance*Soil behavior type and SPT based on data from UBC-1983
0
5
10
15
20
25
30
35
40
45
50
0 500 TIPTSF 0 16
FRICTIONTSF 0 10
Fs/Qt% 0 200
SPT N0 12
1 - sensitive fine grained
2 - organic material
3 - clay
4 - silty clay to clay
5 - clayey silt to silty clay
6 - sandy silt to clayey silt
7 - silty sand to sandy silt
8 - sand to silty sand
9 - sand
10 - gravelly sand to sand
11 - very stiff fine grained (*)
12 - sand to clayey sand (*)
CPT DATA
DE
PTH
(ft)
SOIL
BE
HA
VIO
RTY
PE

Ninyo & Moore GeotechnicalProject AES Generating Stations Operator RS/JC Filename SDF(435).cptJob Number 208356001 Cone Number DSG1023 GPSHole Number CPT-02 Date and Time 8/10/2011 8:56:54 AM Maximum Depth 27.39 ftWater Table Depth 2.00 ft
Net Area Ratio .8
Cone Size 10cm squared Soil Behavior Referance*Soil behavior type and SPT based on data from UBC-1983
0
5
10
15
20
25
30
35
40
45
50
0 500 TIPTSF 0 16
FRICTIONTSF 0 10
Fs/Qt% 0 200
SPT N0 12
1 - sensitive fine grained
2 - organic material
3 - clay
4 - silty clay to clay
5 - clayey silt to silty clay
6 - sandy silt to clayey silt
7 - silty sand to sandy silt
8 - sand to silty sand
9 - sand
10 - gravelly sand to sand
11 - very stiff fine grained (*)
12 - sand to clayey sand (*)
CPT DATA
DE
PTH
(ft)
SOIL
BE
HA
VIO
RTY
PE

Ninyo & Moore GeotechnicalProject AES Generating Stations Operator RS/JC Filename SDF(436).cptJob Number 208356001 Cone Number DSG1023 GPSHole Number CPT-03 Date and Time 8/10/2011 10:14:24 AM Maximum Depth 37.24 ftWater Table Depth 3.00 ft
Net Area Ratio .8
Cone Size 10cm squared Soil Behavior Referance*Soil behavior type and SPT based on data from UBC-1983
0
5
10
15
20
25
30
35
40
45
50
0 500 TIPTSF 0 16
FRICTIONTSF 0 10
Fs/Qt% 0 200
SPT N0 12
1 - sensitive fine grained
2 - organic material
3 - clay
4 - silty clay to clay
5 - clayey silt to silty clay
6 - sandy silt to clayey silt
7 - silty sand to sandy silt
8 - sand to silty sand
9 - sand
10 - gravelly sand to sand
11 - very stiff fine grained (*)
12 - sand to clayey sand (*)
CPT DATA
DE
PTH
(ft)
SOIL
BE
HA
VIO
RTY
PE

Ninyo & Moore GeotechnicalProject AES Generating Stations Operator RS/JC Filename SDF(437).cptJob Number 208356001 Cone Number DSG1023 GPSHole Number CPT-04 Date and Time 8/10/2011 11:28:57 AM Maximum Depth 45.77 ftWater Table Depth 2.00 ft
Net Area Ratio .8
Cone Size 10cm squared Soil Behavior Referance*Soil behavior type and SPT based on data from UBC-1983
0
5
10
15
20
25
30
35
40
45
50
0 500 TIPTSF 0 16
FRICTIONTSF 0 10
Fs/Qt% 0 200
SPT N0 12
1 - sensitive fine grained
2 - organic material
3 - clay
4 - silty clay to clay
5 - clayey silt to silty clay
6 - sandy silt to clayey silt
7 - silty sand to sandy silt
8 - sand to silty sand
9 - sand
10 - gravelly sand to sand
11 - very stiff fine grained (*)
12 - sand to clayey sand (*)
CPT DATA
DE
PTH
(ft)
SOIL
BE
HA
VIO
RTY
PE
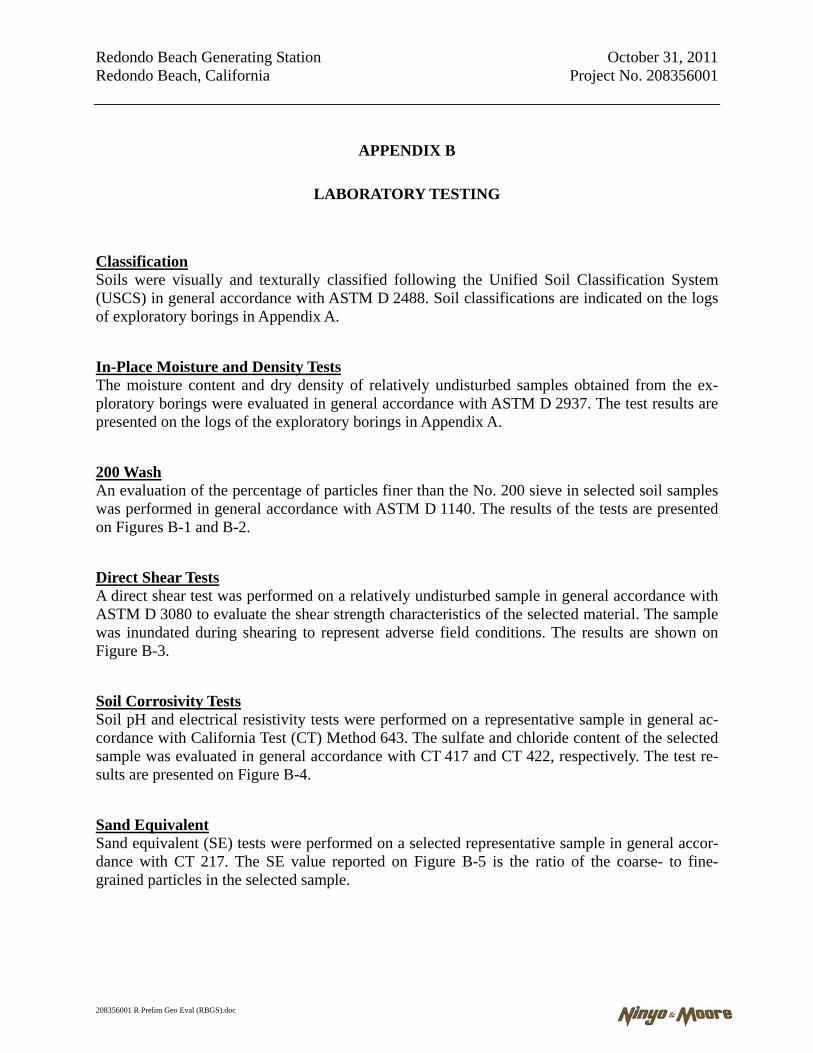
Redondo Beach Generating Station October 31, 2011 Redondo Beach, California Project No. 208356001
APPENDIX B
LABORATORY TESTING
Classification Soils were visually and texturally classified following the Unified Soil Classification System (USCS) in general accordance with ASTM D 2488. Soil classifications are indicated on the logs of exploratory borings in Appendix A.
In-Place Moisture and Density Tests The moisture content and dry density of relatively undisturbed samples obtained from the ex-ploratory borings were evaluated in general accordance with ASTM D 2937. The test results are presented on the logs of the exploratory borings in Appendix A.
200 Wash An evaluation of the percentage of particles finer than the No. 200 sieve in selected soil samples was performed in general accordance with ASTM D 1140. The results of the tests are presented on Figures B-1 and B-2.
Direct Shear Tests A direct shear test was performed on a relatively undisturbed sample in general accordance with ASTM D 3080 to evaluate the shear strength characteristics of the selected material. The sample was inundated during shearing to represent adverse field conditions. The results are shown on Figure B-3.
Soil Corrosivity Tests Soil pH and electrical resistivity tests were performed on a representative sample in general ac-cordance with California Test (CT) Method 643. The sulfate and chloride content of the selected sample was evaluated in general accordance with CT 417 and CT 422, respectively. The test re-sults are presented on Figure B-4.
Sand Equivalent Sand equivalent (SE) tests were performed on a selected representative sample in general accor-dance with CT 217. The SE value reported on Figure B-5 is the ratio of the coarse- to fine-grained particles in the selected sample.
208356001 R Prelim Geo Eval (RBGS).doc


Redondo Beach Generating Station October 31, 2011 Redondo Beach, California Project No. 208356001
APPENDIX C
LIQUEFACTION ANALYSIS
208356001 R Prelim Geo Eval (RBGS).doc


