preliminary fy 2015 results hanover – march 3, 2016€¦ · q4 2015: rebound in sales and profits...
TRANSCRIPT

http://www.continental-ir.com Wolfgang Schaefer – CFO
Ticker: CONADR-Ticker: CTTAYTwitter: @Continental_IR
Hanover – March 3, 2016Preliminary FY 2015 Results

AGENDA
Corporation Highlights1 3
Automotive Group2 11
Rubber Group3 18
Indebtedness and Cash Flow4 26
Outlook 20165 29
28Medium Term Outlook6 32
Preliminary FY 2015 Results – March 3, 2016EDMR – Equity and Debt Markets Relations 2
28Medium Term Outlook6 32
Back-up & Fact Sheets 2013 - 20157 40

1) Corporation Highlights Most Important KPIs FY 2015
› Sales up by 14% to €39.2 bn ; organic sales growth at 4%; FX added €2.2 bn
› Adj. EBIT 1 up by 15% to €4.5 bn ; adj. EBIT1 margin at 11.8%(PPA -€138 mn and special effects -€116 mn)
› NIAT2 up by 15% to €2.7 bn
› Free cash flow amounted to €1.4 bn including more than €1.2 bn cash outflow for acquisitions (mainly Veyance Technologies and Elektrobit Automotive); free cash flow before acquisitions amounted to €2.7 bn
› Gearing ratio slightly up to 27%; equity ratio impr oved to 40%
Preliminary FY 2015 Results – March 3, 2016EDMR – Equity and Debt Markets Relations 3
1 Before amortization of intangibles from PPA, consolidation and special effects2 Attributable to the shareholders of the parent3 Trailing ROCE is calculated as reported EBIT for the last twelve months (LTM) divided by average operating assets for the LTM4 Subject to approval of the Annual Shareholders’ Meeting (ASM) on April 29, 2016
› Value creation: trailing ROCE 3 up by 90 bps to 20.9% despite the first-time consolidation of Veyance Technologies and Elektrobit Automotive
› Other topics:
› Order intake: life-time sales in Automotive exceeded €30 bn
› Acquisition of Advanced Lidar Solutions to strengthen ADAS portfolio
› Special effects in ContiTech amounted to -€114 mn; additional measures planned for H1/16
› Dividend to increase by 15% to €3.754 for FY 2015

1) Corporation Highlights Divisional Highlights FY 2015
Aut
omot
ive
Gro
up
› Chassis & Safety: 9.7% adj. EBIT1 margin (PY: 9.5%); organic sales up by 5%; ADAS sales of more than €900 mn; acquisition of Advanced Lidar Solutions (Oct. 2015) strengthens ADAS leadership position
› Powertrain: 6.1% adj. EBIT1 margin (PY: 4.0%); organic sales up by 0.3%; adj. EBIT1 margin before HEVat 8.2%; more than €1 bn in life-time sales acquired in HEV business unit
› Interior: 10.2% adj. EBIT1 margin (PY 10.1%); organic sales increased by 8%; Elektrobit Automotive contributed €92 mn to sales, underlying profitability fully in line with expectations
› Automotive Group: Organic sales increased by 5%, exceeding worldwide car production by 4%-points; adj. EBIT1 margin increased by 80 bps to 8.8%; operating leverage2 at 16%; R&D expenses increased by 14%
› Order intake in the Automotive Group exceeded last years record level of €30 bn life-time sales slightly
Preliminary FY 2015 Results – March 3, 2016EDMR – Equity and Debt Markets Relations 4
Rub
ber
Gro
up
› Tires: Adj. EBIT1 margin sustained at high level (20.4% vs. PY 19.0%), benefitting from lower raw material costs as expected, strict cost management and solid price mix (-3%); volumes were up by 5%; FX impacted tire sales positively by 5%Tire markets: PC & LT tire replacement demand in Europe was flat; NAFTA was up by 1% where the introduction of import duties impacted replacement demand
› ContiTech: Adj. EBIT1 margin decreased by 70 bps to 10.4%; organic sales up by 4%; Veyance Technologies contributed €1.15 bn to sales (Feb-Dec) and -€233 mn to EBIT (Feb-Dec) €97 mn of which is PPA amortization, €89 mn special effects and €72 mn integration costs; adj. EBIT1 margin in FY stood at 2.1%3; restructuring efforts initiated in Oct. 2015 to return ContiTech back to double digit margins
› Rubber Group: Organic sales up by 2% and adj. EBIT1 margin up to 17.6% (PY: 16.8%)
› Order intake in the Automotive Group exceeded last years record level of €30 bn life-time sales slightly
1 Before amortization of intangibles from PPA, consolidation and special effects2 Operating leverage is defined as delta adj. EBIT1 divided by delta adjusted sales 3 Considering integration costs

8,033
8,5418,350 8,407 8,390 8,528 8,670
8,918
9,569
10,0309,618
10,016
1,0541,250
1,076 1,076
1) Corporation Highlights Sales and Adjusted EBIT1 by Quarter
FY Sales €33,331 mnFY Sales €39,232 mnAdj. EBIT1 €4,456 mn
FY Sales €34,506 mnAdj. EBIT1 €3,866 mn
Preliminary FY 2015 Results – March 3, 2016EDMR – Equity and Debt Markets Relations
955 1,004 965 942
1,054 1,076 1,076
Q1/13 Q2/13 Q3/13 Q4/13 Q1/14 Q2/14 Q3/14 Q4/14 Q1/15 Q2/15 Q3/15 Q4/15
Sales (mn €) Adj. EBIT (mn €)
5
1 Before amortization of intangibles from PPA, consolidation and special effects
1

4,91
1
5,16
0
4,94
5
5,00
0
5,12
9
5,17
6
5,16
2
5,44
2
5,91
2
5,99
6
5,66
1
6,00
5
509564 541
Sales (mn €) Adj. EBIT (mn €)
3,13
2
3,39
2
3,41
5
3,41
7
3,27
1
3,36
2
3,51
8
3,48
7
3,66
9
4,04
5
3,96
8
4,02
2
557 588629
520579
733647
585
Sales (mn €) Adj. EBIT (mn €)
1) Corporation Highlights Automotive Group and Rubber Group by Quarter
1 1
Automotive Group Rubber Group
Preliminary FY 2015 Results – March 3, 2016EDMR – Equity and Debt Markets Relations
426 443362
449509
452
541
Q1
/13
Q2
/13
Q3
/13
Q4
/13
Q1
/14
Q2
/14
Q3
/14
Q4
/14
Q1
/15
Q2
/15
Q3
/15
Q4
/15
557 588520
579 585
Q1
/13
Q2
/13
Q3
/13
Q4
/13
Q1
/14
Q2
/14
Q3
/14
Q4
/14
Q1
/15
Q2
/15
Q3
/15
Q4
/15
6
1 Before amortization of intangibles from PPA, consolidation and special effects

1.5%
4%
4%
GDP growthEurozone 2015
PC & LT prod.growth Europe
ContiTechorganic sales
growth
3%
1%
5%
PC & LT prod.growth EU/NAFTA
PC & LT prod. growth ww
AutomotiveGroup organic sales growth
1) Corporation Highlights Growth Profile of the Corporation FY 2015
Conti
Market
1
Conti
Market
Preliminary FY 2015 Results – March 3, 2016EDMR – Equity and Debt Markets Relations
1%
0%
5%
Replacement tire volume
growth NAFTA
Replacement tire volume
growth Europe
Passenger & Light Truck Tires volume growth
3%
0%
5%
Replacement tire volume
growth NAFTA
Replacement tire volume
growth Europe
CommercialVehicle Tires
volume growth
7
1 According to IMF (WEO Update January 2016)
Conti
Market
Conti
Market

138
8780 40
4 4,456
1) Corporation Highlights Adjusted EBIT1 Bridge (mn €)
Including
› Tires €6.8 mn
› ContiTech €71.9 mn:
› Aneng,
› Interior €0.3 mn
› Tires -€2.6 mn
› ContiTech -€2.0 mn
Including
› ContiTech €43.8 mn:
› Salzgitter, Germany€15.7 mn
› Bowmanville, › C&S €2.2 mn
›
-
Preliminary FY 2015 Results – March 3, 2016EDMR – Equity and Debt Markets Relations
4,116
Reported EBIT 2015
PPA Consolidationeffects
Asset impairments
(net)
Restructuring costs
Otherspecialeffects
Adj. EBIT2015
8
1 Before amortization of intangibles from PPA, consolidation and special effects2 Amortization of intangibles from PPA3 Including asset impairments amounting to €13.7 mn
2 1
› Aneng, China€44.8 mn
› Bayswater, Australia €25.3 mn
› Thetford, UK €1.3 mn
› Perth, Australia €0.5 mn
-€2.0 mn› Bowmanville, Canada €19.9 mn
› Tianjin, China €8.2 mn
3
› Powertrain €19.9 mn
› Interior €5.6 mn
› Tires €11.8 mn
› ContiTech €47.0 mn
› C&S €0.8 mn
› Powertrain €8.2 mn
› Interior €17.4 mn
› Tires €7.8 mn
› ContiTech €103.7 mn

18.5% 18.6%19.4% 19.4%
20.6% 20.8%
19.3%20.0% 19.5%
20.3%
21.6%20.9%
1) Corporation Highlights Sustainable Value Creation
Preliminary FY 2015 Results – March 3, 2016EDMR – Equity and Debt Markets Relations
17,0
14
17,0
08
16,9
15
16,8
04
16,6
25
16,5
22
16,5
36
16,7
27
17,5
10
18,1
98
18,9
10
19,6
81
Q1 Q2 Q3 Q4 Q1 Q2 Q3 Q4 Q1 Q2 Q3 Q4
2013 2014 2015
trailing OA (mn €) trailing ROCE
9
1 Trailing operating assets are calculated as assets for the last twelve months (LTM)2 Trailing ROCE is calculated as reported EBIT for the last twelve months (LTM) divided by trailing operating assets
1 2

298
1) Corporation Highlights Maturities for Syndicated Loan and Bonds1 (mn €)As at December 31, 2015
(mn €) FY 14 FY 15
Gross indebtedness 6,432 5,245
Cash 3,244 1,622
Net indebtedness 2,824 3,542
Available credit lines 4,032 3,612
Total liquidity 7,276 5,233
Preliminary FY 2015 Results – March 3, 2016EDMR – Equity and Debt Markets Relations
750 750500
750
350
2016 2017 2018 2019 2020
10
1 All amounts shown are nominal values2 Any utilization under the Revolving Credit Facility (RCF) has to be shown as short term debt acc. to IFRS although the RCF matures in 2020. It has a total volume of €3,000 mn
Syndicated loan Bonds2

817
425
824
0
2,066
9.7%
6.1%
10.2% 8.8%
Adj. EBIT margin (%)
8,450
7,069
8,15599
23,575
0.3%
8.3% 4.8%
5.1%Organic sales growth (%)
2) Automotive GroupAdj. EBIT1 Margin Improved by 80 bps
Automotive Group Sales (mn €) FY 2015 Automotive Group Adj. EBIT1 (mn €) FY 2015
-
1
Preliminary FY 2015 Results – March 3, 2016EDMR – Equity and Debt Markets Relations
Chassis & Safety
Powertrain Interior cons. AutomotiveGroup
Adj. EBIT margin (%)
Chassis & Safety
Powertrain Interior cons. AutomotiveGroup
Organic sales growth (%)
Reported change in sales
› Chassis & Safety: 12.4%
› Powertrain: 8.8%
› Interior: 16.5%
› Automotive Group: 12.7%
11
1
1 Before amortization of intangibles from PPA, consolidation and special effects
› Reported EBITDA: €2,973 mn (12.6% of sales)
› Reported EBIT: €2,014 mn (8.5% of sales)
› R&D: €2,097 mn (8.9% of sales)
› Capex: €1,275 mn (5.4% of sales)

5,4425,912 5,996 5,661 6,005
449
541
8.3%
9.1%
2) Automotive GroupQ4 2015: Rebound in Sales and Profits As Forecasted
Automotive Group Sales (mn €) Adj. EBIT1 (mn €) and Adj. EBIT1 Margin
Preliminary FY 2015 Results – March 3, 2016EDMR – Equity and Debt Markets Relations
Q4/14 Q1/15 Q2/15 Q3/15 Q4/15 Q4/14 Q1/15 Q2/15 Q3/15 Q4/15
› Sales increased by €563 mn; organic sales growth in Q4 2015 at 4.2%
› Adj. EBIT1 increased by €92 mn; operating leverage2 at 18%
› Adj. EBIT1 margin at 9.1% (PY: 8.3%)
12
+563 +92
1 Before amortization of intangibles from PPA, consolidation and special effects2 Operating leverage is defined as delta adj. EBIT1 divided by delta adjusted sales

6%
6%
4% 4
%
2%
1%
5%
4%
8%
5%
10%
4%
10%
6% 6%
2) Automotive GroupSales Growth Profile 2015 Automotive Group
Organic Sales Growth vs. PC & LT1 Production Growth
Organic Sales Growthby Division
Preliminary FY 2015 Results – March 3, 2016EDMR – Equity and Debt Markets Relations
2%
0%
-1%
1%
Q1/15 Q2/15 Q3/15 Q4/15
Automotive Group PC & LT prod. growth ww
4%1
%
4%
-4%
1%
Q1/14 Q2/14 Q3/14
13
Chassis & Safety
Powertrain Interior
Q1/
15
Q2/
15
Q3/
15
Q4/
15
Q1/
15
Q2/
15
Q3/
15
Q4/
15
Q1/
15
Q2/
15
Q3/
15
Q4/
15
1Passenger car and light truck
9.310.9
2008 2015
20.6 20.7
2008 2015
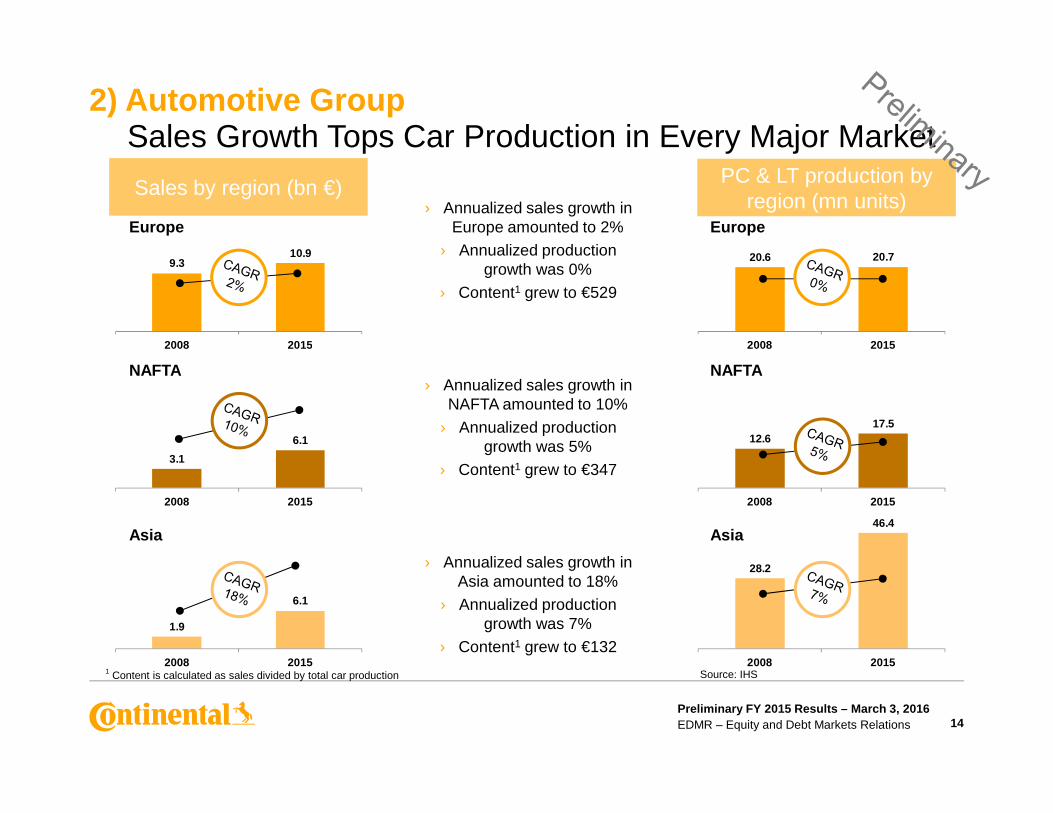
2) Automotive GroupSales Growth Tops Car Production in Every Major Market
› Annualized sales growth in Europe amounted to 2%
› Annualized productiongrowth was 0%
› Content1 grew to €529
› Annualized sales growth in NAFTA amounted to 10%
Europe
NAFTA
Sales by region (bn €) PC & LT production by region (mn units)
Europe
NAFTA
Preliminary FY 2015 Results – March 3, 2016EDMR – Equity and Debt Markets Relations
3.1
6.1
2008 2015
1.9
6.1
2008 2015
12.617.5
2008 2015
28.2
46.4
2008 2015
14
NAFTA amounted to 10%
› Annualized production growth was 5%
› Content1 grew to €347
› Annualized sales growth in Asia amounted to 18%
› Annualized production growth was 7%
› Content1 grew to €1321 Content is calculated as sales divided by total car production Source: IHS
Asia Asia

11,5
12
11,4
27
11,4
39
10,9
59
10,5
04
11,2
38
18%
1,5891,836
2,097 Germany24%Asia
26%
Other countries
1%
2) Automotive GroupHigh Earnings Quality in Automotive
High level of R&D1 Value Creation Accelerating
Regionally balanced business (2015)
Preliminary FY 2015 Results – March 3, 2016EDMR – Equity and Debt Markets Relations
5%
9% 10% 11% 11%
2010 2011 2012 2013 2014 2015
Average operating assets (mn €)
ROCE
1,2271,368 1,475 1,589
7.7% 7.5% 7.6%7.9%
8.8% 8.9%
2010 2011 2012 2013 2014 2015
R&D cost (€ mn) R&D (in % of sales)
Europe (ex
Germany)23%
NAFTA26%
26%
15
1 IAS 19 (rev.2011) applied since 2012
1
Interior order intake (bn €)
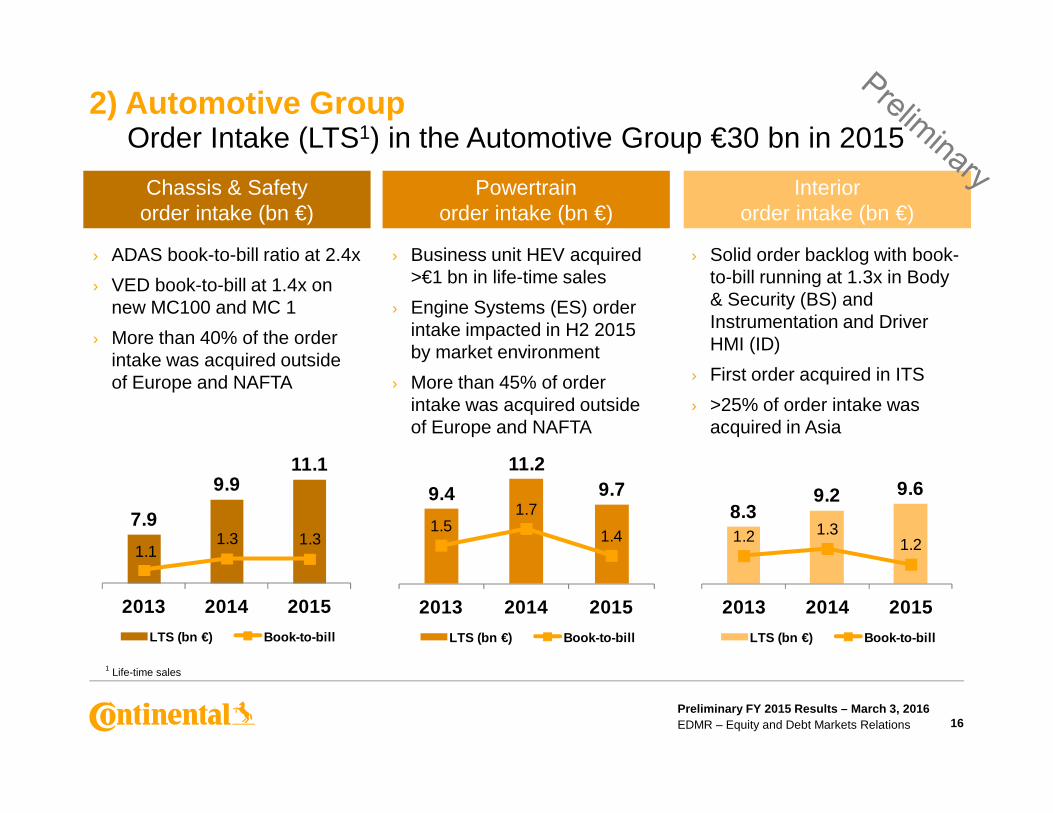
2) Automotive GroupOrder Intake (LTS1) in the Automotive Group €30 bn in 2015
Chassis & Safety order intake (bn €)
Powertrainorder intake (bn €)
› ADAS book-to-bill ratio at 2.4x
› VED book-to-bill at 1.4x on new MC100 and MC 1
› More than 40% of the order intake was acquired outside of Europe and NAFTA
› Business unit HEV acquired >€1 bn in life-time sales
› Engine Systems (ES) order intake impacted in H2 2015 by market environment
› More than 45% of order intake was acquired outside
› Solid order backlog with book-to-bill running at 1.3x in Body & Security (BS) and Instrumentation and Driver HMI (ID)
› First order acquired in ITS
› >25% of order intake was
Preliminary FY 2015 Results – March 3, 2016EDMR – Equity and Debt Markets Relations
8.39.2 9.6
1.2 1.31.2
2013 2014 2015
LTS (bn €) Book-to-bill
9.4
11.29.7
1.51.7
1.4
2013 2014 2015
LTS (bn €) Book-to-bill
7.9
9.911.1
1.11.3 1.3
2013 2014 2015
LTS (bn €) Book-to-bill
16
1 Life-time sales
intake was acquired outside of Europe and NAFTA
› >25% of order intake was acquired in Asia

23 23.620
25
30
35
30 30
20
25
30
35
2) Automotive GroupReality Check – How Reliable is the Order Intake?
› Order backlog acquired in 2011 amounted to €23 bn
› Usually the order backlog translates into sales with a time
lag of 4-5 years
› Sales achieved in 2015 amounted to €23.6 bn
Order Intake 2011 vs. Sales 2015 (bn €)
Order Intake 2015 and Resultant Sales (bn €)
Preliminary FY 2015 Results – March 3, 2016EDMR – Equity and Debt Markets Relations
0
5
10
15
0
5
10
15
17
› More limited revenue growth in Powertrain was more than compensated by Chassis &
Safety and Interior business, mirroring OEM content
preference over the last years
› 2015 order book totaled more than €30 bn life-time sales and provides confidence that €30 bn will be achieved in Automotive
Group sales by 2019
1 OI = Order Intake
Automotive Group
OI1 2011
Automotive Group
sales 2015
Automotive Group
OI1 2015
Automotive Group
resultantsales 2019

5,368
10,409
72
15,705
3.9%
1.0% 1.9%
435
2,109
0
2,544
20.4% 17.6%
3) Rubber Group Profitability Sustained at Elevated Level
Rubber Group Sales (mn €) FY 2015 Rubber Group Adj. EBIT1 (mn €) FY 2015
-
Preliminary FY 2015 Results – March 3, 2016EDMR – Equity and Debt Markets Relations
ContiTech Tires cons. Rubber Group
Organic sales growth (%)435
ContiTech Tires cons. Rubber Group
10.4% Adj. EBIT margin (%)
Reported change in sales
› ContiTech: 36.5%
› Tires: 6.4%
› Rubber Group: 15.2%
18
1 Before amortization of intangibles from PPA, consolidation and special effects
1
› Reported EBITDA: €3,182 mn (20.3% of sales)
› Reported EBIT: €2,256 mn (14.4% of sales)
› R&D: €352 mn (2.2% of sales)
› Capex: €903 mn (5.8% of sales)

3,487 3,6694,045 3,968 4,022
520585
14.9% 15.7%
3) Rubber GroupQ4 2015: Tires Offset ContiTech Results
Rubber Group Sales (mn €) Adj. EBIT1 (mn €) and Adj. EBIT1 Margin
Preliminary FY 2015 Results – March 3, 2016EDMR – Equity and Debt Markets Relations
Q4/14 Q1/15 Q2/15 Q3/15 Q4/15 Q4/14 Q1/15 Q2/15 Q3/15 Q4/15
› Sales increased by €535 mn as a result of a further recovery in Continental tire volumes and solid organic growth in ContiTech
› Veyance Technologies contributed €286 mn to sales; operating profit margin remained at depressed levels as mining and fluid business suffered from the difficult market environment during H2 2015
› Tire volumes increased by 12% during the quarter; FX had a positive effect of ~2% on tire sales in Q4 2015 while price mix remained constant at -3%
19
+535 +64
1 Before amortization of intangibles from PPA, consolidation and special effects

3) Rubber GroupTires – Continuously Improving Mix
› 142 mn units sold in 2015
› ASP1 in PLT unchanged at €61 in 2015 despite negative pricing on solid mix development and positive FX effects
› HP2 tire sales grew by 14% in 2015 to 42 mn units
› Share of HP2 and winter tires in total
HP2 Tires Sales and ASP1 2011 - 2015
29 32 35 37 42
57 63 61 61 61
2011 2012 2013 2014 2015
HP tires (mn units) ASP in €
Preliminary FY 2015 Results – March 3, 2016EDMR – Equity and Debt Markets Relations
41% 45% 47%
59% 55% 53%
2011 2013 2015
SD tires HP tires & winter tires ww
20
› Share of HP2 and winter tires in total unit sales improved to 47% from 41% in 2011
› 21 mn winter tires sold worldwide despite very mild winter in Europe
› Continental’s winter tire inventories at the end of February 2016 are at very healthy level
HP2 & Winter Tires vs. SD3 Tires
1 Average Selling Price (ASP) derived by dividing total PLT sales by total units2 High Performance is all ≥17” excluding winter tires 3 Standard tire
2011 2012 2013 2014 2015
6%
3%
3%
1% 0%
3%
0%
5%
9%
2%
4% 6
%
2%
12%
5%
0% 2
%
13%
3% 4
%
7%
11%
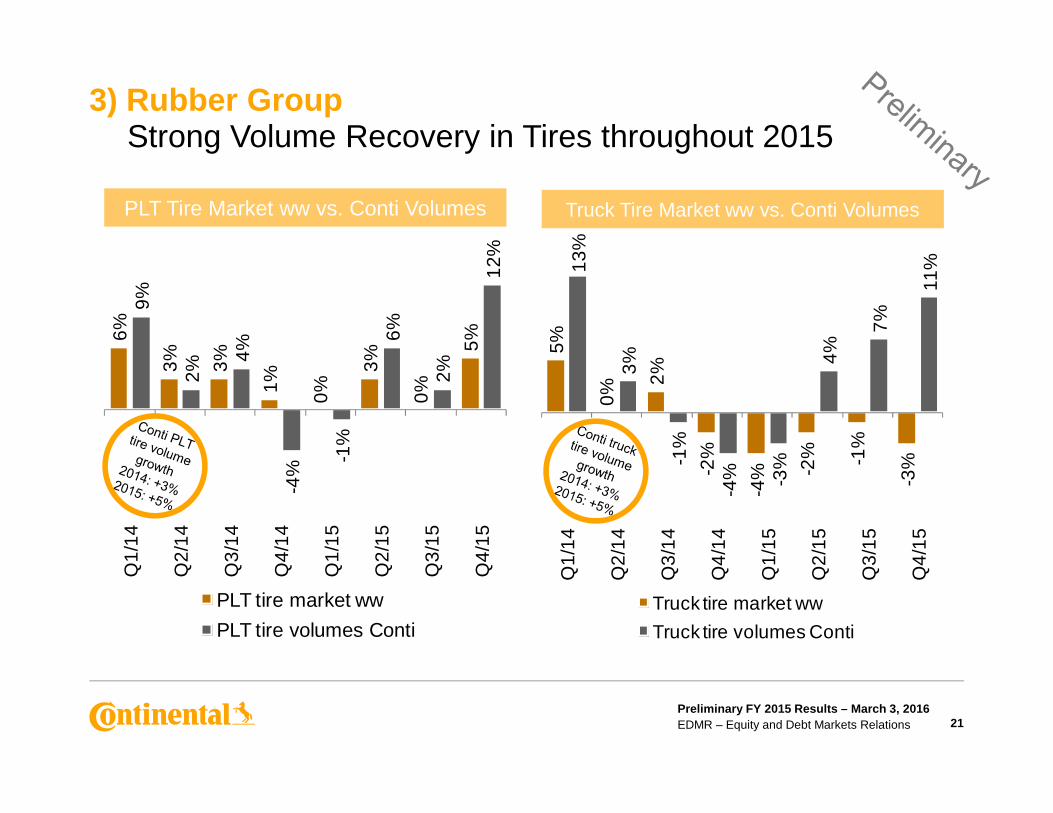
3) Rubber GroupStrong Volume Recovery in Tires throughout 2015
PLT Tire Market ww vs. Conti Volumes Truck Tire Market ww vs. Conti Volumes
Preliminary FY 2015 Results – March 3, 2016EDMR – Equity and Debt Markets Relations
-4%
-1%
Q1
/14
Q2
/14
Q3
/14
Q4
/14
Q1
/15
Q2
/15
Q3
/15
Q4
/15
PLT tire market ww
PLT tire volumes Conti
-2%
-4% -2
% -1%
-3%-1
%
-4% -3
%
Q1
/14
Q2
/14
Q3
/14
Q4
/14
Q1
/15
Q2
/15
Q3
/15
Q4
/15
Truck tire market ww
Truck tire volumes Conti
21
300
400
500
600
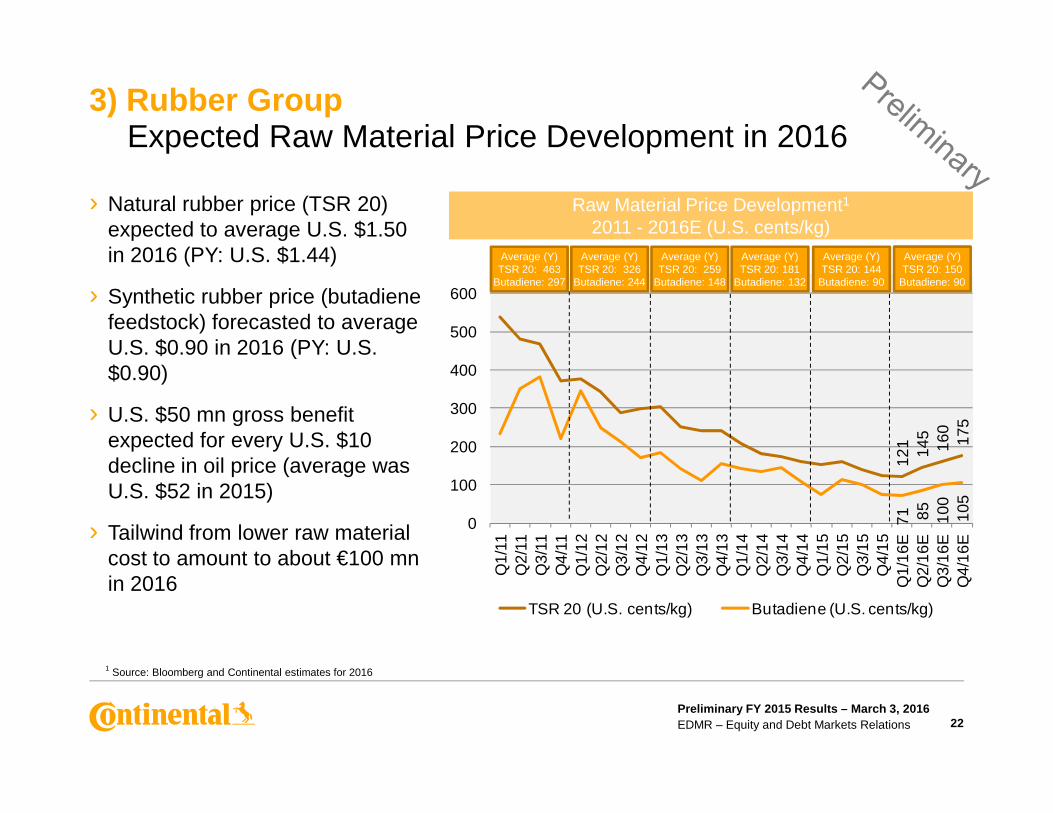
› Natural rubber price (TSR 20) expected to average U.S. $1.50 in 2016 (PY: U.S. $1.44)
› Synthetic rubber price (butadiene feedstock) forecasted to average U.S. $0.90 in 2016 (PY: U.S. $0.90)
› U.S. $50 mn gross benefit
3) Rubber GroupExpected Raw Material Price Development in 2016
Raw Material Price Development1
2011 - 2016E (U.S. cents/kg)
1 1 1 1Average (Y)TSR 20: 463
Butadiene: 297
Average (Y)TSR 20: 326
Butadiene: 244
Average (Y)TSR 20: 259
Butadiene: 148
Average (Y)TSR 20: 181
Butadiene: 132
Average (Y)TSR 20: 144
Butadiene: 90
Average (Y)TSR 20: 150
Butadiene: 90
Preliminary FY 2015 Results – March 3, 2016EDMR – Equity and Debt Markets Relations
121 14
516
017
5
71 85 100
105
0
100
200
300
Q1/
11Q
2/11
Q3/
11Q
4/11
Q1/
12Q
2/12
Q3/
12Q
4/12
Q1/
13Q
2/13
Q3/
13Q
4/13
Q1/
14Q
2/14
Q3/
14Q
4/14
Q1/
15Q
2/15
Q3/
15Q
4/15
Q1/
16E
Q2/
16E
Q3/
16E
Q4/
16E
TSR 20 (U.S. cents/kg) Butadiene (U.S. cents/kg)
› U.S. $50 mn gross benefit expected for every U.S. $10 decline in oil price (average was U.S. $52 in 2015)
› Tailwind from lower raw material cost to amount to about €100 mn in 2016
22
1 Source: Bloomberg and Continental estimates for 2016

104
47
7244
2 435
3) Rubber GroupContiTech Adjusted EBIT1 Bridge (mn €)
› Aneng, China€44.8 mn
› Bayswater,
› Salzgitter, Germany€15.7 mn
› Bowmanville, Canada €19.9 mn
› Tianjin, China
-
Preliminary FY 2015 Results – March 3, 2016EDMR – Equity and Debt Markets Relations
171
Reported EBIT 2015
PPA Consolidationeffects
Asset impairments
(net)
Restructuring costs
Otherspecialeffects
Adj. EBIT2015
23
1 Before amortization of intangibles from PPA, consolidation and special effects2 Amortization of intangibles from PPA3 Including asset impairments amounting to €14.2 mn
2 1
› Bayswater, Australia €25.3 mn
› Thetford, UK €1.3 mn
› Perth, Australia €0.5 mn
China €8.2 mn
3
› Veyance negative EBIT contribution not adjustedfor integration costs

mn €Veyance
2015ContiTech "old"
2015ContiTech
2015
Sales 1,145 4,223 5,368
EBIT reported -233 404 171
PPA 97 7 104
Special effects 89 25 114
EBIT before PPA and special effects -48 436 388
3) Rubber GroupContiTech: Determining the Right Reference Point for 2016
1
2
Preliminary FY 2015 Results – March 3, 2016EDMR – Equity and Debt Markets Relations
EBIT before PPA and special effects -48 436 388
Integration cost 72 0 72
Reference point for 2016 24 436 460
in % of sales 2.1% 10.3% 8.6%
24
1 Including some minor consolidation effects2 Amortization of intangibles from PPA
Referencepoint for 2016

Oil and mining related
business18%
Other CT business
82%
› Oil and mining related exposure at ContiTech amounts to 18% in 2015
› Measures implemented to align costs in Industrial Fluid Systems
› Restructuring initiated in Conveyor Belt Group to align capacity
› 7 out of 25 locations are affected: Australia, Canada, Chile, China,
3) Rubber GroupContiTech Exposure to Oil and Mining Business
Oil and Mining related business
Preliminary FY 2015 Results – March 3, 2016EDMR – Equity and Debt Markets Relations
0
20
40
60
80
100
2007
2008
2009
2010
2011
2012
2013
2014
2015
E
2016
E
2017
E
Mining Capex
Australia, Canada, Chile, China, Greece, Turkey and the UK
› Further restructuring to be started in H1 2016
› Vast majority of the business doing well
Target to grow sales and adj. EBIT 1 in 2016
25
Mining Capex (mn US$)
Source: Company filings and consensus data (Feb 2016) for BHP, Rio, Vale, Grupo Mexico, FCX, ABX, GG, NEM, NCM, TCK/B, ANTO, NUE, AA, KGC, AEM, EGO
1 Before amortization of intangibles from PPA, consolidation and special effects

2,824650
2,265
2,299341
447 60
400
1,886
3,542
4) Indebtedness and Cash Flow Net Indebtedness Bridge (mn €)
€107 mn outflow from change in working
capital
Preliminary FY 2015 Results – March 3, 2016EDMR – Equity and Debt Markets Relations
2,8243,058
Net
in
debt
edne
ss(F
Y 2
014
)
Div
iden
d20
14
Cap
ex
Acq
uisi
tions
Pen
sion
fu
ndin
g
Ch
ange
in
rece
ivab
les
Cha
nge
in
inve
ntor
ies
Cha
nge
inpa
yabl
es
Dep
r. an
dam
ortiz
atio
n
Oth
er C
F
Net
in
debt
edne
ss(F
Y 2
015
)
26
1 According to cash flow statement incl. intangible assets2 Veyance Technologies (01/15), Elektrobit Automotive (07/15), A-Z Formen- und Maschinenbau Group (01/15), Continental Advanced Lidar Solutions (10/15) and others3 Due to the fact that part of the Continental Pension Trust e.V. could regain the status of qualifying plan assets in FY 2015
capital
26% 27%
1
GearingRatio
2 3

4) Indebtedness and Cash Flow Net Indebtedness and Gearing Ratio
65%46%
190%219%
118%
90%
Net indebtedness (mn €)
Gearing ratio applying IAS 19 (rev. 2011)
Gearing ratio
Preliminary FY 2015 Results – March 3, 2016EDMR – Equity and Debt Markets Relations 27
10,4
84
8,89
6
7,31
7
6,77
2
5,32
0
4,28
9
2,82
4
3,54
2
46%26% 27%58%
YE YE YE YE YE YE YE YE
2008 2009 2010 2011 2012 2013 2014 2015
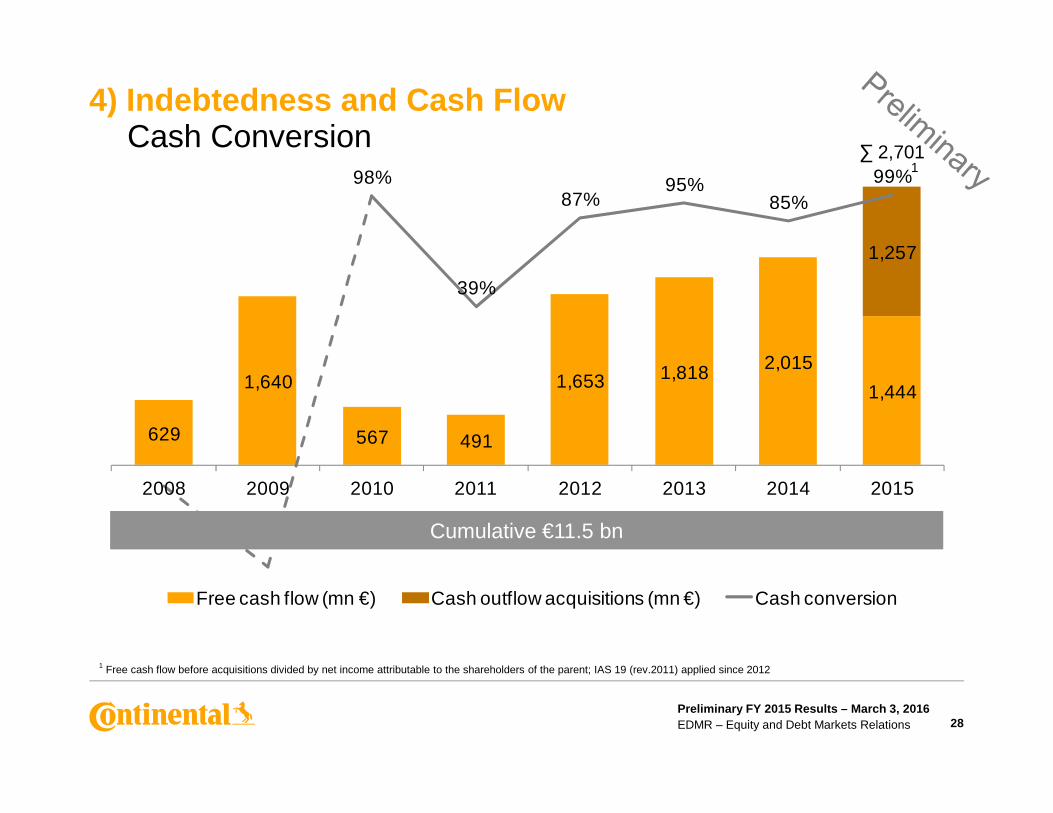
1,640 1,653 1,818 2,015
1,444
1,257
98%
39%
87%95%
85%99%
4) Indebtedness and Cash Flow Cash Conversion
1∑ 2,701
Preliminary FY 2015 Results – March 3, 2016EDMR – Equity and Debt Markets Relations
629 567 491
2008 2009 2010 2011 2012 2013 2014 2015
Free cash flow (mn €) Cash outflow acquisitions (mn €) Cash conversion
28
Cumulative €11.5 bn
1 Free cash flow before acquisitions divided by net income attributable to the shareholders of the parent; IAS 19 (rev.2011) applied since 2012

4.20
4
4.41
2
4.17
74.
237
4.26
7
4.52
14.
350
4.36
34.
340
4.60
0
4.25
04.
2635.
173
5.26
94.
492
4.93
1
5.38
15.
406
4.71
0
5.15
35.
400
5.71
0
4.80
55.
140
5.56
9
5.58
95.
220
6.23
25.
971
5.70
8
4.83
07.
056
6.24
0
6.10
05.
250
6.60
0
5) Outlook 2016PC & LT Production by Quarter
2014: 19.9
2015E: 20.7
2016E: 21.1
Europe (mn units)
2014: 17.0
2015E: 17.5
2016E: 17.5
NAFTA (mn units)
2014: 22.6
2015E: 23.6
2016E: 24.2
China (mn units)
Preliminary FY 2015 Results – March 3, 2016EDMR – Equity and Debt Markets Relations
4.20
4
4.41
2
4.17
74.
237
4.26
7
4.52
14.
350
4.36
34.
340
4.60
0
4.25
04.
263
5% 4%
8%5%
1% 2%4% 3% 2% 2%
-2%-2%
Q1/
14
Q2/
14
Q3/
14Q
4/14
Q1/
15
Q2/
15Q
3/15
Q4/
15E
Q1/
16E
Q2/
16E
Q3/
16E
Q4/
16E
NAFTA chg YOY
4.49
2
4.71
0
9%
4%0% 1%
4% 3%5% 5%
0%
6%2%
0%
Q1/
14
Q2/
14Q
3/14
Q4/
14
Q1/
15Q
2/15
Q3/
15
Q4/
15E
Q1/
16E
Q2/
16E
Q3/
16E
Q4/
16E
Europe chg YOY
9%11%
6% 6% 7%
2%
-7%
13%
5%7%
9%
-6%
Q1/
14
Q2/
14Q
3/14
Q4/
14Q
1/15
Q2/
15
Q3/
15Q
4/15
E
Q1/
16E
Q2/
16E
Q3/
16E
Q4/
16E
China chg YOY
29
Source: IHS and own estimates, Europe excluding Kazakhstan and Uzbekistan

569 585
101
1,575
590 528
98
1,600
Europe NAFTA South America
Asia
2015E 2016E
20.7 17.5
3.0
46.4
21.117.5
2.9
47.5
Europe NAFTA South America
Asia
2015E 2016E
5) Outlook 2016Market Outlook for Major Regions 2016
Commercial Vehicle2 Prod. (k units)
Source: IHS and own estimates
0%
PC & LT1 Production (mn units)
Preliminary FY 2015 Results – March 3, 2016EDMR – Equity and Debt Markets Relations
324278
64
415
329283
62
436
Europe NAFTA South America
Asia
2015E 2016E
23.5 22.813.2
85.0
24.2 23.212.7
87.0
Europe NAFTA South America
Asia
2015E 2016E
AmericaAmerica
30
CV Repl.4 Tire Market (mn units)
Source: IHS and own estimates
Source: LMC and own estimates
Source: IHS and own estimates
Source: LMC and own estimates
PC & LT Repl.3 Tire Market (mn units)
1 Passenger car and light truck <6t2 Heavy vehicles >6t3 Passenger car & light truck replacement 4 Commercial vehicle replacement (radial and biased)

5) Outlook 2016Continental Corporation
Consolidated sales adj. EBIT1
€39.2 bn€4.5 bn
Automotive Groupadj. EBIT1
€23.6 bn€2.1 bn
Rubber Groupadj. EBIT1
€15.7 bn€2.5 bn
Raw material cost impact
Relief of about €250 mn
2015
To increase to ~€41 bn at constant FX ratesTo comfortably achieve >10.5%
~€25 bn>8.5%
>€16 bn~15.5%
Raw materials to positively affect Rubber Group results in 2016 by about €100 mn
2016E
Preliminary FY 2015 Results – March 3, 2016EDMR – Equity and Debt Markets Relations 31
impact €250 mn
Special effects -€116 mn
Net interest resultTax rate
-€246 mn28.2%
CapexPPA
€2.2 bn€138 mn
Free cash flow before acquisitions
€2.7 bn
results in 2016 by about €100 mn
About -€100 mn
<-€250 mn~30%
Capex at around 6% of sales PPA amortization: ~€150 mn
At least €1.8 bn
1 Before amortization of intangibles from PPA, consolidation (2015 in comparison to 2014) and special effects

13,837
26,047
39,232
>50,000
21% >20%
6) Medium Term OutlookMore than €50 bn in Sales and >20% ROCE by 2020
Preliminary FY 2015 Results – March 3, 2016EDMR – Equity and Debt Markets Relations
13,83719%
12%
21% >20%
2005 2010 2015 2020E
Sales (mn €) ROCE
32
1Passenger car and light truck
Global PC & LT1
production CAGR 2005-2010: 3%
Global PC & LT1
production CAGR 2010-2015: 4%
Global PC & LT1
production CAGR 2015-2020E: 1-2%

Thank you!
Preliminary FY 2015 Results – March 3, 2016EDMR – Equity and Debt Markets Relations 33
Official Sponsor of the UEFA European Football Championship™

Disclaimer
› This presentation has been prepared by Continental Aktiengesellschaft solely in connection with the Annual PressConference and the Analyst and Investor Call on March 3, 2016, and the subsequent road shows in Europe andNorth America. It has not been independently verified. It does not constitute an offer, invitation or recommendation topurchase or subscribe for any shares or other securities issued by Continental AG or any subsidiary and neither shallany part of it form the basis of, or be relied upon in connection with, any contract or commitment concerning thepurchase or sale of such shares or other securities whatsoever.
› Neither Continental Aktiengesellschaft nor any of its affiliates, advisors or representatives shall have any liabilitywhatsoever (in negligence or otherwise) for any loss that may arise from any use of this presentation or its contentsor otherwise arising in connection with this presentation.
› This presentation includes assumptions, estimates, forecasts and other forward-looking statements, includingstatements about our beliefs and expectations regarding future developments as well as their effect on the results ofContinental. These statements are based on plans, estimates and projections as they are currently available to themanagement of Continental. Therefore, these statements speak only as of the date they are made, and weundertake no obligation to update publicly any of them in light of new information or future events. Furthermore,
Preliminary FY 2015 Results – March 3, 2016EDMR – Equity and Debt Markets Relations 34
undertake no obligation to update publicly any of them in light of new information or future events. Furthermore,although the management is of the opinion that these statements, and their underlying beliefs and expectations, arerealistic or of the date they are made, no guarantee can be given that the expected developments and effects willactually occur. Many factors may cause the actual development to be materially different from the expectationsexpressed here. Such factors include, for example and without limitation, changes in general economic and businessconditions, fluctuations in currency exchange rates or interest rates, the introduction of competing products, the lackof acceptance for new products or services and changes in business strategy.
› All statements with regard to markets or market position(s) of Continental or any of its competitors are estimates ofContinental based on data available to Continental. Such data are neither comprehensive nor independently verified.Consequently, the data used are not adequate for and the statements based on such data are not meant to be anaccurate or proper definition of regional and/or product markets or market shares of Continental and any of theparticipants in any market.
› Unless otherwise stated, all amounts are shown in millions of euro. Please note that differences may arise as a resultof the use of rounded amounts and percentages.

ContactEquity and Debt Markets Relations
Vahrenwalder Str. 930165 HanoverGermanye-mail: [email protected]
Rolf WollerHead of IRPhone: +49 511 938 1068e-mail: [email protected]
Ingrid KampfAssistant to the Head of IR
Michael SaemannAnalysts, Institutional Investors and Sustainability InvestorsPhone: +49 511 938 1307e-mail: [email protected]
Klaus PaeslerAnalysts, Institutional Investors, ADR and Private Investors Phone: +49 511 938 1316 e-mail: [email protected]
Sabine ReeseSustainability, ASM, CMD Organization, IR Website, Capital Market Disclosure Requirements
Preliminary FY 2015 Results – March 3, 2016EDMR – Equity and Debt Markets Relations 35
Assistant to the Head of IRRoadshow and Conference OrganizationPhone: +49 511 938 1163Fax: +49 511 938 1080e-mail: [email protected]
Capital Market Disclosure RequirementsPhone: +49 511 938 1027 e-mail: [email protected]
Henry SchniewindAnalysts, Institutional InvestorsPhone: +49 511 938 1062e-mail: [email protected]
Marvin KalberlahSocial MediaPhone: +49 511 938 14034e-mail: [email protected]

ContinentalFinancial Calendar
2016
Preliminary figures for the fiscal year 2015 January 11, 2016
Annual Financial Press Conference March 3, 2016
Annual Shareholders’ Meeting (incl. key data for Q1 2016) April 29, 2016
Q1 Financial Report May 4, 2016
Half Year Financial Report August 3, 2016
Nine Month Financial Report November 10, 2016
Preliminary FY 2015 Results – March 3, 2016EDMR – Equity and Debt Markets Relations 36
2017
Preliminary figures for the fiscal year 2016 January 2017
Annual Financial Press Conference March 2017
Annual Shareholders’ Meeting (incl. key data for Q1 2017) April 28, 2017
Q1 Financial Report May 2017
Half Year Financial Report August 2017
Nine Month Financial Report November 2017

ContinentalShare Data / ADR DataShare Data
Type of share No-par value share
Bloomberg Ticker CON
Reuters Ticker CONG
German Security Identification Number (WKN) 543 900
ISIN Number DE0005439004
Shares outstanding as at December 31, 2015 200,005,983
Preliminary FY 2015 Results – March 3, 2016EDMR – Equity and Debt Markets Relations 37
ADR Data
Ratio (ordinary share: ADR) 1:5
Bloomberg Ticker CTTAY
Reuters Ticker CTTAY.PK
ISIN Number US2107712000
ADR Level Level 1
Exchange OTC
Sponsor Deutsche Bank Trust Company Americas

ContinentalBond Data
Issuer Conti-Gummi Finance B.V., Netherlands1 Continental AG Continental AG
Continental Rubber of America, Corp.1
Issue Senior Notes Senior Notes Senior Notes Senior Notes
Principal amount €750 mn €750 mn €750 mn €500 mn
Offering price 99.595% 98.950% 99.228% 99.739%
Rating at issuance dateBa1 (Moody’s4)BB (S&P)BBB (Fitch2)
Ba2 (Moody’s4)BB (S&P)BB (Fitch2)
Ba1 (Moody’s4)BB (S&P)BBB (Fitch2)
BBB (S&P)BBB (Fitch)
Current corporationand bond ratings 3 BBB (Fitch), BBB (S&P), Baa1 (Moody’s 4)
Coupon 2.5% p.a. 3.0% p.a. 3.125% p.a. 0.5% p.a.
Issue date September 19, 2013 July 16, 2013 September 9, 2013 November 19, 2015
Preliminary FY 2015 Results – March 3, 2016EDMR – Equity and Debt Markets Relations 38
Maturity March 20, 2017 July 16, 2018 September 9, 20 20 February 19, 2019
Interest paymentAnnual March 20
Semi annualJanuary 16/July 16
AnnualSeptember 9
AnnualFebruary 19, commencing on February 20, 2017
WKN A1VC6B A1X24V A1X3B7 A1Z7C3
ISIN XS0972719412 XS0953199634 XS0969344083 DE000A1Z7C39
Denomination€1,000 with min. tradable amount €1,000
€1,000 with min. tradable amount €1,000
€1,000 with min. tradable amount €1,000
€1,000 with min. tradable amount €1,000
1 Guaranteed by Continental AG2 Non-contracted rating at date of issuance3 Fitch since July 15, 2013; S&P since December 6, 2013; Moodyʼs since June 30, 20154 Non-contracted rating since February 1, 2014

Back-up
Preliminary FY 2015 Results – March 3, 2016EDMR – Equity and Debt Markets Relations
Back-up
39

7) Back-upCorporation Highlights FY 2015
› Sales
› EBITDA
› EBIT
› NIAT3
› EPS3
Increase of 13.7% to €39,232.0 mn (PY: €34,505.7 mn); organic sales up 3.6%
Increase of 16.9% to €6,001.4 mn (PY: €5,133.8 mn)
Increase of 23.0% to €4,115.6 mn (PY: €3,344.8 mn);Adj. EBIT1 increase to €4,455.5 mn (11.8% adj. EBIT1 margin);PPA2 effect -€137.9 mn; total special effects -€115.5 mn
Increase of 14.8% to €2,727.4 mn (PY: €2,375.3 mn)
EPS of €13.64 (PY: €11.88)EPS before PPA2 €14.13 (PY: €12.57 before PPA2)
Preliminary FY 2015 Results – March 3, 2016EDMR – Equity and Debt Markets Relations 40
› Capex
› R&D
› Cash flow
› Net debt
Capex increased to €2,178.8 mn (PY: €2,045.4 mn); capex ratio 5.6% of sales; capex to depreciation coverage 1.2x (1.2x ex PPA2)
Expenses for research and development increased by 14.6% to €2,449.6 mn (PY: €2,137.7 mn); R&D ratio 6.2% of sales (PY: 6.2%)
Operating cash flow up by €747.3 mn to €4,915.6 mn; free cash flow €1,443.6 mn
Net indebtedness up by €718.4 mn to €3,541.9 mn vs. FY 2014;Liquidity and undrawn credit lines amounted to €5,233.0 mn
1 Before amortization of intangibles from PPA, consolidation and special effects2 Amortization of intangibles from PPA, tax rate of 28% applied for EPS calculation3 Attributable to the shareholders of the parent
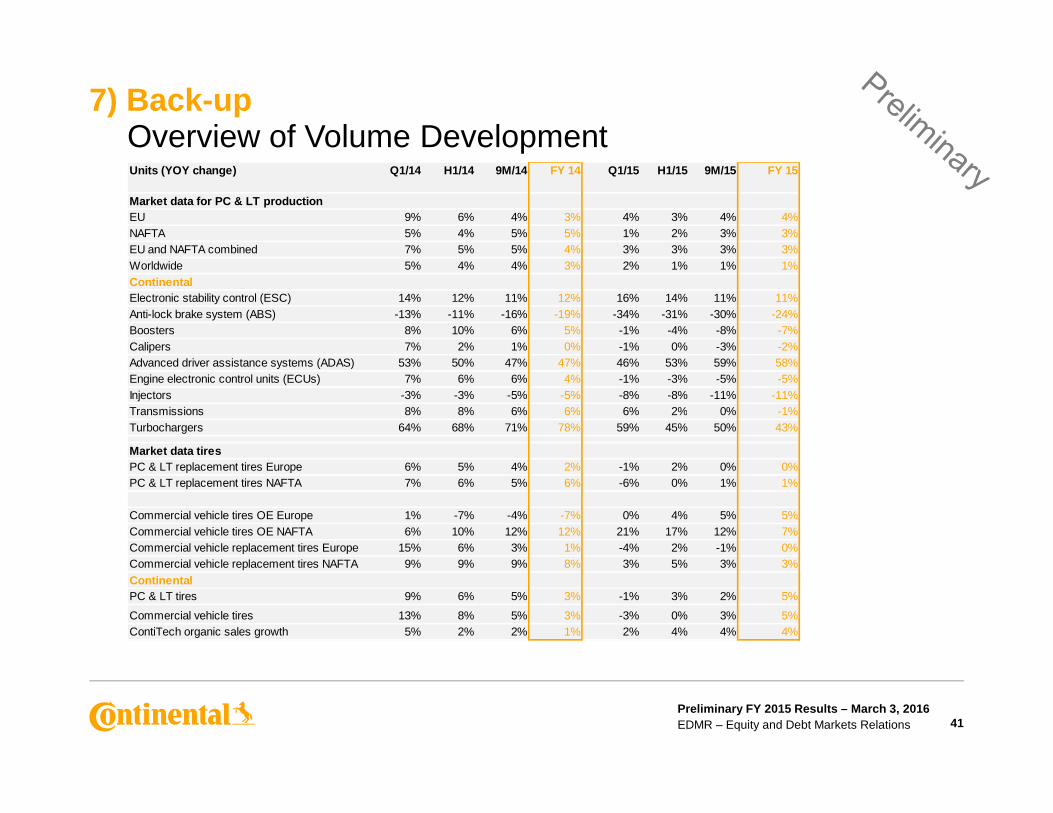
7) Back-upOverview of Volume Development Units (YOY change) Q1/14 H1/14 9M/14 FY 14 Q1/15 H1/15 9M/15 FY 15
Market data for PC & LT productionEU 9% 6% 4% 3% 4% 3% 4% 4%NAFTA 5% 4% 5% 5% 1% 2% 3% 3%EU and NAFTA combined 7% 5% 5% 4% 3% 3% 3% 3%Worldwide 5% 4% 4% 3% 2% 1% 1% 1%Continental Electronic stability control (ESC) 14% 12% 11% 12% 16% 14% 11% 11%Anti-lock brake system (ABS) -13% -11% -16% -19% -34% -31% -30% -24%Boosters 8% 10% 6% 5% -1% -4% -8% -7%Calipers 7% 2% 1% 0% -1% 0% -3% -2%Advanced driver assistance systems (ADAS) 53% 50% 47% 47% 46% 53% 59% 58%Engine electronic control units (ECUs) 7% 6% 6% 4% -1% -3% -5% -5%Injectors -3% -3% -5% -5% -8% -8% -11% -11%Transmissions 8% 8% 6% 6% 6% 2% 0% -1%
Preliminary FY 2015 Results – March 3, 2016EDMR – Equity and Debt Markets Relations 41
Transmissions 8% 8% 6% 6% 6% 2% 0% -1%Turbochargers 64% 68% 71% 78% 59% 45% 50% 43%
Market data tiresPC & LT replacement tires Europe 6% 5% 4% 2% -1% 2% 0% 0%PC & LT replacement tires NAFTA 7% 6% 5% 6% -6% 0% 1% 1%
Commercial vehicle tires OE Europe 1% -7% -4% -7% 0% 4% 5% 5%Commercial vehicle tires OE NAFTA 6% 10% 12% 12% 21% 17% 12% 7%Commercial vehicle replacement tires Europe 15% 6% 3% 1% -4% 2% -1% 0%Commercial vehicle replacement tires NAFTA 9% 9% 9% 8% 3% 5% 3% 3%ContinentalPC & LT tires 9% 6% 5% 3% -1% 3% 2% 5%
Commercial vehicle tires 13% 8% 5% 3% -3% 0% 3% 5%ContiTech organic sales growth 5% 2% 2% 1% 2% 4% 4% 4%
20
25
30
35
40
45
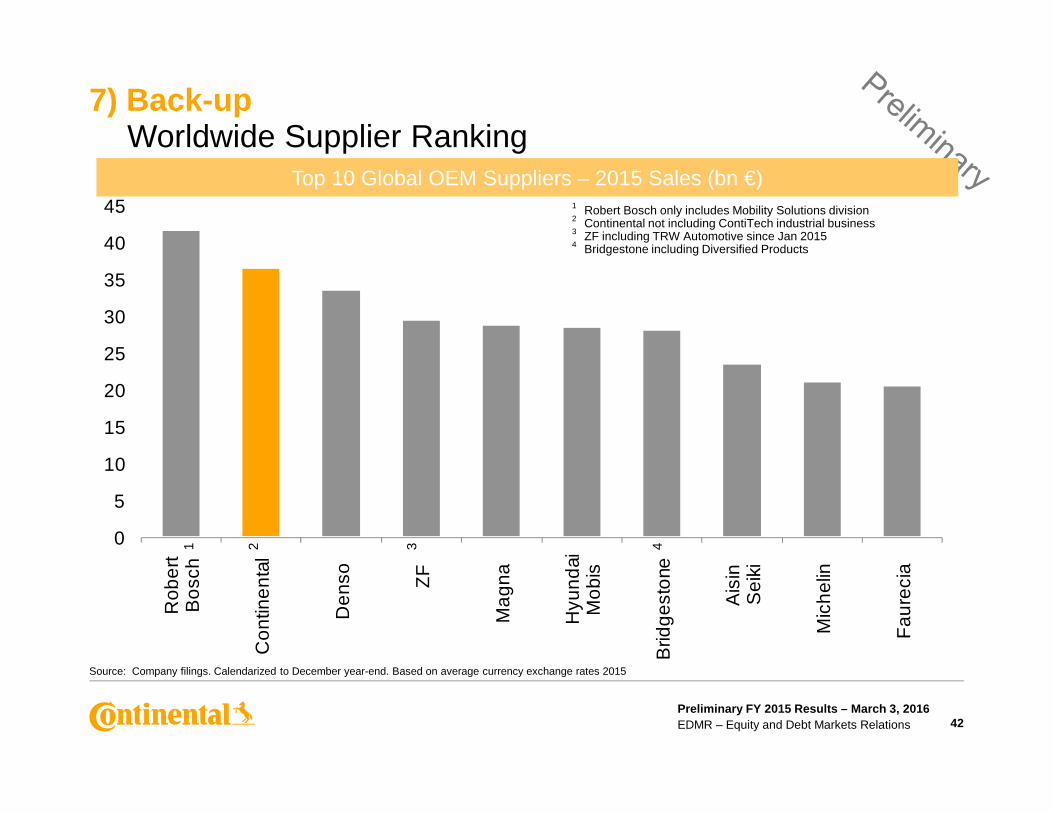
7) Back-upWorldwide Supplier Ranking
Top 10 Global OEM Suppliers – 2015 Sales (bn €)1 Robert Bosch only includes Mobility Solutions division2 Continental not including ContiTech industrial business3 ZF including TRW Automotive since Jan 20154 Bridgestone including Diversified Products
Preliminary FY 2015 Results – March 3, 2016EDMR – Equity and Debt Markets Relations
0
5
10
15
Rob
ert
Bo
sch
Co
ntin
en
tal
De
nso
ZF
Ma
gna
Hyu
nd
aiM
obi
s
Brid
ges
tone
Ais
inS
eiki
Mic
hel
in
Fau
reci
a
42
Source: Company filings. Calendarized to December year-end. Based on average currency exchange rates 2015
1 2 3 4

Germany21%
Asia20%
Other countries
5%Germany
18%Asia12%
Other countries
7%
7) Back-upSales by Markets
Automotive Group 2015€23,575 mn
Rubber Group 2015€15,705 mn
Corporation 2015€39,232 mn
Germany24%Asia
26%
Other countries
1%
Preliminary FY 2015 Results – March 3, 2016EDMR – Equity and Debt Markets Relations
Europe (ex
Germany)28%
NAFTA26%
20%
Europe (ex
Germany)36%
NAFTA27%
43
Europe (ex
Germany)23%
NAFTA26%
26%

ContiTech18%
7) Back-upEBITDA by Division
Automotive Group 2015€2,973 mn
Rubber Group 2015€3,182 mn
Corporation 2015€6,001 mn
Interior36%
Chassis & Safety
19%
ContiTech9%
Preliminary FY 2015 Results – March 3, 2016EDMR – Equity and Debt Markets Relations
Tires82%
44
Chassis & Safety
39%
Powertrain25%
Powertrain12%
Interior18%
Tires42%

7) Back-upCapex 2013 – 2015
Capex by Division 2013 – 2015 (mn €) Capex Distribution by Division 2013 – 2015
799724
658
166 191245
C&S PT I Tires CT
40% 35% 30%
8% 9% 11%
C&S PT I Tires CT
Preliminary FY 2015 Results – March 3, 2016EDMR – Equity and Debt Markets Relations 45
402 412 470
361 428468
253286
336
799724
2013 2014 2015
20% 20% 22%
18% 21% 21%
13% 14% 15%
40%
2013 2014 2015
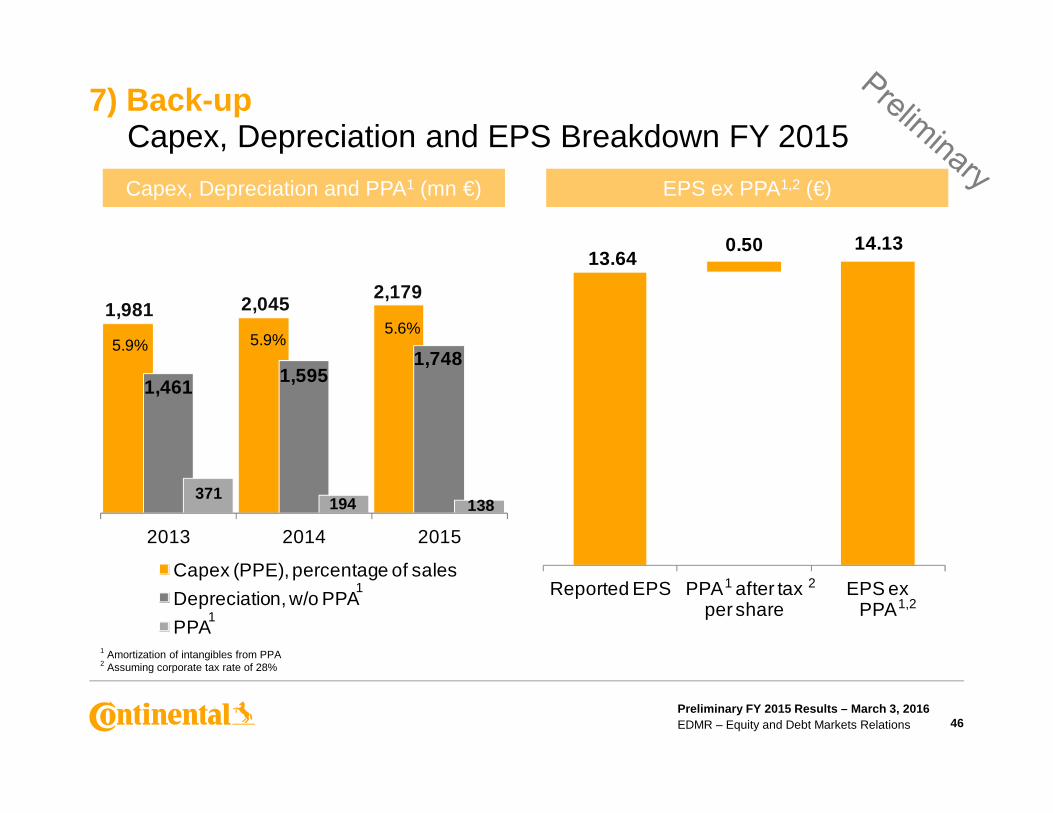
1,981 2,0452,179
1,4611,595
1,7485.9% 5.9%
5.6%
13.640.50 14.13
7) Back-upCapex, Depreciation and EPS Breakdown FY 2015
Capex, Depreciation and PPA1 (mn €) EPS ex PPA1,2 (€)
Preliminary FY 2015 Results – March 3, 2016EDMR – Equity and Debt Markets Relations
371194 138
2013 2014 2015
Capex (PPE), percentage of sales
Depreciation, w/o PPA
PPA
Reported EPS PPA after tax per share
EPS ex PPA
46
1 Amortization of intangibles from PPA2 Assuming corporate tax rate of 28%
1
1 1
1,2
2

6.2%
6.2%
4.9%
5.6%
3.2%
2.4%
7) Back-up Major Focus on Costs
Cost comparison 2008 to 2015
› Cost of sales declined by 630 bps
› R&D expenses as % of sales maintained on high level and increased in absolute terms to €2.4 bn
Selling and logistics costs up by
Cost as percentage of consolidated sales
Preliminary FY 2015 Results – March 3, 2016EDMR – Equity and Debt Markets Relations
80.4%74.1%
FY 2008 FY 2015Cost of sales R&D expenses
Selling and logistics expenses Administrative expenses
47
› Selling and logistics costs up by70 bps mainly due to expansion of tire distribution channels
› Administrative costs down by 80 bps
1
1 IAS 19 (rev. 2011) applied

› Continental’s current credit rating is:
› Fitch since September 5, 2014: BBB, outlook positive
4.55
0.48
H1/09 FY 2015
186%
27%
H1/09 FY 2015
22%
40%
H1/09 FY 2015
7) Back-up Investment Grade Rating Confirmed Despite Acquisitions
Leverage ratio1
Gearing ratio2 Equity ratio2
Preliminary FY 2015 Results – March 3, 2016EDMR – Equity and Debt Markets Relations
› Fitch since September 5, 2014: BBB, outlook positive
› S&P since May 20, 2015: BBB, outlook positive
› Moody’s since June 30, 2015 : Baa1, outlook stable
› Continental’s mid term targets:
› Rating: BBB / BBB+
› Gearing ratio: <20%
› Equity ratio: well above 35%
› Leverage ratio1: well below 1.00x
48
1 Leverage covenant ratio as defined in syndicated loan agreement; IAS 19 (rev. 2011) applied for 20152 IAS 19 (rev. 2011) applied for 2015

68
4
31
8
1,0
30
55
3
56
4
1,1
57
34
65
3
2,0
45
1,1
28
1,1
65
Q1 Q2 Q3 Q4
4,16
8
2,0
15
4,91
6
1,44
4
4,91
6
2,7
01
2014 2015 2015 before acquisitions
7) Back-up Cash Flow Overview
Cash Flow 2014 – 2015 (mn €) Cash Flow 2015 by Quarter (mn €)
Preliminary FY 2015 Results – March 3, 2016EDMR – Equity and Debt Markets Relations
-95
5
-27
1
-47
7-1
,12
3-9
18
Cash flow from
operating activities
Cash flow used
for investing activities
Free cashflow
Free cashflow before acquisitions
-2,1
53
-3,4
72 -2,2
15
Cash flow from
operating activities
Cash flow used
for investing activities
Free cashflow
49

Term loan Apr. 2016
350
RevolvingCredit Facility
Apr. 2020298
Bond Mar. 2017
(2.5%)750
Various other bank lines
1,078
Other indebtedness
719
7) Back-up Gross Indebtedness by Source at YE 2015 (mn €)
› Gross indebtedness €5,245 mn
(PY: €6,432 mn)
› Cash€1,622 mn
(PY: €3,244 mn)
› Net indebtedness
Syndicated loan 12%1
Bonds 53%1
Various other bank lines 21%1
Other
Preliminary FY 2015 Results – March 3, 2016EDMR – Equity and Debt Markets Relations
Bond Jul. 2018
(3.0%)750
Bond Feb. 2019
(0.5%)500
Bond Sept. 2020 (3.125%)
750
Bond Aug. 2025
(3.9%)50
50
› Net indebtedness€3,542 mn
(PY: €2,824 mn)
› Available credit lines
€3,612 mn(PY: €4,032 mn)
1 Percentages are calculated as share of gross indebtedness; bond values and the values for the syndicated loan are nominal values, all others book values
Other indebtedness 14%1
7) Back-upKey Historical Credit Metrics – IAS 19 (rev. 2011) applied6
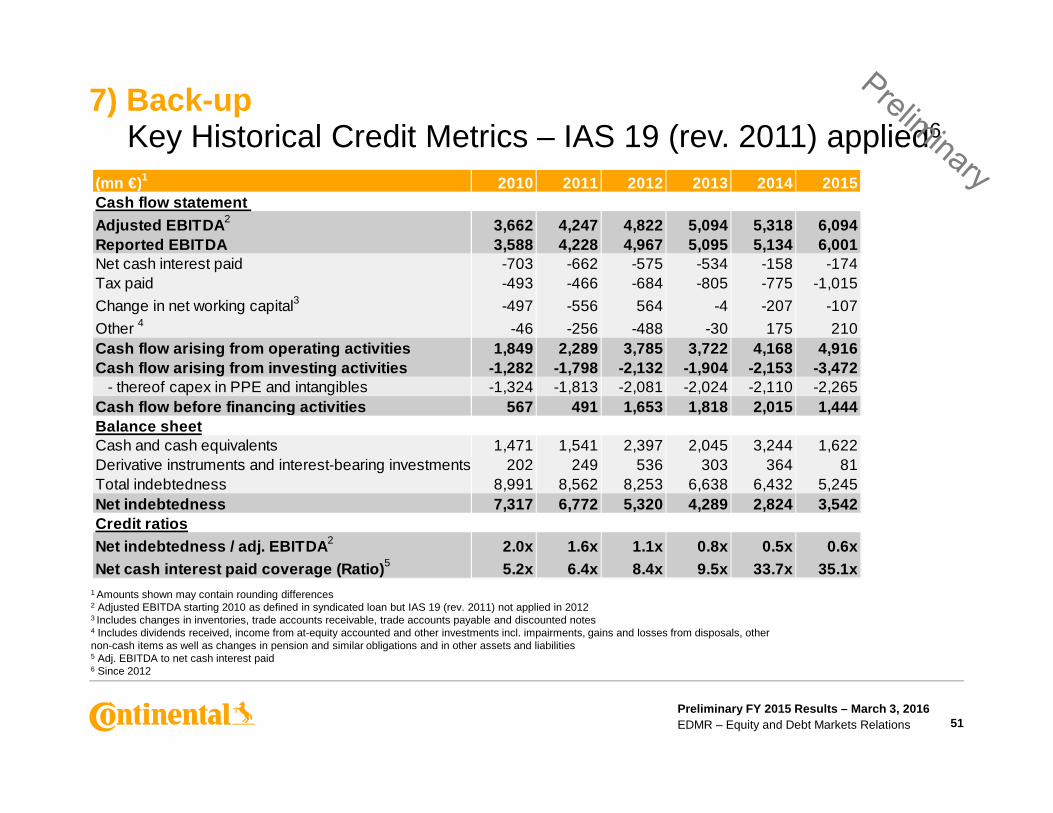
(mn €)1 2010 2011 2012 2013 2014 2015Cash flow statement Adjusted EBITDA 2 3,662 4,247 4,822 5,094 5,318 6,094Reported EBITDA 3,588 4,228 4,967 5,095 5,134 6,001Net cash interest paid -703 -662 -575 -534 -158 -174Tax paid -493 -466 -684 -805 -775 -1,015
Change in net working capital3 -497 -556 564 -4 -207 -107
Other 4 -46 -256 -488 -30 175 210Cash flow arising from operating activities 1,849 2,2 89 3,785 3,722 4,168 4,916Cash flow arising from investing activities -1,282 -1 ,798 -2,132 -1,904 -2,153 -3,472 - thereof capex in PPE and intangibles -1,324 -1,813 -2,081 -2,024 -2,110 -2,265Cash flow before financing activities 567 491 1,653 1,818 2,015 1,444
Preliminary FY 2015 Results – March 3, 2016EDMR – Equity and Debt Markets Relations 51
Cash flow before financing activities 567 491 1,653 1,818 2,015 1,444Balance sheetCash and cash equivalents 1,471 1,541 2,397 2,045 3,244 1,622Derivative instruments and interest-bearing investments 202 249 536 303 364 81Total indebtedness 8,991 8,562 8,253 6,638 6,432 5,245Net indebtedness 7,317 6,772 5,320 4,289 2,824 3,542Credit ratiosNet indebtedness / adj. EBITDA 2 2.0x 1.6x 1.1x 0.8x 0.5x 0.6xNet cash interest paid coverage (Ratio) 5 5.2x 6.4x 8.4x 9.5x 33.7x 35.1x
1 Amounts shown may contain rounding differences2 Adjusted EBITDA starting 2010 as defined in syndicated loan but IAS 19 (rev. 2011) not applied in 20123 Includes changes in inventories, trade accounts receivable, trade accounts payable and discounted notes4 Includes dividends received, income from at-equity accounted and other investments incl. impairments, gains and losses from disposals, othernon-cash items as well as changes in pension and similar obligations and in other assets and liabilities 5 Adj. EBITDA to net cash interest paid6 Since 2012
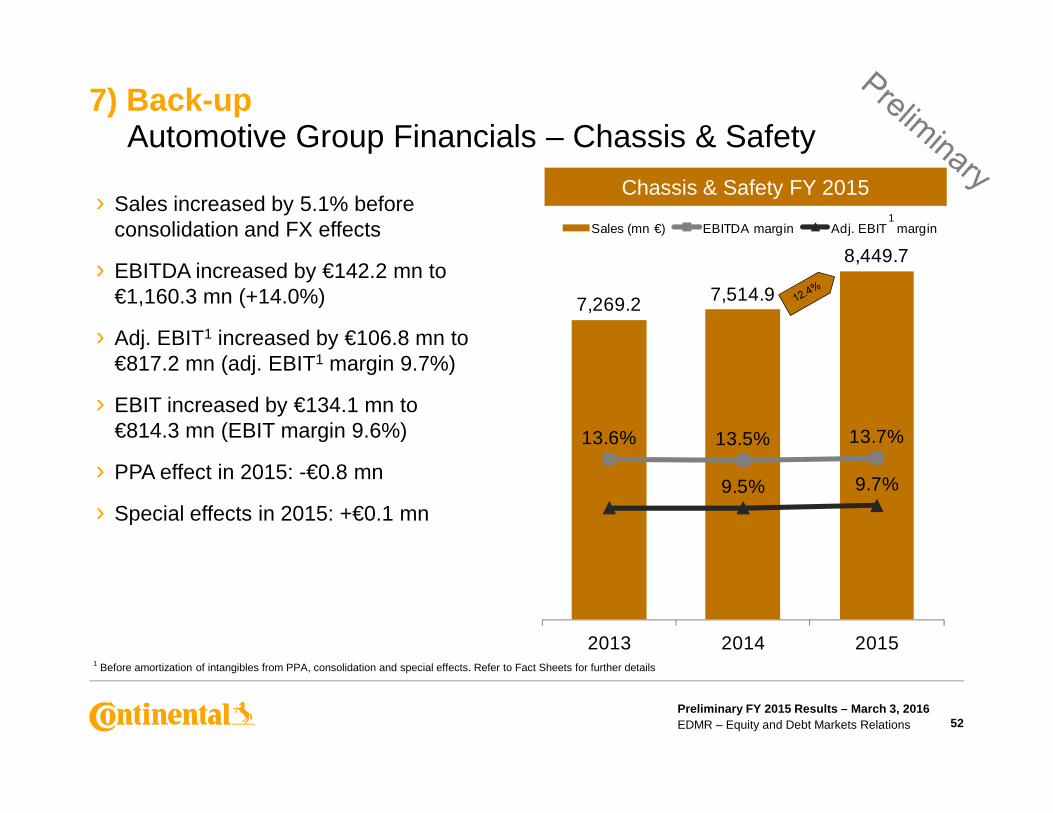
7,269.2 7,514.9
8,449.7
Sales (mn €) EBITDA margin Adj. EBIT margin
› Sales increased by 5.1% before consolidation and FX effects
› EBITDA increased by €142.2 mn to €1,160.3 mn (+14.0%)
› Adj. EBIT1 increased by €106.8 mn to €817.2 mn (adj. EBIT1 margin 9.7%)
› EBIT increased by €134.1 mn to
7) Back-upAutomotive Group Financials – Chassis & Safety
Chassis & Safety FY 20151
Preliminary FY 2015 Results – March 3, 2016EDMR – Equity and Debt Markets Relations
13.6% 13.5% 13.7%
9.5% 9.7%
2013 2014 2015
› EBIT increased by €134.1 mn to €814.3 mn (EBIT margin 9.6%)
› PPA effect in 2015: -€0.8 mn
› Special effects in 2015: +€0.1 mn
52
1 Before amortization of intangibles from PPA, consolidation and special effects. Refer to Fact Sheets for further details

6,260.3 6,494.37,068.5
10.4% 10.3%
Sales (mn €) EBITDA margin Adj. EBIT margin
7) Back-upAutomotive Group Financials – Powertrain
Powertrain FY 20151
› Sales increased by 0.3% before consolidation and FX effects
› EBITDA increased by €287.4 mn to €730.7 mn (+64.8%)
› Adj. EBIT1 increased by €164.1 mn to €424.6 mn (adj. EBIT1 margin 6.1%)
› EBIT increased by €492.4 mn to
Preliminary FY 2015 Results – March 3, 2016EDMR – Equity and Debt Markets Relations
10.4%
6.8%
10.3%
4.0%6.1%
2013 2014 2015
53
1 Before amortization of intangibles from PPA, consolidation and special effects. Refer to Fact Sheets for further details
› EBIT increased by €492.4 mn to €395.6 mn (EBIT margin 5.6%)
› PPA effect in 2015: -€8.2 mn
› Special effects in 2015: -€0.9 mn

6,605.77,002.5
8,154.8
13.5% 13.3%
Sales (mn €) EBITDA margin Adj. EBIT margin
› Sales increased by 8.3% before consolidation and FX effects
› EBITDA increased by €135.9 mn to €1,082.2 mn (+14.4%)
› Adj. EBIT1 increased by €115.9 mn to €824.3 mn (adj. EBIT1 margin 10.2%)
› EBIT increased by €198.6 mn to
7) Back-upAutomotive Group Financials – Interior
Interior FY 20151
Preliminary FY 2015 Results – March 3, 2016EDMR – Equity and Debt Markets Relations
12.9%13.5% 13.3%
10.1% 10.2%
2013 2014 2015
› EBIT increased by €198.6 mn to €804.5 mn (EBIT margin 9.9%)
› PPA effect in 2015: -€17.4 mn
› Special effects in 2015 : +€3.2 mn
54
1 Before amortization of intangibles from PPA, consolidation and special effects. Refer to Fact Sheets for further details
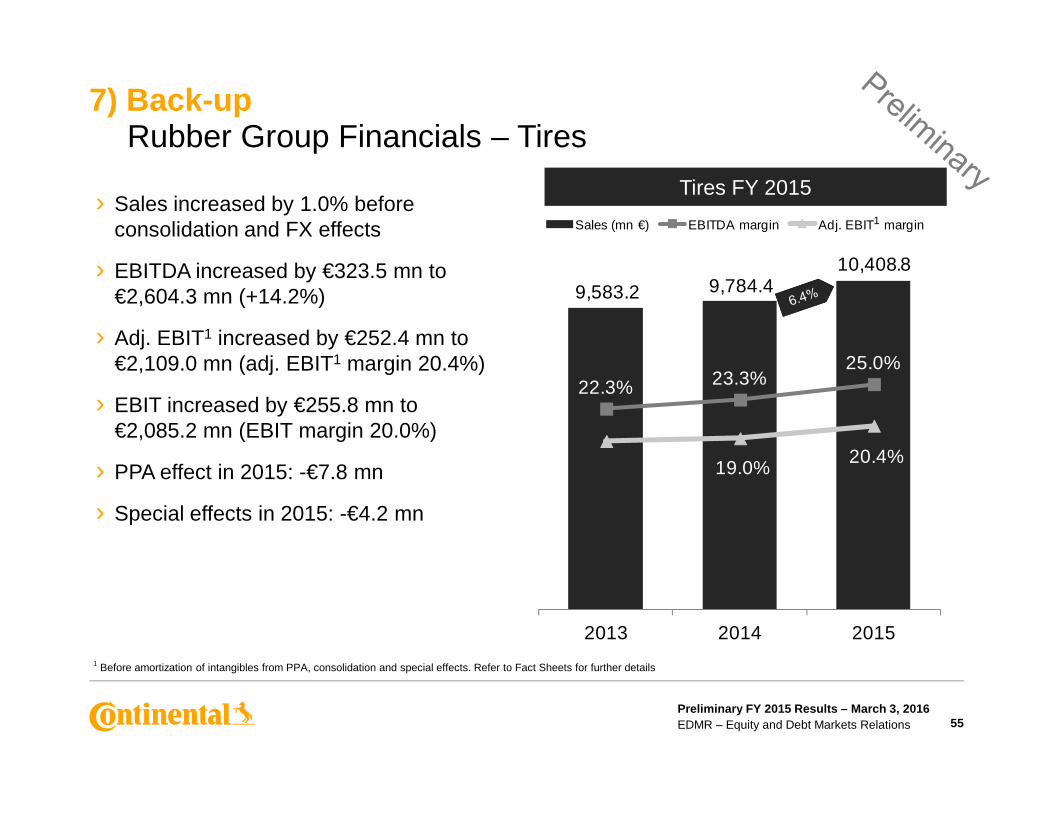
9,583.2 9,784.4 10,408.8
22.3% 23.3%25.0%
Sales (mn €) EBITDA margin Adj. EBIT margin› Sales increased by 1.0% before
consolidation and FX effects
› EBITDA increased by €323.5 mn to €2,604.3 mn (+14.2%)
› Adj. EBIT1 increased by €252.4 mn to €2,109.0 mn (adj. EBIT1 margin 20.4%)
› EBIT increased by €255.8 mn to
7) Back-upRubber Group Financials – Tires
Tires FY 20151
Preliminary FY 2015 Results – March 3, 2016EDMR – Equity and Debt Markets Relations
19.0%20.4%
2013 2014 2015
› EBIT increased by €255.8 mn to €2,085.2 mn (EBIT margin 20.0%)
› PPA effect in 2015: -€7.8 mn
› Special effects in 2015: -€4.2 mn
55
1 Before amortization of intangibles from PPA, consolidation and special effects. Refer to Fact Sheets for further details

0%
5%
10%
15%
20%
-5%
0%
5%
10%
15%
20%
7) Back-upTires – Passenger and Light Truck Tire Demand
Replacement Tire Demand Development for PC & LT Europe
Replacement Tire Demand Development for PC & LT NAFTA
Preliminary FY 2015 Results – March 3, 2016EDMR – Equity and Debt Markets Relations
-25%
-20%
-15%
-10%
-5%
Jan-
11
May
-11
Sep
-11
Jan-
12
May
-12
Sep
-12
Jan-
13
May
-13
Sep
-13
Jan-
14
May
-14
Sep
-14
Jan-
15
May
-15
Sep
-15
Jan-
16
PC & LT Tire Replacement (YOY chg. monthly)
-25%
-20%
-15%
-10%
-5%
Jan-
11
May
-11
Sep
-11
Jan-
12
May
-12
Sep
-12
Jan-
13
May
-13
Sep
-13
Jan-
14
May
-14
Sep
-14
Jan-
15
May
-15
Sep
-15
Jan-
16
PC & LT Tire Replacement (YOY chg. monthly)
Vehicle miles YOY chg. monthly (DOT)
56
1 U.S. Department of Transportation
1

0%
10%
20%
30%
0%
10%
20%
30%
7) Back-upTires – Commercial Vehicle Tire Demand
Replacement Tire Demand for Truck Tires Europe
Replacement Tire Demand for Truck Tires NAFTA
Preliminary FY 2015 Results – March 3, 2016EDMR – Equity and Debt Markets Relations
-30%
-20%
-10%
Jan-
11
May
-11
Sep
-11
Jan-
12
May
-12
Sep
-12
Jan-
13
May
-13
Sep
-13
Jan-
14
May
-14
Sep
-14
Jan-
15
May
-15
Sep
-15
Jan-
16
Truck tire replacement (YOY chg. monthly)
km BAG monthly (adj.)
-30%
-20%
-10%
Jan-
11
May
-11
Sep
-11
Jan-
12
May
-12
Sep
-12
Jan-
13
May
-13
Sep
-13
Jan-
14
May
-14
Sep
-14
Jan-
15
May
-15
Sep
-15
Jan-
16
Truck tire replacement (YOY chg. monthly)
ATA monthly (adj.)
57
1 BAG = Bundesamt für Güterverkehr2 ATA = American Trucking Association (miles traveled)
21
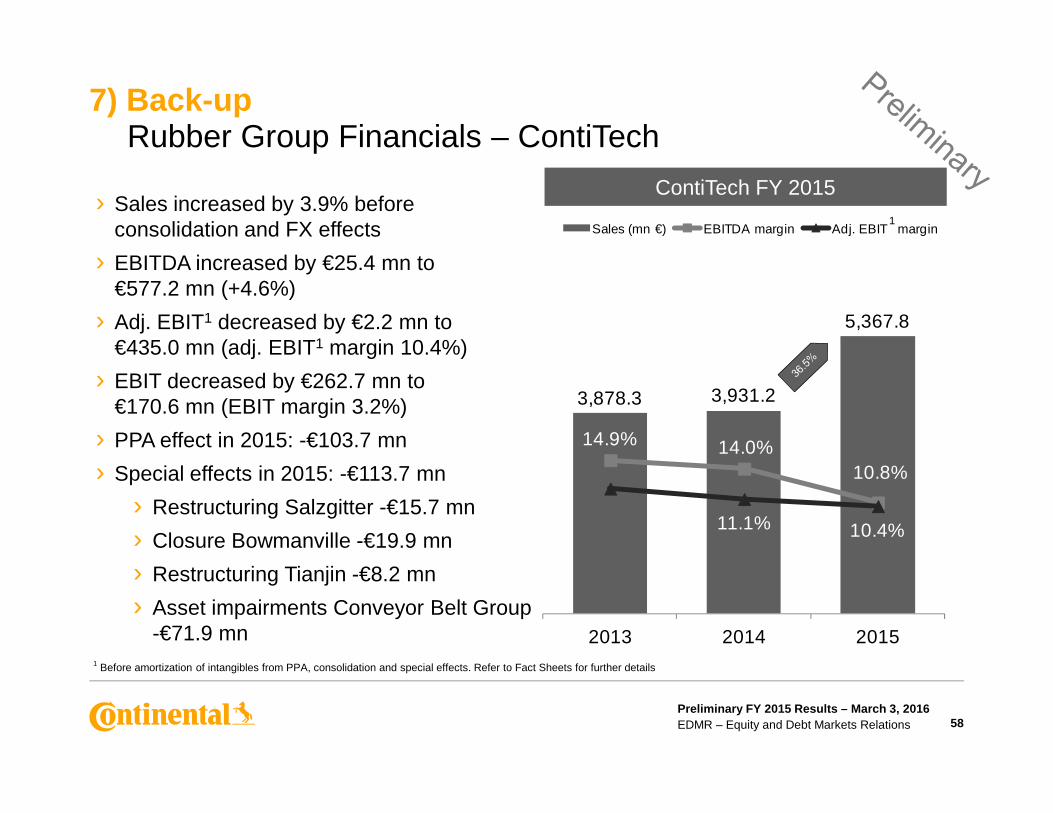
3,878.3 3,931.2
5,367.8
Sales (mn €) EBITDA margin Adj. EBIT margin
› Sales increased by 3.9% before consolidation and FX effects
› EBITDA increased by €25.4 mn to €577.2 mn (+4.6%)
› Adj. EBIT1 decreased by €2.2 mn to €435.0 mn (adj. EBIT1 margin 10.4%)
› EBIT decreased by €262.7 mn to €170.6 mn (EBIT margin 3.2%)
7) Back-upRubber Group Financials – ContiTech
ContiTech FY 20151
Preliminary FY 2015 Results – March 3, 2016EDMR – Equity and Debt Markets Relations
3,878.3
14.9% 14.0%10.8%
11.1% 10.4%
2013 2014 2015
€170.6 mn (EBIT margin 3.2%)
› PPA effect in 2015: -€103.7 mn
› Special effects in 2015: -€113.7 mn
› Restructuring Salzgitter -€15.7 mn
› Closure Bowmanville -€19.9 mn
› Restructuring Tianjin -€8.2 mn
› Asset impairments Conveyor Belt Group -€71.9 mn
58
1 Before amortization of intangibles from PPA, consolidation and special effects. Refer to Fact Sheets for further details

Fact Sheets 2013 – 2015
Preliminary FY 2015 Results – March 3, 2016EDMR – Equity and Debt Markets Relations 59
Fact Sheets 2013 – 2015

7) Fact SheetsQuarterly Sales Analysis
Sales (mn €)Q1 Q2 Q3 Q4 FY Q1 Q2 Q3 Q4 FY Q1 Q2 Q3 Q4 FY
C&S 1,792.9 1,860.8 1,800.1 1,815.4 7,269.2 1,878.2 1,868.5 1,823.4 1,944.8 7,514.9 2,136.0 2,142.1 1,999.0 2,172.6 8,449.7Powertrain 1,526.1 1,606.5 1,561.3 1,566.4 6,260.3 1,579.1 1,598.4 1,638.9 1,677.9 6,494.3 1,826.5 1,819.8 1,657.4 1,764.8 7,068.5Interior 1,620.1 1,723.3 1,612.5 1,649.8 6,605.7 1,699.1 1,733.9 1,725.4 1,844.1 7,002.5 1,975.2 2,057.0 2,028.2 2,094.4 8,154.8Tires 2,222.2 2,419.0 2,478.2 2,463.8 9,583.2 2,318.3 2,405.9 2,557.8 2,502.4 9,784.4 2,419.8 2,644.4 2,654.4 2,690.2 10,408.8ContiTech 941.6 998.7 961.9 976.1 3,878.3 973.4 978.6 979.6 999.6 3,931.2 1,268.3 1,418.8 1,330.8 1,349.9 5,367.8Other / Consolidation -69.6 -67.3 -64.4 -64.4 -265.7 -58.0 -57.3 -55.6 -50.7 -221.6 -56.9 -52.4 -52.2 -56.1 -217.6Continental Corporation 8,033.3 8,541.0 8,349.6 8,407.1 33,331.0 8,390.1 8,528.0 8,669.5 8,918.1 34,505.7 9,568.9 10,029.7 9,617.6 10,015.8 39,232.0
Changes Y-o-Y in %Q1 Q2 Q3 Q4 FY Q1 Q2 Q3 Q4 FY
C&S 4.8 0.4 1.3 7.1 3.4 13.7 14.6 9.6 11.7 12.4Powertrain 3.5 -0.5 5.0 7.1 3.7 15.7 13.9 1.1 5.2 8.8Interior 4.9 0.6 7.0 11.8 6.0 16.2 18.6 17.5 13.6 16.5Tires 4.3 -0.5 3.2 1.6 2.1 4.4 9.9 3.8 7.5 6.4
2013 2014 2015
2014 2015
Preliminary FY 2015 Results – March 3, 2016EDMR – Equity and Debt Markets Relations 60
Tires 4.3 -0.5 3.2 1.6 2.1 4.4 9.9 3.8 7.5 6.4ContiTech 3.4 -2.0 1.8 2.4 1.4 30.3 45.0 35.9 35.0 36.5Continental Corporation 4.4 -0.2 3.8 6.1 3.5 14.0 17.6 10.9 12.3 13.7

7) Fact SheetsQuarterly EBITDA Analysis
EBITDA (mn €)Q1 Q2 Q3 Q4 FY Q1 Q2 Q3 Q4 FY Q1 Q2 Q3 Q4 FY
C&S 241.8 250.3 245.8 252.3 990.2 254.0 242.0 262.0 260.1 1,018.1 297.3 293.4 268.3 301.3 1,160.3Powertrain 158.9 168.5 160.7 162.1 650.2 157.0 125.3 -11.9 172.9 443.3 177.2 183.5 167.3 202.7 730.7Interior 202.1 220.1 214.5 213.5 850.2 223.2 244.5 229.7 248.9 946.3 252.9 299.8 252.4 277.1 1,082.2Tires 459.2 533.2 590.9 554.4 2,137.7 545.4 591.9 603.5 540.0 2,280.8 579.7 734.6 667.7 622.3 2,604.3ContiTech 135.9 157.5 139.7 143.2 576.3 143.7 132.9 144.7 130.5 551.8 129.2 169.1 159.7 119.2 577.2Other / Consolidation -28.5 -19.7 -29.1 -32.3 -109.6 -27.5 -26.6 -24.7 -27.7 -106.5 -33.1 -47.1 -23.7 -49.4 -153.3Continental Corporation 1,169.4 1,309.9 1,322.5 1,293.2 5,095.0 1,295.8 1,310.0 1,203.3 1,324.7 5,133.8 1,403.2 1,633.3 1,491.7 1,473.2 6,001.4
EBITDA margin in %Q1 Q2 Q3 Q4 FY Q1 Q2 Q3 Q4 FY Q1 Q2 Q3 Q4 FY
C&S 13.5 13.5 13.7 13.9 13.6 13.5 13.0 14.4 13.4 13.5 13.9 13.7 13.4 13.9 13.7Powertrain 10.4 10.5 10.3 10.3 10.4 9.9 7.8 -0.7 10.3 6.8 9.7 10.1 10.1 11.5 10.3Interior 12.5 12.8 13.3 12.9 12.9 13.1 14.1 13.3 13.5 13.5 12.8 14.6 12.4 13.2 13.3Tires 20.7 22.0 23.8 22.5 22.3 23.5 24.6 23.6 21.6 23.3 24.0 27.8 25.2 23.1 25.0
2013 2014 2015
2013 2014 2015
Preliminary FY 2015 Results – March 3, 2016EDMR – Equity and Debt Markets Relations 61
Tires 20.7 22.0 23.8 22.5 22.3 23.5 24.6 23.6 21.6 23.3 24.0 27.8 25.2 23.1 25.0ContiTech 14.4 15.8 14.5 14.7 14.9 14.8 13.6 14.8 13.1 14.0 10.2 11.9 12.0 8.8 10.8Continental Corporation 14.6 15.3 15.8 15.4 15.3 15.4 15.4 13.9 14.9 14.9 14.7 16.3 15.5 14.7 15.3
Changes Y-o-Y in %Q1 Q2 Q3 Q4 FY Q1 Q2 Q3 Q4 FY
C&S 5.0 -3.3 6.6 3.1 2.8 17.0 21.2 2.4 15.8 14.0Powertrain -1.2 -25.6 -107.4 6.7 -31.8 12.9 46.4 1,505.9 17.2 64.8Interior 10.4 11.1 7.1 16.6 11.3 13.3 22.6 9.9 11.3 14.4Tires 18.8 11.0 2.1 -2.6 6.7 6.3 24.1 10.6 15.2 14.2ContiTech 5.7 -15.6 3.6 -8.9 -4.3 -10.1 27.2 10.4 -8.7 4.6Continental Corporation 10.8 0.0 -9.0 2.4 0.8 8.3 24.7 24.0 11.2 16.9
2014 2015

7) Fact SheetsQuarterly EBIT Analysis
EBIT (mn €)Q1 Q2 Q3 Q4 FY Q1 Q2 Q3 Q4 FY Q1 Q2 Q3 Q4 FY
C&S 155.3 162.7 155.1 125.8 598.9 172.3 159.3 179.5 169.1 680.2 214.9 209.3 181.5 208.6 814.3Powertrain 52.1 58.3 49.5 19.6 179.5 64.5 32.9 -263.3 69.1 -96.8 96.7 101.0 81.3 116.6 395.6Interior 95.7 112.5 104.4 68.0 380.6 137.8 154.7 144.8 168.6 605.9 190.9 234.1 178.7 200.8 804.5Tires 365.2 440.3 494.6 452.6 1,752.7 440.7 482.4 486.8 419.5 1,829.4 454.0 604.1 536.5 490.6 2,085.2ContiTech 107.7 129.2 111.8 113.4 462.1 115.5 104.3 115.1 98.4 433.3 54.9 82.3 80.6 -47.2 170.6Other / Consolidation -28.6 -19.8 -29.1 -32.6 -110.1 -27.6 -26.7 -25.1 -27.8 -107.2 -33.5 -47.5 -24.0 -49.6 -154.6Continental Corporation 747.4 883.2 886.3 746.8 3,263.7 903.2 906.9 637.8 896.9 3,344.8 977.9 1,183.3 1,034.6 919.8 4,115.6
EBIT margin in %Q1 Q2 Q3 Q4 FY Q1 Q2 Q3 Q4 FY Q1 Q2 Q3 Q4 FY
C&S 8.7 8.7 8.6 6.9 8.2 9.2 8.5 9.8 8.7 9.1 10.1 9.8 9.1 9.6 9.6Powertrain 3.4 3.6 3.2 1.3 2.9 4.1 2.1 -16.1 4.1 -1.5 5.3 5.6 4.9 6.6 5.6Interior 5.9 6.5 6.5 4.1 5.8 8.1 8.9 8.4 9.1 8.7 9.7 11.4 8.8 9.6 9.9Tires 16.4 18.2 20.0 18.4 18.3 19.0 20.1 19.0 16.8 18.7 18.8 22.8 20.2 18.2 20.0
2013 2014 2015
2013 2014 2015
Preliminary FY 2015 Results – March 3, 2016EDMR – Equity and Debt Markets Relations 62
Tires 16.4 18.2 20.0 18.4 18.3 19.0 20.1 19.0 16.8 18.7 18.8 22.8 20.2 18.2 20.0ContiTech 11.4 12.9 11.6 11.6 11.9 11.9 10.7 11.7 9.8 11.0 4.3 5.8 6.1 -3.5 3.2Continental Corporation 9.3 10.3 10.6 8.9 9.8 10.8 10.6 7.4 10.1 9.7 10.2 11.8 10.8 9.2 10.5
Changes Y-o-Y in %Q1 Q2 Q3 Q4 FY Q1 Q2 Q3 Q4 FY
C&S 10.9 -2.1 15.7 34.4 13.6 24.7 31.4 1.1 23.4 19.7Powertrain 23.8 -43.6 -631.9 252.6 -153.9 49.9 207.0 130.9 68.7 508.7Interior 44.0 37.5 38.7 147.9 59.2 38.5 51.3 23.4 19.1 32.8Tires 20.7 9.6 -1.6 -7.3 4.4 3.0 25.2 10.2 16.9 14.0ContiTech 7.2 -19.3 3.0 -13.2 -6.2 -52.5 -21.1 -30.0 -148.0 -60.6Continental Corporation 20.8 2.7 -28.0 20.1 2.5 8.3 30.5 62.2 2.6 23.0
2014 2015

7) Fact SheetsQuarterly Analysis of Adjusted EBIT1
Adjusted EBIT 1 (mn€)Q1 Q2 Q3 Q4 FY Q1 Q2 Q3 Q4 FY
C&S 179.1 166.6 186.4 178.3 710.4 215.2 209.4 182.0 210.6 817.2Powertrain 83.7 85.5 7.2 84.1 260.5 102.2 120.3 86.7 115.4 424.6Interior 162.7 190.9 168.0 186.8 708.4 191.3 234.5 183.7 214.8 824.3Tires 441.0 483.2 511.5 420.9 1,856.6 459.2 612.6 541.3 495.9 2,109.0ContiTech 115.8 104.5 117.4 99.5 437.2 119.5 120.9 105.9 88.7 435.0Other / Consolidation -27.6 -26.7 -25.1 -27.8 -107.2 -33.5 -47.5 -24.0 -49.6 -154.6Continental Corporation 954.7 1,004.0 965.4 941.8 3,865.9 1,053.9 1,250.2 1,075.6 1,075.8 4,455.5
Adjusted EBIT 1 margin in %Q1 Q2 Q3 Q4 FY Q1 Q2 Q3 Q4 FY
C&S 9.5 8.9 10.2 9.2 9.5 10.1 9.8 9.1 9.7 9.7Powertrain 5.3 5.3 0.4 5.0 4.0 5.8 6.8 5.2 6.5 6.1
2014 2015
2014 2015
Preliminary FY 2015 Results – March 3, 2016EDMR – Equity and Debt Markets Relations 63
1 Before amortization of intangibles from PPA, changes in the scope of consolidation and special effects
Powertrain 5.3 5.3 0.4 5.0 4.0 5.8 6.8 5.2 6.5 6.1Interior 9.6 11.0 9.7 10.1 10.1 9.7 11.4 9.2 10.6 10.2Tires 19.1 20.1 20.0 16.8 19.0 19.2 23.4 20.4 18.5 20.4ContiTech 11.9 10.7 12.0 10.0 11.1 11.6 11.3 10.3 8.4 10.4Continental Corporation 11.4 11.8 11.1 10.6 11.2 11.4 13.0 11.6 11.1 11.8
Changes Y-o-Y in %Q1 Q2 Q3 Q4 FY
C&S 20.2 25.7 -2.4 18.1 15.0Powertrain 22.1 40.7 1,104.2 37.2 63.0Interior 17.6 22.8 9.3 15.0 16.4Tires 4.1 26.8 5.8 17.8 13.6ContiTech 3.2 15.7 -9.8 -10.9 -0.5Continental Corporation 10.4 24.5 11.4 14.2 15.3
2015

7) Fact SheetsConsolidated Statement of Income
Sales 33,331.0 34,505.7 39,232.0
Cost of sales -25,529.4 -25,839.6 -29,056.8
Gross margin on sales 7,801.6 8,666.1 10,175.2
Research and development expenses -1,878.4 -2,137.7 -2,449.6
Selling and logistics expenses -1,657.0 -1,840.6 -2,179.0
Administrative expenses -698.7 -762.8 -925.5
Other income and expenses -342.2 -507.4 -567.7
Income from at-equity accounted investees 37.6 -73.8 61.4
Other income from investments 0.8 1.0 0.8
(mn €) 2013 2014 2015
Preliminary FY 2015 Results – March 3, 2016EDMR – Equity and Debt Markets Relations 64
1 Including interest effects of pension obligations, of other long-term employee benefits, and of pension funds. In 2013, the resulting income was reported under interest expense; the comparative figures for 2013 have been adjusted accordingly
Earnings before interest and taxes 3,263.7 3,344.8 4,115.6
Interest income181.8 94,5 95.4
Interest expense1-886.1 -359,8 -341.0
Net interest result -804.3 -265.3 -245.6
Earnings before taxes 2,459.4 3,079.5 3,870.0
Income tax expense -449.6 -622.0 -1,090.4
Net income 2,009.8 2,457.5 2,779.6
Non-controlling interests -86.7 -82.2 -52.2
Net income attributable to the shareholders of the parent 1,923.1 2,375.3 2,727.4
Basic earnings per share in EUR 9.62 11.88 13.64
Diluted earnings per share in EUR 9.62 11.88 13.64

7) Fact SheetsConsolidated Statement of Financial Position – Assetsin € millions Dec. 31, 2015 Dec. 31, 2014
Goodwill 6,640.6 5,769.1
Other intangible assets 1,336.4 443.3
Property, plant and equipment 9,538.9 8,446.4
Investment property 16.0 17.5
Investments in at-equity accounted investees 345.8 298.5
Other investments 14.1 10.7
Deferred tax assets 1,669.7 1,573.4
Defined benefit assets 18.9 1.6
Long-term derivative instruments and interest-bearing investments 17.1 301.2
Long-term other financial assets 47.6 41.9
Preliminary FY 2015 Results – March 3, 2016EDMR – Equity and Debt Markets Relations 65
Long-term other assets 21.5 19.7
Non-current assets 19,666.6 16,923.3
Inventories 3,360.1 2,987.6
Trade accounts receivable 6,722.9 5,846.2
Short-term other financial assets 434.7 382.5
Short-term other assets 803.9 731.3
Income tax receivables 149.7 60.3
Short-term derivative instruments and interest-bearing investments 64.3 63.1
Cash and cash equivalents 1,621.5 3,243.8
Assets held for sale 12.0 3.0
Current assets 13,169.1 13,317.8
Total assets 32,835.7 30,241.1

7) Fact SheetsConsolidated Statement of Financial Position – Total Equity and Liabilitiesin € millions Dec. 31, 2015 Dec. 31, 2014
Subscribed capital 512.0 512.0
Capital reserves 4,155.6 4,155.6
Retained earnings 9,481.8 7,404.3
Other comprehensive income -1,363.1 -1,399.8
Equity attributable to the shareholders of the pare nt 12,786.3 10,672.1
Non-controlling interests 427.6 352.5
Total equity 13,213.9 11,024.6
Provisions for pension liabilities and similar obligations 3,532.7 3,483.7
Deferred tax liabilities 361.2 178.5
Long-term provisions for other risks and obligations 301.5 306.3
Long-term indebtedness 3,175.0 5,077.4
Preliminary FY 2015 Results – March 3, 2016EDMR – Equity and Debt Markets Relations 66
Long-term indebtedness 3,175.0 5,077.4
Long-term other financial liabilities 94.9 48.7
Long-term other liabilities 55.7 46.4
Non-current liabilities 7,521.0 9,141.0
Trade accounts payable 5,493.8 4,861.6
Income tax payables 719.8 577.3
Short-term provisions for other risks and obligations 845.5 732.7
Short-term indebtedness 2,069.8 1,354.2
Short-term other financial liabilities 1,968.7 1,649.2
Short-term other liabilities 1,001.2 900.2
Liabilities held for sale 2.0 0.3
Current liabilities 12,100.8 10,075.5
Total equity and liabilities 32,835.7 30,241.1

7) Fact SheetsConsolidated Statement of Cash Flowsin € millions 2015 2014
Net income 2,779.6 2,457.5
Income tax expense 1,090.4 622.0
Net interest result 245.6 265.3
EBIT 4,115.6 3,344.8
Interest paid -204.6 -185.9
Interest received 31.1 28.2
Income tax paid -1,015.3 -775.0
Dividends received 48.0 33.7
Depreciation, amortization, impairment and reversal of impairment losses 1,885.8 1,789.0
Income from at-equity accounted and other investments, incl. impairment and reversal of impairment losses -62.2 71.3
Gains from the disposal of assets, companies and business operations -16.9 -13.6
Changes in
inventories -59.5 -20.1
trade accounts receivable -447.2 -246.6
trade accounts payable 400.0 59.3
Pension and similar obligations 57.2 -20.5
other assets and liabilities 183.6 103.7
Cash flow arising from operating activities 4,915.6 4,168.3
Preliminary FY 2015 Results – March 3, 2016EDMR – Equity and Debt Markets Relations 67
Cash flow from the disposal of property, plant and equipment, and intangible assets 35.7 86.4
Capital expenditure on property, plant and equipment, and software -2,178.8 -2,045.4
Capital expenditure on intangible assets from development projects and miscellaneous -85.8 -64.9
Cash flow from the disposal of companies and business operations 13.8 -0.5
Acquisition of companies and business operations -1,256.9 -129.0
Cash flow arising from investing activities -3,472.0 -2,153.4
Cash flow before financing activities (free cash fl ow) 1,443.6 2,014.9
Changes in short-term debt -774.1 -323.2
Proceeds from the issuance of long-term debt 549.2 1,565.0
Principal repayments on long-term debt -2,133.4 -1,604.6
Successive purchases -27.3 0.0
Dividends paid -650.0 -500.0
Dividends paid to and cash changes from equity transactions with non-controlling interests -62.5 -45.5
Cash and cash equivalents arising from first consolidation of subsidiaries 0.5 0.4
Cash flow arising from financing activities -3,097.6 -907.9
Change in cash and cash equivalents -1,654.0 1,107.0
Cash and cash equivalents as at January 1 3,243.8 2,044.8
Effect of exchange rate changes on cash and cash equivalents 31.7 92.0
Cash and cash equivalents as at December 31 1,621.5 3,243.8

7) Fact SheetsFY 2015 Results Reported and Adjusted (mn €) – by Division
2014 2015 2014 2015 2014 2015 2014 2015 2014 2015 2014 2015 2014 2015
Sales 7,514.9 8,449.7 6,494.3 7,068.5 7,002.5 8,154.8 9,784.4 10,408.8 3,931.2 5,367.8 -221.6 -217.6 34,505.7 39,232.0
EBIT 680.2 814.3 -96.8 395.6 605.9 804.5 1,829.4 2,085.2 433.3 170.6 -107.2 -154.6 3,344.8 4,115.6in % of sales 9.1% 9.6% -1.5% 5.6% 8.7% 9.9% 18.7% 20.0% 11.0% 3.2% 9.7% 10.5%
Amortization of intangible assets from PPA 25.5 0.8 64 .5 8.2 92.3 17.4 5.5 7.8 6.2 103.7 0.0 0.0 194.0 137.9
Total special effects 4.7 -0.1 285.1 0.9 10.2 -3.2 25.6 4.2 -2.3 113.7 0.0 0.0 323.3 115.5
Total consolidation effects 0.0 2.2 7.7 19.9 0.0 5.6 -3.9 11.8 0.0 47.0 0.0 0.0 3.8 86.5
Total consolidation & special effects 4.7 2.1 292.8 20. 8 10.2 2.4 21.7 16.0 -2.3 160.7 0.0 0.0 327.1 202.0
Adjusted operating result (adj. EBIT) 1 710.4 817.2 260.5 424.6 708.4 824.3 1,856.6 2,109.0 437.2 435.0 -107.2 -154.6 3,865.9 4,455.5
CorporationInteriorChassis & Safety Powertrain Tires ContiTech Cons./Corr.
Preliminary FY 2015 Results – March 3, 2016EDMR – Equity and Debt Markets Relations 68
1 Before amortization of intangibles from PPA, changes in the scope of consolidation and special effects
Adjusted operating result (adj. EBIT) 710.4 817.2 260.5 424.6 708.4 824.3 1,856.6 2,109.0 437.2 435.0 -107.2 -154.6 3,865.9 4,455.5in % of adjusted sales 9.5% 9.7% 4.0% 6.1% 10.1% 10.2% 19.0% 20.4% 11.1% 10.4% 11.2% 11.8%

7) Fact SheetsFY 2015 Results Reported and Adjusted (mn €) – by Group
2014 2015 2014 2015 2014 2015 2014 2015
Sales 20,909.2 23,574.5 13,637.6 15,704.6 -41.1 -47.1 34,505.7 39,232.0
EBIT 1,189.3 2,014.4 2,262.7 2,255.8 -107.2 -154.6 3,344.8 4,115.6in % of sales 5.7% 8.5% 16.6% 14.4% 9.7% 10.5%
Amortization of intangible assets from PPA 182.3 26.4 11.7 111.5 0.0 0.0 194.0 137.9
Total special effects 300.0 -2.4 23.3 117.9 0.0 0.0 323.3 1 15.5
Total consolidation effects 7.7 27.7 -3.9 58.8 0.0 0.0 3. 8 86.5
Total consolidation & special effects 307.7 25.3 19.4 1 76.7 0.0 0.0 327.1 202.0
CorporationAutomotive Rubber Cons./Corr.
Preliminary FY 2015 Results – March 3, 2016EDMR – Equity and Debt Markets Relations 69
1 Before amortization of intangibles from PPA, changes in the scope of consolidation and special effects
Adjusted operating result (adj. EBIT) 1 1,679.3 2,066.1 2,293.8 2,544.0 -107.2 -154.6 3,865.9 4,455.5in % of adjusted sales 8.0% 8.8% 16.8% 17.6% 11.2% 11.8%
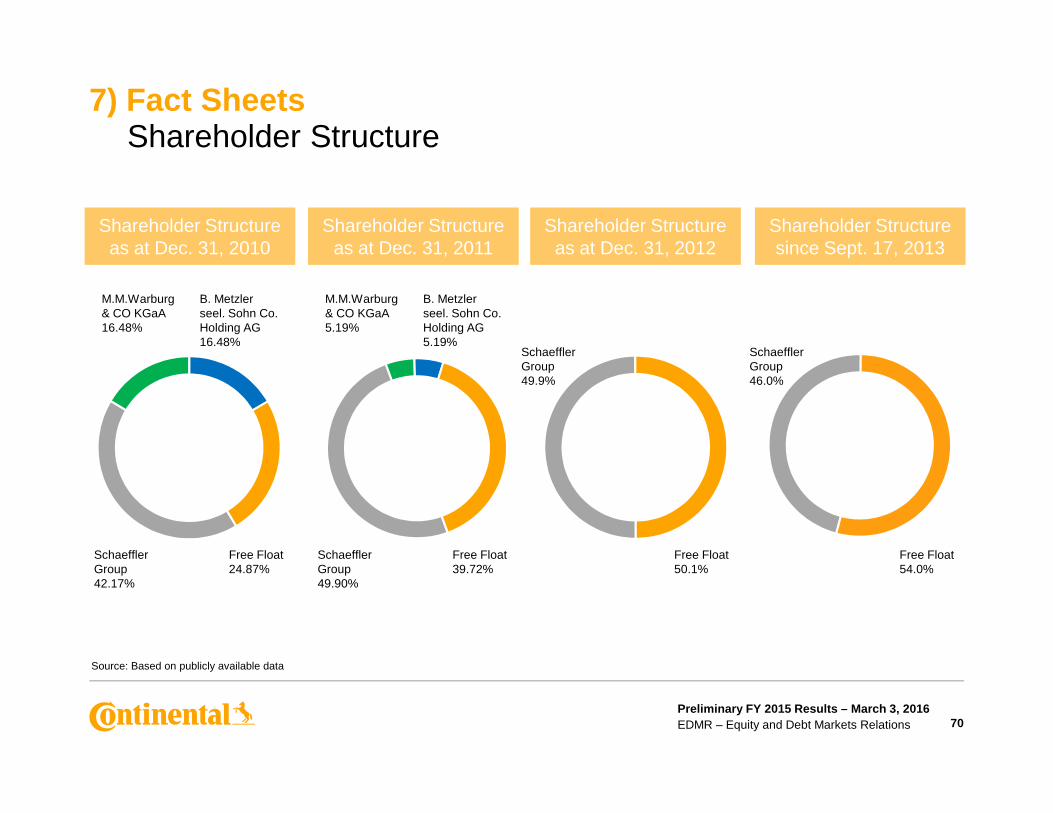
7) Fact SheetsShareholder Structure
Shareholder Structure as at Dec. 31, 2010
Shareholder Structure as at Dec. 31, 2011
Shareholder Structure as at Dec. 31, 2012
Shareholder Structure since Sept. 17, 2013
M.M.Warburg & CO KGaA16.48%
M.M.Warburg & CO KGaA5.19%
B. Metzler seel. Sohn Co. Holding AG16.48%
B. Metzler seel. Sohn Co. Holding AG5.19%
Schaeffler Group49.9%
Schaeffler Group46.0%
Preliminary FY 2015 Results – March 3, 2016EDMR – Equity and Debt Markets Relations 70
Source: Based on publicly available data
Schaeffler Group42.17%
Schaeffler Group49.90%
Free Float39.72%
Free Float50.1%
Free Float54.0%
Free Float24.87%

7) Fact SheetsContinental’s Credit Rating
BBB+ / Baa1
BBB / Baa2
BBB- / Baa3
BB+ / Ba1
S&P, Fitch / Moody’sStandard & Poor’s1 Moody’s 2 Fitch 3
Inve
stm
ent
Gra
de
Preliminary FY 2015 Results – March 3, 2016EDMR – Equity and Debt Markets Relations 71
2000 2001 2002 2003 2004 2005 2006 2007 2008 2009 2010 2011 2012 2013 2014 2015
BB+ / Ba1
BB / Ba2
BB- / Ba3
B+ / B1
B / B2
Before Siemens
VDO
Non
-Inv
estm
ent
Gra
de
1 Contracted rating since May 19, 20002 Non-contracted rating since February 1, 20143 Contracted rating since November 7, 2013

ReferencesUseful Links
Continental Investor Relations website http://www.continental-ir.com
Annual and interim reports http://www.continental-corporation.com/www/portal_com_en/themes/ir/financial_reports/
2015 Fact Book http://www.continental-corporation.com/www/portal_com_en/themes/ir/financial_reports/
Investor Relationsevents and presentations
http://www.continental-corporation.com/www/portal_com_en/themes/ir/events/
Sustainability at Continental (presentation and fact sheet for
http://www.continental-ir.com
Preliminary FY 2015 Results – March 3, 2016EDMR – Equity and Debt Markets Relations 72
(presentation and fact sheet for investors)
Corporate Social Responsibility http://www.continental-sustainability.com
Corporate Governance Principles http://www.continental-corporation.com/www/portal_com_en/themes/ir/corporate_governance/
Continental share http://www.continental-corporation.com/www/portal_com_en/themes/ir/share/
Continental bonds and rating http://www.continental-corporation.com/www/portal_com_en/themes/ir/bonds/
Continental IR mobile website http://continental.ir-portal.de