preliminary final report for personal use only
TRANSCRIPT

Appendix 4E
Preliminary Final Report Under ASX Listing Rule 4.3A
Name of Entity MOSAIC BRANDS LIMITED
ABN 96 003 321 579
Financial Year Ended 28 JUNE 2020
Previous Corresponding Reporting Period 30 JUNE 2019
RESULTS FOR ANNOUNCEMENT TO MARKET
$000 Percentage decrease over previous corresponding
period
Revenue from ordinary activities $736,777 16.5%
Loss from ordinary activities after income attributable to members ($170,485) 2,197.0%
Net loss attributable to the members of Mosaic Brands Limited ($170,362) 2,187.5%
Dividends (distributions) Amount per security Franked amount per security
Final Dividend Nil Nil
Previous corresponding period 5.5 cents 100%
Due to the impact and uncertainty caused by the ongoing COVID-19 pandemic the Board of Directors have decided not to declare a final dividend for the period ended 28 June 2020.
Brief explanation of any of the figures reported above necessary to enable the figures to be understood: Mosaic Brands Limited operates within the women’s fashion and retail sector in Australia and New Zealand. During the 2020 financial year, the Group comprised of the Noni B, Millers, W.Lane brands (“Classic” brands) as well as Rockmans, Katies, Crossroads, Autograph, beme brands (“Contemporary” brands) and Rivers. The store portfolio on a like for like basis ended the year at 1,333 (2019: 1,379). On 23 December 2019 the Group acquired 50.1% with an option to acquire the remaining 49.9% share of EziBuy which is a multi-channel retailing business that operates predominately in New Zealand and Australia. It was acquired to increase the Group’s online revenue share by gaining access to the customer portfolio which includes a high customer loyalty base.
Refer to the financial statements attached for:
- Statement of profit or loss and other comprehensive income together with notes
- Statement of financial position together with notes
- Statement of changes in equity together with notes
- Statement of cash flows together with notes
For
per
sona
l use
onl
y

DETAILS RELATING TO DIVIDENDS
Date the dividend is payable Not Applicable
Record date to determine entitlement to the dividend Not Applicable
Amount per security Not Applicable
Amount per security of foreign sourced dividend or distribution
Not Applicable
Details of any dividend reinvestment plans in operation
Not Applicable
The last date for receipt of an election notice for participation in any dividend reinvestment plans
Not Applicable
NET TANGIBLE ASSETS PER SHARE
Current Period
Previous corresponding
period
Net tangible asset backing per ordinary security (336.0) (cents) (32.1) (cents)
Other Significant Information Needed by an Investor to Make an Informed Assessment of the Entity’s Financial Performance and Financial Position
Refer to the financial statements attached.
COMMENTRY ON THE RESULTS FOR THE PERIOD
The earnings per security and the nature of any dilution aspects:
Refer to the financial statements attached.
Returns to shareholders including distributions and buy backs:
Not Applicable
Significant features of operating performance:
Refer ASX press announcement.
Discussion of trends in performance:
Refer to the financial statements attached.
Any other factor which has affected the results in the period or which are likely to affect results in the future, including those where the effect could not be quantified:
Refer ASX press announcement.
For
per
sona
l use
onl
y

Details of control gained over entities:
Name of entity: New EziBuy Limited Date control gained: 28 October 2019 Contribution of such entity to the reporting entity’s profit/(loss) from ordinary activities before income tax during the period: ($6,596,000) Profit/(loss) from ordinary activities before income tax of the controlled entity (or group of entities) for the whole of the previous period: Not Applicable
QUALIFICATION OF AUDIT / REVIEW
This report is based on accounts to which one of the following applies:
(Tick one)
The accounts have been audited
The accounts are in the process of being audited or subject to review
The accounts have been subject to review
The accounts have not yet been audited or reviewed
If the accounts have not yet been audited or subject to review and are likely to be subject to dispute or qualification, a description of the likely dispute or qualification:
Not Applicable
If the accounts have been audited or subject to review and are subject to dispute or qualification, a description of the dispute or qualification:
The financial report has been audited. The audit report is not modified but includes an emphasis of matter regarding material uncertainty related to going concern
ATTACHMENTS FORMING PART OF APPENDIX 4E
Attachment # Details
1 Financial Statements
Signed By Company Secretary:
Chief Financial Officer Luke Softa
Date 25 August 2020
For
per
sona
l use
onl
y
1
(formerly Noni B Limited)
ABN 96 003 321 579
Financial Report 28 June 2020
For
per
sona
l use
onl
y
2
Corporate Directory
DIRECTORS Richard Facioni Scott Evans David Wilshire Sue Morphet Jacqueline Frank
COMPANY SECRETARY Luke Softa
NOTICE OF ANNUAL GENERAL MEETING Details of the Annual General Meeting of Mosaic Brands: Virtual Annual General Meeting Details: TBC Time: 11:00am Date: Thursday 29th October 2020
REGISTERED OFFICE Mosaic Brands Limited Ground Floor, 61 Dunning Avenue Rosebery NSW 2018 Telephone: (02) 8577 7777 Facsimile: (02) 8577 7887 ABN: 96 003 321 579
SHARE REGISTER Computershare Registry Services Pty Limited Level 5, 115 Grenfell Street Adelaide SA 5000 Telephone: 1300 556 161
AUDITOR BDO Audit Pty Limited 1 Margaret Street Sydney NSW 2000
BANKERS ANZ 242 Pitt Street Sydney NSW 2000
STOCK EXCHANGE LISTING Mosaic Brands Limited shares are listed on the Australian Securities Exchange ASX Code: MOZ
WEBSITE www.mosaicbrandslimited.com.au
CORPORATE GOVERNANCE STATEMENT
www.mosaicbrandslimited.com.au
For
per
sona
l use
onl
y

Directors’ Report
3
The Directors present their report, together with the financial statements, on the Consolidated Entity consisting of Mosaic Brands Limited and the entities it controlled at the end of, or during, the year ended 28 June 2020. GENERAL INFORMATION DIRECTORS The following persons were Directors of Mosaic Brands Limited during the financial year and up to the date of this report, unless otherwise stated: Richard Facioni Non-Executive Director Scott Evans Chief Executive Officer and Managing Director David Wilshire Non-Executive Director Sue Morphet Non-Executive Director Jacqueline Frank Non-Executive Director PRINCIPAL ACTIVITIES The principal activities of the Consolidated Entity constituted by the Company and the entities it controlled during the financial year were the retailing of women’s apparel and accessories. On 23 December 2019 the Group acquired 50.1% with an option to acquire the remaining 49.9% share of New EziBuy Limited (EziBuy) with an effective date of 28 October 2019. EziBuy is one of the largest multi-channel retailers in Australia and New Zealand, generating approximately 80% of its revenue through its digital platform. It houses expertise in digital and catalogue retailing which the Group will leverage across the broader portfolio. DIVIDENDS PAID, DECLARED OR RECOMMENDED During the financial year ended 28 June 2020, the Mosaic Brands Board announced a final dividend of 5.5 cents on 27 August 2019 which was made payable to shareholders on 24 October 2019. Following this there were no further dividends declared or paid throughout or since the end of the financial year. SIGNIFICANT CHANGES IN THE STATE OF AFFAIRS On 23 December 2019, Mosaic Brands Limited acquired 50.1% with an option to acquire the remaining 49.9% of the ordinary shares of New EziBuy Limited (EziBuy) from its substantial shareholder Alceon Retail for the total consideration of $1 effective from 28 October 2019. The purchase includes a call and put option to either acquire the remaining 49.9% equity interest on or prior to 31 December 2020 for a consideration of $11,000,000 or return the current shareholding to Alceon Retail. EziBuy is a multi-channel retailing business which operates predominately in New Zealand and also Australia. It was acquired to increase the Group’s online revenue share by gaining access to the customer portfolio which includes a high customer loyalty base. During the 2020 financial year the Group was impacted by the global COVID-19 pandemic which resulted in operational changes in order to manage the effect on the Group and its environment. As a result, for safety reasons the Group shutdown all of its stores from end March to June. There were no other significant changes in the state of affairs of the Group during the financial year. MATTERS SUBSEQUENT TO THE END OF THE FINANCIAL YEAR The impact of the Coronavirus (COVID-19) pandemic is ongoing and as such it is not practicable to estimate the potential impact, positive or negative, after the reporting date. The situation is rapidly developing and is dependent on measures imposed by the Australian Government and other countries, such as maintaining social distancing requirements, quarantine, travel restrictions and any economic stimulus that may be provided. In the interests of the health and safety of its customers and store teams, Mosaic Brands Limited closed all stores within Victoria temporarily. In response to the state Government’s imposition of stage 3 and 4 restrictions, the Group closed 25 stores on 1 July with an additional 135 stores on 8 July with the balance 89 regional stores closed on 5 August. All stores will remain closed until restrictions are reduced.
Mosaic Brands announced on 20 August temporary closure of 129 stores in the Westfield centres. The financial contribution of these stores are not of a material nature with most impacted team members being redeployed to other locations. Apart from the above, no other matter or circumstances has arisen since 28 June 2020 that has significantly affected, or may significantly affect the Groups operations, the results of those operations, or the state of affairs in future financial years. LIKELY FUTURE DEVELOPMENTS AND EXPECTED RESULTS The likely developments in the operations of the Group and the expected results of those operations in financial years subsequent to the year ended 28 June 2020 is included in the operational and financial highlights section of this report. No additional information is included on the likely developments in the operations of the Group and the expected results of those operations as the Directors reasonably believe that the disclosure of such information would be likely to result in unreasonable prejudice to the economic entity if included in this report, and it has therefore been excluded in accordance with section 299(3) of the Corporations Act 2001. ENVIRONMENTAL REGULATION The Group’s operations are not subject to any significant environmental obligations or regulations under Australian Commonwealth or State Law.
For
per
sona
l use
onl
y
Directors’ Report (continued))
4
OPERATING AND FINANCIAL REVIEW
Review of operations
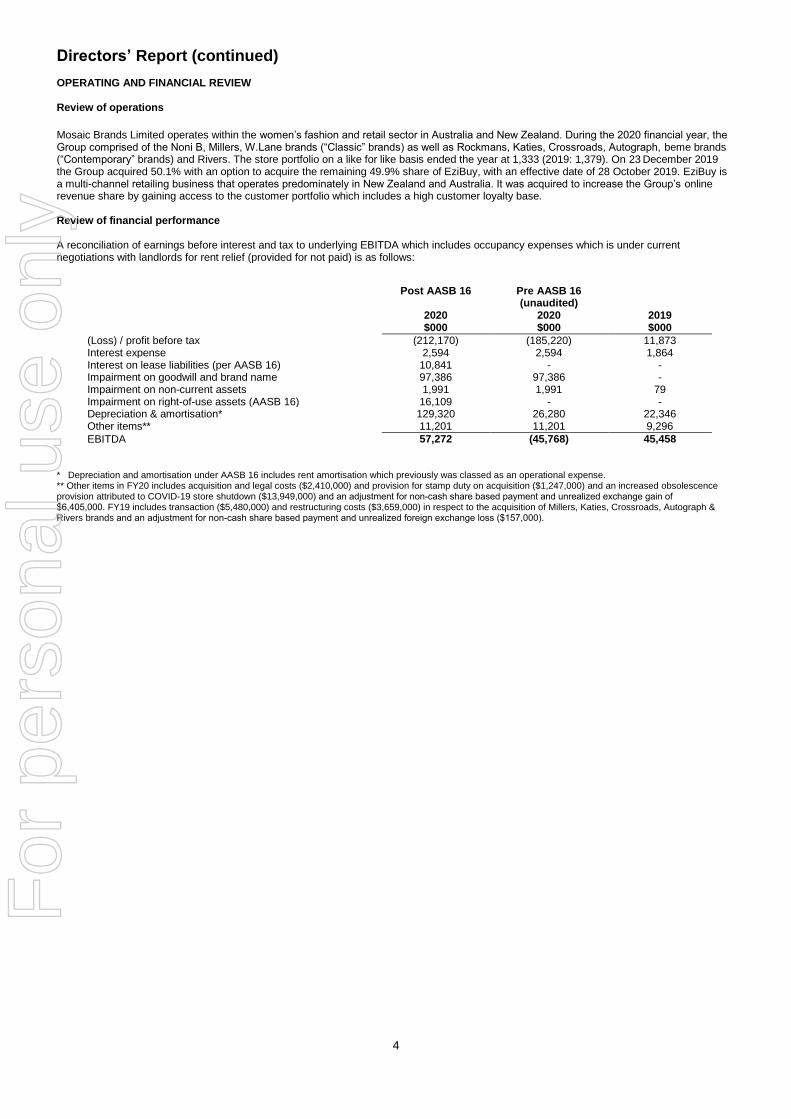
Mosaic Brands Limited operates within the women’s fashion and retail sector in Australia and New Zealand. During the 2020 financial year, the Group comprised of the Noni B, Millers, W.Lane brands (“Classic” brands) as well as Rockmans, Katies, Crossroads, Autograph, beme brands (“Contemporary” brands) and Rivers. The store portfolio on a like for like basis ended the year at 1,333 (2019: 1,379). On 23 December 2019 the Group acquired 50.1% with an option to acquire the remaining 49.9% share of EziBuy, with an effective date of 28 October 2019. EziBuy is a multi-channel retailing business that operates predominately in New Zealand and Australia. It was acquired to increase the Group’s online revenue share by gaining access to the customer portfolio which includes a high customer loyalty base.
Review of financial performance
A reconciliation of earnings before interest and tax to underlying EBITDA which includes occupancy expenses which is under current negotiations with landlords for rent relief (provided for not paid) is as follows:
Post AASB 16 Pre AASB 16 (unaudited)
2020 2020 2019 $000 $000 $000
(Loss) / profit before tax (212,170) (185,220) 11,873 Interest expense 2,594 2,594 1,864 Interest on lease liabilities (per AASB 16) 10,841 - - Impairment on goodwill and brand name 97,386 97,386 - Impairment on non-current assets 1,991 1,991 79 Impairment on right-of-use assets (AASB 16) 16,109 - - Depreciation & amortisation* 129,320 26,280 22,346 Other items** 11,201 11,201 9,296
EBITDA 57,272 (45,768) 45,458
* Depreciation and amortisation under AASB 16 includes rent amortisation which previously was classed as an operational expense.** Other items in FY20 includes acquisition and legal costs ($2,410,000) and provision for stamp duty on acquisition ($1,247,000) and an increased obsolescence provision attributed to COVID-19 store shutdown ($13,949,000) and an adjustment for non-cash share based payment and unrealized exchange gain of $6,405,000. FY19 includes transaction ($5,480,000) and restructuring costs ($3,659,000) in respect to the acquisition of Millers, Katies, Crossroads, Autograph & Rivers brands and an adjustment for non-cash share based payment and unrealized foreign exchange loss ($157,000).
For
per
sona
l use
onl
y
Directors’ Report (continued))
5
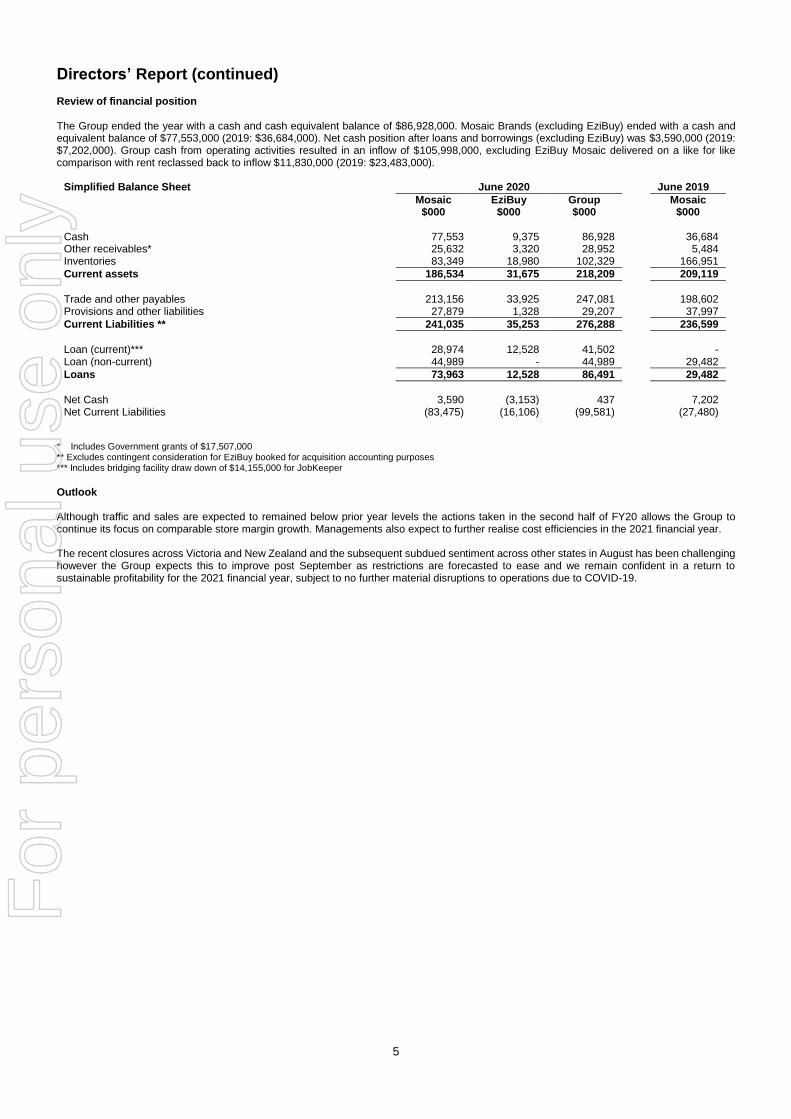
Review of financial position The Group ended the year with a cash and cash equivalent balance of $86,928,000. Mosaic Brands (excluding EziBuy) ended with a cash and equivalent balance of $77,553,000 (2019: $36,684,000). Net cash position after loans and borrowings (excluding EziBuy) was $3,590,000 (2019: $7,202,000). Group cash from operating activities resulted in an inflow of $105,998,000, excluding EziBuy Mosaic delivered on a like for like comparison with rent reclassed back to inflow $11,830,000 (2019: $23,483,000).
Simplified Balance Sheet June 2020 June 2019
Mosaic EziBuy Group Mosaic $000 $000 $000 $000 Cash 77,553 9,375 86,928 36,684 Other receivables* 25,632 3,320 28,952 5,484 Inventories 83,349 18,980 102,329 166,951
Current assets 186,534 31,675 218,209 209,119
Trade and other payables 213,156 33,925 247,081 198,602 Provisions and other liabilities 27,879 1,328 29,207 37,997
Current Liabilities ** 241,035 35,253 276,288 236,599
Loan (current)*** 28,974 12,528 41,502 - Loan (non-current) 44,989 - 44,989 29,482
Loans 73,963 12,528 86,491 29,482
Net Cash 3,590 (3,153) 437 7,202 Net Current Liabilities (83,475) (16,106) (99,581) (27,480)
* Includes Government grants of $17,507,000 ** Excludes contingent consideration for EziBuy booked for acquisition accounting purposes *** Includes bridging facility draw down of $14,155,000 for JobKeeper
Outlook Although traffic and sales are expected to remained below prior year levels the actions taken in the second half of FY20 allows the Group to continue its focus on comparable store margin growth. Managements also expect to further realise cost efficiencies in the 2021 financial year. The recent closures across Victoria and New Zealand and the subsequent subdued sentiment across other states in August has been challenging however the Group expects this to improve post September as restrictions are forecasted to ease and we remain confident in a return to sustainable profitability for the 2021 financial year, subject to no further material disruptions to operations due to COVID-19.
For
per
sona
l use
onl
y
Directors’ Report (continued))
6
DIRECTORS QUALIFICATIONS, EXPERIENCE AND OTHER RESPONSIBILITIES The details of the Company Directors in office until the date of this report are as follows: Richard Facioni Chairman, Non-Executive Director Joined the Board in November 2014 Background: Richard is an experienced corporate finance and investment professional, with over 25 years’ experience in investment banking, mergers and acquisitions, corporate advice, restructurings and principal investment. Richard leads the private equity practice of Alceon Group and represents Alceon’s investment in Mosaic Brands. He also oversees and is a Director of Alceon’s other retail investments in Alquemie Group and Cheap as Chips Discount Stores. Prior to Alceon, Richard was a Managing Director of Silverfern Group, a global private equity origination and co-investment firm, where he co-led the group’s activities in Australasia. He previously spent 15 years with Macquarie Group where he held a number of roles including Head of Acquisition Finance and Head of Principal Transactions Group, and was a co-founder of Shearwater Capital Group, a private credit opportunities investment firm. Qualifications: Bachelor of Engineering (Honours I) from the University of Sydney; Master of Business Administration from the Wharton School at the University of Pennsylvania; Graduate Member of the Australian Institute of Company Directors; Fellow of the Financial Services Institute of Australasia (FINSIA) Special responsibilities: Chair of the Remuneration and Nomination Committee and member of the Audit and Risk Committee Scott Evans Chief Executive Officer, Managing Director
Joined the Board in November 2014
Background: Scott has over 20 years’ experience in international retailing leading both private and public companies. Scott started in the United Kingdom with Marks & Spencer before transitioning to Managing Director of Greenwoods Menswear (150 store chain) where Scott orchestrated the sale of the business to Chinese brand Bosideng. Scott moved to Australia and joined Specialty Fashion Group leading both Millers (largest ladies specialty business in the country with a 400 store chain) and Crossroads (150 store chain). Scott then transitioned to the role of CEO at Bras N Things under the BBRC Group before taking on the opportunity at Mosaic Brands in November 2014. Qualifications: Scott holds a BTEC National Diploma in Business and Finance David Wilshire Non-Executive Director
Joined the Board in November 2014
Background: David has over 20 years’ experience in mergers and acquisitions, capital markets and principal investment. He is also a Director of Alceon’s other retail investments in Alquemie Group and Cheap as Chips Discount Stores. Prior to Alceon, David held roles within the corporate finance group of Babcock & Brown and the investment banking divisions of Goldman Sachs and Macquarie Group, where he helped numerous leading Australian and international companies across a broad range of industries with acquisitions, divestments and capital market transactions, as well as strategic advice. Qualifications: David holds a Bachelor of Commerce from the Monash University; Member of the Australian Institute of Company Directors. Special responsibilities: Member of the Remuneration and Nomination Committee and Audit and Risk Committee Sue Morphet Non-Executive Director Joined the Board in February 2015
Background: Sue Morphet has over 30 years of brand management and retail experience across Australia and New Zealand. Sue is currently a Non-Executive Director of Asaleo Care Ltd (since 2014), Non-Executive Director of Arnott’s Biscuits Limited (since 2020), President of Chief Executive Women. Sue was previously CEO of Pacific Brands Limited (2007 – 2012) having worked in the organisation for 12 years, most notably as Group General Manager of Bonds. Other prior roles include Chairperson of Manufacturing Australia (2013 – 2015), Non-Executive Director at Fisher & Paykel Appliances Ltd (2014 – 2018), Non-Executive Director of Godfreys Group Limited (2014 – 2018) and Chairperson of National Tiles Pty Ltd. (2015 - 2020)
Qualifications: Sue holds a Bachelor of Science and Education, University of Melbourne; Scholar, Mt Eliza Business School
Special responsibilities: Member of the Remuneration and Nomination Committee and Chair of the Audit and Risk Committee
For
per
sona
l use
onl
y

Directors’ Report (continued))
7
DIRECTORS QUALIFICATIONS, EXPERIENCE AND OTHER RESPONSIBILITIES (continued) Jacqueline Frank Non-Executive Director Joined the Board in May 2019
Background: Jackie is one of Australia’s most successful and highly regarded media executives with over 30 years’ experience in publishing, management and marketing, brand innovation and retail consulting. From 2014 to 2018, Jackie was General Manager of the health, fashion, beauty and lifestyle group at Pacific Magazines and successfully led the brand’s multi-platform transformation, and new online-only brand launches. In 2018, Jackie started her own company, Be Frank Group, helping brands engage with the female economy and to date has consulted to Hearst US, Bumble Australia, SEED Heritage, SCCI, Westfield, EziBuy, French Connection, Sapphire Group and McCann Agency Australia. Special responsibilities: Member of the Remuneration and Nomination Committee COMPANY SECRETARY Luke Softa Chief Financial Officer, Company Secretary Joined the Board in March 2015
Background: Luke has over 15 years’ experience as a Chief Financial Officer within the Asian, American and Australian markets. Luke has spent 18 years in the service industry and held a number of roles within the Millward Brown Group, including regional Chief Financial Officer for Africa Asia Pacific, before transitioning to Michael Page International as their Asia Pacific Chief Financial Officer. Luke then moved into the retail industry as the Chief Financial Officer at Bras N Things before taking on the opportunity at Noni B in March 2015.
Qualifications: Luke holds a Bachelor of Commerce, Graduate Member of the Australian Institute of Company Directors and is a Fellow Certified Practising Accountant
Special responsibilities: Secretary to the Remuneration and Nomination Committee and Audit and Risk Committee
MEETINGS OF DIRECTORS The number of meetings of the Company's Board of Directors (‘the Board’) held during the year ended 28 June 2020, and the number of meetings attended by each Director were:
Board Meeting Audit and risk management
committee
Remuneration and nomination committee
Held Attended Held Attended Held Attended
Richard Facioni 18 18 3 3 3 3 Scott Evans 18 18 - - - - David Wilshire 18 17 3 3 3 3 Sue Morphet 18 18 3 3 3 3 Jacqueline Frank 18 18 - - 3 3 Held: Represents the number of meetings held during the time the Directors held office.
INDEPENDENT DIRECTORS The Directors considered by the Board to be independent are Sue Morphet and Jacqueline Frank. In determining whether a Non-Executive Director is considered by the Board to be independent, the following relationships affecting independence will be taken into account:
(1) whether the Director is a substantial shareholder of the Group or an officer of, or otherwise associated directly with a substantial shareholder of the Group (as defined in section 9 of the Corporations Act);
(2) whether the Director is employed or has been employed in an Executive capacity by the Group or another group member and there has not been a period of at least three years between ceasing such employment and serving on the Board;
(3) whether the Director is or has been a principal of a material professional adviser or a material consultant to the Group or another group member, or an employee materially associated with the service provided;
(4) whether the Director is or has been employed by, or a partner in, any firm that has been the Group’s external auditors; (5) whether the Director is a material supplier or customer of the Group or any other group member, or an officer of or otherwise associated,
directly or indirectly, with a material supplier or customer; (6) whether the Director has a material contractual relationship with the Group or another group member other than as a Director of the
Group; and, (7) whether the Director is free from any interest and any business or other relationship which could materially interfere with the Director’s
ability to act in the best interests of the Group.
For
per
sona
l use
onl
y

Directors’ Report (continued))
8
REMUNERATION REPORT [AUDITED] The remuneration report, which has been audited as required by section 308 (3C) of the Corporations Act 2001, outlines the key management personnel remuneration arrangements for the Group, in accordance with the requirements of the Corporations Act 2001 and its Regulations. The Directors (Executive and Non-Executive) and the Senior Executives received the amounts set out in the table of benefits and payments and explained in this section of the report as compensation for their services as Directors and/or Executives of the Group during the financial year ended 28 June 2020. Specific matters included in this Report are set out below under separate headings, as follows:
1. Details of remuneration
2. Remuneration policy
3. Service Agreements
4. Additional information 1. DETAILS OF REMUNERATION Key Management Personnel Key management personnel are those persons having authority and responsibility for planning, directing and controlling the activities of the Group, directly or indirectly, including all Directors. The key management personnel of the Group consisted of the following Directors of Mosaic Brands Limited and Chief Executive Officer of EziBuy: Richard Facioni Chairman Scott Evans Chief Executive Officer and Managing Director David Wilshire Non-Executive Director Sue Morphet Non-Executive Director Jacqueline Frank Non-Executive Director And the following Senior Executives: Luke Softa Chief Financial Officer and Company Secretary Stephen Gosney Chief Executive Officer of EziBuy
For
per
sona
l use
onl
y
Directors’ Report (continued))
9
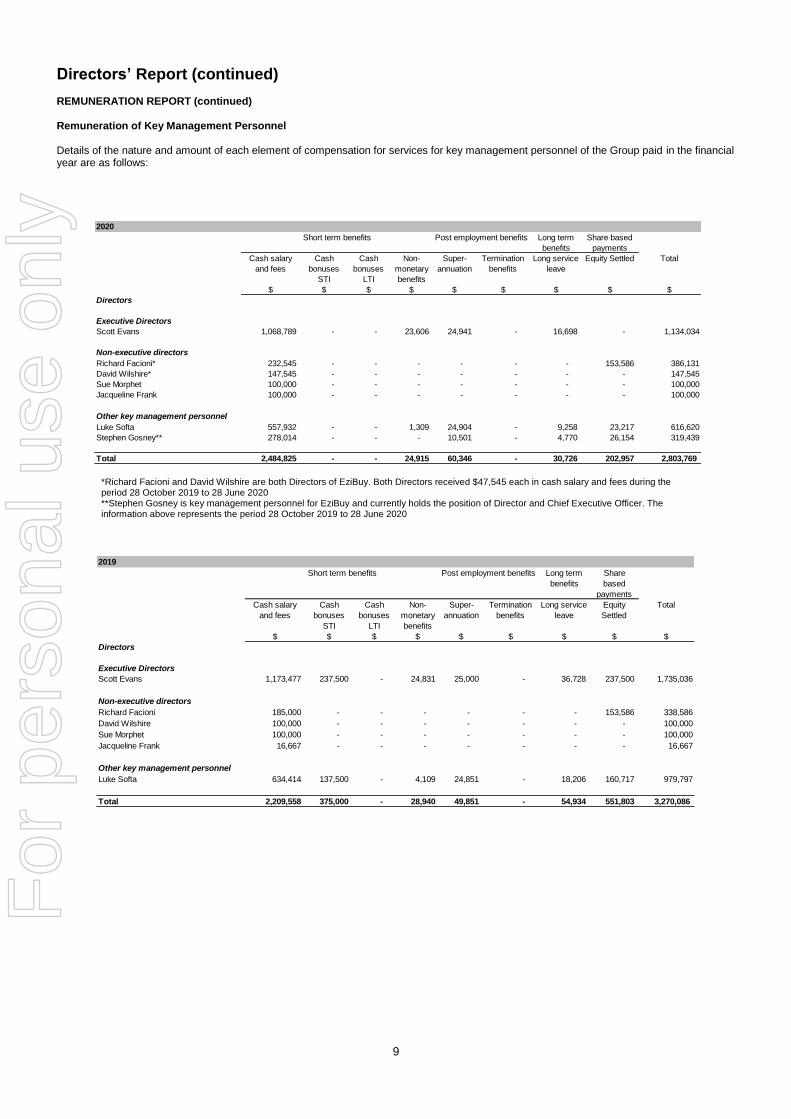
REMUNERATION REPORT (continued) Remuneration of Key Management Personnel Details of the nature and amount of each element of compensation for services for key management personnel of the Group paid in the financial year are as follows:
*Richard Facioni and David Wilshire are both Directors of EziBuy. Both Directors received $47,545 each in cash salary and fees during the period 28 October 2019 to 28 June 2020 **Stephen Gosney is key management personnel for EziBuy and currently holds the position of Director and Chief Executive Officer. The information above represents the period 28 October 2019 to 28 June 2020
2020
Long term
benefits
Share based
payments
Cash salary
and fees
Cash
bonuses
STI
Cash
bonuses
LTI
Non-
monetary
benefits
Super-
annuation
Termination
benefits
Long service
leave
Equity Settled Total
$ $ $ $ $ $ $ $ $
Directors
Executive Directors
Scott Evans 1,068,789 - - 23,606 24,941 - 16,698 - 1,134,034
Non-executive directors
Richard Facioni* 232,545 - - - - - - 153,586 386,131
David Wilshire* 147,545 - - - - - - - 147,545
Sue Morphet 100,000 - - - - - - - 100,000
Jacqueline Frank 100,000 - - - - - - - 100,000
Luke Softa 557,932 - - 1,309 24,904 - 9,258 23,217 616,620
Stephen Gosney** 278,014 - - - 10,501 - 4,770 26,154 319,439
Total 2,484,825 - - 24,915 60,346 - 30,726 202,957 2,803,769
Short term benefits Post employment benefits
Other key management personnel
2019
Long term
benefits
Share
based
payments
Cash salary
and fees
Cash
bonuses
STI
Cash
bonuses
LTI
Non-
monetary
benefits
Super-
annuation
Termination
benefits
Long service
leave
Equity
Settled
Total
$ $ $ $ $ $ $ $ $
Directors
Executive Directors
Scott Evans 1,173,477 237,500 - 24,831 25,000 - 36,728 237,500 1,735,036
Non-executive directors
Richard Facioni 185,000 - - - - - - 153,586 338,586
David Wilshire 100,000 - - - - - - - 100,000
Sue Morphet 100,000 - - - - - - - 100,000
Jacqueline Frank 16,667 - - - - - - - 16,667
Luke Softa 634,414 137,500 - 4,109 24,851 - 18,206 160,717 979,797
Total 2,209,558 375,000 - 28,940 49,851 - 54,934 551,803 3,270,086
Short term benefits Post employment benefits
Other key management personnel
For
per
sona
l use
onl
y
Directors’ Report (continued))
10
REMUNERATION REPORT (continued) 2. REMUNERATION POLICY Non-Executive Directors Non-Executive Director remuneration is set by the Board’s Remuneration and Nomination Committee and is subject to shareholder approval as detailed below based on independent external advice with regard to market practice, relativities, and Director duties and accountability. Company policy is designed to attract and retain competent and suitably qualified Non-Executive Directors, to motivate these Non-Executive Directors to achieve Mosaic Brand’s long term strategic objectives and to protect the long term interests of shareholders. Fee Pool Non-Executive Directors’ fees are set by resolution of shareholders at the annual general meeting. It is currently set at $750,000 per annum in aggregate. The remuneration does not include any participation by Independent Directors in Company Share schemes which is separately approved by the Board and ratified by shareholders at the annual general meeting. Fees The Non-Executive Directors’ base fee is set at $100,000 per annum and the Chairman’s fee is set at $185,000 per annum. During the financial year ended 28 June 2020 the Group held a total of 24 formal meetings, including committee, Board and shareholder meetings. Equity participation Non-Executive Directors may receive rights, options or shares as part of their remuneration, subject only to shareholder approval. As referenced below, no rights, options or shares have been issued to any of the Non-Executive Directors during the financial year. Retiring Allowance No retiring allowances are paid to Non-Executive Directors. Superannuation Mosaic Brand’s pays management fees to the related party of the Non-Executive Directors (note 26). Therefore, no contribution is made to their respective superannuation fund. Executive Directors and Senior Executives Mosaic Brand’s overall Group remuneration policy is set by the Board’s Remuneration and Nomination Committee. The policy is reviewed on a regular basis to ensure it remains contemporary and competitive. For the specified Executives, the policy is intended to be consistent with the remuneration recommendations and guidelines set down in Principle 8 of the Australian Security Exchange’s “best practice” corporate governance guidelines. Broadly, Mosaic Brand’s policy is intended to ensure:
for each role, that the balance between fixed and variable (performance) components is appropriate having regard to both internal and external factors;
that individual set objectives will result in sustainable beneficial outcomes;
that all performance remuneration components are appropriately linked to measurable personal, business unit or Group performance; and
that total remuneration (that is the sum of fixed plus variable components of the remuneration) for each Executive is fair, reasonable and market competitive.
Mosaic Brand’s achievement of these objectives is checked on a regular basis using independent external remuneration consultants. Components of Executive remuneration Generally, Mosaic Brand’s provides selected Senior Executives with three components of remuneration, as follows:
fixed remuneration is made up of basic salary, benefits, superannuation and other salary sacrifices. This is reflective of their roles, experience and level of responsibility and is reviewed annually against market data for comparable positions. Benefits may include car allowances;
short term incentives (STI) – paid in cash / options, directly earned upon the successful achievement of specific financial and operational targets. A portion of this STI may be provided in Mosaic Brand’s shares subject to service and/or performance conditions. All STI awards are based on performance measures which are set and reviewed by the Remuneration and Nomination Committee annually;
long term incentives (LTI) – provides selected and invited Senior Executives with the right to acquire shares, only where specific future service requirements and future financial and operational targets that improve shareholder returns have been exceeded. Performance measures are set and reviewed by the Remuneration and Nomination Committee annually.
The objective of the reward schemes (STI and LTI) is to both reinforce the key financial goals of the Group and to provide a common interest between management and shareholders.
For
per
sona
l use
onl
y

Directors’ Report (continued))
11
REMUNERATION REPORT (continued) The fair value at grant date of share plan and performance share rights are independently determined using a Binomial Approximation Option Valuation Model and the Black Scholes Valuation Model that takes into account the exercise price, the term of the rights over shares, the share price at grant date and expected price volatility of the underlying share, the expected dividend yield and the risk free interest rate for the term of the rights over shares. Details of rights over ordinary shares in the Group provided as remuneration to each of the key management personnel of the Company and the Group are set out below. Offer for performance share rights Performance Share Rights These have a variety of market conditions (volume weighted average price) and non-market conditions being qualifying and non-qualifying leaver provisions. Richard Facioni
Grant date Expiry date Fair value at grant
date
Share price at
grant date
Exercise price
Volatility Risk free interest
rate
Number of rights
available
Number of rights vested
19/08/2016 18/08/2021 $ 0.47 $ 1.33 $ 1.25 35% 1.54% 1,200,000 940,000 19/08/2016 18/08/2021 $ 0.39 $ 1.33 $ 1.50 35% 1.54% 300,000 235,000 19/08/2016 18/08/2021 $ 0.32 $ 1.33 $ 1.75 35% 1.54% 300,000 235,000
Luke Softa
Grant date Expiry date Fair value at grant
date
Share price at
grant date
Exercise price
Volatility Risk free interest
rate
Number of rights
available
Number of rights vested
19/08/2016 18/08/2021 $ 0.47 $ 1.33 $ 1.25 35% 1.54% 250,000 195,833 Tranche 1 Performance Rights – these shares are issued to Scott Evans only
Grant date Expiry date Fair value at grant
date
Share price at
grant date
Exercise price
Volatility Risk free interest
rate
Number of rights
available
Number of rights vested
26/06/2015 01/07/2020 $ 0.36 $ 0.70 $ 0.51 43.8% 2.78% 882,479 882,479
Tranche 2 Performance Rights – these shares are issued to Scott Evans only
Grant date Expiry date Fair value at grant
date
Share price at
grant date
Exercise price
Volatility Risk free interest
rate
Number of rights
available
Number of rights vested
26/06/2015 01/07/2020 $ 0.37 $ 0.70 $ 0.51 43.8% 2.78% 882,479 882,479
The proportion of remuneration linked to performance and the fixed proportion are as follows:
Fixed Remuneration Short term incentive Long term incentive Name 2020 2019 2020 2019 2020 2019
Non-Executive Directors Richard Facioni 60% 55% - - 40% 45% David Wilshire 100% 100% - - - - Sue Morphet 100% 100% - - - - Jacqueline Frank 100% 100% - - - - Executive Directors Scott Evans 100% 72% - 14% - 14% Other key management personnel Luke Softa 96% 70% - 14% 4% 16% Stephen Gosney 92% - - - 8% -
The portion of the cash bonus paid/payable is as follows:
Name 2020 2019
Executive Directors Scott Evans - 100% Other key management personnel Luke Softa - 100% Stephen Gosney - -
For
per
sona
l use
onl
y

Directors’ Report (continued))
12
REMUNERATION REPORT (continued) 3. SERVICE AGREEMENTS Remuneration and other terms of employment for key management personnel are formalised in service agreements. Details of these agreements are as follows:
Name: Scott Evans Title: Chief Executive Officer Duration of agreement: Employment agreement for Chief Executive Officer operative until terminated by either party. Termination payment: Maximum payment to be made to Chief Executive Officer on termination is 3 months’. Total
Remuneration (being Total Fixed Remuneration plus Short Term Incentives, Long Term Incentives and benefits). To be paid in the following circumstances:
1) Redundancy; or
2) Fundamental Change. Notice of termination: On termination by Mosaic Brand or the Executive – 3 months’ notice.
Payment in lieu of notice can be made by Mosaic Brand in all circumstances, if Mosaic Brand chooses Restraint Conditions: Restraint period of 6 months
Name: Luke Softa Title: Chief Financial Officer and Company Secretary Duration of agreement: Employment agreement for Chief Financial Officer operative until terminated by either party. Termination payment: Maximum payment to be made to the Chief Financial Officer on termination is 3 months’. Total
Remuneration (being Total Fixed Remuneration plus Short Term Incentives, Long Term Incentives and benefits). To be paid in the following circumstances:
1) Redundancy; or
2) Fundamental Change.
Notice of termination: On termination by Mosaic Brand or the Executive – 3 months’ notice.
Payment in lieu of notice can be made by Mosaic Brand in all circumstances, if Mosaic Brand so chooses.
Restraint Conditions: Restraint period of 6 months
Name: Stephen Gosney Title: Chief Executive Officer (EziBuy) Duration of agreement: Employment agreement for Chief Executive Officer operative until terminated by either party. Termination payment: Maximum payment to be made to the Chief Executive Officer on termination is 3 months’. Total
Remuneration (being Total Fixed Remuneration plus Short Term Incentives, Long Term Incentives and benefits). To be paid in the following circumstances:
1) Redundancy; or
2) Fundamental Change.
Notice of termination: On termination by EziBuy or the Executive – 3 months’ notice.
Payment in lieu of notice can be made by EziBuy in all circumstances, if EziBuy so chooses.
Restraint Conditions: Restraint period of 6 months
For
per
sona
l use
onl
y
Directors’ Report (continued))
13
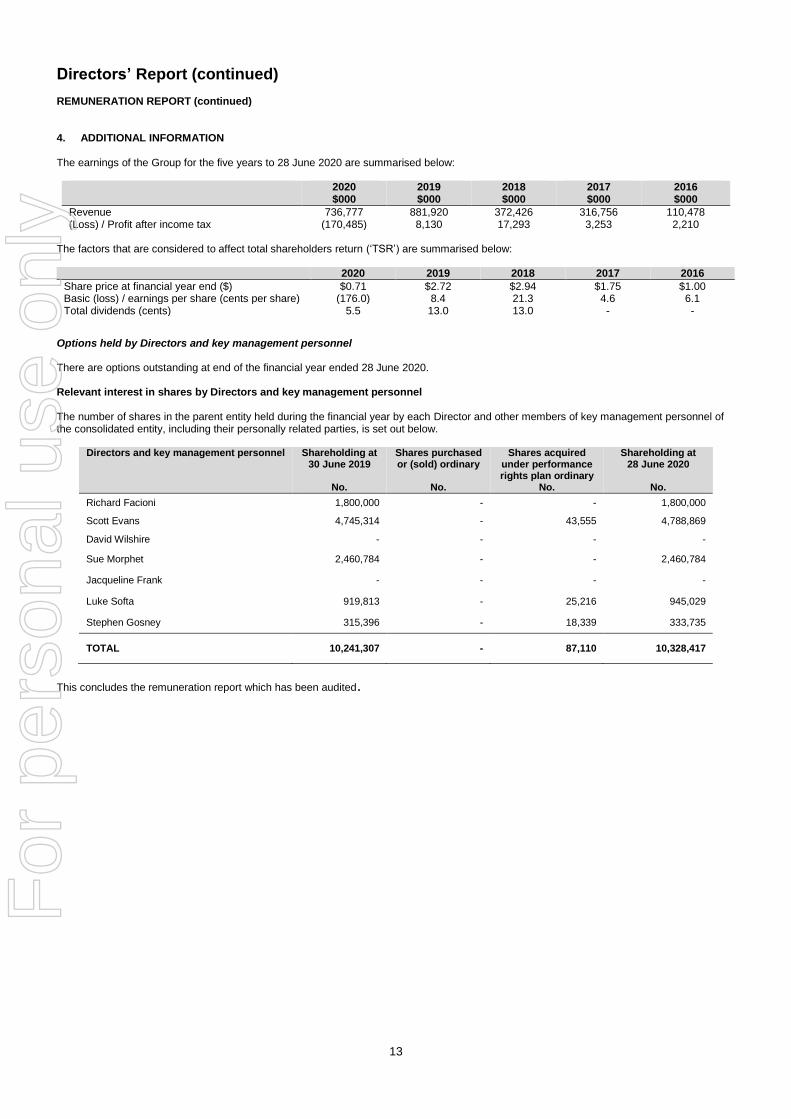
REMUNERATION REPORT (continued) 4. ADDITIONAL INFORMATION The earnings of the Group for the five years to 28 June 2020 are summarised below:
2020 2019 2018 2017 2016 $000 $000 $000 $000 $000
Revenue 736,777 881,920 372,426 316,756 110,478 (Loss) / Profit after income tax (170,485) 8,130 17,293 3,253 2,210
The factors that are considered to affect total shareholders return (‘TSR’) are summarised below:
2020 2019 2018 2017 2016
Share price at financial year end ($) $0.71 $2.72 $2.94 $1.75 $1.00 Basic (loss) / earnings per share (cents per share) (176.0) 8.4 21.3 4.6 6.1 Total dividends (cents) 5.5 13.0 13.0 - -
Options held by Directors and key management personnel There are options outstanding at end of the financial year ended 28 June 2020. Relevant interest in shares by Directors and key management personnel The number of shares in the parent entity held during the financial year by each Director and other members of key management personnel of the consolidated entity, including their personally related parties, is set out below.
Directors and key management personnel Shareholding at 30 June 2019
No.
Shares purchased or (sold) ordinary
No.
Shares acquired under performance rights plan ordinary
No.
Shareholding at 28 June 2020
No.
Richard Facioni 1,800,000 - - 1,800,000
Scott Evans 4,745,314 - 43,555 4,788,869
David Wilshire - - - -
Sue Morphet 2,460,784 - - 2,460,784
Jacqueline Frank - - - -
Luke Softa 919,813 - 25,216 945,029
Stephen Gosney 315,396 - 18,339 333,735
TOTAL 10,241,307 - 87,110 10,328,417
This concludes the remuneration report which has been audited.
For
per
sona
l use
onl
y

Directors’ Report (continued))
14
SHARES UNDER OPTION AND ISSUED ON THE EXERCISE OF OPTIONS Details of the shares issued under the exercise of options and unissued ordinary shares under option at the date of this report can be found in note 20 and 33 respectively. INDEMNITY AND INSURANCE OF DIRECTORS AND OFFICERS The Group has indemnified the Directors and Executives of the Group for costs incurred, in their capacity as a Director or Executive, for which they may be held personally liable, except where there is a lack of good faith. During the financial year, the Group paid a premium in respect of a contract to insure the Directors and Executives of the Group against a liability to the extent permitted by the Corporations Act 2001. The contract of insurance prohibits disclosure of the nature of the liability and the amount of the premium. INDEMNITY AND INSURANCE OF AUDITOR The Group has not, during or since the end of the financial year, indemnified or agreed to indemnify the auditor of the Group or any related entity against a liability incurred by the auditor. During the financial year, the Group has not paid a premium in respect of a contract to insure the auditor of the Group or any related entity. PROCEEDINGS ON BEHALF OF THE COMPANY No person has applied to the Court under section 237 of the Corporations Act 2001 for leave to bring proceedings on behalf of the Group, or to intervene in any proceedings to which the Group is a party for the purpose of taking responsibility on behalf of the Group for all or part of those proceedings. NON-AUDIT SERVICES
The details of amounts paid or payable to the auditor for non-audit services provided during the financial year by the auditor are outlined in note 25 to the financial statements. The Directors are satisfied that the provision of non-audit services during the financial year by the auditor is compatible with the general standard of independence for auditors imposed by the Corporations Act 2001. The Directors are of the opinion that the services as disclosed in note 25 to the financial statements do not compromise the external auditor’s independence requirements of the Corporations Act 2001 for the following reasons:
all non-audit services have been reviewed and approved to ensure that they do not impact the integrity and objectivity of the auditor, and
none of the services undermine the general principles relating to auditor independence as set out in APES 110 Code of Ethics for Professional Accountants issued by the Accounting Professional & Ethical Standards Board, including reviewing or auditing the auditors own work, acting in a management or decision-making capacity for the Group, acting as advocate for the Group or jointly sharing economic risks and rewards.
AUDITOR BDO continues in office in accordance with section 327 of the Corporations Act 2001. The BDO entity performing the audit of the Group transitioned from BDO East Coast Partnership to BDO Audit Pty Limited on 26 June 2020. AUDITOR’S INDEPENDENCE DECLARATION A copy of the auditor’s independence declaration as required under section 307C of the Corporations Act 2001 is set out immediately after this Director’s report. ROUNDING OF AMOUNTS The Company is of a kind referred to in Corporations Instrument 2016/191, issued by the Australian Securities and Investments Commission, relating to 'rounding-off'. Amounts in this report have been rounded off in accordance with that Corporations Instrument to the nearest thousand dollars, or in certain cases, the nearest dollar. This report is made in accordance with a resolution of Directors, pursuant to section 298(2) (a) of the Corporations Act 2001. On behalf of the Directors Richard Facioni Scott Evans Chairman Managing Director Sydney 25 August 2020
For
per
sona
l use
onl
y

Level 11, 1 Margaret St Sydney NSW 2000 Australia
Tel: +61 2 9251 4100 Fax: +61 2 9240 9821 www.bdo.com.au
BDO Audit Pty Ltd ABN 33 134 022 870 is a member of a national association of independent entities which are all members of BDO Australia Ltd ABN 77 050 110 275, an Australian company limited by guarantee. BDO Audit Pty Ltd and BDO Australia Ltd are members of BDO International Ltd, a UK company limited by guarantee, and form part of the international BDO network of independent member firms. Liability limited by a scheme approved under Professional Standards Legislation.
DECLARATION OF INDEPENDENCE BY GILLIAN SHEA TO THE DIRECTORS OF MOSAIC BRANDS LIMITED
As lead auditor of Mosaic Brands Limited for the year ended 28 June 2020, I declare that, to the best of
my knowledge and belief, there have been:
1. No contraventions of the auditor independence requirements of the Corporations Act 2001 in
relation to the audit; and
2. No contraventions of any applicable code of professional conduct in relation to the audit.
This declaration is in respect of Mosaic Brands Limited and the entities it controlled during the period.
Gillian Shea
Director
BDO Audit Pty Ltd
Sydney
25 August 2020
For
per
sona
l use
onl
y

16
The above consolidated statement of profit or loss and other comprehensive income should be read in conjunction with the accompanying notes ‘The Group has initially applied AASB 16 at 1 July 2019. Under the transition method chosen comparative information is not restated.
CONSOLIDATED STATEMENT OF PROFIT OR LOSS AND OTHER COMPREHENSIVE INCOME
FOR THE YEAR ENDED 28 JUNE 2020
2020 2019
Note $000 $000
Continuing operations
Revenue 3 713,580 864,493
Other income 3 23,197 17,427
Cost of goods sold (384,253) (382,783)
Expenses (excluding finance costs) 4 (450,216) (476,001)
Transaction and restructuring costs (3,657) (9,139)
Finance costs 4 (13,435) (2,124)
Impairment of brand names 12 (33,364) -
Impairment of goodwill 12 (64,022) -
(Loss) / profit before income tax (212,170) 11,873
Income tax benefit / (expense) 5 41,685 (3,743)
(Loss) / profit attributed to members of the parent entity (170,485) 8,130
Items that may be reclassified subsequently to profit or loss
Foreign currency translation 123 31
Other comprehensive income, net of tax 123 31
Total comprehensive income for the year attributed to members of the parent entity, net of tax
(170,362) 8,161
(Loss) / earnings per share
Basic (loss) / earnings per share (cents) 32 (176.0) 8.4
Diluted (loss) / earnings per share (cents) 32 (176.0) 8.4
For
per
sona
l use
onl
y
17
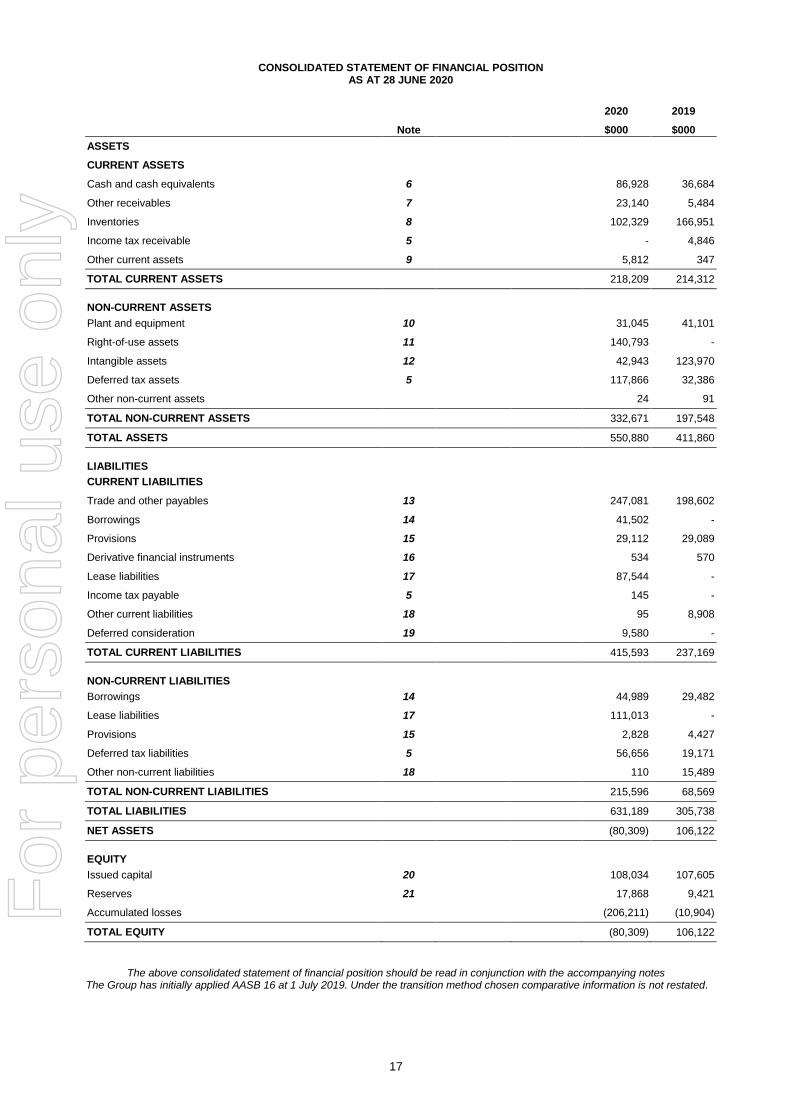
CONSOLIDATED STATEMENT OF FINANCIAL POSITION AS AT 28 JUNE 2020
2020 2019
Note $000 $000
ASSETS
CURRENT ASSETS
Cash and cash equivalents 6 86,928 36,684
Other receivables 7 23,140 5,484
Inventories 8 102,329 166,951
Income tax receivable 5 - 4,846
Other current assets 9 5,812 347
TOTAL CURRENT ASSETS 218,209 214,312
NON-CURRENT ASSETS
Plant and equipment 10 31,045 41,101
Right-of-use assets 11 140,793 -
Intangible assets 12 42,943 123,970
Deferred tax assets 5 117,866 32,386
Other non-current assets 24 91
TOTAL NON-CURRENT ASSETS 332,671 197,548
TOTAL ASSETS 550,880 411,860
LIABILITIES
CURRENT LIABILITIES
Trade and other payables 13 247,081 198,602
Borrowings 14 41,502 -
Provisions 15 29,112 29,089
Derivative financial instruments 16 534 570
Lease liabilities 17 87,544 -
Income tax payable 5 145 -
Other current liabilities 18 95 8,908
Deferred consideration 19 9,580 -
TOTAL CURRENT LIABILITIES 415,593 237,169
NON-CURRENT LIABILITIES
Borrowings 14 44,989 29,482
Lease liabilities 17 111,013 -
Provisions 15 2,828 4,427
Deferred tax liabilities 5 56,656 19,171
Other non-current liabilities 18 110 15,489
TOTAL NON-CURRENT LIABILITIES 215,596 68,569
TOTAL LIABILITIES 631,189 305,738
NET ASSETS (80,309) 106,122
EQUITY
Issued capital 20 108,034 107,605
Reserves 21 17,868 9,421
Accumulated losses (206,211) (10,904)
TOTAL EQUITY (80,309) 106,122
The above consolidated statement of financial position should be read in conjunction with the accompanying notes ‘The Group has initially applied AASB 16 at 1 July 2019. Under the transition method chosen comparative information is not restated.
For
per
sona
l use
onl
y

18
CONSOLIDATED STATEMENT OF CHANGES IN EQUITY
FOR THE YEAR ENDED 28 JUNE 2020
Issued capital Equity reserve Foreign currency
translation reserve Dividend profit
reserve Accumulated
losses Total
Note $000 $000 $000 $000 $000 $000
Balance at 1 July 2018 107,651 3,159 - 10,112 (10,904) 110,018
Profit after income tax for the year - - - - 8,130 8,130
Transfer to dividend profit reserve 21 - - - 8,130 (8,130) -
Other comprehensive income for the year, net of tax - - 31 - - 31
Total comprehensive income for the year - - 31 8,130 - 8,161
Transactions with owners in their capacity as owners:
Shares cancelled during the year 20 (46) - - - - (46)
Share based payment expense 33 - 365 - - - 365
Dividends paid or provided for 21,22 - 199 - (12,575) - (12,376)
Balance at 30 June 2019 20,21 107,605 3,723 31 5,667 (10,904) 106,122
Adjustment for changes in accounting policy – AASB 16 1 - - - - (11,521) (11,521)
Loss after income tax for the year - - - - (170,485) (170,485)
Transfer profit after income tax for the half-year** 21 - - - 13,301 (13,301) -
Other comprehensive income for the year, net of tax - - 123 - - 123
Total comprehensive income for the year - - 123 13,301 (195,307) (181,883)
Transactions with owners in their capacity as owners:
Shares issued during the year 20 429 - - - - 429
Share based payment expense 33 - 266 - - - 266
Dividends paid or provided for 21,22 - 88 - (5,331) - (5,243)
Balance at 28 June 2020 20,21 108,034 4,077 154 13,637 (206,211) (80,309)
The above consolidated statement of changes in equity should be read in conjunction with the accompanying notes * The Group has initially applied AASB 16 at 1 July 2019. Under the transition method chosen comparative information is not restated.
**The transfer into the dividend profit reserve was recorded based on the profit recognised for the half-year ended 29 December 2019. No dividend has been declared or paid since 29 December 2019.
For
per
sona
l use
onl
y
19
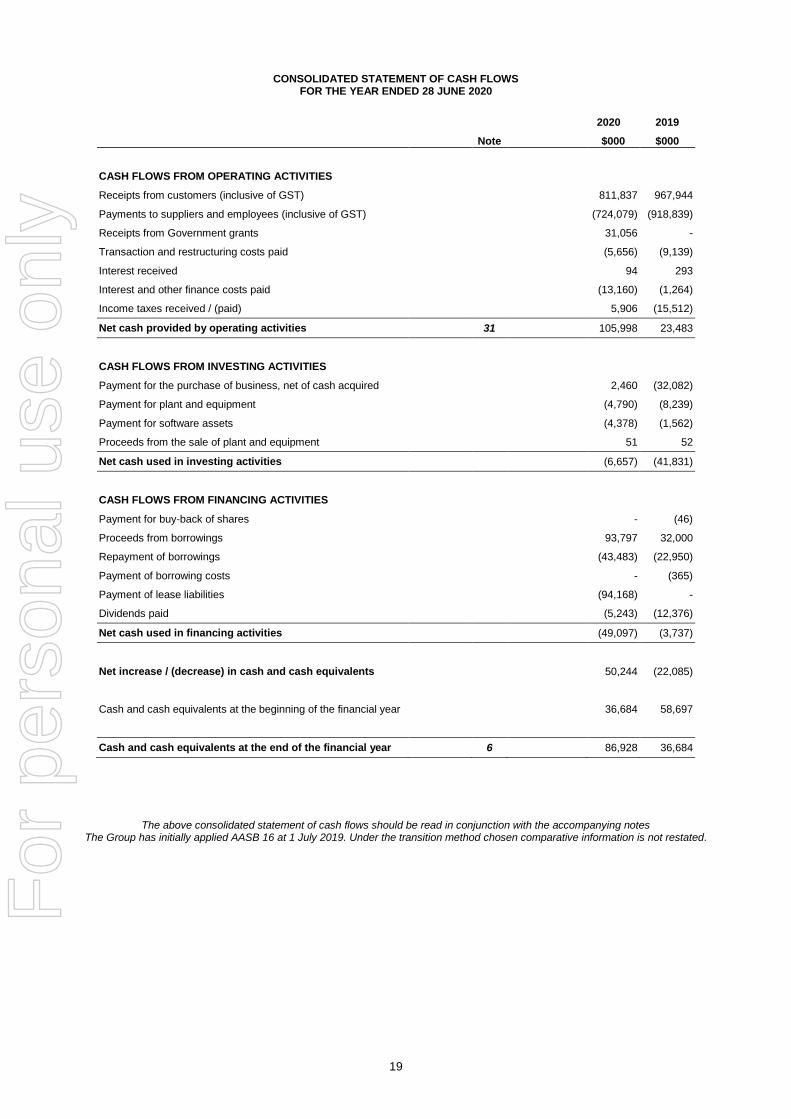
CONSOLIDATED STATEMENT OF CASH FLOWS FOR THE YEAR ENDED 28 JUNE 2020
2020 2019
Note $000 $000
CASH FLOWS FROM OPERATING ACTIVITIES
Receipts from customers (inclusive of GST) 811,837 967,944
Payments to suppliers and employees (inclusive of GST) (724,079) (918,839)
Receipts from Government grants 31,056 -
Transaction and restructuring costs paid (5,656) (9,139)
Interest received 94 293
Interest and other finance costs paid (13,160) (1,264)
Income taxes received / (paid) 5,906 (15,512)
Net cash provided by operating activities 31 105,998 23,483
CASH FLOWS FROM INVESTING ACTIVITIES
Payment for the purchase of business, net of cash acquired 2,460 (32,082)
Payment for plant and equipment (4,790) (8,239)
Payment for software assets (4,378) (1,562)
Proceeds from the sale of plant and equipment 51 52
Net cash used in investing activities (6,657) (41,831)
CASH FLOWS FROM FINANCING ACTIVITIES
Payment for buy-back of shares - (46)
Proceeds from borrowings 93,797 32,000
Repayment of borrowings (43,483) (22,950)
Payment of borrowing costs - (365)
Payment of lease liabilities (94,168) -
Dividends paid (5,243) (12,376)
Net cash used in financing activities (49,097) (3,737)
Net increase / (decrease) in cash and cash equivalents 50,244 (22,085)
Cash and cash equivalents at the beginning of the financial year 36,684 58,697
Cash and cash equivalents at the end of the financial year 6 86,928 36,684
The above consolidated statement of cash flows should be read in conjunction with the accompanying notes The Group has initially applied AASB 16 at 1 July 2019. Under the transition method chosen comparative information is not restated.
For
per
sona
l use
onl
y
Notes to the financial statements
20
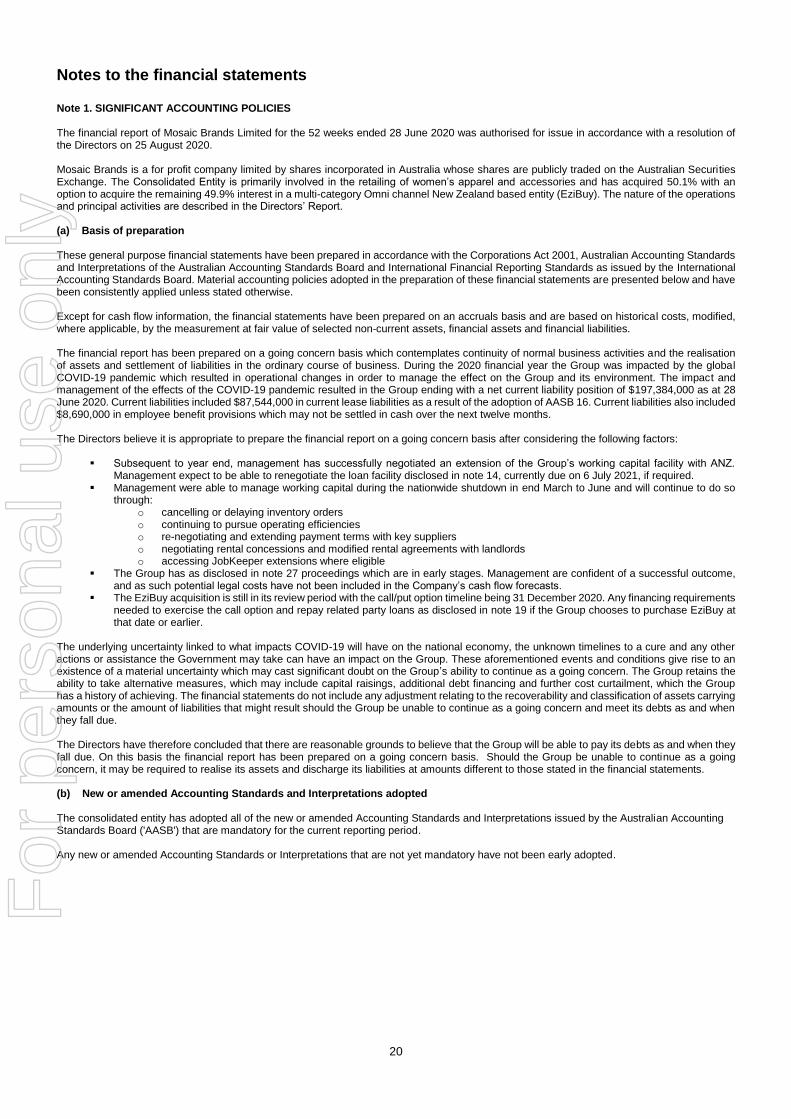
Note 1. SIGNIFICANT ACCOUNTING POLICIES The financial report of Mosaic Brands Limited for the 52 weeks ended 28 June 2020 was authorised for issue in accordance with a resolution of the Directors on 25 August 2020. Mosaic Brands is a for profit company limited by shares incorporated in Australia whose shares are publicly traded on the Australian Securities Exchange. The Consolidated Entity is primarily involved in the retailing of women’s apparel and accessories and has acquired 50.1% with an option to acquire the remaining 49.9% interest in a multi-category Omni channel New Zealand based entity (EziBuy). The nature of the operations and principal activities are described in the Directors’ Report. (a) Basis of preparation These general purpose financial statements have been prepared in accordance with the Corporations Act 2001, Australian Accounting Standards and Interpretations of the Australian Accounting Standards Board and International Financial Reporting Standards as issued by the International Accounting Standards Board. Material accounting policies adopted in the preparation of these financial statements are presented below and have been consistently applied unless stated otherwise. Except for cash flow information, the financial statements have been prepared on an accruals basis and are based on historical costs, modified, where applicable, by the measurement at fair value of selected non-current assets, financial assets and financial liabilities. The financial report has been prepared on a going concern basis which contemplates continuity of normal business activities and the realisation of assets and settlement of liabilities in the ordinary course of business. During the 2020 financial year the Group was impacted by the global COVID-19 pandemic which resulted in operational changes in order to manage the effect on the Group and its environment. The impact and management of the effects of the COVID-19 pandemic resulted in the Group ending with a net current liability position of $197,384,000 as at 28 June 2020. Current liabilities included $87,544,000 in current lease liabilities as a result of the adoption of AASB 16. Current liabilities also included $8,690,000 in employee benefit provisions which may not be settled in cash over the next twelve months. The Directors believe it is appropriate to prepare the financial report on a going concern basis after considering the following factors:
Subsequent to year end, management has successfully negotiated an extension of the Group’s working capital facility with ANZ. Management expect to be able to renegotiate the loan facility disclosed in note 14, currently due on 6 July 2021, if required.
Management were able to manage working capital during the nationwide shutdown in end March to June and will continue to do so through:
o cancelling or delaying inventory orders o continuing to pursue operating efficiencies o re-negotiating and extending payment terms with key suppliers o negotiating rental concessions and modified rental agreements with landlords o accessing JobKeeper extensions where eligible
The Group has as disclosed in note 27 proceedings which are in early stages. Management are confident of a successful outcome, and as such potential legal costs have not been included in the Company’s cash flow forecasts.
The EziBuy acquisition is still in its review period with the call/put option timeline being 31 December 2020. Any financing requirements needed to exercise the call option and repay related party loans as disclosed in note 19 if the Group chooses to purchase EziBuy at that date or earlier.
The underlying uncertainty linked to what impacts COVID-19 will have on the national economy, the unknown timelines to a cure and any other actions or assistance the Government may take can have an impact on the Group. These aforementioned events and conditions give rise to an existence of a material uncertainty which may cast significant doubt on the Group’s ability to continue as a going concern. The Group retains the ability to take alternative measures, which may include capital raisings, additional debt financing and further cost curtailment, which the Group has a history of achieving. The financial statements do not include any adjustment relating to the recoverability and classification of assets carrying amounts or the amount of liabilities that might result should the Group be unable to continue as a going concern and meet its debts as and when they fall due. The Directors have therefore concluded that there are reasonable grounds to believe that the Group will be able to pay its debts as and when they fall due. On this basis the financial report has been prepared on a going concern basis. Should the Group be unable to continue as a going concern, it may be required to realise its assets and discharge its liabilities at amounts different to those stated in the financial statements. (b) New or amended Accounting Standards and Interpretations adopted The consolidated entity has adopted all of the new or amended Accounting Standards and Interpretations issued by the Australian Accounting Standards Board ('AASB') that are mandatory for the current reporting period. Any new or amended Accounting Standards or Interpretations that are not yet mandatory have not been early adopted. F
or p
erso
nal u
se o
nly

21
Notes to the financial statements (continued)
Note 1. SIGNIFICANT ACCOUNTING POLICIES (continued)
The following Accounting Standards and Interpretations are most relevant to the consolidated entity:
AASB 16 Leases
The Consolidated Entity has adopted AASB 16 from 1 July 2019. The standard replaces AASB 117 'Leases' and for lessees eliminates the classifications of operating leases and finance leases. Except for some short-term leases and leases of low-value assets, right-of-use assets and corresponding lease liabilities are recognised in the statement of financial position. Straight-line operating lease expense recognition is replaced with a depreciation charge for the right-of-use assets (included in operating costs) and an interest expense on the recognised lease liabilities (included in finance costs). In the earlier periods of the lease, the expenses associated with the lease under AASB 16 will be higher when compared to lease expenses under AASB 117. However, EBITDA (Earnings Before Interest, Tax, Depreciation and Amortisation) results improve as the operating expense is now replaced by interest expense and depreciation in profit or loss. For classification within the statement of cash flows, the interest portion is disclosed in operating activities and the principal portion of the lease payments are separately disclosed in financing activities. For lessor accounting, the standard does not substantially change how a lessor accounts for leases. The Group has applied AASB 16 using the modified retrospective method, under which the cumulative effect of initial application is recognised in retained earnings at 1 July 2019. Accordingly, the comparative information presented for 2019 has not been restated – i.e. it is presented, as previously recorded, under AASB 117 Leases and related interpretations. Details of the changes in the accounting policies are disclosed below.
Right-of-use assets
A right-of-use asset is recognised at the commencement date of a lease. The right-of-use asset is measured at cost, which comprises the initial amount of the lease liability, adjusted for, as applicable, any lease payments made at or before the commencement date net of any lease incentives received, any initial direct costs incurred, and, except where included in the cost of inventories, an estimate of costs expected to be incurred for dismantling and removing the underlying asset, and restoring the site or asset.
Right-of-use assets are depreciated on a straight-line basis over the unexpired period of the lease or the estimated useful life of the asset, whichever is the shorter. Where the Consolidated Entity expects to obtain ownership of the leased asset at the end of the lease term, the depreciation is over its estimated useful life. Right-of-use assets are subject to impairment or adjusted for any re-measurements of lease liabilities.
The Consolidated Entity has elected not to recognise a right-of-use asset and corresponding lease liability for short-term leases with terms of 12 months or less and leases of low-value assets. Lease payments on these assets are expensed to profit or loss as incurred.
Lease liabilities
A lease liability is recognised at the commencement date of a lease. The lease liability is initially recognised at the present value of the lease payments to be made over the term of the lease, discounted using the interest rate implicit in the lease or, if that rate cannot be readily determined, and the Consolidated Entity's incremental borrowing rate. Lease payments comprise of fixed payments less any lease incentives receivable, variable lease payments that depend on an index or a rate, amounts expected to be paid under residual value guarantees, exercise price of a purchase option when the exercise of the option is reasonably certain to occur, and any anticipated termination penalties. The variable lease payments that do not depend on an index or a rate are expensed in the period in which they are incurred. Lease liabilities are measured at amortised cost using the effective interest method. The carrying amounts are remeasured if there is a change in the following: future lease payments arising from a change in an index or a rate used; residual guarantee; lease term; certainty of a purchase option and termination penalties. When a lease liability is remeasured, an adjustment is made to the corresponding right-of-use asset, or to profit or loss if the carrying amount of the right-of-use asset is fully written down.
Key estimates and judgements
Lease term
The lease term is a significant component in the measurement of both the right-of-use asset and lease liability. Judgement is exercised in determining whether there is reasonable certainty that an option to extend the lease or purchase the underlying asset will be exercised, or an option to terminate the lease will not be exercised, when ascertaining the periods to be included in the lease term. In determining the lease term, all facts and circumstances that create an economical incentive to exercise an extension option, or not to exercise a termination option, are considered at the lease commencement date. Factors considered may include the importance of the asset to the consolidated entity's operations; comparison of terms and conditions to prevailing market rates; incurrence of significant penalties; existence of significant leasehold improvements; and the costs and disruption to replace the asset. The consolidated entity reassesses whether it is reasonably certain to exercise an extension option, or not exercise a termination option, if there is a significant event or significant change in circumstances.
Incremental borrowing rate
Where the interest rate implicit in a lease cannot be readily determined, an incremental borrowing rate is estimated to discount future lease payments to measure the present value of the lease liability at the lease commencement date. Such a rate is based on what the consolidated entity estimates it would have to pay a third party to borrow the funds necessary to obtain an asset of a similar value to the right-of-use asset, with similar terms, security and economic environment. F
or p
erso
nal u
se o
nly
Notes to the financial statements (continued)
22
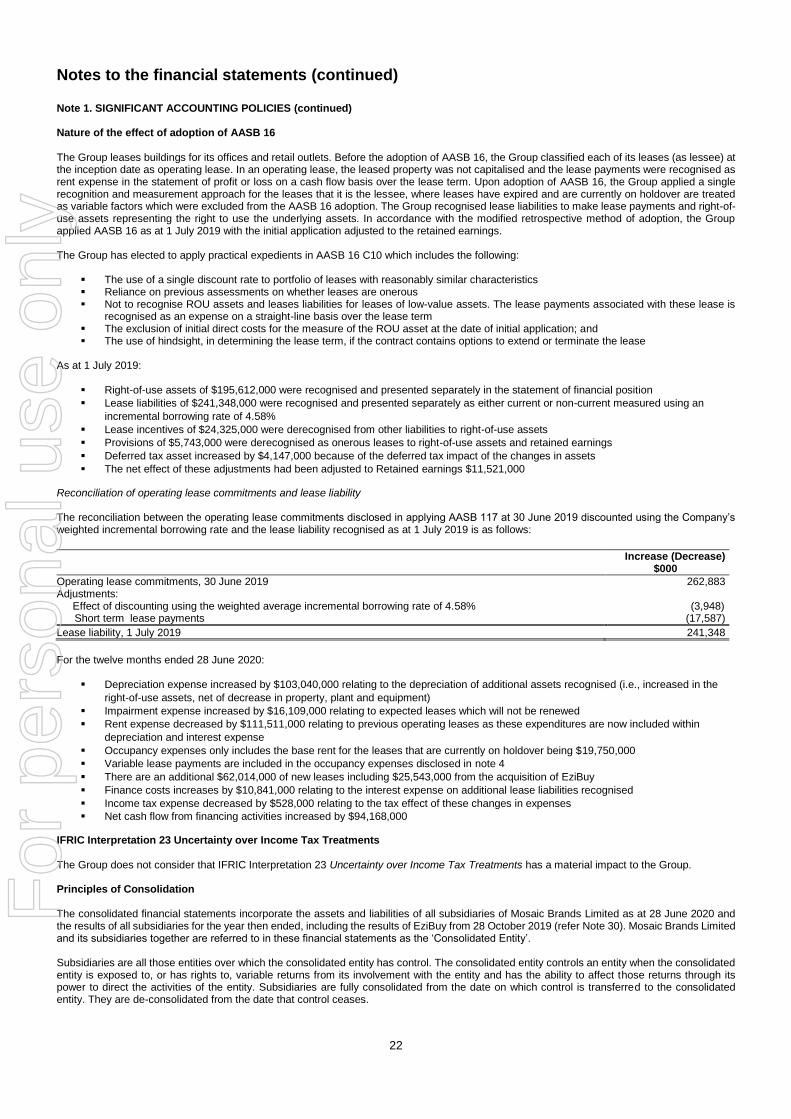
Note 1. SIGNIFICANT ACCOUNTING POLICIES (continued) Nature of the effect of adoption of AASB 16 The Group leases buildings for its offices and retail outlets. Before the adoption of AASB 16, the Group classified each of its leases (as lessee) at the inception date as operating lease. In an operating lease, the leased property was not capitalised and the lease payments were recognised as rent expense in the statement of profit or loss on a cash flow basis over the lease term. Upon adoption of AASB 16, the Group applied a single recognition and measurement approach for the leases that it is the lessee, where leases have expired and are currently on holdover are treated as variable factors which were excluded from the AASB 16 adoption. The Group recognised lease liabilities to make lease payments and right-of-use assets representing the right to use the underlying assets. In accordance with the modified retrospective method of adoption, the Group applied AASB 16 as at 1 July 2019 with the initial application adjusted to the retained earnings. The Group has elected to apply practical expedients in AASB 16 C10 which includes the following:
The use of a single discount rate to portfolio of leases with reasonably similar characteristics Reliance on previous assessments on whether leases are onerous Not to recognise ROU assets and leases liabilities for leases of low-value assets. The lease payments associated with these lease is
recognised as an expense on a straight-line basis over the lease term The exclusion of initial direct costs for the measure of the ROU asset at the date of initial application; and The use of hindsight, in determining the lease term, if the contract contains options to extend or terminate the lease
As at 1 July 2019:
Right-of-use assets of $195,612,000 were recognised and presented separately in the statement of financial position
Lease liabilities of $241,348,000 were recognised and presented separately as either current or non-current measured using an
incremental borrowing rate of 4.58%
Lease incentives of $24,325,000 were derecognised from other liabilities to right-of-use assets
Provisions of $5,743,000 were derecognised as onerous leases to right-of-use assets and retained earnings
Deferred tax asset increased by $4,147,000 because of the deferred tax impact of the changes in assets
The net effect of these adjustments had been adjusted to Retained earnings $11,521,000
Reconciliation of operating lease commitments and lease liability The reconciliation between the operating lease commitments disclosed in applying AASB 117 at 30 June 2019 discounted using the Company’s weighted incremental borrowing rate and the lease liability recognised as at 1 July 2019 is as follows: Increase (Decrease)
$000
Operating lease commitments, 30 June 2019 262,883 Adjustments:
Effect of discounting using the weighted average incremental borrowing rate of 4.58% (3,948) Short term lease payments (17,587)
Lease liability, 1 July 2019 241,348
For the twelve months ended 28 June 2020:
Depreciation expense increased by $103,040,000 relating to the depreciation of additional assets recognised (i.e., increased in the
right-of-use assets, net of decrease in property, plant and equipment)
Impairment expense increased by $16,109,000 relating to expected leases which will not be renewed
Rent expense decreased by $111,511,000 relating to previous operating leases as these expenditures are now included within
depreciation and interest expense
Occupancy expenses only includes the base rent for the leases that are currently on holdover being $19,750,000
Variable lease payments are included in the occupancy expenses disclosed in note 4
There are an additional $62,014,000 of new leases including $25,543,000 from the acquisition of EziBuy
Finance costs increases by $10,841,000 relating to the interest expense on additional lease liabilities recognised
Income tax expense decreased by $528,000 relating to the tax effect of these changes in expenses
Net cash flow from financing activities increased by $94,168,000
IFRIC Interpretation 23 Uncertainty over Income Tax Treatments The Group does not consider that IFRIC Interpretation 23 Uncertainty over Income Tax Treatments has a material impact to the Group. Principles of Consolidation The consolidated financial statements incorporate the assets and liabilities of all subsidiaries of Mosaic Brands Limited as at 28 June 2020 and the results of all subsidiaries for the year then ended, including the results of EziBuy from 28 October 2019 (refer Note 30). Mosaic Brands Limited and its subsidiaries together are referred to in these financial statements as the ‘Consolidated Entity’. Subsidiaries are all those entities over which the consolidated entity has control. The consolidated entity controls an entity when the consolidated entity is exposed to, or has rights to, variable returns from its involvement with the entity and has the ability to affect those returns through its power to direct the activities of the entity. Subsidiaries are fully consolidated from the date on which control is transferred to the consolidated entity. They are de-consolidated from the date that control ceases.
For
per
sona
l use
onl
y

Notes to the financial statements (continued)
23
Note 1. SIGNIFICANT ACCOUNTING POLICIES (continued) Intercompany transactions, balances and unrealised gains on transactions between entities in the consolidated entity are eliminated. Unrealised losses are also eliminated unless the transaction provides evidence of the impairment of the asset transferred. Accounting policies of subsidiaries have been changed where necessary to ensure consistency with the policies adopted by the consolidated entity ‘(c) Fair value measurement The Group measures some of its assets and liabilities at fair value on either a recurring or non-recurring basis, depending on the requirements of the applicable Accounting Standard. Fair value is the price the Group would receive to sell an asset or would have to pay to transfer a liability in an orderly (i.e. unforced) transaction between independent, knowledgeable and willing market participants at the measurement date. As fair value is a market-based measure, the closest equivalent observable market pricing information is used to determine fair value. Adjustments to market values may be made having regard to the characteristics of the specific asset or liability. The fair values of assets and liabilities that are not traded in an active market are determined using one or more valuation techniques. These valuation techniques maximise, to the extent possible, the use of observable market data. To the extent possible, market information is extracted from either the principal market for the asset or liability (i.e. the market with the greatest volume and level of activity for the asset or liability) or, in the absence of such a market, the most advantageous market available to the entity at the end of the reporting period (i.e. the market that maximises the receipts from the sale of the asset or minimises the payments made to transfer the liability, after taking into account transaction costs and transport costs). For non-financial assets, the fair value measurement also takes into account a market participant’s ability to use the asset in its highest and best use or to sell it to another market participant that would use the asset in its highest and best use. The fair value of liabilities and the entity’s own equity instruments (excluding those related to share-based payment arrangements) may be valued, where there is no observable market price in relation to the transfer of such financial instruments, by reference to observable market information where such instruments are held as assets. Where this information is not available, other valuation techniques are adopted and, where significant, are detailed in the respective note to the financial statements. (d) Financial instruments Financial assets and financial liabilities are initially measured at fair value. Transaction costs are included as part of the initial measurement, except for financial instruments at fair value through profit or loss. Financial assets are subsequently measured at either amortised cost or fair value depending on their classification. Classification is determined based on both the business model within which such assets are held and the contractual cash flow characteristics of the financial asset. The consolidated entity’s cash and cash equivalents and other receivables are classified as at amortised cost. Certain investments qualify to be recognised and measured subsequently at fair value through other comprehensive income (‘OCI’) on exercise of an irrevocable election at the time of initial recognition, otherwise they are recognised at fair value through profit or loss. Financial liabilities are subsequently measured at amortised cost. Derivatives are recognised at fair value through profit or loss. Amortised cost is calculated as the amount at which the financial asset or financial liability is measured at initial recognition less principal repayments and any reduction for impairment, and adjusted for any cumulative amortisation of the difference between that initial amount and the maturity amount calculated using the effective interest method. The consolidated entity recognises a loss allowance for expected credit losses on debt instruments which are either measured at amortised cost or fair value through other comprehensive income. The measurement of the loss allowance depends upon the consolidated entity's assessment at the end of each reporting period as to whether the financial instrument's credit risk has increased significantly since initial recognition, based on reasonable and supportable information that is available, without undue cost or effort to obtain. For financial assets measured at fair value through other comprehensive income, the loss allowance is recognised within other comprehensive income. In all other cases, the loss allowance is recognised in profit or loss. When there is no reasonable expectation of recovering part or all of a financial asset, its carrying value is written off. (e) Foreign currency translation The financial statements are presented in Australian dollars, which is the functional and presentation currency for Mosaic Brands Limited. Foreign currency transactions Foreign currency transactions are translated into Australian dollars using the exchange rates prevailing at the dates of the transactions. Foreign exchange gains and losses resulting from the settlement of such transactions and from the translation at financial year-end exchange rates of monetary assets and liabilities denominated in foreign currencies are recognised in profit or loss Foreign operations
The assets and liabilities of foreign operations are translated into Australian dollars using the exchange rates at the reporting date. The revenues and expenses of foreign operations are translated into Australian dollars using the average exchange rates, which approximate the rates at the dates of the transactions, for the period. All resulting foreign exchange differences are recognised in other comprehensive income through the foreign currency reserve in equity. The foreign currency reserve is recognised in profit or loss when the foreign operation or net investment is disposed of.
For
per
sona
l use
onl
y

Notes to the financial statements (continued)
24
Note 1. SIGNIFICANT ACCOUNTING POLICIES (continued) (f) Employee benefits Employees of the Group receive defined contribution superannuation entitlements for which the Group pays the fixed superannuation guarantee contribution (currently 9.5% of the employee’s average ordinary salary) to the employee’s superannuation fund of choice. All contributions in respect of employees’ defined contribution entitlements are recognised as an expense when they become payable. The Group’s obligation with respect to employees’ defined contribution entitlements is limited to its obligation for any unpaid superannuation guarantee contributions at the end of the reporting period. All obligations for unpaid superannuation guarantee contributions are measured at the (undiscounted) amounts expected to be paid when the obligation is settled and are presented as current liabilities in the Group’s statement of financial position.
(g) Goods and Services Tax (GST) Revenues, expenses and assets are recognised net of the amount of goods and services tax (GST) except where the amount of GST incurred is not recoverable from the Australian Taxation Office (ATO). Receivables and payables are stated inclusive of the amount of GST receivable or payable. The net amount of GST recoverable from, or payable to, the tax authority is included in Trade and other receivables or payables in the statement of financial position. Cash flows are presented on a gross basis. The GST components of cash flows arising from investing or financing activities which are recoverable from, or payable to, the tax authority are presented as operating cash flows included in receipts from customers or payments to suppliers. Commitments and contingencies are disclosed net of the amount of GST recoverable from, or payable to, the taxation authority. (h) Period When required by Accounting Standards, comparative figures have been adjusted to conform to changes in presentation for the current financial year. The current reporting period, 1 July 2019 to 28 June 2020, represents 52 weeks and the comparative reporting period is from 2 July 2018 to 30 June 2019 which represents 52 weeks. (i) Rounding of amounts The company is of a kind referred to in Corporations Instrument 2016/191, issued by the Australian Securities and Investments Commission, relating to 'rounding-off'. Amounts in this report have been rounded off in accordance with that Corporations Instrument to the nearest thousand dollars, or in certain cases, the nearest dollar. (j) Critical accounting estimates and judgments The Directors evaluate estimates and judgements incorporated into the financial statements based on historical knowledge and best available current information. Estimates assume a reasonable expectation of future events and are based on current trends and economic data, obtained both externally and within the Group. The key estimates and judgements have been included within the notes to the financial report. Coronavirus (COVID-19) pandemic Judgement has been exercised in considering the impacts that the Coronavirus (COVID-19) pandemic has had, or may have, on the consolidated entity based on known information. This consideration extends to the nature of the products offered, customers, supply chain, staffing and geographic regions in which the consolidated entity operates, and the resulting financial impacts and disclosures. (k) Parent entity information In accordance with the Corporations Act 2001, these financial statements present the results of the consolidated entity only. Supplementary information about the parent entity is disclosed in note 27. (l) New Accounting Standards and Interpretations not yet mandatory or early adopted Australian Accounting Standards and Interpretations that have recently been issued or amended but are not yet mandatory, have not been early adopted by the consolidated entity for the annual reporting period ended 28 June 2020. The consolidated entity's assessment of the impact of these new or amended Accounting Standards and Interpretations, most relevant to the consolidated entity, are set out below. Conceptual Framework for Financial Reporting (Conceptual Framework) The revised Conceptual Framework is applicable to annual reporting periods beginning on or after 1 January 2020 and early adoption is permitted. The Conceptual Framework contains new definition and recognition criteria as well as new guidance on measurement that affects several Accounting Standards. Where the consolidated entity has relied on the existing framework in determining its accounting policies for transactions, events or conditions that are not otherwise dealt with under the Australian Accounting Standards, the consolidated entity may need to review such policies under the revised framework. At this time, the application of the Conceptual Framework is not expected to have a material impact on the consolidated entity's financial statements (m) Current and non-current classification Assets and liabilities are presented in the statement of financial position based on current and non-current classification.
For
per
sona
l use
onl
y

Notes to the financial statements (continued)
25
Note 1. SIGNIFICANT ACCOUNTING POLICIES (continued) An asset is classified as current when: it is either expected to be realised or intended to be sold or consumed in the consolidated entity's normal operating cycle; it is held primarily for the purpose of trading; it is expected to be realised within 12 months after the reporting period; or the asset is cash or cash equivalent unless restricted from being exchanged or used to settle a liability for at least 12 months after the reporting period. All other assets are classified as non-current. A liability is classified as current when: it is either expected to be settled in the consolidated entity's normal operating cycle; it is held primarily for the purpose of trading; it is due to be settled within 12 months after the reporting period; or there is no unconditional right to defer the settlement of the liability for at least 12 months after the reporting period. All other liabilities are classified as non-current. Deferred tax assets and liabilities are always classified as non-current. (n) Government grants Government Grants are recognised on the Consolidated Statement of Profit or Loss and Other Comprehensive Income when there is reasonable assurance that the entity will comply with the conditions attaching to them, and the grant will be received. Such grants are presented on a net basis on the Statement of Profit or Loss and Other Comprehensive Income within employee benefits expense. (o) Reclassification Certain amounts in the financial report have been reclassified to conform to current year presentation. Note 2. OPERATING SEGMENT Management has determined the operating segments based on internal reports reviewed and used by the Chief Executive Officer (CEO) in assessing performance and in determining the allocation of resources. The Group operates predominately in Australia and also within New Zealand and is organised into two operating segments. Fashion retail (Mosaic Brands Australia and New Zealand) The fashion retail segment shares similarities in its offering (fashion clothing) with the same customer demographic across different brands and are supported by one integrated support function. The integrated support functions include finance, information technology, marketing (both in the processes and the target customer) as well as the production and distribution processes. Multi-channel retail (EziBuy New Zealand) The multi-channel retail segment consists of EziBuy which is based in New Zealand and services customers across both Australia and New Zealand (the Group gained control of the ordinary shares in EziBuy on 23 December 2019). The multi-channel retail segment sells various products targeting a variety of customers and operates with its own separate support functions for areas including finance, information technology, marketing and distribution. The information reported to the CEO is on at least a monthly basis, including weekly reporting on key revenue metrics. The accounting policies adopted for internal reporting to the CEO are consistent with those adopted in the financial statements.
For
per
sona
l use
onl
y
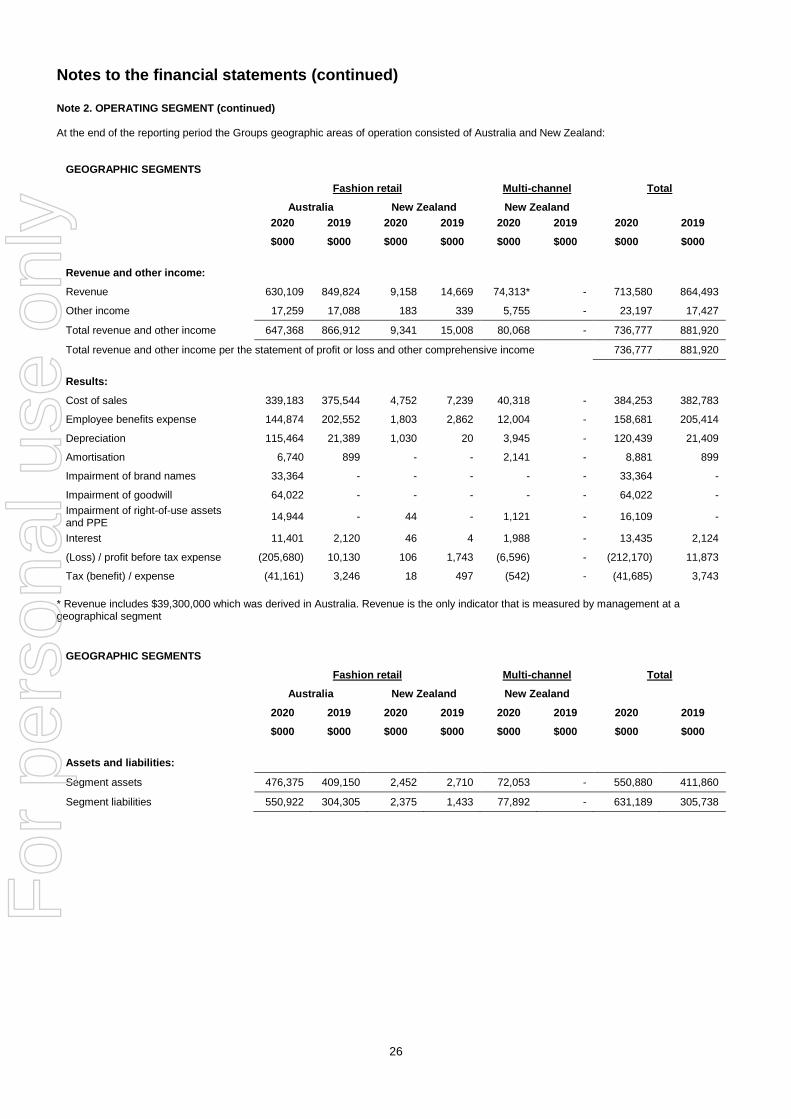
Notes to the financial statements (continued)
26
Note 2. OPERATING SEGMENT (continued) At the end of the reporting period the Groups geographic areas of operation consisted of Australia and New Zealand:
GEOGRAPHIC SEGMENTS
Fashion retail Multi-channel Total
Australia New Zealand New Zealand
2020 2019 2020 2019 2020 2019 2020 2019
$000 $000 $000 $000 $000 $000 $000 $000
Revenue and other income:
Revenue 630,109 849,824 9,158 14,669 74,313* - 713,580 864,493
Other income 17,259 17,088 183 339 5,755 - 23,197 17,427
Total revenue and other income 647,368 866,912 9,341 15,008 80,068 - 736,777 881,920
Total revenue and other income per the statement of profit or loss and other comprehensive income 736,777 881,920
Results:
Cost of sales 339,183 375,544 4,752 7,239 40,318 - 384,253 382,783
Employee benefits expense 144,874 202,552 1,803 2,862 12,004 - 158,681 205,414
Depreciation 115,464 21,389 1,030 20 3,945 - 120,439 21,409
Amortisation 6,740 899 - - 2,141 - 8,881 899
Impairment of brand names 33,364 - - - - - 33,364 -
Impairment of goodwill 64,022 - - - - - 64,022 -
Impairment of right-of-use assets and PPE
14,944 - 44 - 1,121 - 16,109 -
Interest 11,401 2,120 46 4 1,988 - 13,435 2,124
(Loss) / profit before tax expense (205,680) 10,130 106 1,743 (6,596) - (212,170) 11,873
Tax (benefit) / expense (41,161) 3,246 18 497 (542) - (41,685) 3,743
* Revenue includes $39,300,000 which was derived in Australia. Revenue is the only indicator that is measured by management at a geographical segment
GEOGRAPHIC SEGMENTS
Fashion retail Multi-channel Total
Australia New Zealand New Zealand
2020 2019 2020 2019 2020 2019 2020 2019
$000 $000 $000 $000 $000 $000 $000 $000
Assets and liabilities:
Segment assets 476,375 409,150 2,452 2,710 72,053 - 550,880 411,860
Segment liabilities 550,922 304,305 2,375 1,433 77,892 - 631,189 305,738
For
per
sona
l use
onl
y
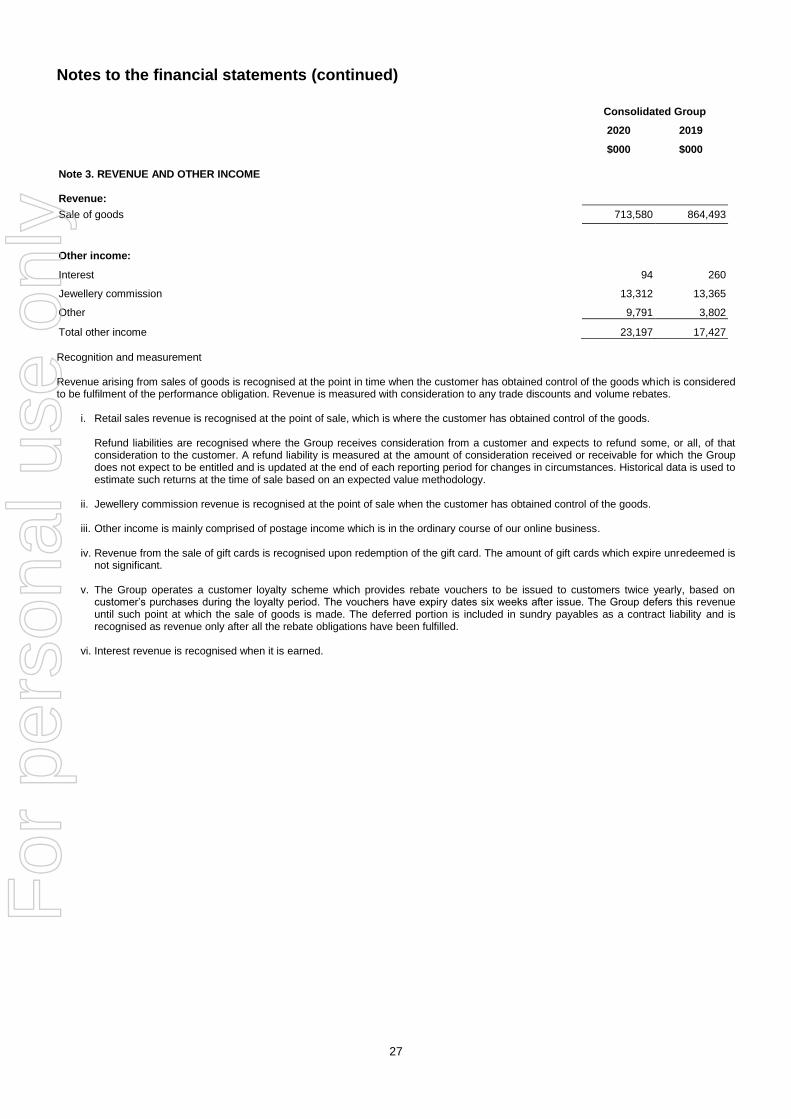
Notes to the financial statements (continued)
27
Consolidated Group
2020 2019
$000 $000
Note 3. REVENUE AND OTHER INCOME Revenue:
Sale of goods 713,580 864,493
Other income:
Interest 94 260
Jewellery commission 13,312 13,365
Other 9,791 3,802
Total other income 23,197 17,427
Recognition and measurement Revenue arising from sales of goods is recognised at the point in time when the customer has obtained control of the goods which is considered to be fulfilment of the performance obligation. Revenue is measured with consideration to any trade discounts and volume rebates.
i. Retail sales revenue is recognised at the point of sale, which is where the customer has obtained control of the goods.
Refund liabilities are recognised where the Group receives consideration from a customer and expects to refund some, or all, of that consideration to the customer. A refund liability is measured at the amount of consideration received or receivable for which the Group does not expect to be entitled and is updated at the end of each reporting period for changes in circumstances. Historical data is used to estimate such returns at the time of sale based on an expected value methodology.
ii. Jewellery commission revenue is recognised at the point of sale when the customer has obtained control of the goods.
iii. Other income is mainly comprised of postage income which is in the ordinary course of our online business.
iv. Revenue from the sale of gift cards is recognised upon redemption of the gift card. The amount of gift cards which expire unredeemed is not significant.
v. The Group operates a customer loyalty scheme which provides rebate vouchers to be issued to customers twice yearly, based on
customer’s purchases during the loyalty period. The vouchers have expiry dates six weeks after issue. The Group defers this revenue until such point at which the sale of goods is made. The deferred portion is included in sundry payables as a contract liability and is recognised as revenue only after all the rebate obligations have been fulfilled.
vi. Interest revenue is recognised when it is earned.
For
per
sona
l use
onl
y
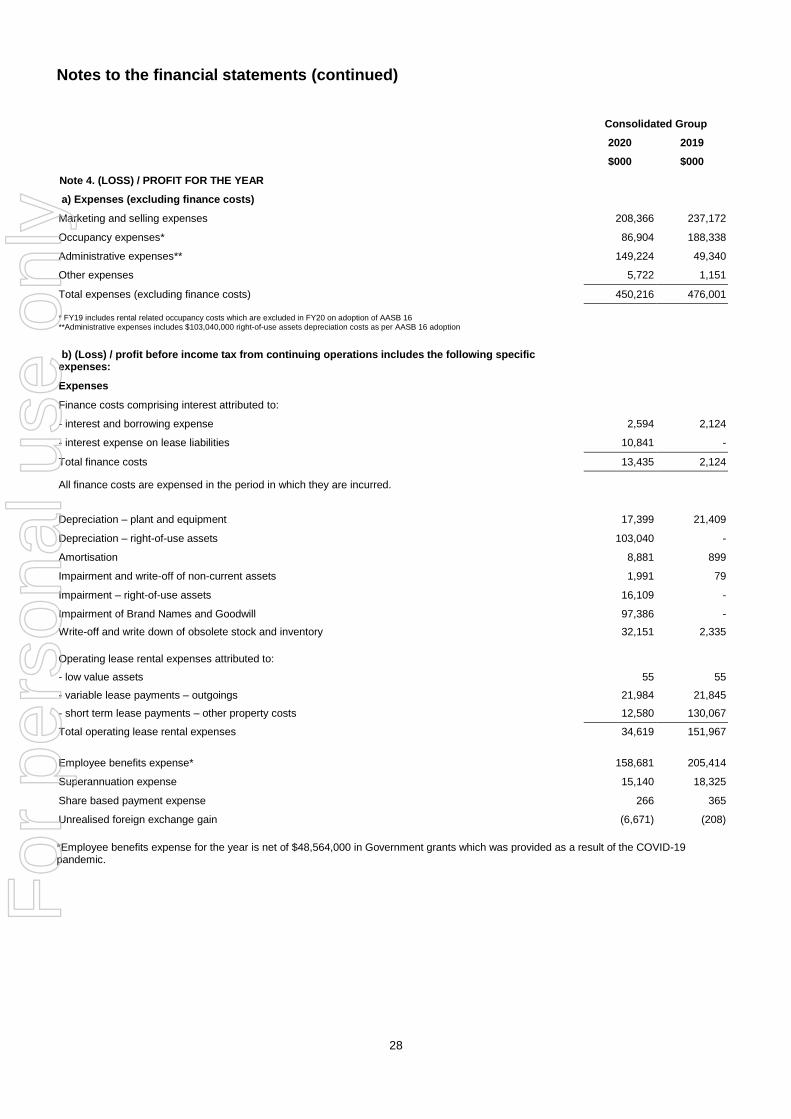
Notes to the financial statements (continued)
28
Consolidated Group
2020 2019
$000 $000
‘Note 4. (LOSS) / PROFIT FOR THE YEAR
‘a) Expenses (excluding finance costs)
Marketing and selling expenses 208,366 237,172
Occupancy expenses* 86,904 188,338
Administrative expenses** 149,224 49,340
Other expenses 5,722 1,151
Total expenses (excluding finance costs) 450,216 476,001
* FY19 includes rental related occupancy costs which are excluded in FY20 on adoption of AASB 16 **Administrative expenses includes $103,040,000 right-of-use assets depreciation costs as per AASB 16 adoption
‘b) (Loss) / profit before income tax from continuing operations includes the following specific expenses:
Expenses
Finance costs comprising interest attributed to:
- interest and borrowing expense 2,594 2,124
- interest expense on lease liabilities 10,841 -
Total finance costs 13,435 2,124
All finance costs are expensed in the period in which they are incurred.
Depreciation – plant and equipment 17,399 21,409
Depreciation – right-of-use assets 103,040 -
Amortisation 8,881 899
Impairment and write-off of non-current assets 1,991 79
Impairment – right-of-use assets 16,109 -
Impairment of Brand Names and Goodwill 97,386 -
Write-off and write down of obsolete stock and inventory 32,151 2,335
Operating lease rental expenses attributed to:
- low value assets 55 55
- variable lease payments – outgoings 21,984 21,845
- short term lease payments – other property costs 12,580 130,067
Total operating lease rental expenses 34,619 151,967
Employee benefits expense* 158,681 205,414
Superannuation expense 15,140 18,325
Share based payment expense 266 365
Unrealised foreign exchange gain (6,671) (208)
*Employee benefits expense for the year is net of $48,564,000 in Government grants which was provided as a result of the COVID-19 pandemic.
For
per
sona
l use
onl
y
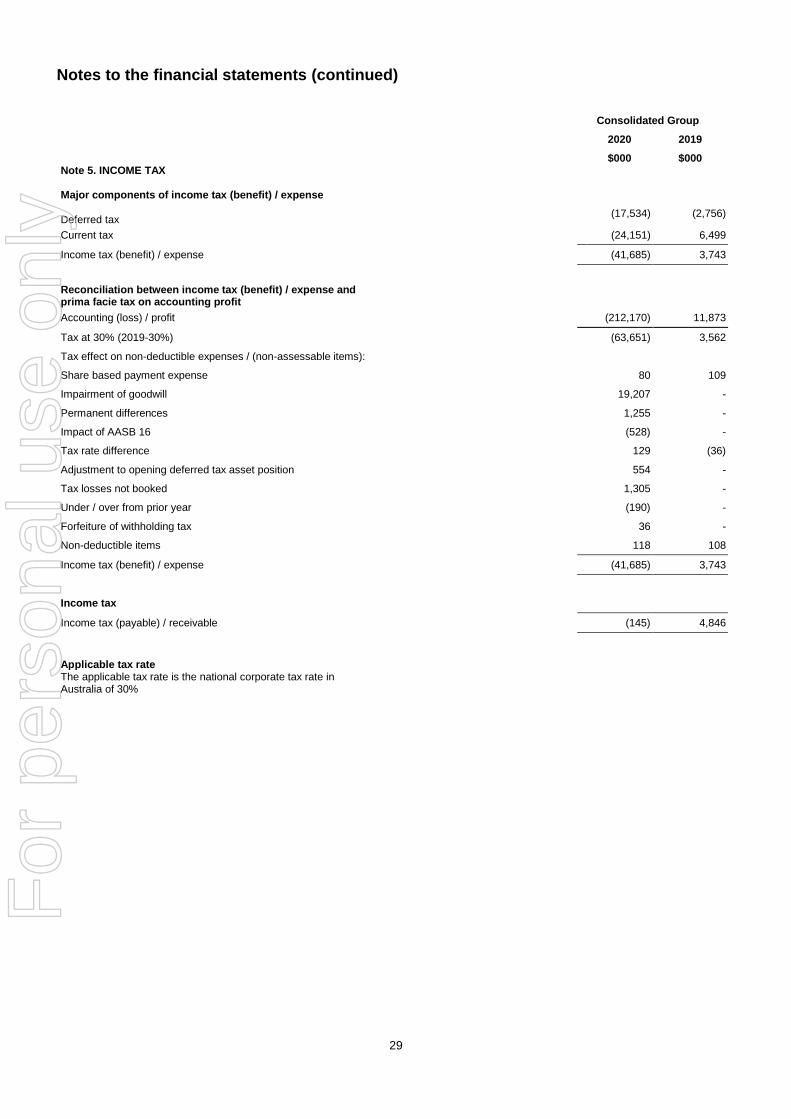
Notes to the financial statements (continued)
29
Consolidated Group
2020 2019
$000 $000 Note 5. INCOME TAX Major components of income tax (benefit) / expense Deferred tax
(17,534) (2,756)
Current tax (24,151) 6,499
Income tax (benefit) / expense (41,685) 3,743
Reconciliation between income tax (benefit) / expense and prima facie tax on accounting profit
Accounting (loss) / profit (212,170) 11,873
Tax at 30% (2019-30%) (63,651) 3,562
Tax effect on non-deductible expenses / (non-assessable items):
Share based payment expense 80 109
Impairment of goodwill 19,207 -
Permanent differences 1,255 -
Impact of AASB 16 (528) -
Tax rate difference 129 (36)
Adjustment to opening deferred tax asset position 554 -
Tax losses not booked 1,305 -
Under / over from prior year (190) -
Forfeiture of withholding tax 36 -
Non-deductible items 118 108
Income tax (benefit) / expense (41,685) 3,743
Income tax
Income tax (payable) / receivable (145) 4,846
Applicable tax rate
The applicable tax rate is the national corporate tax rate in Australia of 30%
For
per
sona
l use
onl
y
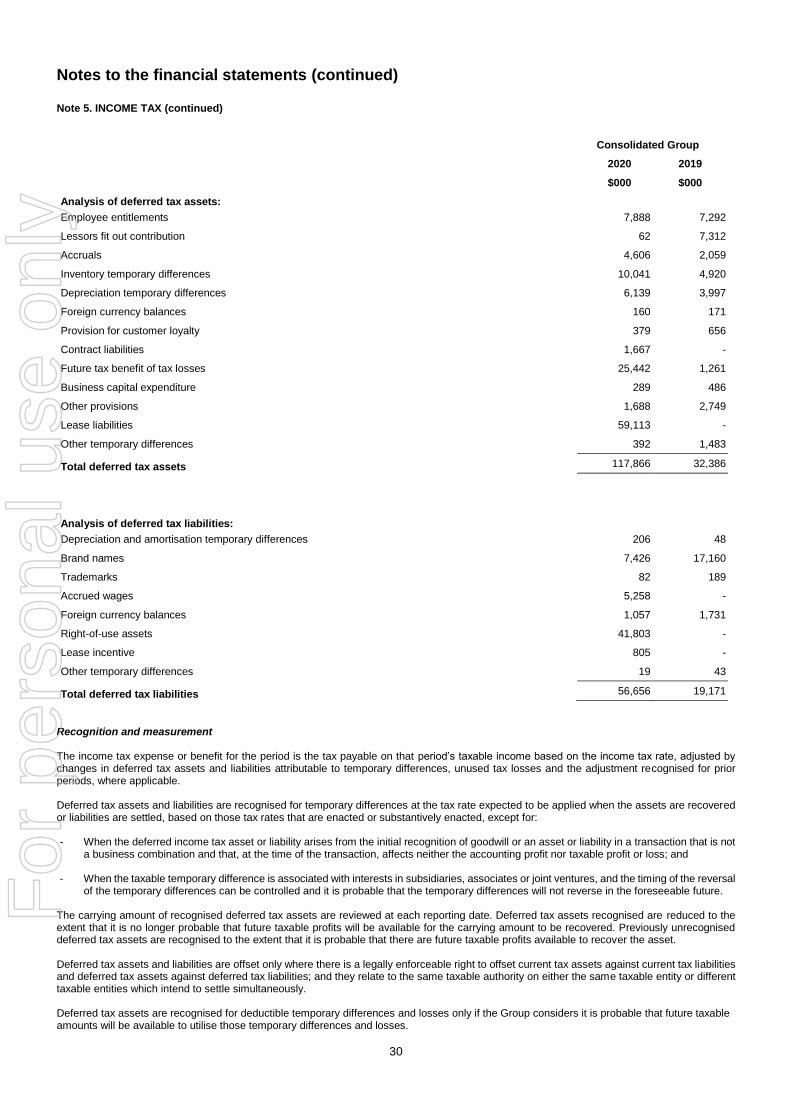
Notes to the financial statements (continued)
30
Note 5. INCOME TAX (continued) Consolidated Group
2020 2019
$000 $000
Analysis of deferred tax assets:
Employee entitlements 7,888 7,292
Lessors fit out contribution 62 7,312
Accruals 4,606 2,059
Inventory temporary differences 10,041 4,920
Depreciation temporary differences 6,139 3,997
Foreign currency balances 160 171
Provision for customer loyalty 379 656
Contract liabilities 1,667 -
Future tax benefit of tax losses 25,442 1,261
Business capital expenditure 289 486
Other provisions 1,688 2,749
Lease liabilities 59,113 -
Other temporary differences 392 1,483
Total deferred tax assets 117,866 32,386
Analysis of deferred tax liabilities:
Depreciation and amortisation temporary differences 206 48
Brand names 7,426 17,160
Trademarks 82 189
Accrued wages 5,258 -
Foreign currency balances 1,057 1,731
Right-of-use assets 41,803 -
Lease incentive 805 -
Other temporary differences 19 43
Total deferred tax liabilities 56,656 19,171
Recognition and measurement The income tax expense or benefit for the period is the tax payable on that period’s taxable income based on the income tax rate, adjusted by changes in deferred tax assets and liabilities attributable to temporary differences, unused tax losses and the adjustment recognised for prior periods, where applicable. Deferred tax assets and liabilities are recognised for temporary differences at the tax rate expected to be applied when the assets are recovered or liabilities are settled, based on those tax rates that are enacted or substantively enacted, except for: - When the deferred income tax asset or liability arises from the initial recognition of goodwill or an asset or liability in a transaction that is not
a business combination and that, at the time of the transaction, affects neither the accounting profit nor taxable profit or loss; and
- When the taxable temporary difference is associated with interests in subsidiaries, associates or joint ventures, and the timing of the reversal of the temporary differences can be controlled and it is probable that the temporary differences will not reverse in the foreseeable future.
The carrying amount of recognised deferred tax assets are reviewed at each reporting date. Deferred tax assets recognised are reduced to the extent that it is no longer probable that future taxable profits will be available for the carrying amount to be recovered. Previously unrecognised deferred tax assets are recognised to the extent that it is probable that there are future taxable profits available to recover the asset. Deferred tax assets and liabilities are offset only where there is a legally enforceable right to offset current tax assets against current tax liabilities and deferred tax assets against deferred tax liabilities; and they relate to the same taxable authority on either the same taxable entity or different taxable entities which intend to settle simultaneously. Deferred tax assets are recognised for deductible temporary differences and losses only if the Group considers it is probable that future taxable amounts will be available to utilise those temporary differences and losses.
For
per
sona
l use
onl
y

Notes to the financial statements (continued)
31
Note 5. INCOME TAX (continued) Recoverability of deferred tax assets The Group has recorded a deferred tax asset relating to the future benefit of tax losses of $25,442,000 (2019: $1,261,000). The Group assesses the impairment of deferred tax assets by taking into account its projected profitability over the foreseeable future and hence its ability to recover the value of the deferred tax asset by reducing future liabilities for income tax. Management’s forecasts project that the deferred tax asset is fully recoverable based on the below: - A growth in sales in the 2021 and future financial years - Continuation of the tight cost management and inventory intake strategies which has proven to be successful over the past 6 years
Where actual results are lower than expectations as described above a proportion of the deferred tax asset may not be used, and a write-off of the deferred tax asset may be required. Tax consolidation Mosaic Brands Limited (the ‘head entity’) and its wholly-owned Australian controlled entities formed an income tax consolidated group under the tax consolidation regime as of 1 July 2005. The head entity and the controlled entities in the tax consolidated group continue to account for their own current and deferred tax amounts. In addition to its own current and deferred amount, the head entity also recognises the current tax assets/liabilities of each subsidiary in the tax consolidated group. The entities have also entered into a tax funding agreement under which the wholly-owned entities fully compensate Mosaic Brands Limited for any current tax payable and are compensated by Mosaic Brands Limited for any current tax receivable and deferred tax assets relating to unused tax losses or unused tax credits that are determined by reference to the amounts recognised in the wholly-owned entities’ financial statements. Consolidated Group
2020 2019
$000 $000
‘Note 6. CASH AND CASH EQUIVALENTS
Cash at bank and on hand 86,928 36,684
Recognition and measurement Cash and cash equivalents include cash on hand, deposits held at call with financial institutions, other short-term highly liquid investments with original maturities and bank overdrafts. Bank overdrafts are reported within borrowings in current liabilities on the statement of financial position. ‘Note 7. OTHER RECEIVABLES
CURRENT
Sundry debtors 5,633 5,484
Government grants 17,507 -
23,140 5,484
Recognition and measurement Sundry debtors include amounts due from repeat customers, suppliers and landlord contributions. Government grants include amounts payable to the Group as a result of the COVID-19 pandemic. Receivables expected to be collected within 12 months of the end of the reporting period are classified as current assets. All other receivables are classified as non-current assets and are subsequently measured at amortised cost which have not been discounted.
Note 8. INVENTORIES CURRENT
Finished goods at cost, net of obsolescence and shrinkage 102,329 166,951
102,329 166,951
Recognition and measurement Inventories are measured at the lower of cost and net realisable value. Costs are assigned on a first-in first-out basis. Cost comprises all costs of purchase and conversion and an appropriate proportion of fixed and variable overheads, net of settlement discounts. Net realisable value is the estimated selling price in the ordinary course of business less the estimated costs of completion and the estimated costs necessary to make the sale.
For
per
sona
l use
onl
y
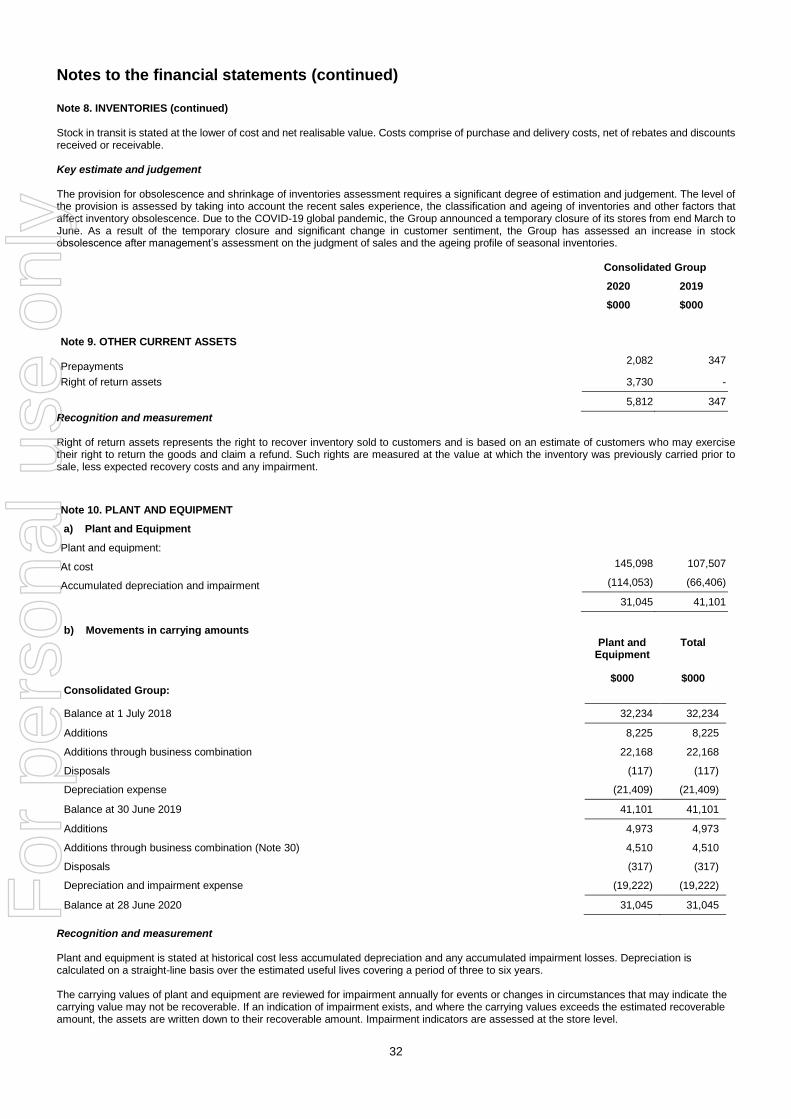
Notes to the financial statements (continued)
32
Note 8. INVENTORIES (continued) Stock in transit is stated at the lower of cost and net realisable value. Costs comprise of purchase and delivery costs, net of rebates and discounts received or receivable. ‘ Key estimate and judgement The provision for obsolescence and shrinkage of inventories assessment requires a significant degree of estimation and judgement. The level of the provision is assessed by taking into account the recent sales experience, the classification and ageing of inventories and other factors that affect inventory obsolescence. Due to the COVID-19 global pandemic, the Group announced a temporary closure of its stores from end March to June. As a result of the temporary closure and significant change in customer sentiment, the Group has assessed an increase in stock obsolescence after management’s assessment on the judgment of sales and the ageing profile of seasonal inventories. Consolidated Group
2020 2019
$000 $000 Note 9. OTHER CURRENT ASSETS
Prepayments
2,082 347
Right of return assets 3,730 -
5,812 347
Recognition and measurement Right of return assets represents the right to recover inventory sold to customers and is based on an estimate of customers who may exercise their right to return the goods and claim a refund. Such rights are measured at the value at which the inventory was previously carried prior to sale, less expected recovery costs and any impairment.
Note 10. PLANT AND EQUIPMENT
‘a) Plant and Equipment
Plant and equipment:
At cost 145,098 107,507
Accumulated depreciation and impairment (114,053) (66,406)
31,045 41,101
b) Movements in carrying amounts Plant and
Equipment Total
$000 $000 Consolidated Group:
Balance at 1 July 2018 32,234 32,234
Additions 8,225 8,225
Additions through business combination 22,168 22,168
Disposals (117) (117)
Depreciation expense (21,409) (21,409)
Balance at 30 June 2019 41,101 41,101
Additions 4,973 4,973
Additions through business combination (Note 30) 4,510 4,510
Disposals (317) (317)
Depreciation and impairment expense (19,222) (19,222)
Balance at 28 June 2020 31,045 31,045
Recognition and measurement Plant and equipment is stated at historical cost less accumulated depreciation and any accumulated impairment losses. Depreciation is calculated on a straight-line basis over the estimated useful lives covering a period of three to six years. The carrying values of plant and equipment are reviewed for impairment annually for events or changes in circumstances that may indicate the carrying value may not be recoverable. If an indication of impairment exists, and where the carrying values exceeds the estimated recoverable amount, the assets are written down to their recoverable amount. Impairment indicators are assessed at the store level.
For
per
sona
l use
onl
y
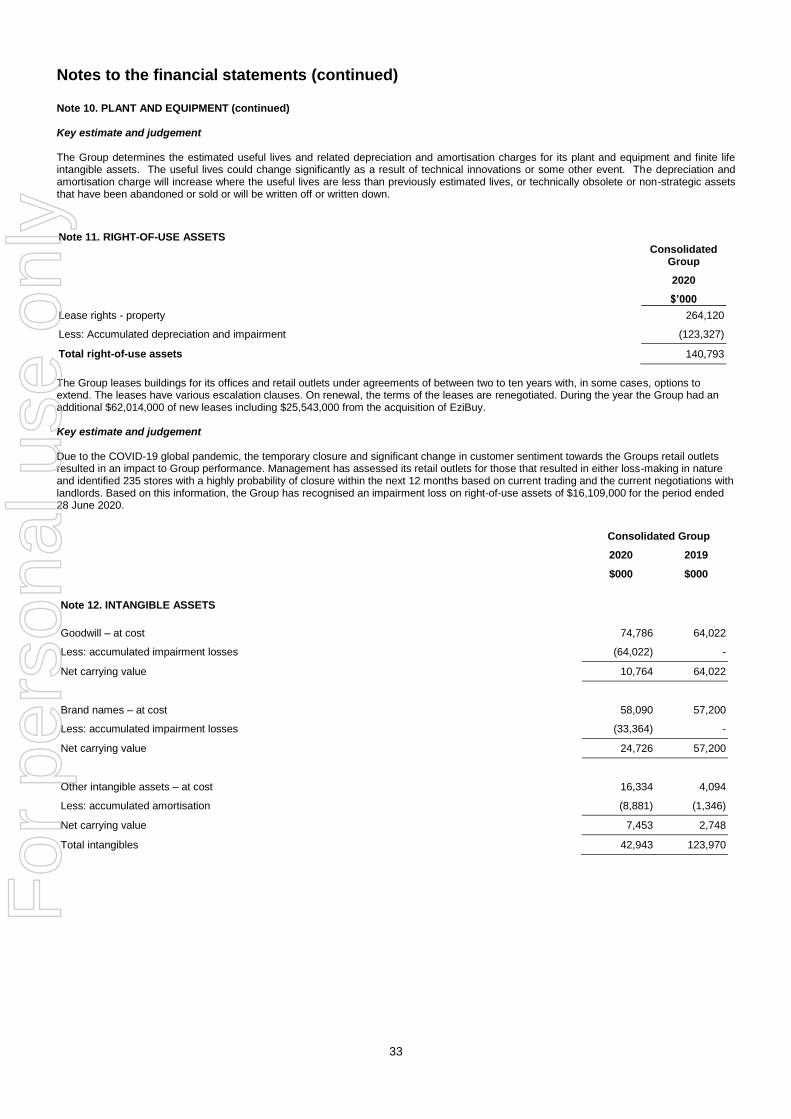
Notes to the financial statements (continued)
33
Note 10. PLANT AND EQUIPMENT (continued) Key estimate and judgement The Group determines the estimated useful lives and related depreciation and amortisation charges for its plant and equipment and finite life intangible assets. The useful lives could change significantly as a result of technical innovations or some other event. The depreciation and amortisation charge will increase where the useful lives are less than previously estimated lives, or technically obsolete or non-strategic assets that have been abandoned or sold or will be written off or written down.
Note 11. RIGHT-OF-USE ASSETS
Consolidated
Group
2020
$’000
Lease rights - property 264,120
Less: Accumulated depreciation and impairment (123,327)
Total right-of-use assets 140,793
The Group leases buildings for its offices and retail outlets under agreements of between two to ten years with, in some cases, options to extend. The leases have various escalation clauses. On renewal, the terms of the leases are renegotiated. During the year the Group had an additional $62,014,000 of new leases including $25,543,000 from the acquisition of EziBuy. Key estimate and judgement Due to the COVID-19 global pandemic, the temporary closure and significant change in customer sentiment towards the Groups retail outlets resulted in an impact to Group performance. Management has assessed its retail outlets for those that resulted in either loss-making in nature and identified 235 stores with a highly probability of closure within the next 12 months based on current trading and the current negotiations with landlords. Based on this information, the Group has recognised an impairment loss on right-of-use assets of $16,109,000 for the period ended 28 June 2020.
Consolidated Group
2020 2019
$000 $000
Note 12. INTANGIBLE ASSETS
Goodwill – at cost 74,786 64,022
Less: accumulated impairment losses (64,022) -
Net carrying value 10,764 64,022
Brand names – at cost 58,090 57,200
Less: accumulated impairment losses (33,364) -
Net carrying value 24,726 57,200
Other intangible assets – at cost 16,334 4,094
Less: accumulated amortisation (8,881) (1,346)
Net carrying value 7,453 2,748
Total intangibles 42,943 123,970
For
per
sona
l use
onl
y
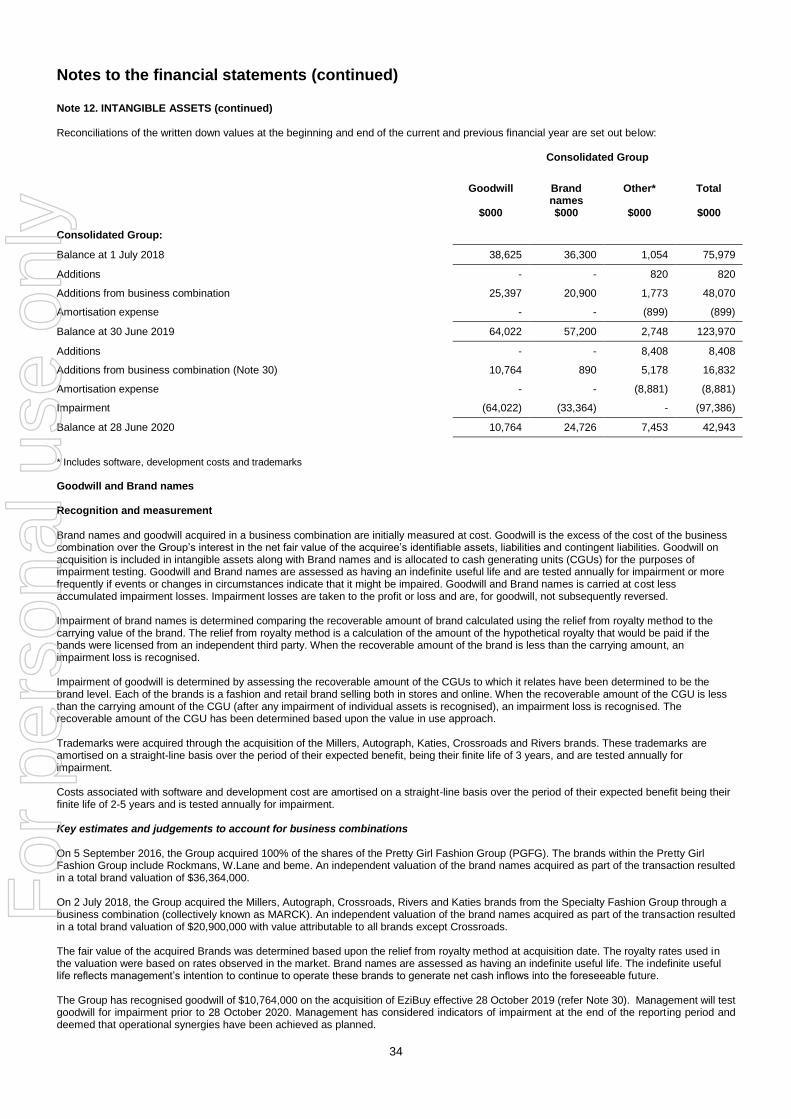
Notes to the financial statements (continued)
34
Note 12. INTANGIBLE ASSETS (continued) Reconciliations of the written down values at the beginning and end of the current and previous financial year are set out below: Consolidated Group
Goodwill Brand names
Other* Total
$000 $000 $000 $000
Consolidated Group:
Balance at 1 July 2018 38,625 36,300 1,054 75,979
Additions - - 820 820
Additions from business combination 25,397 20,900 1,773 48,070
Amortisation expense - - (899) (899)
Balance at 30 June 2019 64,022 57,200 2,748 123,970
Additions - - 8,408 8,408
Additions from business combination (Note 30) 10,764 890 5,178 16,832
Amortisation expense - - (8,881) (8,881)
Impairment (64,022) (33,364) - (97,386)
Balance at 28 June 2020 10,764 24,726 7,453 42,943
* Includes software, development costs and trademarks
Goodwill and Brand names Recognition and measurement Brand names and goodwill acquired in a business combination are initially measured at cost. Goodwill is the excess of the cost of the business combination over the Group’s interest in the net fair value of the acquiree’s identifiable assets, liabilities and contingent liabilities. Goodwill on acquisition is included in intangible assets along with Brand names and is allocated to cash generating units (CGUs) for the purposes of impairment testing. Goodwill and Brand names are assessed as having an indefinite useful life and are tested annually for impairment or more frequently if events or changes in circumstances indicate that it might be impaired. Goodwill and Brand names is carried at cost less accumulated impairment losses. Impairment losses are taken to the profit or loss and are, for goodwill, not subsequently reversed. Impairment of brand names is determined comparing the recoverable amount of brand calculated using the relief from royalty method to the carrying value of the brand. The relief from royalty method is a calculation of the amount of the hypothetical royalty that would be paid if the bands were licensed from an independent third party. When the recoverable amount of the brand is less than the carrying amount, an impairment loss is recognised. Impairment of goodwill is determined by assessing the recoverable amount of the CGUs to which it relates have been determined to be the brand level. Each of the brands is a fashion and retail brand selling both in stores and online. When the recoverable amount of the CGU is less than the carrying amount of the CGU (after any impairment of individual assets is recognised), an impairment loss is recognised. The recoverable amount of the CGU has been determined based upon the value in use approach. Trademarks were acquired through the acquisition of the Millers, Autograph, Katies, Crossroads and Rivers brands. These trademarks are amortised on a straight-line basis over the period of their expected benefit, being their finite life of 3 years, and are tested annually for impairment. Costs associated with software and development cost are amortised on a straight-line basis over the period of their expected benefit being their finite life of 2-5 years and is tested annually for impairment. Key estimates and judgements to account for business combinations On 5 September 2016, the Group acquired 100% of the shares of the Pretty Girl Fashion Group (PGFG). The brands within the Pretty Girl Fashion Group include Rockmans, W.Lane and beme. An independent valuation of the brand names acquired as part of the transaction resulted in a total brand valuation of $36,364,000. On 2 July 2018, the Group acquired the Millers, Autograph, Crossroads, Rivers and Katies brands from the Specialty Fashion Group through a business combination (collectively known as MARCK). An independent valuation of the brand names acquired as part of the transaction resulted in a total brand valuation of $20,900,000 with value attributable to all brands except Crossroads. The fair value of the acquired Brands was determined based upon the relief from royalty method at acquisition date. The royalty rates used in the valuation were based on rates observed in the market. Brand names are assessed as having an indefinite useful life. The indefinite useful life reflects management’s intention to continue to operate these brands to generate net cash inflows into the foreseeable future. The Group has recognised goodwill of $10,764,000 on the acquisition of EziBuy effective 28 October 2019 (refer Note 30). Management will test goodwill for impairment prior to 28 October 2020. Management has considered indicators of impairment at the end of the reporting period and deemed that operational synergies have been achieved as planned.
For
per
sona
l use
onl
y
Notes to the financial statements (continued)
35
Note 12. INTANGIBLE ASSETS (continued) Impairment indicators At the beginning of the financial year the recoverable amount of the brands and goodwill were in excess of the carrying value. During the course of the financial year the COVID-19 global pandemic has had broad reaching economic consequences which have created market uncertainty and the retail industry has been impacted particularly hard. The impacts have included the closure of all stores for safety reasons from the end of March and this has contributed to a downward trend in both Revenue and Gross Margin year on year and financial performance below budget. A market capitalisation deficiency also existed at the end of the reporting period. On the basis of these factors management determined that impairment losses should be recognised totalling $33,364,000 and $64,022,000 for brand names and goodwill respectively (2019: nil). More detail on the calculation of these impairment losses is included below. Determination of key assumptions and inputs EBITDA margin Management has prepared cash flow forecasts for a four-year period derived from the approved budget for FY21. These forecasts include assumptions around sales prices and volumes and operating costs. Management assesses the reasonableness of its forecasting by reviewing historical cash flow and projections as well as future growth objectives. Risk adjusted discount rates The discount rates are derived from the Group’s weighted average cost of capital as adjusted for the specific risks related to each CGU. Long-term growth rate To forecast beyond the discrete cash flow forecast period into perpetuity, a long-term average growth rate is used. To establish an appropriate rate, management considers long-term inflation and GDP forecasts and adjusts for industry specific impacts. Royalty rate Royalty rates have been reviewed by management with reference to the rates which were determined on initial recognition of the brands. Where considered necessary these rates have been revised to factor in subsequent changes in the economic environment that impact the ability of a market participant to derive the same level of royalties. Sensitivity analysis The results of the Group’s impairment tests are dependent upon estimates and judgements made by management, particularly in relation to the key assumptions described above. A reasonably possible change in key assumptions could lead to a change of the amount of impairment recognised by the Group. The Group has therefore conducted an analysis of the sensitivity of the impairment test to changes in the key assumptions used to determine the recoverable amount for each brand name to which goodwill is allocated. This is included below. Impairment of brand names The relief from royalty calculation is based on the cash flow projections as at June 2020 for a period of four years. The key assumptions utilised within the model are:
Cash flow projections based on the FY2021 budget approved by the board and projected for a further three years based on growth rates estimated by management of 3.5% to 14.0% in FY2022 and 2.0% to 4.5% in FY2023 and FY2024 (2019: 1% to 1.5%). The variation across the range reflects different stages of brand growth. The growth rates between FY2020 and FY2021 are comprised between 4.5% to 37.6% noting that Mosaic is operating in a highly dynamic environment. The growth rate range is significantly higher than in the prior year to reflect that current year performance has been impacted the economic conditions resulting from COVID-19 and reflects forecast growth as the business works back to levels more akin to those in FY19.
A terminal growth rate of 1% (2019: 1%)
A tax rate applied of 30% is based on the corporate tax rate in Australia (2019: 30%)
Royalty rates and post-tax discount rates are included within the table below:
Royalty rate Post-tax discount rate
2020 2019 2020 2019
Rockmans 1.0% 2.0% 17.0% 14.0%
beme 2.0% 3.0% 17.0% 16.0%
W Lane 1.5% 2.5% 17.0% 15.0%
Millers 0.5% 0.5% 17.5% 16.5%
Autograph 1.0% 1.5% 17.5% 16.5%
Rivers 0.5% 1.0% 17.5% 16.5%
Katies 0.5% 0.8% 17.5% 16.5%
For
per
sona
l use
onl
y
Notes to the financial statements (continued)
36
Note 12. INTANGIBLE ASSETS (continued) The reconciliation of the carrying values of the brands at the beginning and end of the current and previous financial year is set out below: Rockmans W Lane beme Millers Autograph Rivers Katies Total
$000 $000 $000 $000 $000 $000 $000 $000
Balance at 1 July 2018 19,400 10,000 6,900 - - - - 36,300
Additions from business combinations
- - - 4,700 4,200 8,600 3,400 20,900
Balance at 30 June 2019 19,400 10,000 6,900 4,700 4,200 8,600 3,400 57,200
Impairment expense (11,989) (6,647) (5,443) (818) (1,736) (5,264) (1,467) (33,364)
Balance at 28 June 2020 7,411 3,353 1,457 3,882 2,464 3,336 1,933 23,836
Impact on recoverable amount of the following changes in assumptions:
- 1% increase in discount rate (413) (189) (82) (209) (133) (180) (104)
- 1% decrease in discount rate 468 214 93 236 150 203 118
- 0.5% (PGFG)/ 0.25% (MARCK) increase in royalty rate
3,706 1,118 364 1,941 616 1,668 966
- 0.5% (PGFG)/ 0.25% (MARCK) decrease in royalty rate
(3,706) (1,118) (364) (1,941) (616) (1,668) (966)
Impairment of goodwill The fair value calculation is based on the cash flow projections as at June 2020 for a period of four years. The cash flow projections are based on the FY2021 budget that has been approved by the board and are projected for a further three years based on growth rates estimated by management of 3.1% - 3.3% (2019: 0.2% to 2%) and a terminal growth rate of 1% (2019: 1%). The tax rate applied in the valuation model is based on the corporate tax rate in Australia of 30% (2019: 30%). The post-tax discount rates applied to the cash flow projections are within a range of 16.5% and 17.0% (2019:15.0% and 15.5%). The reconciliation of the carrying values of goodwill at the beginning and end of the current and previous financial year is set out below:
Rockmans W Lane beme Millers Autograph Rivers Katies Total
$000 $000 $000 $000 $000 $000 $000 $000
Balance at 1 July 2018 20,643 10,640 7,342 - - - - 38,625
Additions from business combinations - - - 5,710 5,104 10,451 4,132 25,397
Balance at 30 June 2019 20,643 10,640 7,342 5,710 5,104 10,451 4,132 64,022
Impairment expense (20,643) (10,640) (7,342) (5,710) (5,104) (10,451) (4,132) (64,022)
Balance at 28 June 2020 - - - - - - - -
No reasonably possible change in the key assumptions could result in an increase in the amount of impairment recognised in respect of goodwill because it has been written down to zero for all CGUs. This table excludes Ezibuy. Management will test EziBuy goodwill for impairment prior to 28 October 2020. Management has considered indicators of impairment at the end of the reporting period and deemed that operational synergies have been achieved as planned.
For
per
sona
l use
onl
y

Notes to the financial statements (continued)
37
Consolidated Group
2020 2019
$000 $000
Note 13. TRADE AND OTHER PAYABLES
Trade payable 141,889 72,724
Accruals 35,506 23,107
Stock in transit 17,176 32,165
Sundry payables 43,170 69,294
Contract and customer liabilities 9,340 1,312
247,081 198,602
Recognition and measurement Trade and other payables represent the liabilities for goods and services received by the Group that remain unpaid at the end of the reporting period. The balance is recognised as a current liability with the amounts normally paid within 30 - 90 days of recognition of the liability. Due to the short-term nature they are measured at amortised cost and are not discounted. As a result of the ongoing COVID-19 pandemic and its uncertainty, the Group re-negotiated and extended payment terms with its key trade payable suppliers. Contract liabilities represents managements’ best estimate of the future outflow of economic benefits in respect of products sold. The refund liability is estimated based on historical sales claim information, sales levels and any recent trends that may suggest future claims could differ from historical amounts. Key estimate and judgement Contract liabilities are calculated based on historical sales claim information, sales levels and any trends that may suggest future liabilities could differ from historical amounts. The Group operates a loyalty program where customers accumulate points for purchases made which entitles them to discounts on future purchases. This is recognised as a customer loyalty provision within sundry payables and is based on (i) loyalty events and (ii) an estimate of the loyalty redemption by the loyalty customers. The estimate considers historical experience and other factors relevant to customer spending.
For
per
sona
l use
onl
y

Notes to the financial statements (continued)
38
Consolidated Group
2020 2019
$000 $000
Note 14. BORROWINGS
CURRENT
Secured liabilities:
Commercial hire purchase liabilities 16 -
Bank loans 28,974 -
Loans from related parties 12,512 -
Total current borrowings 41,502 -
NON-CURRENT
Secured liabilities:
Bank loans 44,989 29,482
Total non-current borrowings 44,989 29,482
Bank loans are recognised at the fair value of the consideration less directly attributable transaction costs and are due in July 2021. Fees paid on establishment of loan facilities are amortised over the term of the facility. At 28 June 2020, the Group had total outstanding loans and borrowings of $86,491,000 (2019: $20,000,000) of which $74,105,000 was from bank loans and $12,512,000 was provided as loans from related parties. At reporting date, bank loan facilities of $106,500,000 were available to the Group (2019: $31,000,000). Of this facility, $19,895,000 was unused (2019: $1,200,000). Bank loans are secured by both the warehouse inventory and a general security deed which is a fixed and floating charge over the business. The related party loans are due in December 2020. Interest of 0-9% is charged on the loans. Recognition and measurement Borrowing costs are directly attributable to the loan. They are subsequently measured at amortised costs using the effective interest method. Finance facilities The following lines of credit were available at reporting date:
Amount of credit facilities available
Bank card 500 400
Market rate facility 88,000 31,000
Related party finance facilities (Note 26) 18,500 -
Bank guarantees and lines of credit 6,835 2,235
Total 113,835 33,635
Amount of credit facilities unused
Bank card 329 210
Market rate facility 13,895 1,200
Related party finance facilities (Note 26) 6,000 -
Bank guarantees and lines of credit 4,835 235
Total 25,059 1,645
The bank loans and finance facilities available contain specific financial covenants which the Group is required to meet. Due to the impact of the COVID-19 pandemic, the Group was able to seek amendments and a non-test of its covenant compliance. This resulted in the Group classifying bank loans as non-current for the period ending 28 June 2020. The bank loans have a maturity date of 6 July 2021.
For
per
sona
l use
onl
y
Notes to the financial statements (continued)
39
Consolidated Group
2020 2019
$000 $000
Note 15. PROVISIONS
Current
Employee benefits 23,469 21,720
Other provisions 5,643 7,369
Total current provisions 29,112 29,089
Non-current
Employee benefits 2,828 2,565
Other provisions - 1,862
Total non-current provisions 2,828 4,427
Movements in provisions during the current financial year, other than employee benefits, are set out below:
Onerous Lease make Bonus Total
lease good
$000 $000 $000 $000
Consolidated Group:
Carrying amount at 1 July 2019 5,743 488 3,000 9,231
Additional provisions recognised - 5,643 - 5,643
Amounts recognised as part of AASB 16 adoption adjustment (5,743) - - (5,743)
Amounts reversed - - (3,000) (3,000)
Amounts used - (488) - (488)
Carrying amount at the end of the year - 5,643 - 5,643
Other long-term employee benefits Recognition and measurement Provision for employee benefits represents amounts accrued for annual leave and long service leave. The current portion for this provision includes the total amount accrued for annual leave entitlements and the amounts accrued for long service leave entitlements that have vested due to employees having completed the required period of service. Based on past experience, the Group does not expect the full amount of annual leave or long service leave balances classified as current liabilities to be settled within the next 12 months. However, these amounts must be classified as current liabilities since the Group does not have an unconditional right to defer the settlement of these amounts in the event employees wish to use their leave entitlement. The amount that is not expected to be taken within the next twelve months including on costs is $8,690,000 (2019: $8,270,000). Long-term benefits are benefits (other than termination benefits) that are not expected to be settled wholly within 12 months after the end of the annual reporting period in which the employees render the related service. Other long-term employee benefits are measured at the present value of the expected future payments to be made to employees. Expected future payments incorporate anticipated future wage and salary levels, durations of service and employee departures and are discounted at rates determined by reference to market yields at the end of the reporting period on government bonds that have maturity dates that approximate the terms of the obligations. Any remeasurements for changes in assumptions of obligations for other long-term employee benefits are recognised in profit or loss in the periods in which the changes occur. The non-current portion for this provision includes amounts accrued for long service leave entitlements that have not yet vested in relation to those employees who have not yet completed the required period of service. Key estimate and judgement The liability for long service leave is recognised and measured at the present value of the estimated future cash flows to be made in respect of all employees at the reporting date. In determining the present value of the liability, estimates of attrition rates and pay increases through promotion and inflation have been taken into account.
For
per
sona
l use
onl
y
Notes to the financial statements (continued)
40
Note 15. PROVISIONS (continued)
Provisions Provisions are recognised when the Group has a legal or constructive obligation, as a result of past events, for which it is probable that an outflow of economic benefits will result and that outflow can be reliably measured. Provisions are measured using the best estimate of the amounts required to settle the obligation at the end of the reporting period. Other provisions include: Onerous lease The provision represents leases with unavoidable costs of meeting the lease for which the costs of meeting the obligations exceed the economic benefits expected to be received. Lease make good The provision represents the present value of the estimated costs to make good the store closures for the premises leased by the Group. Bonus The provision represents the estimated amount to be paid to team members. Due to the impact of the Coronavirus (COVID-19) pandemic the Board has not approved and provisioned any bonus to be paid for the 2020 financial year.
Consolidated Group
2020 2019
$000 $000 ‘
Note 16. DERIVATIVE FINANCIAL INSTRUMENTS
Forward exchange contracts
28 33
Interest rate swaps 506 537
534 570
Refer to note 23 for further information on financial instruments.
Note 17. LEASE LIABILITIES
Consolidated Group
2020
$000
CURRENT
Lease liability 87,544
NON-CURRENT
Lease liability 111,013
Total lease liabilities 198,557
For
per
sona
l use
onl
y

Notes to the financial statements (continued)
41
Consolidated Group
2020 2019
$000 $000 ‘
Note 18. OTHER LIABILITIES
CURRENT
Fitout contributions and lease incentives 95 8,908
95 8,908
NON-CURRENT
Fitout contributions and lease incentives 110 15,489
110 15,489
Deferred lease incentives The liability represents operating lease incentives received. The incentives are allocated to the profit and loss on a straight-line basis over the lease term. Note 19. DEFERRED CONSIDERATION Deferred consideration
9,580 -
9,580 -
As part of the purchase of EziBuy from Alceon Retail, it was agreed that as part of the nominal consideration of $1 for a 50.1% economic interest, the buyer will be entitled to exercise an option over the remaining 49.9% equity interest at an exercise price of $11,000,000 on or prior to 31 December 2020. The 49.9% is considered by the Group as a present ownership interest and the option exercise price included in the fair value of the deferred consideration recorded at the date of acquisition (refer Note 30). The $11,000,000 exercise price has been discounted and adjusted for cash acquired and related loans to arrive at the deferred consideration balance. Note 20. ISSUED CAPITAL Fully paid ordinary shares
Balance at the beginning of the financial year 107,605 107,651
Issue of shares 429 -
Less transaction costs - (46)
Ordinary shares 108,034 107,605
NO. NO.
Balance at the beginning of the financial period 96,914,779 96,361,245
Issue of shares during the period (i) 148,151 845,000
Share buy-back (ii) (250,000) (291,466)
Balance at the end of the financial period 96,812,930 96,914,779
‘ (i) a total of 148,151 performance shares were issued during the period from escrow. (ii) 250,000 shares were issued to Senior Management however they were cancelled by the Company during the year. ‘ Ordinary shares Ordinary shares are classified as equity and entitle the holder to participate in dividends and the proceeds on the winding up of the Group in proportion to the number of and amounts paid on the shares held. The fully paid ordinary shares have no par value and the Group does not have a limited amount of authorised capital. On a show of hands every member present at a meeting in person or by proxy shall have one vote and upon a poll each share shall have one vote. Incremental costs directly attributable to the issue of new shares are shown in equity as a deduction, net of tax, from proceeds.
For
per
sona
l use
onl
y

Notes to the financial statements (continued)
42
Consolidated Group
2020 2019
$000 $000
NOTE 21. RESERVE
Reserves comprise:
Equity reserve 4,077 3,723
Foreign currency translation reserve 154 31
Dividend profit reserve 13,637 5,667
Total reserves 17,868 9,421
Equity reserve The equity reserve is used to record the value of the share based payments provided to employees. In accordance to the Rules of the Director and Senior Management Share Plan, dividends paid on the Plan Shares will be applied to the value of shares. The dividend amount which was applied to the Plan Shares during the 2020 Financial Year was $88,000 (2019: $199,000) and this amount was not paid in cash. Foreign currency translation reserve The foreign currency translation reserve is used to record the exchange differences arising from translation of the financial statements of foreign operations to Australian dollars. Dividend profit reserve To the extent that any current year profits are not distributed as dividends, the Group may set aside some or all of the undistributed profits to a separate dividend profit reserve to facilitate the payment of future dividends, rather than maintaining these profits within accumulated losses. During the year the Directors decided to transfer the profit for the period ended 29 December 2019 of $13,301,000 (2019: $8,130,000) to the dividend profit reserve which will enable the declaration of a future dividend. The transfer into the dividend profit reserve was recorded based on the profit recognised for the period ended 29 December 2019. No dividend has been declared or paid since 28 December 2019. The Directors consider the requirements of s254T of the Corporations Act in the declaration of dividends. Note 22. DIVIDENDS PAID
Dividends
Consolidated Group
2020 2019
Cents
per share
Date of payment
Total amount
$000
Cents per
share
Date of payment
Total amount
$000
Current year interim - - - 9.0 22/03/2019 8,722
Prior year final 5.5 24/10/2019 5,331 4.0 12/10/2018 3,853
5,331 12,575
All dividends are fully franked at a 30% tax rate.
Due to the impact and ongoing uncertainty caused by the COVID-19 pandemic the Board of Directors have decided to take a prudent approach and not declare a final dividend to be paid from the dividend profit reserve. Franking credits
Consolidated Group
2020 2019
$000 $000
Franking credits available for future financial years (tax paid basis, 30% tax rate) 12,307 15,060
The above amount represents the balance of the franking account as at the end of the financial year, adjusted for:
Franking credits that will arise from the payment of the amount of the provision for income tax at the reporting date Franking debits that will arise from the payment of dividends recognised as a liability at the reporting date Franking credits that will arise from the receipt of dividends recognised as receivables at the reporting date
For
per
sona
l use
onl
y
Notes to the financial statements (continued)
43
Note 23. FINANCIAL RISK MANAGEMENT Capital Risk Management Management controls the capital of the Group in order to maintain a sustainable debt to equity ratio, generate long-term shareholder value and ensure that the Group can fund its operations and continue as a going concern. The Group’s debt and capital include ordinary share capital and financial liabilities, supported by financial assets. The Group is not subject to any externally imposed capital requirements. Management effectively manages the Group’s capital by assessing the Group’s financial risks and adjusting its capital structure in response to changes in these risks and in the market. These responses include the management of debt levels, distributions to shareholders and share issues. There have been no changes in the strategy adopted by management to control the capital of the Group since the prior year. The gearing ratios for the years ended 28 June 2020 and 30 June 2019 are as follows:
Total debt of $86,491,000 predominately consists of $14,155,000 for the JobKeeper bridging facility which is repaid monthly on receipt of the Government grants, the working capital facility of $39,950,000 and the Groups $20,000,000 for the long-term facility. Total debt for the year also includes loans from related parties of $12,512,000 for EziBuy see note 14. Financial Risk Management Policies The Board monitors the Group’s financial risk management policies and exposures and approves financial transactions within the scope of its authority. It also reviews the effectiveness of internal controls relating to commodity price risk, counterparty credit risk, currency risk, liquidity risk, and interest rate risk. The Boards overall risk management strategy seeks to assist the Group in meeting its financial targets, while minimising potential adverse effects on financial performance. Its functions include the review of the use of hedging derivative instruments, credit risk policies and future cash flow requirements. Specific Financial Risk Exposures and Management The main risks the Group is exposed to through its financial instruments are credit risk, liquidity risk, and market risk consisting of interest rate risk, foreign currency risk and other price risk (commodity and equity price risk). There have been no substantive changes in the types of risks the Group is exposed to, how these risks arise, or the Board’s objectives, policies and processes for managing or measuring the risks from the previous period. Credit Risk Credit risk refers to the risk that a counterparty will default on its contractual obligations resulting in financial loss to the Group. Credit risk arises from cash and cash equivalents, derivatives and deposits with banks. As sales to retail customers are settled in cash or using major credit cards within 24 hours, the Group is mitigated from any material credit risk exposure to any single debtor or group of debtors. Current trade account receivables are non-interest bearing loans and are generally on 45 day terms. Market Risk Foreign currency risk The Group undertakes certain transactions denominated in foreign currency and is exposed to foreign currency risk through foreign exchange rate fluctuations. Foreign exchange risk arises from future commercial transactions and recognised financial assets and financial liabilities denominated in a currency that is not the entity's functional currency. The risk is measured using sensitivity analysis and cash flow forecasting. In order to protect against exchange rate movements, the Group has entered into forward foreign exchange contracts. These contracts are hedging highly probable forecasted cash flows for the ensuing financial year. The contracts are timed to mature when payments for certain shipments of inventory are scheduled to be made. The fair value of forward exchange contracts is determined using forward exchange market rates at reporting date. The maturity, settlement amounts and the average contractual exchange rates of the Group's outstanding forward foreign exchange contracts at the reporting date was as follows:
Consolidated Group
Note 2020 $000
2019 $000
Total debt 14 86,491 29,482
Total equity (80,309) 106,122
Total capital 6,182 135,604
Gearing ratio 1,399.1% 21.7%
For
per
sona
l use
onl
y

Notes to the financial statements (continued)
44
Note 23. FINANCIAL RISK MANAGEMENT (continued)
Sell AUD dollars Average Exchange Rate
2020 2019 2020 2019
$000 $000 $ $
Buy US dollars
Maturity:
Less than 1 year 47,829 158,851 0.6841 0.7028
The derivatives that are not effective accounting hedges are measured at fair value through profit or loss. Price risk The Group is not exposed to any significant price risk. Interest Rate Risk The Group’s main interest rate risk arises from loans and borrowings. Borrowings with variable rates expose the Group to interest rate risk with borrowings issued at fixed rates exposing the Group to fair value interest risk. The Group currently has interest swaps in order to reduce the exposure to interest rate risk. As at the reporting date, the Group had the following interest rate borrowings outstanding:
Loan Balance Average Interest Rate
2020 2019 2020 2019
$000 $000 % %
Commercial hire purchase 16 - 6.21% -
Bank loans 73,963 29,482 3.12% 4.23% Loans from related parties 12,512 - 8.37% -
Liquidity risk Liquidity risk arises from the possibility that the Group might encounter difficulty in settling its debts or otherwise meeting its obligations related to financial liabilities. The Group manages liquidity risk by maintaining adequate cash reserves and available borrowing facilities by continuously monitoring actual and forecast cash flows. At reporting date, bank loan facilities of $106,500,000 were available to the Group (2019: $31,000,000). Of this facility, $19,895,000 was unused (2019: $1,200,000). The following table reflects the Groups financial liabilities, net and gross settled derivative financial instruments into relevant maturity groupings based on the remaining period at the reporting date to the contractual maturity date. The amounts disclosed in the table are the contractual undiscounted cash flows. The tables include both principal and interest cash flows disclosed as remaining contractual maturit ies and therefore the totals may differ from their carrying amount in the statement of financial position.
‘ Consolidated Group
2020 2019 $000 $000
Maturity < 1 month 134,078 138,587
Maturity 1 – 3 months 94,539 49,493
Maturity 3 – 12 months 151,826 10,522
Maturity > 1 year 161,955 29,800
542,398 228,402
Financial liabilities above include undiscounted lease liabilities payable by the Group. F
or p
erso
nal u
se o
nly
Notes to the financial statements (continued)
45
Note 23. FINANCIAL RISK MANAGEMENT (continued) Fair Value of financial instruments AASB 13, fair value measurement requires the disclosure of fair value information by level of the fair value hierarchy, which categorises fair value measurements into one of three possible levels based on the lowest level that an input that is significant to the measurement can be categorised into as follows: Level 1 – the fair value is calculated using quoted price in active markets for identical assets or liabilities. Level 2 – the fair value is estimated using inputs other than quoted prices included in Level 1 that are observable for the asset or liability, either directly (as prices) or indirectly (derived from prices). Level 3 – the fair value is estimated using inputs for the asset or liability that are not based on observable market data. The fair values of assets and liabilities that are not traded in an active market are determined using one or more valuation techniques. These valuation techniques maximise, to the extent possible, the use of observable market data. If all significant inputs required to measure fair value are observable, the asset or liability is included in Level 2. If one or more significant inputs are not based on observable market data, the asset or liability is included in Level 3. Valuation techniques The Group selects a valuation technique that is appropriate for the circumstances. The valuation technique on the derivatives is based on quoted mark to market data provided by the bank. There has been no movement between levels and no changes in valuation techniques.
The following tables provide the fair values of the Group’s assets and liabilities measured and recognised on a recurring basis after initial recognition and their categorisation within the fair value hierarchy:
Level 1 Level 2 Level 3 Total
2020 2019 2020 2019 2020 2019 2020 2019
$000 $000 $000 $000 $000 $000 $000 $000
Recurring fair value measurements
Derivatives (Liability) held for hedging:
‘ - Forward exchange forward contracts - - (28) (33) - - (28) (33)
‘ - Interest swaps - - (506) (537) - - (506) (537)
Total liabilities recognised at fair value - - (534) (570) - - (534) (570)
Note 24. KEY MANAGEMENT PERSONNEL Information regarding individual key management personnel (KMP), shareholdings of key management personnel, as well as other transactions and balances with key management personnel and their related parties, as required by Regulation 2M.3.03 of the Corporations Regulations 2001 is provided in the Remuneration Report section of the Directors’ Report. Directors The following persons were Directors of Mosaic Brands Limited during the financial year
Richard Facioni Chairman Scott Evans Chief Executive Officer Sue Morphet Non-Executive Director David Wilshire Non-Executive Director Jacqueline Frank Non-Executive Director
Other key management personnel The following persons also had the authority and responsibility for planning, directing and controlling the major activities of the Group directly or indirectly, during the financial year:
Luke Softa Chief Financial Officer Stephen Gosney Chief Executive Officer of EziBuy
F
or p
erso
nal u
se o
nly
Notes to the financial statements (continued)
46
Note 24. KEY MANAGEMENT PERSONNEL (continued) Compensation The aggregate remuneration of the Directors and other key management personnel of the Group are as follows:
Consolidated Group
2020 2019
$ $
Short-term employee benefits 2,509,740 2,613,498
Post-employment benefits 60,346 49,851
Other long-term benefits 30,726 54,934
Share based payments 202,957 551,803
Total benefits 2,803,769 3,270,086
Short-term employee benefits These amounts include fees and benefits paid as well all salary, paid leave benefits, fringe benefits and cash bonuses.
Post-employment benefits These amounts are the current-year’s estimated costs of providing for the Group’s defined benefits scheme post-retirement, superannuation contributions made during the year and post-employment life insurance benefits.
Other long-term benefits These amounts represent long service leave benefits accruing during the year, long-term disability benefits and deferred bonus payments.
Share-based payments These amounts represent the expense related to the participation of the key management personnel in equity-settled benefit schemes as measured by the fair value of the options, rights and shares granted on grant date.
Consolidated Group
2020 2019
$ $ Note 25. AUDITORS REMUNERATION During the financial year the following fees were paid or payable for services provided by BDO, the auditor of the Group and its network firms.
Audit services - BDO
- Audit and review of the financial statements 465,000 375,000
Other services - BDO
‘- Tax compliance services including review of company income tax returns 29,000 -
‘- Other advisory services* 211,065 -
‘- Other assurance services 43,760 3,000
748,825 378,000
‘* 2020 fee in relation to audit and other advisory services have increased from the prior year primarily due to the acquisition of EziBuy.
The BDO entity performing the audit of the Group transitioned from BDO East Coast Partnership to BDO Audit Pty Limited on 26 June 2020. The disclosures include amounts received or due and receivable by BDO East Coast Partnership and BDO Audit Pty Limited. Note 26. RELATED PARTY TRANSACTIONS Parent entity Mosaic Brands Limited is the parent entity. Subsidiaries Interests in subsidiaries are set out in note 28. Key management personnel Disclosures relating to key management personnel are set out in note 24 and the Remuneration report is included in the Directors’ report.
For
per
sona
l use
onl
y
Notes to the financial statements (continued)
47
Note 26. RELATED PARTY TRANSACTIONS (continued)
Transactions with related parties
On 23 December 2019 an extraordinary general meeting (EGM) was held to approve the purchase of 50.1% of EziBuy for a nominal price of $1.00 effective from 28 October 2019 (date of acquisition). The EGM also approved the grant and exercise of call and put options to either acquire the remaining 49.9% equity interest on or prior to 31 December 2020 for a consideration of $11 million, or return the current shareholding to Alceon Retail for $1.00. Should neither option be exercised by Mosaic Brands Limited, Alceon Retail has the option to purchase the 50.1% back from Mosaic for $1.00.
The Group paid rent to four Alceon-owned property trusts amounting to $299,000 (2019: $336,000) in relation to stores in Caboolture, Orange, Sale and Gladstone. The rental paid was at normal commercial terms and conditions.
A total of $120,000 was paid in management fees to related party of the Non-Executive Directors during the financial period (2019: $120,000).
Receivables from and payable to related parties There were no trade receivables from or trade payables to related parties at the current and previous reporting date.
Loans to/from related parties At 28 June 2020, a loan amount payable to a related party (Alceon Retail Bidco) of $12,512,000 was owed through EziBuy. There were no other loans to or from related parties at the current and previous reporting date.
‘Note 27. PARENT ENTITY INFORMATION
The following information has been extracted from the books and records of the parent and has been prepared in accordance with Australian Accounting Standards.
Consolidated Group
2020 2019
$000 $000
The following information has been extracted from the books and records of the parent and has been prepared in accordance with Australian Accounting Standards.
Statement of profit or loss and other comprehensive income
Net (loss) / profit after income tax expense (104,153) 23,398
Total comprehensive (loss) / income for the year (104,153) 23,398
Statement of financial position
ASSETS
Current assets 52,907 153,334
Non-current assets 107,398 197,283
TOTAL ASSETS 160,305 350,617
LIABILITIES
Current liabilities 165,028 184,825
Non-current liabilities 100,623 59,670
TOTAL LIABILITIES 265,651 244,495
EQUITY
Issued capital 108,035 107,605
Reserves 17,897 9,421
Accumulated losses (231,277) (10,904)
TOTAL EQUITY (105,345) 106,122
As at 28 June 2020, the parent entity had an excess of current liabilities over current assets of $112,121,000 (2019 net current liability position of $44,366,000)
For
per
sona
l use
onl
y
Notes to the financial statements (continued)
48
‘Note 27. PARENT ENTITY INFORMATION (continued)
Contingent liabilities
Mosaic Brands Limited is a party to various legal proceedings incidental to its business. As is the case with other companies in similar industries managing through the COVID-19 pandemic, the Company faces exposure from actual or potential claims and legal proceedings. Although the ultimate result of the legal proceedings cannot be predicted due to the uncertainty, it is the opinion of management that the outcome of any claim which is pending, either individually or on a combined basis, will not have a material effect on the financial position of the Company, its cash flows and result of operations. Accordingly, no provision has been provided within these financial statements.
Significant accounting policies
The accounting policies of the parent entity are consistent with those of the Group, except for the following: Investments in subsidiaries are accounted for at cost, less any impairment, in the parent entity.
Contractual commitments
As at 28 June 2020, the parent entity had no contractual commitments apart from lease liabilities (note 17).
Note 28. INTERESTS IN SUBSIDIARIES
Information about the Principal Subsidiaries
The subsidiaries listed below have share capital consisting solely of ordinary shares which are held directly by the Group. The proportion of ownership interests held equals the voting rights held by the Group. Each subsidiary’s principal place of business is also its country of incorporation.
Name of Subsidiary Country of Incorporation
Ownership Interest
2020 2019 Noni B Holdings Pty Limited Australia 100% 100% Pretty Girl Fashion Group Holdings Pty Ltd Australia 100% 100% Pretty Girl Fashion Group Pty Ltd Australia 100% 100% W.Lane Pty Ltd Australia 100% 100% Noni B Holdings 2 Pty Ltd Australia 100% 100% Millers Retail Pty Ltd Australia 100% 100% Autograph Retail Pty Ltd Australia 100% 100% Rivers Retail Holdings Pty Ltd Australia 100% 100% Crossroads Retail Pty Ltd Australia 100% 100% Katies Retail Pty Ltd Australia 100% 100% Noni B Holdco Pty Ltd Australia 100% 100% EziBuy Pty Ltd Australia 100%* - Noni B NZ Limited New Zealand 100% 100% Noni B Holdings NZ Limited New Zealand 100% 100% New EziBuy Ltd New Zealand 100%* - EziBuy Holdings Ltd New Zealand 100%* - EziBuy Ltd New Zealand 100%* - EziBuy Operations Ltd New Zealand 100%* - Sara Apparel Ltd New Zealand 100%* - Last Stop Shop Ltd New Zealand 100%* - EziBuy Custodian Ltd New Zealand 100%* -
* New EziBuy Limited was acquired at 50.1% with an option to acquire the remaining 49.9% which has been accounted for as a presentownership interest (refer Note 30).
Note 29. DEED OF CROSS GUARANTEE
The following entities are party to a deed of cross guarantee under which each party guarantees the debts of the others:
Mosaic Brands Limited Pretty Girl Fashion Group Holdings Pty Ltd
Noni B Holdings Pty Limited Pretty Girl Fashion Group Pty Ltd
Noni B Holdings 2 Pty Ltd Crossroads Retail Pty Ltd
Noni B Holdings NZ Limited Katies Retail Pty Ltd
Millers Retail Pty Ltd Rivers Retail Holdings Pty Ltd
Autograph Retail Pty Ltd
By entering into the deed, the wholly-owned entities have been relieved from the requirement to prepare financial statements and Directors’ report under ASIC Legislative Instrument 2016/785.
The above companies (including Mosaic Brands Limited as parent entity) represent a ‘Closed Group’ for the purposes of the legislative instrument. The financial information pertaining to the Closed Group is the consolidated financial information in the report less the information of the parent entity as disclosed in note 27.
For
per
sona
l use
onl
y

Notes to the financial statements (continued)
49
Note 29. DEED OF CROSS GUARANTEE (continued)
Consolidated statement of profit or loss and other comprehensive income
‘
Closed Group
2020 2019
$000 $000
Continuing operations
Revenue 639,267 864,493
Other income 17,442 17,427
Cost of goods sold (343,935) (382,783)
Expenses (excluding finance costs) (405,856) (476,001)
Transaction and restructuring costs (3,657) (9,139)
Finance costs (11,449) (2,124)
Impairment of brand names (33,364) -
Impairment of goodwill (64,022) -
(Loss) / profit before income tax (205,574) 11,873
Income tax benefit / (expense) 41,143 (3,743)
(Loss) / profit attributed to members of the parent entity (164,431) 8,130
Items that may be reclassified subsequently to profit or loss
Foreign currency translation (93) 31
Other comprehensive income, net of tax (93) 31
Total comprehensive income for the year attributed to members of the parent entity, net of tax
(164,524) 8,161
For
per
sona
l use
onl
y
Notes to the financial statements (continued)
50
Note 29. DEED OF CROSS GUARANTEE (continued)
Consolidated statement of financial position
Closed Group
2020 2019
$000 $000
ASSETS
CURRENT ASSETS
Cash and cash equivalents 77,553 36,684
Other receivables 22,765 5,484
Inventories 83,349 166,951
Income tax receivable - 4,846
Other current assets 2,867 347
TOTAL CURRENT ASSETS 186,534 214,312
NON-CURRENT ASSETS
Plant and equipment 27,332 41,101
Right-of-use assets 119,665 -
Intangible assets 39,341 123,970
Deferred tax assets 107,856 32,386
Other non-current assets 26 91
TOTAL NON-CURRENT ASSETS 294,220 197,548
TOTAL ASSETS 480,754 411,860
LIABILITIES
CURRENT LIABILITIES
Trade and other payables 213,156 198,602
Borrowings 28,974 -
Provisions 27,783 29,089
Derivative financial instruments 534 570
Lease liabilities 83,546 -
Income tax payable 154 -
Other current liabilities 95 8,908
Deferred consideration 9,580 -
Intercompany payables 1,928 -
TOTAL CURRENT LIABILITIES 365,751 237,169
NON-CURRENT LIABILITIES
Borrowings 44,989 29,482
Lease liabilities 91,611 -
Provisions 2,828 4,427
Deferred tax liabilities 49,935 19,171
Other non-current liabilities 110 15,489
TOTAL NON-CURRENT LIABILITIES 189,473 68,569
TOTAL LIABILITIES 555,224 305,738
NET ASSETS (74,470) 106,122
EQUITY
Issued capital 108,034 107,605
Reserves 18,694 9,421
Accumulated losses (201,198) (10,904)
TOTAL EQUITY (74,470) 106,122
For
per
sona
l use
onl
y

Notes to the financial statements (continued)
51
Note 30. BUSINESS COMBINATIONS
On 23 December 2019 an extraordinary general meeting (EGM) was held to approve the purchase of 50.1% of EziBuy for a nominal price of $1.00 effective from 28 October 2019 (date of acquisition). The EGM also approved the grant and exercise of call and put options to either acquire the remaining 49.9% equity interest on or prior to 31 December 2020 for a consideration of $11 million, or return the current shareholding to Alceon Retail for $1.00. Should neither option be exercised by Mosaic Brands Limited, Alceon Retail has the option to purchase the 50.1% back from Mosaic for $1.00.
EziBuy is a multi-channel retailing business which operates predominately in New Zealand and also Australia. It was acquired to increase the Group’s online revenue share by gaining access to the customer portfolio which includes a high customer loyalty base. The acquired business operates in New Zealand and transacts in New Zealand Dollars which has been translated to Australian Dollars (AUD) for the purposes of these accounts.
The acquisition has been accounted for as a business combination under AASB 3 Business Combinations. The Group considers it has a present ownership interest in the 49.9% shareholding currently held by related party Alceon Retail and has therefore accounted for 100% of EziBuy’s results. Consequently, there is no non-controlling interest to be recognised at acquisition.
The Group has recognised a financial liability for the present value of the exercise price of the call option. If the call option expires unexercised, the Group will account for a disposal of its present ownership interest in the 49.9% shareholding, together with any resulting implications under the acquisition agreement.
The fair value of the deferred consideration has been calculated based on the underlying Share Purchase Agreement, and includes the fair value of the exercise price of the call option of $10,800,000, which includes the amount to settle related party loans payable to the owners of the remaining 49.9% equity interest of $3,800,000 and the cash adjustment required to settle the cash acquired in the business of $2,460,000.
The Share Purchase Agreement requires the payment of contingent consideration to Alceon Retail in the event that the Group sells more than 50% of the equity interest in EziBuy within 12 months of exercising the call option.
Details of the acquisition are as follows:
Fair value $’000
Consideration
‘- Cash paid for purchase - ‘- Fair value of deferred consideration 9,580
Total cash consideration to be paid 9,580
Net identifiable assets / (liabilities) acquired ‘- Inventories 30,504 ‘- Other current assets 2,074 ‘- Plant and equipment 4,510 ‘- Right-of-use assets (AASB 16) 25,543 ‘- Brand names 890 ‘- Intangibles – software 5,178 ‘- Deferred tax assets 2,632 ‘- Cash acquired 2,460 ‘- Trade and other payables (38,766) ‘- Loans and borrowings (6,520) ‘- Lease liabilities (AASB 16) (25,543) ‘- Other provisions (4,146)
Net identifiable assets / (liabilities) acquired (1,184)
Goodwill on acquisition 10,764
For
per
sona
l use
onl
y
Notes to the financial statements (continued)
52
Note 30. BUSINESS COMBINATIONS (continued)
From the date of acquisition, the acquired brands contributed revenues of $80,068,000 to the Group (includes related party interest) for the financial reporting period, of which $39,300,000 of sales were derived in Australia. The acquired company contributed an operating loss of ($6,054,000) to the Group, this excludes operating loss attributed to related party interest.
Acquisition costs incurred during the financial period were $1,386,000.
Management has determined that disclosure of the profit and loss of the acquired entities as though the acquisition date had been as of 1 July 2019 is impracticable due to the high degree of estimation required to normalise for the economic consequences of COVID-19.
Provisional goodwill of $10,764,000 includes the acquired workforce, future growth opportunities and operational synergies.
AASB 3 Business Combinations allows a measurement period of up to 12 months after a business combination to provide the acquirer a reasonable time to obtain the information necessary to identify and measure all of the various components of the business combination as of the acquisition date. The details of the acquisition above are determined provisionally, pending the finalisation of the valuation information. Further adjustments may be made to the fair values assigned to the identifiable assets acquired and liabilities assumed. Consequently, the resulting goodwill is provisional and has not been allocated to the Group’s cash generating units.
Management will test goodwill for impairment prior to 28 October 2020. Management has considered indicators of impairment at the end of the reporting period and deemed that operational synergies have been achieved as planned.
The accounting treatment of the acquisition has been revised since the half year to reflect the commercial substance of the transaction.
Consolidated Group
2020 2019
$000 $000 Note 31. CASH FLOW INFORMATION
Reconciliation of Cash Flows from Operating Activities with Profit after income tax
(Loss) / profit after income tax (170,485) 8,130
Non-cash flows in (loss) / profit:
- depreciation 120,439 21,409
- amortisation 8,881 899
- write-off and write down of obsolete stock 32,151 2,335
- impairment and write-off of non-current assets 1,991 79
- sales return provision 3,175 -
- impairment of Brand Names and Goodwill 97,386 -
- net gain on disposal of plant and equipment (51) (52)
- unrealised foreign exchange gain (6,671) (208)
- share based payment expense 266 365
Change in assets and liabilities:
- (increase) / decrease in trade and other receivables (958) 713
- decrease / (increase) in inventories 64,622 (77,089)
- increase in deferred tax assets (85,480) (363)
- increase in deferred tax liabilities 37,485 -
- (decrease) / increase in trade and other payables (132) 75,419
- (decrease) / increase in financial instruments (36) 1,215
- increase / (decrease) in tax liability 4,991 (10,901)
- (decrease) / increase in provisions (1,576) 1,532
Net cash flow from operating activities 105,998 23,483 For
per
sona
l use
onl
y

Notes to the financial statements (continued)
53
Note 32. (LOSS) / EARNINGS PER SHARE
(Loss) / earnings per share
(Loss) / profit after income tax (170,485) 8,130
(Loss) / profit after income tax attributable to the owners of Mosaic Brands Limited
(170,485) 8,130
Number Number
‘000 ‘000
Weighted average number of ordinary shares used in calculating:
- basic earnings per share 96,858 96,824
- diluted earnings per share 96,858 96,824
Basic (loss) / earnings per share (cents) (176.0) 8.4
Diluted (loss) / earnings per share (cents) (176.0) 8.4
Basic earnings per share
Basic earnings per share is calculated by dividing the profit attributable to the owners of Mosaic Brands Limited, excluding any costs of servicing equity other than ordinary shares, by the weighted average number of ordinary shares outstanding during the financial year, adjusted for bonus elements in ordinary shares issued during the financial year.
Diluted earnings per share
Diluted earnings per share adjusts the figures used in the determination of basic earnings per share to take into account the after income tax effect of interest and other financing costs associated with dilutive potential ordinary shares and the weighted average number of shares assumed to have been issued for no consideration in relation to dilutive potential ordinary shares.
‘Note 33. SHARE BASED PAYMENTS
The fair value at grant date is independently determined using a Binomial Approximation Option Valuation Model and the Black Scholes Valuation model that takes into account the exercise price, the term of the rights over shares, the share price at grant date and expected price volatility of the underlying share, the expected dividend yield and the risk free interest rate for the term of the rights over shares. The volatility calculation is based on historical share prices. These have a variety of market and non-market conditions based on the volume weighted average price (VWAP). The accounting estimates and assumptions relating to equity-settled share-based payments would have no impact on the carrying amounts of assets and liabilities within the next annual reporting period but may impact profit or loss and equity.
A summary of the movement of all rights over share grants during the year ended 28 June 2020 include:
Performance Share Rights
Performance share rights which were outstanding as at 28 June 2020 were as follows:
Grant date Expiry date Fair value at grant date
Share price at grant date
Exercise price
Volatility Interest rate Number of
rights available
08/08/2016 07/08/2021 $ 0.44 $ 1.33 $ 1.33 35% 1.54% 100,000 19/08/2016 18/08/2021 $ 0.47 $ 1.33 $ 1.25 35% 1.54% 1,450,000 19/08/2016 18/08/2021 $ 0.39 $ 1.33 $ 1.50 35% 1.54% 300,000 19/08/2016 18/08/2021 $ 0.32 $ 1.33 $ 1.75 35% 1.54% 300,000 17/02/2017 16/02/2022 $ 0.48 $ 1.46 $ 1.47 35% 1.54% 100,000 24/05/2017 23/05/2022 $ 0.54 $ 1.63 $ 1.64 35% 1.54% 100,000 12/01/2018 11/01/2023 $ 0.45 $ 2.09 $ 1.93 24% 1.55% 25,000 24/09/2018 23/09/2023 $ 1.31 $ 3.58 $ 3.42 54% 1.55% 550,000 21/12/2018 20/12/2023 $ 0.63 $ 2.68 $ 3.42 49% 1.55% 20,000
The weighted average price for the above performance share rights was $1.78.
During the financial period the number of share rights that were exercised was nil (2019: 845,000).
Performance share rights which were forfeited during the period 1 July 2019 to 28 June 2020 were as follows:
2020
Consolidated Group
2019
$000 $000
For
per
sona
l use
onl
y
Notes to the financial statements (continued)
54
Note 33. SHARE BASED PAYMENTS (continued)
Grant date Expiry date Fair value at grant date
Share price at grant date
Exercise price
Volatility Interest rate Number of
rights available
10/05/2017 09/05/2022 $ 0.55 $ 1.65 $ 1.63 35% 1.54% 25,000 07/08/2017 06/08/2022 $ 0.38 $ 1.96 $ 1.86 15% 1.55% 100,000 25/08/2017 24/08/2022 $ 0.38 $ 2.00 $ 1.95 16% 1.55% 25,000 11/11/2017 10/11/2022 $ 0.39 $ 2.02 $ 2.01 25% 1.55% 25,000 12/01/2018 11/01/2023 $ 0.45 $ 2.09 $ 1.93 24% 1.55% 50,000 12/05/2018 11/05/2023 $ 0.37 $ 2.35 $ 2.50 28% 1.55% 50,000 24/09/2018 23/09/2023 $ 1.31 $ 3.58 $ 3.42 54% 1.55% 125,000
The total charge arising from share based payment transactions during the year as part of employee benefit expense was $266,000 (2019: $365,000).
Recognition and measurement
Share-based payments to employees are measured at the fair value of the instruments issued and amortised over the vesting periods. Share-based payments to non-employees are measured at the fair value of goods or services received or the fair value of the equity instruments issued, if it is determined the fair value of the goods or services cannot be reliably measured, and are recorded at the date the goods or services are received. The corresponding amount is recorded to the equity reserve. The fair value is determined using the Black-Scholes pricing model. The number of shares expected to vest is reviewed and adjusted at the end of each reporting period such that the amount recognised for services received as consideration for the equity instruments granted is based on the number of equity instruments that eventually vest.
‘Note 34. COMMITMENTS AND CONTINGENT LIABILITIES
Contractual commitments
As at 28 June 2020, the Group had no contractual commitments apart from lease liabilities (note 17).
Contingent liabilities
Mosaic Brands Limited is a party to various legal proceedings incidental to its business. As is the case with other companies in similar industries managing through the COVID-19 pandemic, the Group faces exposure from actual or potential claims and legal proceedings. Although the ultimate result of the legal proceedings cannot be predicted due to the uncertainty, it is the opinion of the Groups management that the outcome of any claim which is pending, either individually or on a combined basis, will not have a material effect on the financial position of the Group, its cash flows and result of operations. Accordingly, no provision has been provided within these financial statements.
‘Note 35. EVENTS AFTER THE REPORTING DATE
The impact of the Coronavirus (COVID-19) pandemic is ongoing and as such it is not practicable to estimate the potential impact, positive or negative, after the reporting date. The situation is rapidly developing and is dependent on measures imposed by the Australian Government and other countries, such as maintaining social distancing requirements, quarantine, travel restrictions and any economic stimulus that may be provided.
In the interests of the health and safety of its customers and store teams, Mosaic Brands Limited closed all stores within Victoria temporarily. In response to the state Government’s imposition of stage 3 and 4 restrictions, the Group closed 25 stores on 1 July with an additional 135 stores on 8 July with the balance 89 regional stores closed on 5 August. All stores will remain closed until restrictions are reduced.
Mosaic Brands announced on 20 August temporary closure of 129 stores in the Westfield centres. The financial contribution of these stores are not of a material nature with all impacted team members being redeployed to other locations.
Apart from the above, no other matter or circumstances has arisen since 28 June 2020 that has significantly affected, or may significantly affect the Groups operations, the results of those operations, or the state of affairs in future financial years.
For
per
sona
l use
onl
y
Directors’ Declaration
55
In the Directors’ opinion:
the attached financial statements and notes comply with the Corporations Act 2001, the Accounting Standards, the Corporations
Regulations 2001 and other mandatory professional reporting requirements;
the attached financial statements and notes comply with International Financial Reporting Standards as issued by the International
Accounting Standards Board as described in note 1 to the financial statements;
the attached financial statements and notes give a true and fair view of the Consolidated Entity's financial position as at 28 June 2020
and of its performance for the financial year ended on that date;
there are reasonable grounds to believe that the Company will be able to pay its debts as and when they become due and payable; and
at the date of this declaration, there are reasonable grounds to believe that the members of the Extended Closed Group will be able to
meet any obligations or liabilities to which they are, or may become, subject by virtue of the deed of cross guarantee described in note
29 to the financial statements.
The Directors have been given the declarations required by section 295A of the Corporations Act 2001.
Signed in accordance with a resolution of Directors made pursuant to section 295(5)(a) of the Corporations Act 2001.
On behalf of the Directors
Richard Facioni Scott Evans Chairman Managing Director 25 August 2020 25 August 2020
For
per
sona
l use
onl
y
Level 11, 1 Margaret St Sydney NSW 2000
Australia
Tel: +61 2 9251 4100 Fax: +61 2 9240 9821
www.bdo.com.au
BDO Audit Pty Ltd ABN 33 134 022 870 is a member of a national association of independent entities which are all members of BDO Australia Ltd ABN 77 050 110 275, an Australian company limited by guarantee. BDO Audit Pty Ltd and BDO Australia Ltd are members of BDO International Ltd, a UK company limited by guarantee, and form part of the international BDO network of independent member firms. Liability limited by a scheme approved under Professional Standards Legislation.
INDEPENDENT AUDITOR'S REPORT
To the members of Mosaic Brands Limited
Report on the Audit of the Financial Report
Opinion
We have audited the financial report of Mosaic Brands Limited (the Company) and its subsidiaries (the
Group), which comprises the consolidated statement of financial position as at 28 June 2020, the
consolidated statement of profit or loss and other comprehensive income, the consolidated statement
of changes in equity and the consolidated statement of cash flows for the year then ended, and notes
to the financial report, including a summary of significant accounting policies and the directors’
declaration.
In our opinion the accompanying financial report of the Group, is in accordance with the Corporations
Act 2001, including:
(i) Giving a true and fair view of the Group’s financial position as at 28 June 2020 and of its
financial performance for the year ended on that date; and
(ii) Complying with Australian Accounting Standards and the Corporations Regulations 2001.
Basis for opinion
We conducted our audit in accordance with Australian Auditing Standards. Our responsibilities under
those standards are further described in the Auditor’s responsibilities for the audit of the Financial
Report section of our report. We are independent of the Group in accordance with the Corporations
Act 2001 and the ethical requirements of the Accounting Professional and Ethical Standards Board’s
APES 110 Code of Ethics for Professional Accountants (including Independence Standards) (the Code)
that are relevant to our audit of the financial report in Australia. We have also fulfilled our other
ethical responsibilities in accordance with the Code.
We confirm that the independence declaration required by the Corporations Act 2001, which has been
given to the directors of the Company, would be in the same terms if given to the directors as at the
time of this auditor’s report.
We believe that the audit evidence we have obtained is sufficient and appropriate to provide a basis
for our opinion.
For
per
sona
l use
onl
y
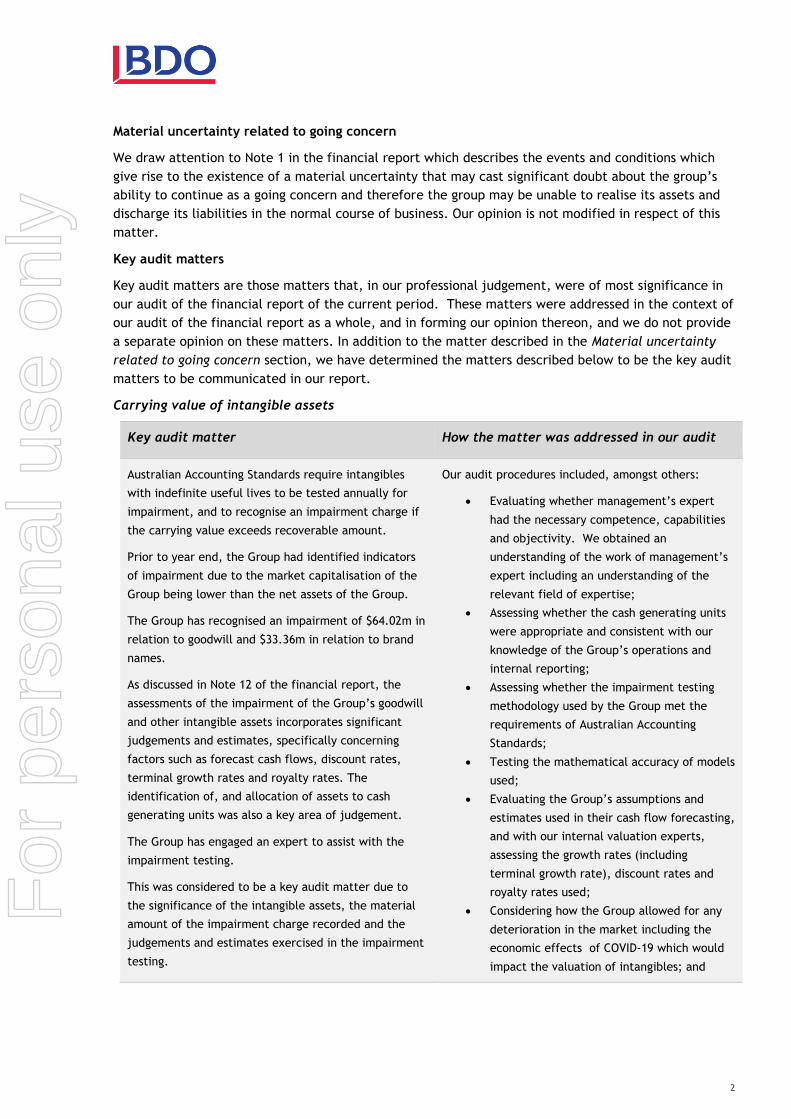
2
Material uncertainty related to going concern
We draw attention to Note 1 in the financial report which describes the events and conditions which
give rise to the existence of a material uncertainty that may cast significant doubt about the group’s
ability to continue as a going concern and therefore the group may be unable to realise its assets and
discharge its liabilities in the normal course of business. Our opinion is not modified in respect of this
matter.
Key audit matters
Key audit matters are those matters that, in our professional judgement, were of most significance in
our audit of the financial report of the current period. These matters were addressed in the context of
our audit of the financial report as a whole, and in forming our opinion thereon, and we do not provide
a separate opinion on these matters. In addition to the matter described in the Material uncertainty
related to going concern section, we have determined the matters described below to be the key audit
matters to be communicated in our report.
Carrying value of intangible assets
Key audit matter How the matter was addressed in our audit
Australian Accounting Standards require intangibles
with indefinite useful lives to be tested annually for
impairment, and to recognise an impairment charge if
the carrying value exceeds recoverable amount.
Prior to year end, the Group had identified indicators
of impairment due to the market capitalisation of the
Group being lower than the net assets of the Group.
The Group has recognised an impairment of $64.02m in
relation to goodwill and $33.36m in relation to brand
names.
As discussed in Note 12 of the financial report, the
assessments of the impairment of the Group’s goodwill
and other intangible assets incorporates significant
judgements and estimates, specifically concerning
factors such as forecast cash flows, discount rates,
terminal growth rates and royalty rates. The
identification of, and allocation of assets to cash
generating units was also a key area of judgement.
The Group has engaged an expert to assist with the
impairment testing.
This was considered to be a key audit matter due to
the significance of the intangible assets, the material
amount of the impairment charge recorded and the
judgements and estimates exercised in the impairment
testing.
Our audit procedures included, amongst others:
Evaluating whether management’s expert
had the necessary competence, capabilities
and objectivity. We obtained an
understanding of the work of management’s
expert including an understanding of the
relevant field of expertise;
Assessing whether the cash generating units
were appropriate and consistent with our
knowledge of the Group’s operations and
internal reporting;
Assessing whether the impairment testing
methodology used by the Group met the
requirements of Australian Accounting
Standards;
Testing the mathematical accuracy of models
used;
Evaluating the Group’s assumptions and
estimates used in their cash flow forecasting,
and with our internal valuation experts,
assessing the growth rates (including
terminal growth rate), discount rates and
royalty rates used;
Considering how the Group allowed for any
deterioration in the market including the
economic effects of COVID-19 which would
impact the valuation of intangibles; and
For
per
sona
l use
onl
y

3
Evaluated the adequacy of the impairment
disclosures in the financial report,
particularly those relating to intangible
assets and to judgements and estimates.
Valuation of inventory
Key audit matter How the matter was addressed in our audit
The carrying value of inventory as at 28 June 2020 is
$102.33m (2019: $166.95m) as disclosed in Note 8 of
the financial report.
Due to the industry in which the Group operates, the
items held in inventory have an inherent risk of
obsolescence. The carrying value of inventories was
reduced by $32.15m (2109: $6.79) for obsolescence
and shrinkage factors, which is judgemental in nature.
Significant management judgements include
categorisation of inventories, fragmentation and sell
through rates, and shrinkage, which form the basis of
management’s calculation to determine the net
realisable value of inventory. The valuation of
inventory is a key audit matter due to the judgements
and estimates required in calculating the provision for
obsolescence and shrinkage, the deterioration of
trading due to COVID-19, and the material nature of
the inventory balance.
Our audit procedures included, amongst others:
Considering and testing the design and
operating effectiveness of key inventory
controls;
Discussing with management the Group’s
current performance and future strategies to
assist in evaluating the underlying
assumptions applied in the calculation of the
inventory obsolescence and shrinkage
provision, particularly due to the current
economic environment ;
Recalculating the arithmetical accuracy of
the provision for inventory obsolescence and
shrinkage calculation;
Challenging management’s assumptions by
testing the classifications of the underlying
data used within the calculation, performing
inventory turnover analysis; and analysing
the accuracy of historical obsolescence
provisions; and
Agreeing a sample of inventory on hand to
initial purchase invoices and subsequent
sales invoices and comparing the carrying
amount to the net realisable value.
For
per
sona
l use
onl
y
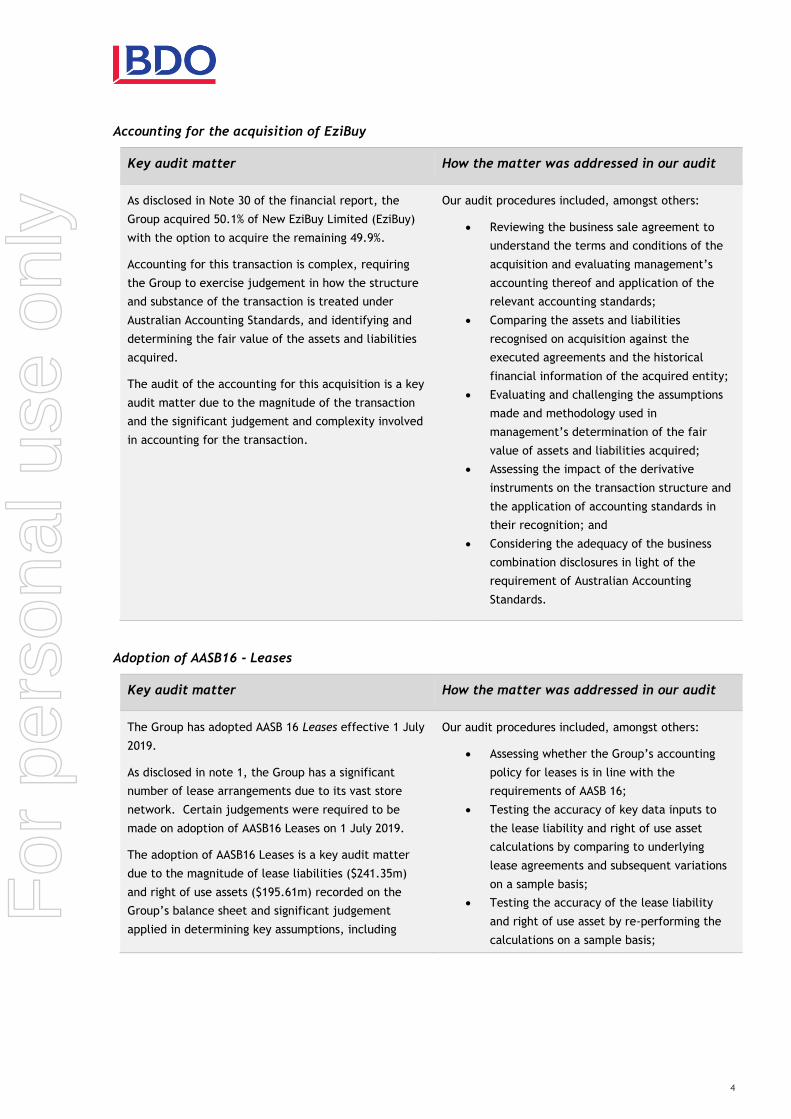
4
Accounting for the acquisition of EziBuy
Key audit matter How the matter was addressed in our audit
As disclosed in Note 30 of the financial report, the
Group acquired 50.1% of New EziBuy Limited (EziBuy)
with the option to acquire the remaining 49.9%.
Accounting for this transaction is complex, requiring
the Group to exercise judgement in how the structure
and substance of the transaction is treated under
Australian Accounting Standards, and identifying and
determining the fair value of the assets and liabilities
acquired.
The audit of the accounting for this acquisition is a key
audit matter due to the magnitude of the transaction
and the significant judgement and complexity involved
in accounting for the transaction.
Our audit procedures included, amongst others:
Reviewing the business sale agreement to
understand the terms and conditions of the
acquisition and evaluating management’s
accounting thereof and application of the
relevant accounting standards;
Comparing the assets and liabilities
recognised on acquisition against the
executed agreements and the historical
financial information of the acquired entity;
Evaluating and challenging the assumptions
made and methodology used in
management’s determination of the fair
value of assets and liabilities acquired;
Assessing the impact of the derivative
instruments on the transaction structure and
the application of accounting standards in
their recognition; and
Considering the adequacy of the business
combination disclosures in light of the
requirement of Australian Accounting
Standards.
Adoption of AASB16 - Leases
Key audit matter How the matter was addressed in our audit
The Group has adopted AASB 16 Leases effective 1 July
2019.
As disclosed in note 1, the Group has a significant
number of lease arrangements due to its vast store
network. Certain judgements were required to be
made on adoption of AASB16 Leases on 1 July 2019.
The adoption of AASB16 Leases is a key audit matter
due to the magnitude of lease liabilities ($241.35m)
and right of use assets ($195.61m) recorded on the
Group’s balance sheet and significant judgement
applied in determining key assumptions, including
Our audit procedures included, amongst others:
Assessing whether the Group’s accounting
policy for leases is in line with the
requirements of AASB 16;
Testing the accuracy of key data inputs to
the lease liability and right of use asset
calculations by comparing to underlying
lease agreements and subsequent variations
on a sample basis;
Testing the accuracy of the lease liability
and right of use asset by re-performing the
calculations on a sample basis;
For
per
sona
l use
onl
y
5
incremental borrowing rates, exercise of option periods
and lease terms.
Management has assessed the right-of-use assets for
impairment which was also subject to judgement,
including the impact of COVID-19.
Assessing the reasonableness of key
judgements used in the calculations
including the incremental borrowing rate,
option periods, lease terms and
appropriateness of the practical expedients
applied by the Group in computing the lease
liability and right of use asset on
implementation date;
Evaluating the methodology applied in the
impairment assessment over right of use
assets; and
Considering the adequacy of the disclosures
in light of the requirements of Australian
Accounting Standards.
Other information
The directors are responsible for the other information. The other information comprises the
information contained in the Directors’ report, Corporate Governance Statement and additional
securities exchange information for the year ended 28 June 2020, but does not include the financial
report and our auditor’s report thereon, which we obtained prior to the date of this auditor’s report,
and the annual report, which is expected to be made available to us after that date.
Our opinion on the financial report does not cover the other information and we do not express any
form of assurance conclusion thereon.
In connection with our audit of the financial report, our responsibility is to read the other information
identified above and, in doing so, consider whether the other information is materially inconsistent
with the financial report or our knowledge obtained in the audit or otherwise appears to be materially
misstated.
If, based on the work we have performed on the other information that we obtained prior to the date
of this auditor’s report, we conclude that there is a material misstatement of this other information,
we are required to report that fact. We have nothing to report in this regard.
When we read the annual report, if we conclude that there is a material misstatement therein, we are
required to communicate the matter to the directors and will request that it is corrected. If it is not
corrected, we will seek to have the matter appropriately brought to the attention of users for whom
our report is prepared.
Responsibilities of the directors for the Financial Report
The directors of the Company are responsible for the preparation of the financial report that gives a
true and fair view in accordance with Australian Accounting Standards and the Corporations Act 2001
and for such internal control as the directors determine is necessary to enable the preparation of the
financial report that gives a true and fair view and is free from material misstatement, whether due to
fraud or error.
For
per
sona
l use
onl
y

6
In preparing the financial report, the directors are responsible for assessing the ability of the group to
continue as a going concern, disclosing, as applicable, matters related to going concern and using the
going concern basis of accounting unless the directors either intend to liquidate the Group or to cease
operations, or has no realistic alternative but to do so.
Auditor’s responsibilities for the audit of the Financial Report
Our objectives are to obtain reasonable assurance about whether the financial report as a whole is free
from material misstatement, whether due to fraud or error, and to issue an auditor’s report that
includes our opinion. Reasonable assurance is a high level of assurance, but is not a guarantee that an
audit conducted in accordance with the Australian Auditing Standards will always detect a material
misstatement when it exists. Misstatements can arise from fraud or error and are considered material
if, individually or in the aggregate, they could reasonably be expected to influence the economic
decisions of users taken on the basis of this financial report.
A further description of our responsibilities for the audit of the financial report is located at the
Auditing and Assurance Standards Board website at:
https://www.auasb.gov.au/admin/file/content102/c3/ar1_2020.pdf
This description forms part of our auditor’s report.
Report on the Remuneration Report
Opinion on the Remuneration Report
We have audited the Remuneration report included in the Directors’ report for the year ended 28 June
2020.
In our opinion, the Remuneration report of Mosaic Brands Limited, for the year ended 28 June 2020,
complies with section 300A of the Corporations Act 2001.
Responsibilities
The directors of the Company are responsible for the preparation and presentation of the
Remuneration report in accordance with section 300A of the Corporations Act 2001. Our responsibility
is to express an opinion on the Remuneration report, based on our audit conducted in accordance with
Australian Auditing Standards.
BDO Audit Pty Ltd
Gillian Shea
Director
Sydney, 25 August 2020
For
per
sona
l use
onl
y
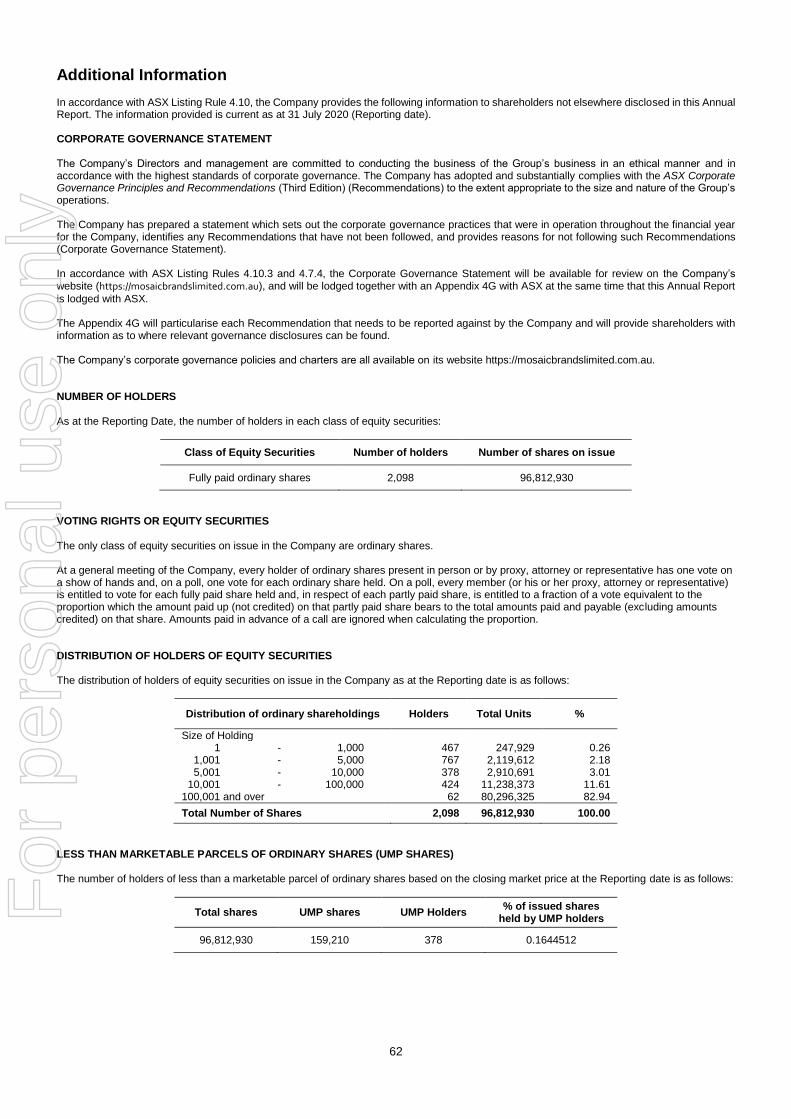
Additional Information
62
In accordance with ASX Listing Rule 4.10, the Company provides the following information to shareholders not elsewhere disclosed in this Annual Report. The information provided is current as at 31 July 2020 (Reporting date).
CORPORATE GOVERNANCE STATEMENT
The Company’s Directors and management are committed to conducting the business of the Group’s business in an ethical manner and in accordance with the highest standards of corporate governance. The Company has adopted and substantially complies with the ASX Corporate Governance Principles and Recommendations (Third Edition) (Recommendations) to the extent appropriate to the size and nature of the Group’s operations.
The Company has prepared a statement which sets out the corporate governance practices that were in operation throughout the financial year for the Company, identifies any Recommendations that have not been followed, and provides reasons for not following such Recommendations (Corporate Governance Statement).
In accordance with ASX Listing Rules 4.10.3 and 4.7.4, the Corporate Governance Statement will be available for review on the Company’s website (https://mosaicbrandslimited.com.au), and will be lodged together with an Appendix 4G with ASX at the same time that this Annual Report
is lodged with ASX.
The Appendix 4G will particularise each Recommendation that needs to be reported against by the Company and will provide shareholders with information as to where relevant governance disclosures can be found.
The Company’s corporate governance policies and charters are all available on its website https://mosaicbrandslimited.com.au.
NUMBER OF HOLDERS
As at the Reporting Date, the number of holders in each class of equity securities:
Class of Equity Securities Number of holders Number of shares on issue
Fully paid ordinary shares 2,098 96,812,930
VOTING RIGHTS OR EQUITY SECURITIES
The only class of equity securities on issue in the Company are ordinary shares.
At a general meeting of the Company, every holder of ordinary shares present in person or by proxy, attorney or representative has one vote on a show of hands and, on a poll, one vote for each ordinary share held. On a poll, every member (or his or her proxy, attorney or representative) is entitled to vote for each fully paid share held and, in respect of each partly paid share, is entitled to a fraction of a vote equivalent to the proportion which the amount paid up (not credited) on that partly paid share bears to the total amounts paid and payable (excluding amounts credited) on that share. Amounts paid in advance of a call are ignored when calculating the proportion.
DISTRIBUTION OF HOLDERS OF EQUITY SECURITIES
The distribution of holders of equity securities on issue in the Company as at the Reporting date is as follows:
Distribution of ordinary shareholdings Holders Total Units %
Size of Holding 1 - 1,000 467 247,929 0.26
1,001 - 5,000 767 2,119,612 2.18 5,001 - 10,000 378 2,910,691 3.01
10,001 - 100,000 424 11,238,373 11.61 100,001 and over 62 80,296,325 82.94
Total Number of Shares 2,098 96,812,930 100.00
LESS THAN MARKETABLE PARCELS OF ORDINARY SHARES (UMP SHARES)
The number of holders of less than a marketable parcel of ordinary shares based on the closing market price at the Reporting date is as follows:
Total shares UMP shares UMP Holders % of issued shares
held by UMP holders
96,812,930 159,210 378 0.1644512
For
per
sona
l use
onl
y
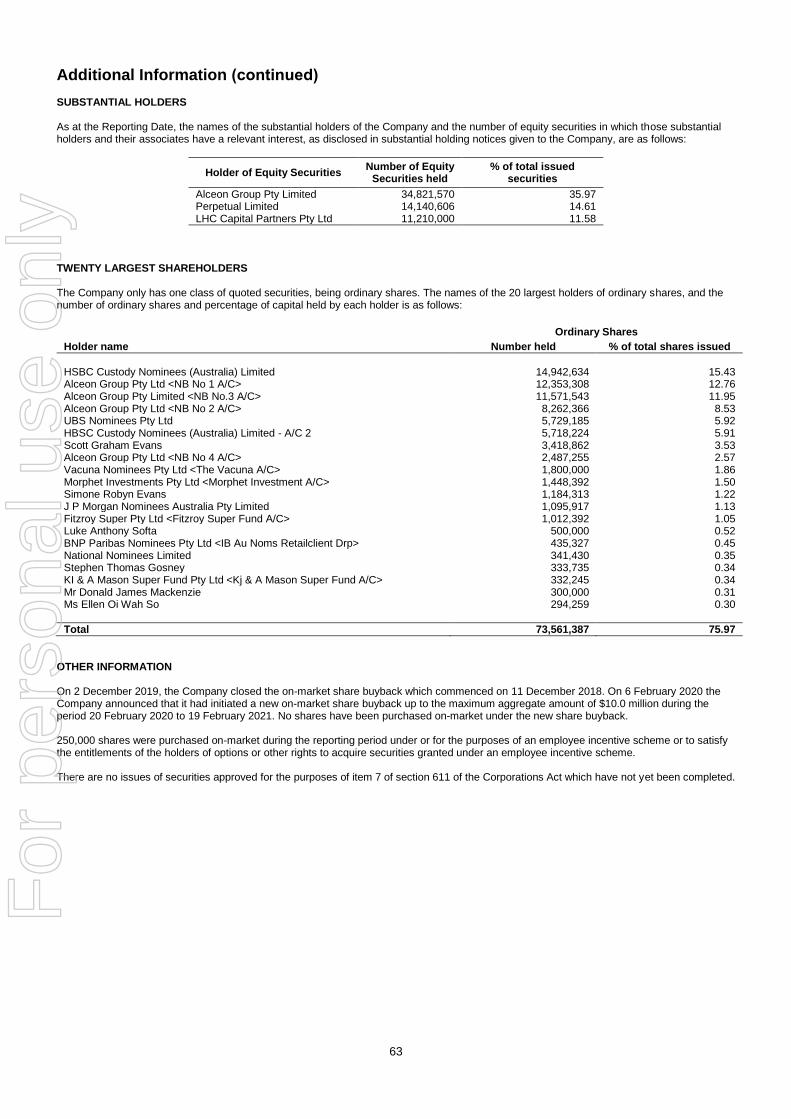
63
Additional Information (continued)SUBSTANTIAL HOLDERS
As at the Reporting Date, the names of the substantial holders of the Company and the number of equity securities in which those substantial holders and their associates have a relevant interest, as disclosed in substantial holding notices given to the Company, are as follows:
Holder of Equity Securities Number of Equity
Securities held % of total issued
securities
Alceon Group Pty Limited 34,821,570 35.97 Perpetual Limited 14,140,606 14.61 LHC Capital Partners Pty Ltd 11,210,000 11.58
TWENTY LARGEST SHAREHOLDERS
The Company only has one class of quoted securities, being ordinary shares. The names of the 20 largest holders of ordinary shares, and the number of ordinary shares and percentage of capital held by each holder is as follows:
Ordinary Shares
Holder name Number held % of total shares issued
HSBC Custody Nominees (Australia) Limited 14,942,634 15.43 Alceon Group Pty Ltd <NB No 1 A/C> 12,353,308 12.76 Alceon Group Pty Limited <NB No.3 A/C> 11,571,543 11.95 Alceon Group Pty Ltd <NB No 2 A/C> 8,262,366 8.53 UBS Nominees Pty Ltd 5,729,185 5.92 HBSC Custody Nominees (Australia) Limited - A/C 2 5,718,224 5.91 Scott Graham Evans 3,418,862 3.53 Alceon Group Pty Ltd <NB No 4 A/C> 2,487,255 2.57 Vacuna Nominees Pty Ltd <The Vacuna A/C> 1,800,000 1.86 Morphet Investments Pty Ltd <Morphet Investment A/C> 1,448,392 1.50 Simone Robyn Evans 1,184,313 1.22 J P Morgan Nominees Australia Pty Limited 1,095,917 1.13 Fitzroy Super Pty Ltd <Fitzroy Super Fund A/C> 1,012,392 1.05 Luke Anthony Softa 500,000 0.52 BNP Paribas Nominees Pty Ltd <IB Au Noms Retailclient Drp> 435,327 0.45 National Nominees Limited 341,430 0.35 Stephen Thomas Gosney 333,735 0.34 KI & A Mason Super Fund Pty Ltd <Kj & A Mason Super Fund A/C> 332,245 0.34 Mr Donald James Mackenzie 300,000 0.31 Ms Ellen Oi Wah So 294,259 0.30
Total 73,561,387 75.97
OTHER INFORMATION
On 2 December 2019, the Company closed the on-market share buyback which commenced on 11 December 2018. On 6 February 2020 the Company announced that it had initiated a new on-market share buyback up to the maximum aggregate amount of $10.0 million during the period 20 February 2020 to 19 February 2021. No shares have been purchased on-market under the new share buyback.
250,000 shares were purchased on-market during the reporting period under or for the purposes of an employee incentive scheme or to satisfy the entitlements of the holders of options or other rights to acquire securities granted under an employee incentive scheme.
There are no issues of securities approved for the purposes of item 7 of section 611 of the Corporations Act which have not yet been completed.
For
per
sona
l use
onl
y