preliminary economic assessment for the ... preliminary economic assessment for the cerro maricunga...
TRANSCRIPT
Mar-12
PRELIMINARY ECONOMIC ASSESSMENT
FOR THE CERRO MARICUNGA OXIDE GOLD PROJECT,
III REGION, CHILE
Technical Report NI 43-101
Submitted by
Carlos Guzmán, Mining Engineer, Registered Member of the Chilean Mining Commission, FAusIMM
Eduardo Magri, Ph.D, MSc, FSAIMM
John Wells, Metallurgy Engineer, FSAIMM, Member CIMM
Effective Date:
March 15, 2013

CERTIFICATE OF QUALIFIED PERSON
I, Carlos Guzmán, Mining Engineer do hereby certify that:
1. I am Principal and Project Director with the firm NCL Ingenieria y Construccion Ltda, Santiago, Chile. My
address is General del Canto 235, Providencia, Santiago, Chile.
2. This certificate applies to the technical report titled “Preliminary Economic Assessment for the Cerro
Maricunga Oxide Gold Project, III Region, Chile” dated effective March 14, 2013 (the “Technical Report”)
with respect to the Cerro Maricunga Gold Project in III Region, Chile (the “Property”).
3. I am a practicing mining engineer, a Fellow of the Australasian Institute of Mining and Metallurgy (FAusIMM,
No. 229036); and a Registered Member of the Chilean Mining Commission.
4. I am a graduate of the Universidad de Chile and hold a Mining Engineer title (1995).
5. I have practiced my profession continuously since 1995.
6. I have read the definition of “qualified person” set out in National Instrument 43-101 (“NI 43-101”) and certify
that by reason of my education, affiliation with a professional association (as defined in NI 43-101) and past
relevant work experience, I fulfill the requirements to be a “qualified person” for the purposes of NI 43-101.
7. I most recently personally inspected the Property in February 2012, for one day.
8. I am responsible for the preparation of mining study, economic analysis and overall compilation of the
Technical Report.
9. I am independent of Atacama Pacific Gold Corporation as described in section 1.5 of NI 43-101.
10. I do not have had prior involvement with the Property.
11. I have read NI 43-101 and the sections of the Technical Report for which I am responsible have been
prepared in compliance with that instrument.
12. As at the effective date of this report, I certify to the best of my knowledge, information and belief, this
technical report contains all of the scientific and technical information that is required to be disclosed to
make the technical report not misleading. I certify that I have actively participated in the following activities:
mining study and economical analysis. Not being a professional geologist, I have relied entirely on other
experts in all matters related to the geological conditions of Cerro Maricunga and the determination of the
resouce estimate. Further I have relied on input from metallurigical and processing consultants for
information related to metallurgy, gold recoveries and associated processing related matters as well as
environmental consultants for information on the environmental conditions of the Cerro Maricunga area.
13. I consent to the filing of the Technical Report with any stock exchange and other regulatory authority and
any publication by them, including electronic publication in the public company files on their websites
accessible to the public of the Technical Report.

Dated this 15th day of March, 2013.
_____________________________
Carlos Guzmán
CERTIFICATE OF QUALIFIED PERSON
I, Eduardo Magri, do hereby certify that:
1. I am a consulting mining engineer to the mining and mineral exploration industry with an office at Don Carlos
2939, Office 613, Las Condes, Santiago, Chile; Tel: (56‐2) 3344226; Email: [email protected].
a. I obtained the following university a degrees:
b. Mining Engineer from the University of Chile, Santiago in 1970.
c. MSc in Mining Engineering from Colorado School of Mines in 1972.
d. Bachelor Honours in Operations Research form the University of South Africa in 1976.
e. PhD in Mining Engineering from the University of the Witwatersrand in 1983.
f. Citation in Applied Geostatistics from the University of Alberta, Canada in 2003.
2. I am a registered and active Fellow of the South African Institute of Mining and Metallurgy since 2004.
3. I have been continuously practicing my profession as a Mining Engineer and consultant since 1972.
4. I have read the definition of “qualified person” set out in National Instrument 43‐101 (“NI 43‐101”) and certify
that by reason of my education, affiliation with a professional association (as defined in NI43‐101) and past
relevant work experience, I fulfill the requirement of “qualified person” for purposes of NI 43‐101.
5. As at the effective date of this report and certificate to the best of my knowledge, information and belief, the
technical report contains all of the scientific and technical information that is required to be disclosed to
make the technical report not misleading. I certify that I have actively participated in the following activities:
the design and implementation of the sample preparation protocol and QA/QC system; analyses of QA/QC
and twin‐hole data; geostatistical analyses and geological resource estimation and categorization. Not being
a professional geologist, I have relied entirely on other experts in all matters other than the ones mentioned
above.
6. I am independent of the issuer as set out in Section 1.5 of the Canadian National Instrument 43‐101
“Standards of Disclosure for Mineral Projects”.
7. I, or any affiliated entity of mine, has not earned the majority of our income during the preceding three years
from Atacama Pacific Gold Corporation, or any associated or affiliated companies.
8. I have no interest in the subject property, either directly or indirectly. I, or any affiliated entity of mine, do not
own, directly or indirectly, nor expect to receive, any interest in the properties or securities of Atacama or any
associated or affiliated companies.
9. I have read National Instrument 43‐101 Form 43‐101F1 and certify that this Technical Report has been
prepared in compliance with the foregoing Instrument and Format.
10. I consent to the filing of the Technical Report with any stock exchange and other regulatory authority and
any publication by them, including electronic publication in the public company files on their websites
accessible to the public of the Technical Report.
Dated this 15th day of March, 2013.
_________________________________
Eduardo Magri, PhD Mining Engineering

TABLE OF CONTENTS
1. SUMMARY
2. INTRODUCTION
3. RELIANCE ON OTHER EXPERTS
4. PROPERTY DESCRIPTION AND LOCATION
5. ACCESS, CLIMATE, LOCAL RESOURCES, INFRASTRUCTURE AND PHYSIOGRAPHY
6. HISTORY
7. GEOLOGICAL SETTING AND MINERALIZATION
8. DEPOSIT TYPES
9. EXPLORATION
10. DRILLING
11. SAMPLE PREPARATION, ANALYSIS AND SECURITY
12. DATA VERIFICATION
13. MINERAL PROCESSING AND METALLURGICAL TESTING
14. MINERAL RESOURCE ESTIMATES
15. MINERAL RESERVE ESTIMATES
16. MINING METHODS
17. RECOVERY METHODS
18. PROJECT INFRASTRUCTURE
19. MARKET STUDIES AND CONTRACTS
20. ENVIRONMENTAL STUDIES, PERMITTING AND SOCIAL OR COMMUNITY IMPACT
21. CAPITAL AND OPERATING COSTS
22. ECONOMIC ANALYSIS
23. ADJACENT PROPERTIES
24. OTHER RELEVANT DATA AND INFORMATION
25. INTERPRETATION AND CONCLUSIONS
26. RECOMMENDATIONS
27. REFERENCES
TABLE OF CONTENTS
1. SUMMARY ............................................................................................................................................ 17
1.1 Introduction ......................................................................................................................................... 17
1.2 Property and Location ........................................................................................................................ 17
1.3 Geology and Mineralization ............................................................................................................... 19
1.4 Exploration .......................................................................................................................................... 21
1.5 Mineral Resource Estimation ............................................................................................................. 21
1.6 Preliminary Mining Studies ................................................................................................................ 22
1.7 Metallurgical Testing Summary ......................................................................................................... 22
1.8 Mineral Processing and Recovery Methods ..................................................................................... 23
1.9 Mine Geotechnical .............................................................................................................................. 24
1.10 Plant Site Geotechnical ...................................................................................................................... 24
1.11 Site Infrastructure ............................................................................................................................... 25
1.11.1 Power Supply ........................................................................................................................................ 25
1.11.2 Site Access Roads ................................................................................................................................ 25
1.11.3 Water Supply and Sewerage Treatment ............................................................................................... 25
1.11.4 Mine Infrastructure ................................................................................................................................ 25
1.11.5 Cerro Maricunga Administration ............................................................................................................ 25
1.12 Project Implementation ...................................................................................................................... 25
1.13 Capital and Operating Cost Estimates .............................................................................................. 26
1.14 Economic Analysis ............................................................................................................................. 28
1.15 Conclusions ......................................................................................................................................... 29
1.15.1 Mineral Resource .................................................................................................................................. 29
1.15.2 Mining Studies ....................................................................................................................................... 29
1.15.3 Metallurgical Processing ....................................................................................................................... 30
1.15.4 Preliminary Economic Assessment Results .......................................................................................... 30
1.16 Recommendations .............................................................................................................................. 30
2. INTRODUCTION AND TERMS OF REFERENCE ............................................................................... 32
2.1 Introduction ......................................................................................................................................... 32
2.2 Qualified Persons ................................................................................................................................ 32
2.3 Frequently Used Acronyms, Abbreviations, Definitions, and Units of Measure ........................... 33
3. RELIANCE ON OTHER EXPERTS ...................................................................................................... 34
3.1 Qualified Persons ................................................................................................................................ 34
3.2 Other Independent Expert Persons ................................................................................................... 34
4. PROPERTY DESCRIPTION AND LOCATION .................................................................................... 35
4.1 Location ............................................................................................................................................... 35
4.2 Land Area............................................................................................................................................. 35
5. ACCESS, CLIMATE, LOCAL RESOURCES, INFRASTRUCTURE AND PHYSIOGRAPHY .............. 39
5.1 Access.................................................................................................................................................. 39

5.2 Climate ................................................................................................................................................. 39
5.3 Local Resources and Infrastructure .................................................................................................. 39
5.4 Physiography ...................................................................................................................................... 40
6. HISTORY .............................................................................................................................................. 41
6.1 Cerro Maricunga History .................................................................................................................... 41
6.2 Recent Exploration at Cerro Maricunga ............................................................................................ 41
7. GEOLOGY ............................................................................................................................................ 42
7.1 Regional Geology ................................................................................................................................ 42
7.2 Local Geology ..................................................................................................................................... 43
7.3 Deposit Geology and Mineralization ................................................................................................. 45
8. DEPOSIT TYPES .................................................................................................................................. 47
9. EXPLORATION .................................................................................................................................... 48
10. DRILLING ............................................................................................................................................. 49
11. SAMPLE PREPARATION, ANALYSES AND SECURITY ................................................................... 51
11.1 Sample Preparation ............................................................................................................................ 51
11.2 Analysis and Security ......................................................................................................................... 54
12. DATA VERIFICATION .......................................................................................................................... 55
12.1 Data Management ............................................................................................................................... 55
12.2 Analysis of Duplicate Samples .......................................................................................................... 55
12.3 Analysis of Standard Samples and Blank acquired at Geostats Pty .............................................. 57
12.4 Analysis of In-House Blank Samples ................................................................................................ 61
12.5 Analysis of Commercial Blank Samples ........................................................................................... 62
13. MINERAL PROCESSING AND METALLURGICAL TESTING ............................................................ 64
13.1 Characterization of samples .............................................................................................................. 64
13.1.1 Physical characterization ...................................................................................................................... 64
13.1.2 Chemical characterization ..................................................................................................................... 64
13.2 CYANIDATION Tests ........................................................................................................................... 65
13.2.1 Bottle Roll Tests (BRT) ......................................................................................................................... 65
13.2.2 Column percolation leach testwork (CLT) ............................................................................................. 73
13.2.3 Effect of grade in gold extraction ........................................................................................................... 74
13.2.4 Conclusions ........................................................................................................................................... 75
14. MINERAL RESOURCE ESTIMATE ..................................................................................................... 76
14.1 Modelling Procedure ........................................................................................................................... 76
14.2 Exploratory Data Analyses ................................................................................................................. 77
14.3 Database Description ......................................................................................................................... 78
14.4 Compositing, Statistics, Outliers, Declustering and Estimation Domains .................................... 79
14.5 Variography ......................................................................................................................................... 82
14.6 Block Model and Resource Estimation ............................................................................................. 82

14.7 Validations ........................................................................................................................................... 85
14.8 Specific Gravity Model ........................................................................................................................ 86
14.9 Resource Categorization .................................................................................................................... 87
14.10 Resource Tabulation ........................................................................................................................... 91
15. MINERAL RESERVES ESTIMATE ...................................................................................................... 94
16. MINING METHODS .............................................................................................................................. 95
16.1 Summary .............................................................................................................................................. 95
16.2 Geotechnical Studies .......................................................................................................................... 95
16.3 Pit Optimization and Mine Design ..................................................................................................... 96
16.3.1 Whittle Pit Optimization Model Construction ......................................................................................... 96
16.3.2 Base Parameters .................................................................................................................................. 97
16.3.3 Whittle Four-X Economic Shells Results ............................................................................................... 98
16.3.4 Pit Design .............................................................................................................................................. 98
16.4 Mine Production Schedule ............................................................................................................... 101
16.5 Waste Storage Area .......................................................................................................................... 103
16.6 Mine Equipment ................................................................................................................................ 104
16.7 Mine Personnel .................................................................................................................................. 105
17. MINERAL PROCESSING AND RECOVERY METHODS .................................................................. 107
17.1 Primary Crushing and Coarse Stockpile ......................................................................................... 107
17.2 Secondary and Tertiary Crushing .................................................................................................... 111
17.3 Heap Leaching ................................................................................................................................... 111
17.4 ADR, EW, and Smelting .................................................................................................................... 112
18. PROJECT INFRASTURUCTURE ....................................................................................................... 113
18.1 Introduction ....................................................................................................................................... 113
18.1.1 Water Supply ....................................................................................................................................... 113
18.1.2 Process Plant Earthworks ................................................................................................................... 113
18.1.3 Roads .................................................................................................................................................. 113
18.1.4 Site Accommodation ........................................................................................................................... 114
18.1.5 Power Supply ...................................................................................................................................... 114
18.1.6 Maintenance Facilities and Fuel Storage ............................................................................................ 115
18.1.7 Potable Water Supply ......................................................................................................................... 115
18.1.8 Waste Treatment ................................................................................................................................. 115
18.1.9 Vehicle Washdown .............................................................................................................................. 115
18.1.10 Heavy Vehicle Workshop .................................................................................................................... 115
18.1.11 Administration Office Complex ............................................................................................................ 115
18.1.12 Laboratory and Reagents Plant .......................................................................................................... 115
18.1.13 Communications ................................................................................................................................. 116
18.2 Mining Facilities ................................................................................................................................ 116
18.2.1 Magazine & Fuel Storage .................................................................................................................... 116
18.2.2 Workshop ............................................................................................................................................ 116
19. MARKETING ...................................................................................................................................... 117
20. ENVIRONMENTAL STUDIES, PERMITTING AND SOCIAL OR COMMUNITY IMPACT ................. 118
20.1 Summary ............................................................................................................................................ 118
20.2 Social.................................................................................................................................................. 118
20.2.1 Social Monitoring Programs ................................................................................................................ 119
20.3 Hydrology .......................................................................................................................................... 119
20.4 Biological Component ...................................................................................................................... 120
20.4.1 Biological Monitoring Programs .......................................................................................................... 121
20.5 Protected Areas ................................................................................................................................. 121
20.6 Environmental Issues ....................................................................................................................... 122
20.7 Closure and Reclamation ................................................................................................................. 123
21. CAPITAL AND OPERATING COSTS ................................................................................................ 124
21.1 Capital ................................................................................................................................................ 124
21.1.1 Process Plant and Infrastructure ......................................................................................................... 124
21.1.2 Mining.................................................................................................................................................. 131
21.1.3 EPCM .................................................................................................................................................. 133
21.1.4 Contingencies ..................................................................................................................................... 133
21.2 Operating ........................................................................................................................................... 133
21.2.1 Process Plant ...................................................................................................................................... 133
21.2.2 Mining.................................................................................................................................................. 135
21.2.3 General and Administrative (G&A) Costs ............................................................................................ 137
22. ECONOMIC ANALYSIS ..................................................................................................................... 138
22.1 Taxes and Royalties .......................................................................................................................... 138
22.2 Economic Analysis ........................................................................................................................... 139
22.3 Sensitivity Analysis .......................................................................................................................... 144
23. ADJACENT PROPERTIES ................................................................................................................ 145
24. OTHER RELEVANT DATA ................................................................................................................ 146
24.1 Plant Geotechnical ............................................................................................................................ 146
24.2 Operations Project Organisation ..................................................................................................... 147
24.3 Project Implementation .................................................................................................................... 148
24.4 Hydrogeology – Water Exploration ................................................................................................. 149
25. INTERPRETATION AND CONCLUSIONS ........................................................................................ 151
25.1 Mineral Resource .............................................................................................................................. 151
25.2 Mining Studies ................................................................................................................................... 151
25.3 Metallurgical Information and Process Design .............................................................................. 151
25.4 Preliminary Economic Assessment Results .................................................................................. 152
26. RECOMMENDATIONS ....................................................................................................................... 153
26.1 Drilling ................................................................................................................................................ 153
26.2 Mining................................................................................................................................................. 153

26.3 Proposed Budget .............................................................................................................................. 153
27. REFERENCES .................................................................................................................................... 154

LIST OF FIGURES
Figure 1 Location and Access Map .................................................................................................................................... 18
Figure 2 Geology of Cerro Maricunga (Dietrich, 2010) ....................................................................................................... 20
Figure 3 Detailed Location Map of the Cerro Maricunga Gold Project (source SBX) ......................................................... 35
Figure 4 Cerro Maricunga Concession Map (source SBX) ................................................................................................. 36
Figure 5 Regional Geology Map (source SBX) ................................................................................................................... 43
Figure 6 Local Geology Map (source SBX) ........................................................................................................................ 45
Figure 7 Litho - Stratigraphic Map (source SBX) ................................................................................................................ 46
Figure 8 Maricunga Project – Drill Hole Plan – Phases I to III (source SBX) ..................................................................... 50
Figure 9 Sample Preparation Protocol – RC and QA/QC ................................................................................................... 52
Figure 10 Sample Preparation Protocol – DDH and QA/QC ........................................................................................... 53
Figure 11 Results for all standards .................................................................................................................................. 58
Figure 12 Control chart for standard G303-8 ................................................................................................................... 59
Figure 13 Control chart for standard G909-7 ................................................................................................................... 59
Figure 14 Control chart for standard G907-2 ................................................................................................................... 60
Figure 15 Control chart for standard G907-7 ................................................................................................................... 60
Figure 16 Gold Grade Values per Lot – In House Blanks ................................................................................................ 61
Figure 17 Time Sequenced Au Values – In House Blanks .............................................................................................. 62
Figure 18 Geostats Blank Certified Material- Au .............................................................................................................. 63
Figure 19 Effect of mineralized material particle size distribution on gold extraction. Bottle roll tests. ............................ 72
Figure 20 Gold extraction versus gold head grade. Column testwork at 19 mm ............................................................. 75
Figure 21 Three-D View of Cerro Maricunga’s Mineralized Zones .................................................................................. 77
Figure 22 Cell Declustering for Lynx, Phoenix, Pollux and Crux zones separately ......................................................... 80
Figure 23 Cell declustering for the northern and all Mineralised zones combined .......................................................... 81
Figure 24 Cell declustering for all samples lying outside the mineralized envelopes ...................................................... 81
Figure 25 Distribution of Specific Gravity Values (North=1, Central=2, South=3) ........................................................... 87
Figure 26 Lynx Resource Categorization Cross Section (2150) ...................................................................................... 90
Figure 27 Phoenix Resource Categorization Cross Section (1550) ................................................................................ 90
Figure 28 Phoenix plus Pollux Resource Categorization Cross Section (1150) .............................................................. 91
Figure 29 Crux Resource Categorization Cross Section (550) ........................................................................................ 91
Figure 30 Final Pit Design ................................................................................................................................................ 99
Figure 31 Mining Phases ............................................................................................................................................... 100
Figure 32 General Mine Layout ..................................................................................................................................... 104
Figure 33 General Processing Schematic Diagram. ...................................................................................................... 108
Figure 34 Schematic Diagram (Crushing Stage) ........................................................................................................... 109
Figure 35 Plan of the Processing Operations ................................................................................................................ 110
Figure 36 Heap Leaching Area ...................................................................................................................................... 112
Figure 37 Cerro Maricunga projected road .................................................................................................................... 114
Figure 38 Gold Spot Price – February 23, 2008 to February 22, 2013 (Source: www.kitco.com) ................................. 117
Figure 39 Watersheds and ravines in the Project Area of Influence (ARCADIS, August 2011) .................................... 120
Figure 40 Project Area in relation to the NevadoTres Cruces Priority Site (green) and the National Park (yellow)
situated within the Priority Site (ARCADIS, May 2011). ......................................................................................................... 122
Figure 41 Properties Adjacent to the Maricunga Project ............................................................................................... 145
Figure 42 Approximate location of trial pits .................................................................................................................... 146
Figure 43 Water Exploration Zone ................................................................................................................................. 149

LIST OF TABLES
Table 1 Summary of Drilling Stages .................................................................................................................................. 21
Table 2 Global Mineral Resource Estimate-Cerro Maricunga - November, 2012 ............................................................. 21
Table 3 Mine Schedule Summary ..................................................................................................................................... 22
Table 4 Mine, Process Plant and Infrastructure CAPEX Summary ................................................................................... 26
Table 5 Process Plant Operating Cost Per Tonnes Summary (US$/t processed) ............................................................ 27
Table 6 Mining Operating Cost per Tonne Summary (US$/t mined) ................................................................................. 27
Table 7 Leasing Option (Mining Equipment & Power Supply) ........................................................................................... 27
Table 8 Economical Evaluation Results Summary ............................................................................................................ 28
Table 9 Technical Report Responsibility Matrix ................................................................................................................ 32
Table 10 Frequently used acronyms and abbreviations ...................................................................................................... 33
Table 11 Maricunga Mining Concessions ............................................................................................................................ 36
Table 12 Cerro Maricunga Exploration Concessions .......................................................................................................... 37
Table 13 Cerro Maricunga Drilling Phases – Meters Drilled & Meters Assayed ................................................................. 49
Table 14 Cerro Maricunga Database Quality Assessment and Quality Control .................................................................. 55
Table 15 Summary of QA-QC results for duplicate samples – Au ...................................................................................... 56
Table 16 Summary of QAQC results for duplicate samples ≥0.1 ppm-Au .......................................................................... 57
Table 17 QA-QC criteria and results for Au duplicates. ....................................................................................................... 57
Table 18 Summary for Standard Samples .......................................................................................................................... 58
Table 19 Blanks used for quality control and assurance ..................................................................................................... 61
Table 20 Hardness and abrasion index results ................................................................................................................... 64
Table 21 Sample head grad ................................................................................................................................................ 65
Table 22 Bottle roll tests results of Composite 1 ................................................................................................................. 66
Table 23 Bottle roll tests results of Composite 2 ................................................................................................................. 67
Table 24 Bottle roll tests results of Composite 3 ................................................................................................................. 67
Table 25 Bottle roll tests results of Composite 4 ................................................................................................................. 68
Table 26 Bottle roll tests results of Composite 5 ................................................................................................................. 69
Table 27 Bottle roll tests results of Composite 6 ................................................................................................................. 70
Table 28 Bottle roll tests results of Composite 7 ................................................................................................................. 71
Table 29 Columns percolation leach testwork ..................................................................................................................... 73
Table 30 Column test results after 57 days, P80 = 19 mm .................................................................................................. 74
Table 31 Cerro Maricunga Drilling Phases – Meters Drilled & Meters Assayed ................................................................. 78
Table 32 Basic Sample Statistics ........................................................................................................................................ 79
Table 33 Cerro Maricunga Correlogram calculation parameters ......................................................................................... 82
Table 34 Cerro Maricunga Correlogram modeling parameters ........................................................................................... 82
Table 35 Au Estimation Plan parameters ............................................................................................................................ 84
Table 36 Estimated Block Model Statistics .......................................................................................................................... 85
Table 37 Statistics – Specific Gravity Determinations ......................................................................................................... 86
Table 38 Specific Gravity Estimation Plan ........................................................................................................................... 87
Table 39 Additional Data used for Resource Categorization ............................................................................................... 88
Table 40 Kriging Errors for 50 x 50 and 50 x 100 grids ....................................................................................................... 89

Table 41 Kriging Estimation Variances for 50 x 50 and 50 x 100 grids ............................................................................... 89
Table 42 CerroMaricunga Project – Geological Resources November, 2012 - Summary .................................................. 92
Table 43 CerroMaricunga Project – Geological Resources November, 2012 – per Sector ................................................ 92
Table 44 Cerro Maricunga Oxide Gold Project Pit Constrained Resource Estimate ........................................................... 93
Table 45 Tonnage/Grade for In-Situ and Diluted Models .................................................................................................... 97
Table 46 Initial Lerch-Grossman Optimization Parameters ................................................................................................. 97
Table 47 Pit Optimization Results ....................................................................................................................................... 98
Table 48 Total Pit Constrained Mineralization ................................................................................................................... 100
Table 49 Pit Constrained Mineralization in Mining Phases at Various Cut-Off Grades ..................................................... 101
Table 50 Mine Production Schedule .................................................................................................................................. 103
Table 51 Mining Equipment Requirement ......................................................................................................................... 105
Table 52 Overall Capital Costs .......................................................................................................................................... 124
Table 53 Areas included in the cost estimation ................................................................................................................. 125
Table 54 General overview of initial infrastructure capital cost ......................................................................................... 126
Table 55 General overview of process plant initial capital costs ....................................................................................... 127
Table 56 Infrastructure initial capital costs summary ......................................................................................................... 128
Table 57 Initial process plant capital costs summary ........................................................................................................ 129
Table 58 Heap leaching on-going capital costs summary ................................................................................................. 130
Table 59 Mining Support Equipment and Initial Works ...................................................................................................... 132
Table 60 Leasing of Mining Equipment ............................................................................................................................. 133
Table 61 Plant operating costs .......................................................................................................................................... 134
Table 62 Mining Operating Cost (US$ ‘000) ...................................................................................................................... 136
Table 63 Mining Operating Costs (US$/t mined) ............................................................................................................... 136
Table 64 G&A operating costs ........................................................................................................................................... 137
Table 65 Economical model general parameters .............................................................................................................. 138
Table 66 Economical Evaluation Results Summary .......................................................................................................... 139
Table 67 Cash Flow Economical Model ............................................................................................................................ 140
Table 68 Sensitivity – Gold Price and Discount Rate ........................................................................................................ 144
Table 69 Sensitivity – Gold Price and Operating Cost ...................................................................................................... 144
Table 70 Sensitivity – Gold Price and Capital Cost ........................................................................................................... 144
Table 71 Main Adjacent Properties to Cerro Maricunga .................................................................................................... 145
Table 72 Process plant personnel ..................................................................................................................................... 148
Table 73 Economical Evaluation Results Summary .......................................................................................................... 152
Atacama Pacific Gold Corporation Page 17 Cerro Maricunga Oxide Gold Project Preliminary Economic Assessment
1. SUMMARY
1.1 Introduction
This technical report describes the Cerro Maricunga Oxide Gold Project (the “Project” or “Cerro
Maricunga Project”), which is located in the Copiapó Province, III Region, Chile and summarizes the
results of a Preliminary Economic Assessment (“PEA”) undertaken on the Cerro Maricunga deposit.
The Project is held by Atacama Pacific through its local subsidiary Minera Atacama Pacific Gold Chile
Limitada (“Atacama”, “Atacama Pacific”, or “the Company”).
Gold mineralization at Cerro Maricunga is confined to a NW-SE trending corridor consisting of a
porphyry and breccia complex bounded by fault structures. The mineralization has been recognized
along a 2,300m NW-SE trending strike, over widths of up to 700m in a NE-SW direction and to depths
of over 550m (up to 4,400masl) and remains open at depth.
Three mineralized sectors have been distinguished, based on gold distribution on trenches, outcrops
and drill holes; LYNX zone (NW sector), PHOENIX zone (central sector) and CRUX zone (SE sector),
and approximately coincide with the three faulted block defined by Dietrich (2010). A fourth zone, the
POLLUX zone, represents a subzone of the Phoenix zone.
This technical report considers the potential development options for the Project and is based upon
the November, 9, 2012, NI 43-101 compliant mineral resource estimate prepared by Magri which, in
turn, took into account results presented in NI 43-101 reports on the Cerro Maricunga Project dated
October 7, 2011 and August 20, 2010.
1.2 Property and Location
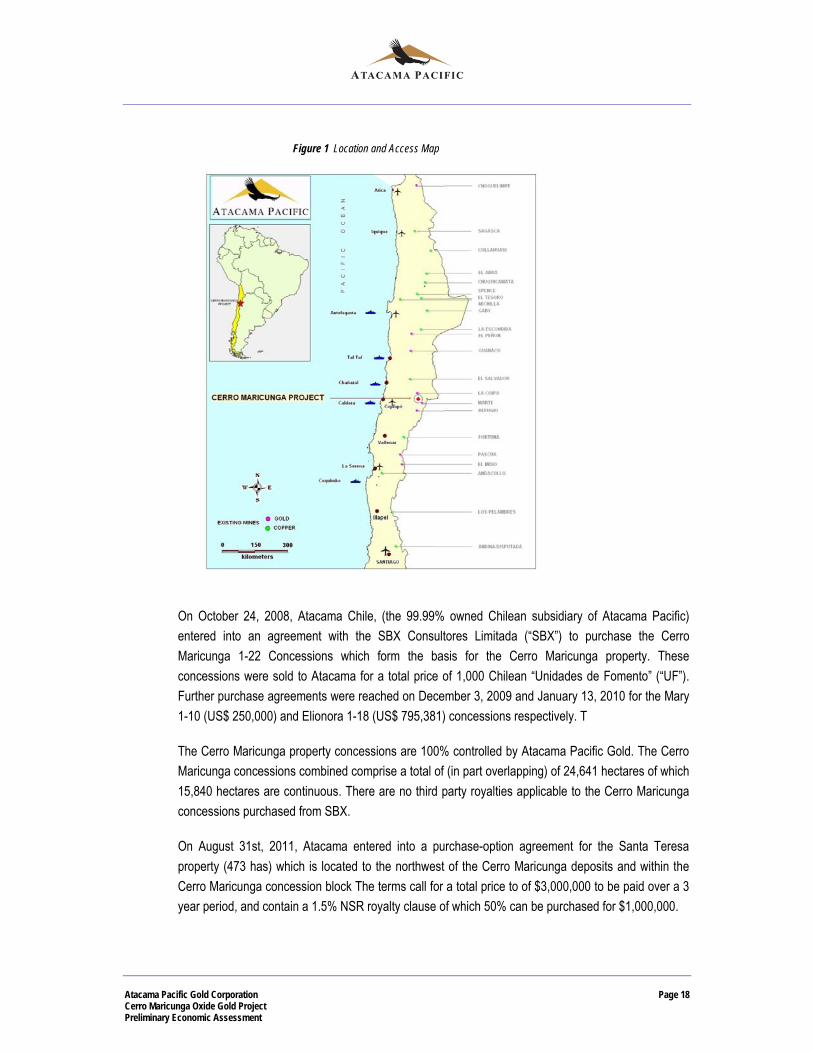
The Maricunga Project is located in the high Andes approximately 117 straight-line km northeast of the
city of Copiapó as depicted in Figure 1.1. Road access to the project area is generally good. Although
there is a producing silver-gold mine (La Coipa) and other former producing mines in relatively close
proximity to Maricunga, there is no significant infrastructure in the immediate area of the Project.
Atacama Pacific is a Canadian exploration company with expertise in the identification, acquisition,
exploration and development of precious metal mining projects. Through its Chilean subsidiary,
Minera Atacama Pacific Gold Chile Limitada (“Atacama Chile”, or “Atacama”), owns and controls the
Maricunga property.
Atacama Pacific Gold Corporation Page 18 Cerro Maricunga Oxide Gold Project Preliminary Economic Assessment
Figure 1 Location and Access Map
On October 24, 2008, Atacama Chile, (the 99.99% owned Chilean subsidiary of Atacama Pacific)
entered into an agreement with the SBX Consultores Limitada (“SBX”) to purchase the Cerro
Maricunga 1-22 Concessions which form the basis for the Cerro Maricunga property. These
concessions were sold to Atacama for a total price of 1,000 Chilean “Unidades de Fomento” (“UF”).
Further purchase agreements were reached on December 3, 2009 and January 13, 2010 for the Mary
1-10 (US$ 250,000) and Elionora 1-18 (US$ 795,381) concessions respectively. T
The Cerro Maricunga property concessions are 100% controlled by Atacama Pacific Gold. The Cerro
Maricunga concessions combined comprise a total of (in part overlapping) of 24,641 hectares of which
15,840 hectares are continuous. There are no third party royalties applicable to the Cerro Maricunga
concessions purchased from SBX.
On August 31st, 2011, Atacama entered into a purchase-option agreement for the Santa Teresa
property (473 has) which is located to the northwest of the Cerro Maricunga deposits and within the
Cerro Maricunga concession block The terms call for a total price to of $3,000,000 to be paid over a 3
year period, and contain a 1.5% NSR royalty clause of which 50% can be purchased for $1,000,000.
Atacama Pacific Gold Corporation Page 19 Cerro Maricunga Oxide Gold Project Preliminary Economic Assessment
1.3 Geology and Mineralization
Geological background presented herein this section is based on studies carried out by the following
geologists: Andreas Dietrich (2010), Andrew Hodgkin (2010-2011), Sergio Díaz (2009-2011), Pablo
Villegas (2010-2011), and Pamela Castillo (2011). Furthermore, petrographical descriptions were
carried out by Paula Cornejo (2010-2012) and gold deportment studies by AMTEL (2010-2011).
Lithology
Surface mapping, trenching and drilling indicate that gold mineralization at Cerro Maricunga is
confined to a NW-SE trending corridor consisting of a porphyry and breccia complex bounded by fault
structures. The mineralization has been recognized along a 2,300m NW-SE-trending strike over
widths of up to 700m in a NE-SW direction and to depths of over 550m in depth (up to 4,400 masl)
and remains open at depth.
Three mineralized sectors have been distinguished, based on gold distribution on trenches, outcrops
and drillholes; LYNX zone (NW sector), PHOENIX zone (central sector) and CRUX zone (SE sector),
and approximately coincide with the three faulted block defined by Dietrich (2010). A fourth zone, the
POLLUX zone, represents a subzone of the Phoenix zone. Mineralization is still open to the N, NW
and S of Lynx zone; W of Phoenix zone and to the SE towards Crux zone connection, and N of Crux
zone.
Gold mineralization at Cerro Maricunga is hosted in a porphyry and breccia complex, usually
associated to black banded veinlets (BBV).

Atacama Pacific Gold Corporation Page 20 Cerro Maricunga Oxide Gold Project Preliminary Economic Assessment
Figure 2 Geology of Cerro Maricunga (Dietrich, 2010)
Mineralization
Gold mineralization at Cerro Maricunga is generally associated to black and grey banded veinlets
(BBV) and to early chlorite-magnetite-quartz veinlets occurring in porphyry units, breccia and
surrounding andesitic dikes and plugs. These characteristics are consistent with other Maricunga Belt
gold porphyry deposits (i.e. El Volcán, Refugio, Marte-Lobo, etc.).
Gold deportment studies carried out in AMTEL have shown that gold mineralization in Cerro
Maricunga occurs as fine (less than 10 microns) native gold of high purity, approximately 97%, with
minor silver up to 6%. Gold is preferentially associated with iron oxides; however, rock mineral
particles are principal carriers of gold. Sulfides, essentially pyrite and minor covellite were rarely
observed (<0.1%).
Atacama Pacific Gold Corporation Page 21 Cerro Maricunga Oxide Gold Project Preliminary Economic Assessment
1.4 Exploration
The work that Atacama has conducted at Cerro Maricunga consisting of trenching, mapping,
geophysics, and 3 stages of drilling, has been designed to explore for gold mineralization and to
initiate and advance the development of mineral resources. A summary of exploration drilling is
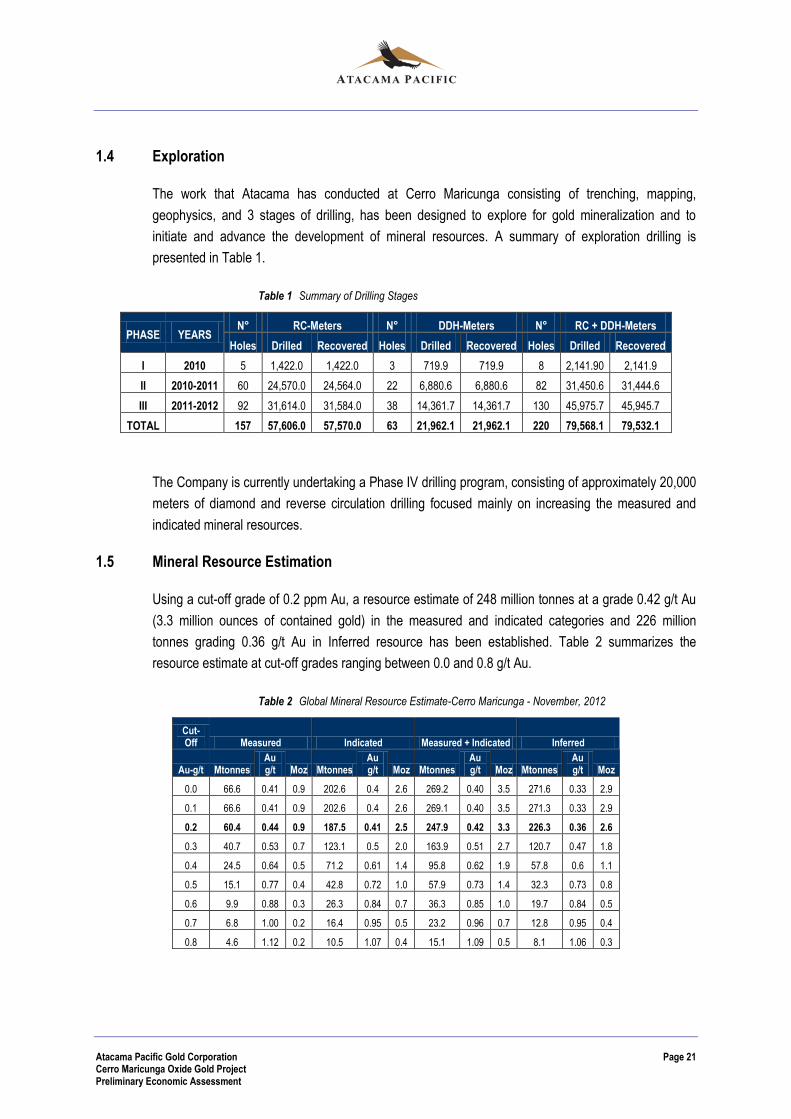
presented in Table 1.
Table 1 Summary of Drilling Stages
PHASE YEARS N° RC-Meters N° DDH-Meters N° RC + DDH-Meters
Holes Drilled Recovered Holes Drilled Recovered Holes Drilled Recovered
I 2010 5 1,422.0 1,422.0 3 719.9 719.9 8 2,141.90 2,141.9
II 2010-2011 60 24,570.0 24,564.0 22 6,880.6 6,880.6 82 31,450.6 31,444.6
III 2011-2012 92 31,614.0 31,584.0 38 14,361.7 14,361.7 130 45,975.7 45,945.7
TOTAL
157 57,606.0 57,570.0 63 21,962.1 21,962.1 220 79,568.1 79,532.1
The Company is currently undertaking a Phase IV drilling program, consisting of approximately 20,000
meters of diamond and reverse circulation drilling focused mainly on increasing the measured and
indicated mineral resources.
1.5 Mineral Resource Estimation
Using a cut-off grade of 0.2 ppm Au, a resource estimate of 248 million tonnes at a grade 0.42 g/t Au
(3.3 million ounces of contained gold) in the measured and indicated categories and 226 million
tonnes grading 0.36 g/t Au in Inferred resource has been established. Table 2 summarizes the
resource estimate at cut-off grades ranging between 0.0 and 0.8 g/t Au.
Table 2 Global Mineral Resource Estimate-Cerro Maricunga - November, 2012
Cut-Off Measured Indicated Measured + Indicated Inferred
Au-g/t Mtonnes Au g/t Moz Mtonnes
Au g/t Moz Mtonnes
Au g/t Moz Mtonnes
Au g/t Moz
0.0 66.6 0.41 0.9 202.6 0.4 2.6 269.2 0.40 3.5 271.6 0.33 2.9
0.1 66.6 0.41 0.9 202.6 0.4 2.6 269.1 0.40 3.5 271.3 0.33 2.9
0.2 60.4 0.44 0.9 187.5 0.41 2.5 247.9 0.42 3.3 226.3 0.36 2.6
0.3 40.7 0.53 0.7 123.1 0.5 2.0 163.9 0.51 2.7 120.7 0.47 1.8
0.4 24.5 0.64 0.5 71.2 0.61 1.4 95.8 0.62 1.9 57.8 0.6 1.1
0.5 15.1 0.77 0.4 42.8 0.72 1.0 57.9 0.73 1.4 32.3 0.73 0.8
0.6 9.9 0.88 0.3 26.3 0.84 0.7 36.3 0.85 1.0 19.7 0.84 0.5
0.7 6.8 1.00 0.2 16.4 0.95 0.5 23.2 0.96 0.7 12.8 0.95 0.4
0.8 4.6 1.12 0.2 10.5 1.07 0.4 15.1 1.09 0.5 8.1 1.06 0.3
Atacama Pacific Gold Corporation Page 22 Cerro Maricunga Oxide Gold Project Preliminary Economic Assessment
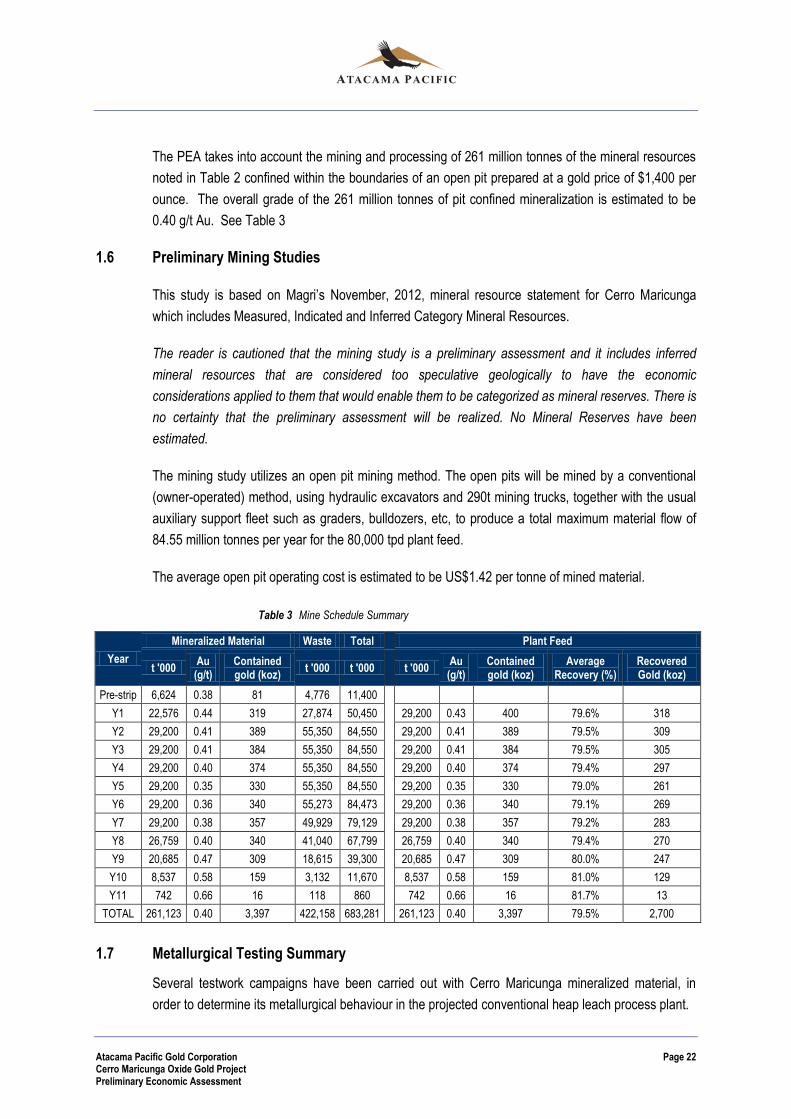
The PEA takes into account the mining and processing of 261 million tonnes of the mineral resources
noted in Table 2 confined within the boundaries of an open pit prepared at a gold price of $1,400 per
ounce. The overall grade of the 261 million tonnes of pit confined mineralization is estimated to be
0.40 g/t Au. See Table 3
1.6 Preliminary Mining Studies
This study is based on Magri’s November, 2012, mineral resource statement for Cerro Maricunga
which includes Measured, Indicated and Inferred Category Mineral Resources.
The reader is cautioned that the mining study is a preliminary assessment and it includes inferred
mineral resources that are considered too speculative geologically to have the economic
considerations applied to them that would enable them to be categorized as mineral reserves. There is
no certainty that the preliminary assessment will be realized. No Mineral Reserves have been
estimated.
The mining study utilizes an open pit mining method. The open pits will be mined by a conventional
(owner-operated) method, using hydraulic excavators and 290t mining trucks, together with the usual
auxiliary support fleet such as graders, bulldozers, etc, to produce a total maximum material flow of
84.55 million tonnes per year for the 80,000 tpd plant feed.
The average open pit operating cost is estimated to be US$1.42 per tonne of mined material.
Table 3 Mine Schedule Summary
Year
Mineralized Material Waste Total
Plant Feed
t '000 Au (g/t)
Contained gold (koz)
t '000 t '000
t '000 Au (g/t)
Contained gold (koz)
Average Recovery (%)
Recovered Gold (koz)
Pre-strip 6,624 0.38 81 4,776 11,400
Y1 22,576 0.44 319 27,874 50,450
29,200 0.43 400 79.6% 318
Y2 29,200 0.41 389 55,350 84,550
29,200 0.41 389 79.5% 309
Y3 29,200 0.41 384 55,350 84,550
29,200 0.41 384 79.5% 305
Y4 29,200 0.40 374 55,350 84,550
29,200 0.40 374 79.4% 297
Y5 29,200 0.35 330 55,350 84,550
29,200 0.35 330 79.0% 261
Y6 29,200 0.36 340 55,273 84,473
29,200 0.36 340 79.1% 269
Y7 29,200 0.38 357 49,929 79,129
29,200 0.38 357 79.2% 283
Y8 26,759 0.40 340 41,040 67,799
26,759 0.40 340 79.4% 270
Y9 20,685 0.47 309 18,615 39,300
20,685 0.47 309 80.0% 247
Y10 8,537 0.58 159 3,132 11,670
8,537 0.58 159 81.0% 129
Y11 742 0.66 16 118 860
742 0.66 16 81.7% 13
TOTAL 261,123 0.40 3,397 422,158 683,281
261,123 0.40 3,397 79.5% 2,700
1.7 Metallurgical Testing Summary
Several testwork campaigns have been carried out with Cerro Maricunga mineralized material, in
order to determine its metallurgical behaviour in the projected conventional heap leach process plant.

Atacama Pacific Gold Corporation Page 23 Cerro Maricunga Oxide Gold Project Preliminary Economic Assessment
The main objective of these campaigns was to study the material behaviour in a cyanidation process,
and hence Bottle Rolled Tests (“BRT”) and Column Leaching Test (“CLT”) were performed, under
different conditions.
Although numerous metallurgical testing campaigns have been completed, for consistency proposes
only those tests completed on seven composited samples collected from throughout the Cerro
Maricunga deposits have been used to estimate a gold recovery for a proposed heap leaching
processing facility. The results from the other testing programs are similar to those achieved from the
seven composite samples and are presented and/or referenced in the November 9, 2012 technical
report.
For BRT seven composites were tested, whose head grades range from 0.28 to 1.45 g/t Au. Several
particle size distributions were analysed, from P80 50 mm to P80 0.1 mm. All other conditions, such
as cyanide concentration, solids percentage and pH level, were maintained identical for all tests. The
tests were run between 4 and 10 days.
The results of the BRT tests show a correlation between the gold extraction in cyanidation and the
material P80 crush size; gold extraction increases when the crush size decreases. However, at this
time, little differences in the gold extraction are observed for coarser material (P80 over 12.5 mm).
Column tests were performed on 6 of the 7 samples (composite 3 was not considered for this
campaign). The tests also contemplated different material sizes, from P80 100 mm to P80 19 mm. All
other conditions were maintained the same for all tests, which were run for 57 or 87 days.
The results show that for a P80 of 19 mm a gold extraction of 80% can be expected, when the
mineralized material head grade is over 0.5 g/t Au. When the gold extractions in all tests are
calculated for a common time residence of 57 days, a correlation is found between the gold extraction
and the gold grade in the material. This correlation has been used to estimate the gold to be
produced, considering the gold grade defined in the proposed mining plan. The average overall gold
recovery estimated for the proposed mining plan is 79.5%, including 99.5% for EW and 99.5% for
refining..
1.8 Mineral Processing and Recovery Methods
The processing operation was designed for a nominal throughput of 80,000 tonne per day (tpd) with
an average head grade of 0.4 g/t of Au. Resources are estimated about 261 Mt, givining 10 years of
project life.
It is considered an average of 80.3% of the gold will be recovered through heap cyanidation. The
recovery for the EW and smelting is considered to be 99.5% for each stage. The overall gold recovery
is considered to be an average of 79.5%.
The final product of the process plant corresponds to dore bullion, with at least 80% of gold content.

Atacama Pacific Gold Corporation Page 24 Cerro Maricunga Oxide Gold Project Preliminary Economic Assessment
The following stages comprised in the process plant:
Crushing
Heap leaching
Solution management
ADR, EW and smelting
The average processing cost is estimated to be US$2.56 per tonne of processed material.
1.9 Mine Geotechnical
Santiago-based A. Karzulovic & Assoc Ltd (“AKL”) carried out the geotechnical evaluation and
determined the geomechanical parameters to be used in the proposed open pit and underground
mining operations at Cerro Maricunga.
In general rock conditions in proposed mining areas appear to be stable and largely free from any
significant structures.
AKL has recommended an overall pit slope 45° for all the pits at Cerro Maricunga.
1.10 Plant Site Geotechnical
A geotechnical study has been developed in the area where the leaching pad and ADR plant will be
located.
The subsurface stratigraphy of the site is mainly formed by a single type of material; silty sandy gravel
with blocks, which only distinguishing characteristic is the coloring change in the upper part caused by
a higher content of fine material, without significant granulometric or structural differences, all through
its depth and areal distribution.
According to the above, the natural soil stratum can be used as a foundation soil, from the minimal
seal depth established (0.5 m) and as long as the contact pressures are restricted to the
recommended values.
It is convenient that the foundations support is constructed over a layer of equal or higher stiffness
than the intact natural soil; it is recommended that once the excavations reach the seal depth, a
mechanical compacting shall be performed over the superficial material of the seal, in order to reach
at least a 95% of the maximum density obtained in the Procter test.
Atacama Pacific Gold Corporation Page 25 Cerro Maricunga Oxide Gold Project Preliminary Economic Assessment
1.11 Site Infrastructure
1.11.1 Power Supply
The electrical study considers an area for a supply connection from the Carrera Pinto substation,
which belongs to the Sistema Interconectado Central (SIC) and a three-phase transmission line in a
simple circuit of 220 kV with a length of 70km that goes to a final substation, located near the plant
site.
1.11.2 Site Access Roads
For the access road it has been considered to design a 22km road, connected from the International
Ch 31 road and over an existing trace.
1.11.3 Water Supply and Sewerage Treatment
The project considers a saline water pumping system from wells located in an area nearby the Salar
de Pedernales, located approximately 100km north of the Cerro Maricunga property.
1.11.4 Mine Infrastructure
It is anticipated that the vendors will provide storage for fuel, lubricants, and explosives as part of their
contract of work and that the prices for these items are included in the delivered price.
Truck workshop is planned to be built near the mine, close to the primary crusher area. A local
experienced manufacturer was contacted to provide a 4 bays facility.
1.11.5 Cerro Maricunga Administration
The following administration and plant buildings will be newly constructed for the Project:
Main administration building with medical centre, rescue room and training room
Security office and gatehouse
Laboratory
Metallurgical office/laboratory
Plant crib room and training room
Plant workshop and warehouse
Reagent and sodium cyanide storage
Office space requirements have been defined by the proposed departmental staffing structures.
1.12 Project Implementation
Atacama Pacific must complete an environmental impact study, a feasibility study and an EPCM
contract, in order to meet all the required technical studies for the Cerro Maricunga project
development to commence.
Atacama Pacific Gold Corporation Page 26 Cerro Maricunga Oxide Gold Project Preliminary Economic Assessment
Once the regional authorities approve the environmental impact study, a construction program and
pre-stripping activities can commence.
The construction phase of the Cerro Maricunga Project is estimated to last 19 months, beginning in
August 2015. The climatic conditions and altitude are of consideration, with major foundation work to
be completed during the early summer months. A proposed development timeline is presented below.
Advanced Economic Studies July 2013 – April 2014
Environmental Impact Preparation August 2013 – June 2014
Permitting / EPCM Contract August 2013 – August 2015
Construction August 2015 – March 2017
Start up and Commissioning March 2017 – June 2017
Start of Operations June 2017
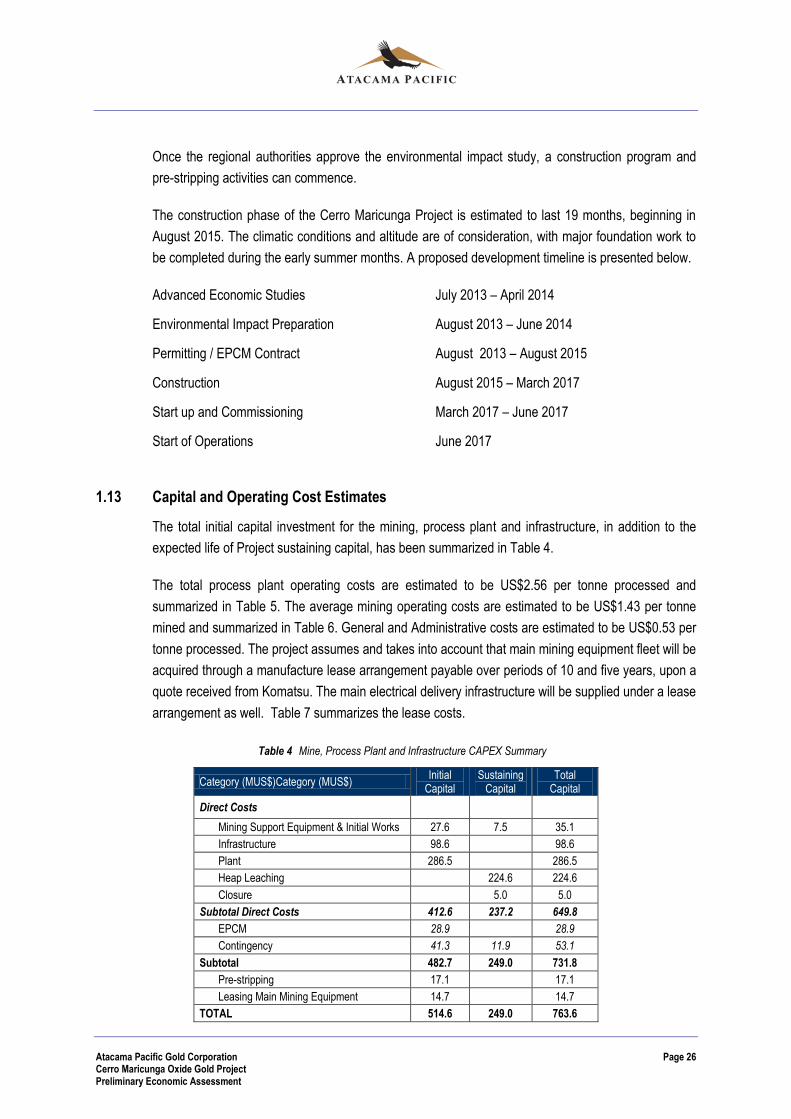
1.13 Capital and Operating Cost Estimates
The total initial capital investment for the mining, process plant and infrastructure, in addition to the
expected life of Project sustaining capital, has been summarized in Table 4.
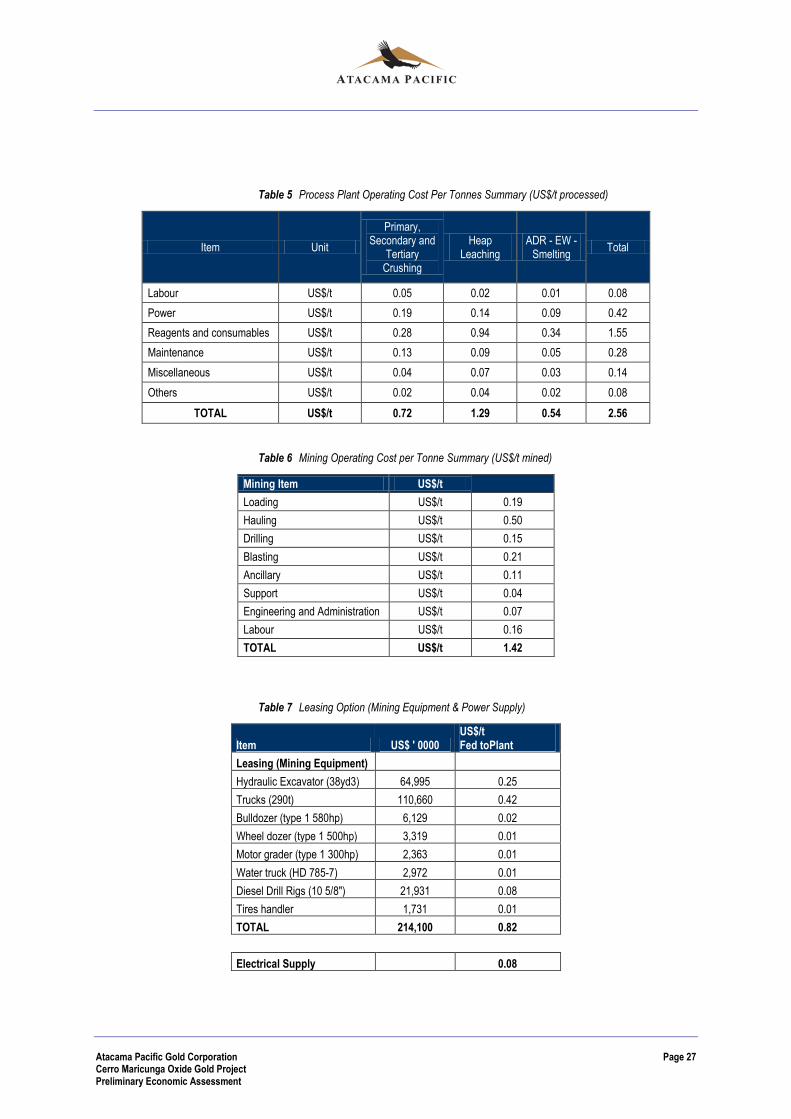
The total process plant operating costs are estimated to be US$2.56 per tonne processed and
summarized in Table 5. The average mining operating costs are estimated to be US$1.43 per tonne
mined and summarized in Table 6. General and Administrative costs are estimated to be US$0.53 per
tonne processed. The project assumes and takes into account that main mining equipment fleet will be
acquired through a manufacture lease arrangement payable over periods of 10 and five years, upon a
quote received from Komatsu. The main electrical delivery infrastructure will be supplied under a lease
arrangement as well. Table 7 summarizes the lease costs.
Table 4 Mine, Process Plant and Infrastructure CAPEX Summary
Category (MUS$)Category (MUS$) Initial
Capital Sustaining
Capital Total
Capital
Direct Costs
Mining Support Equipment & Initial Works 27.6 7.5 35.1
Infrastructure 98.6 98.6
Plant 286.5 286.5
Heap Leaching 224.6 224.6
Closure 5.0 5.0
Subtotal Direct Costs 412.6 237.2 649.8
EPCM 28.9 28.9
Contingency 41.3 11.9 53.1
Subtotal 482.7 249.0 731.8
Pre-stripping 17.1 17.1
Leasing Main Mining Equipment 14.7 14.7
TOTAL 514.6 249.0 763.6
Atacama Pacific Gold Corporation Page 27 Cerro Maricunga Oxide Gold Project Preliminary Economic Assessment
Table 5 Process Plant Operating Cost Per Tonnes Summary (US$/t processed)
Item Unit
Primary, Secondary and
Tertiary Crushing
Heap Leaching
ADR - EW - Smelting
Total
Labour US$/t 0.05 0.02 0.01 0.08
Power US$/t 0.19 0.14 0.09 0.42
Reagents and consumables US$/t 0.28 0.94 0.34 1.55
Maintenance US$/t 0.13 0.09 0.05 0.28
Miscellaneous US$/t 0.04 0.07 0.03 0.14
Others US$/t 0.02 0.04 0.02 0.08
TOTAL US$/t 0.72 1.29 0.54 2.56
Table 6 Mining Operating Cost per Tonne Summary (US$/t mined)
Mining Item US$/t
Loading US$/t 0.19
Hauling US$/t 0.50
Drilling US$/t 0.15
Blasting US$/t 0.21
Ancillary US$/t 0.11
Support US$/t 0.04
Engineering and Administration US$/t 0.07
Labour US$/t 0.16
TOTAL US$/t 1.42
Table 7 Leasing Option (Mining Equipment & Power Supply)
Item US$ ' 0000 US$/t Fed toPlant
Leasing (Mining Equipment)
Hydraulic Excavator (38yd3) 64,995 0.25
Trucks (290t) 110,660 0.42
Bulldozer (type 1 580hp) 6,129 0.02
Wheel dozer (type 1 500hp) 3,319 0.01
Motor grader (type 1 300hp) 2,363 0.01
Water truck (HD 785-7) 2,972 0.01
Diesel Drill Rigs (10 5/8") 21,931 0.08
Tires handler 1,731 0.01
TOTAL 214,100 0.82
Electrical Supply 0.08
Atacama Pacific Gold Corporation Page 28 Cerro Maricunga Oxide Gold Project Preliminary Economic Assessment
1.14 Economic Analysis
This technical report includes mineral resources that are not mineral reserves and therefore do not
have demonstrated economic viability.
The reader is cautioned that the preliminary economic assessment is preliminary in nature and
includes Inferred Mineral Resources that are considered too speculative geologically to have the
economic considerations applied to them that would enable them to be categorized as Mineral
Reserves. No Mineral Reserves have been estimated. There is no certainty that the preliminary
economic assessment will be realized. The preliminary economic assessment is preliminary in nature
and is not a preliminary feasibility study or feasibility study. The parameters of the mining study were
used to develop the constrained resource.
There is no certainty that the PEA results will be realized. Since the analysis is based on a cash flow
estimate, it should be expected that actual economic results might vary from these results. The PEA
has been completed to a level of accuracy of +35% to -10%. The PEA is not a preliminary feasibility
study or feasibility study. NCL is not a financial adviser, and these models are indicative only, based
on NCL’s experiences. NCL recommends that the Company and other readers of this report seek their
own financial and tax advice before taking action in relation to the financial matters herein.
The total estimated initial capital cost of the Project is US$514.6 million, which comprises
i) US$412.7 millio for all process plant and infrastructure ii) an additional $US70.1 million for EPCM
and contingencies; and iii) US$31.8 million for initial pre-stripping and leasing for main mining
equipment during the pre-production period. Adding sustaining capital (US$232.1 million) and closure
(US$5.0 million), along with sustaining contingency costs of US$11.9 million, the total capital cost over
the life of the Project is estimated to be US$ 763.6 million.
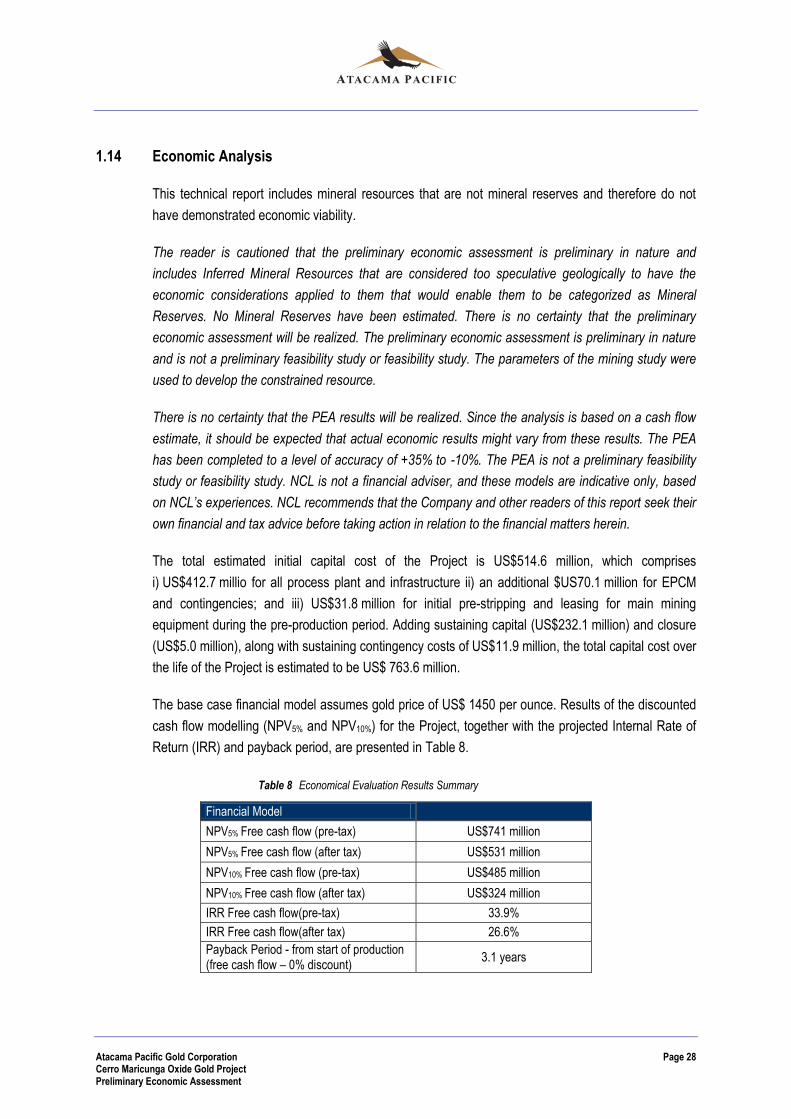
The base case financial model assumes gold price of US$ 1450 per ounce. Results of the discounted
cash flow modelling (NPV5% and NPV10%) for the Project, together with the projected Internal Rate of
Return (IRR) and payback period, are presented in Table 8.
Table 8 Economical Evaluation Results Summary
Financial Model
NPV5% Free cash flow (pre-tax) US$741 million
NPV5% Free cash flow (after tax) US$531 million
NPV10% Free cash flow (pre-tax) US$485 million
NPV10% Free cash flow (after tax) US$324 million
IRR Free cash flow(pre-tax) 33.9%
IRR Free cash flow(after tax) 26.6%
Payback Period - from start of production (free cash flow – 0% discount)
3.1 years

Atacama Pacific Gold Corporation Page 29 Cerro Maricunga Oxide Gold Project Preliminary Economic Assessment
Sensitivity analysis was undertaken to measure the effect of variations in gold price, discount rate,
total operating cost and total capital cost, for after-tax and pre-tax cases. The obtained results are very
solid, with positive NPVs and attractive IRR for almost all the combinations, as included in Section 22.
1.15 Conclusions
1.15.1 Mineral Resource
Exploration results obtained at the Maricunga Project suggest that there may be potential to develop a
low grade heap leachable gold deposit which may be mined by open pit methods.
The work that was performed by Atacama during the exploration seasons for the period October, 2009
through June, 2012 has resulted in the estimation of Measured, Indicated and Inferred category
mineral resources.
Main conclusions that stem out from exploration and resource estimation are as follow:
The resource estimate supporting the conclusions of the Preliminary Economic Assessment
has been prepared in a professional manner and using standard industry practices.
Exploration work, database integrity, QA-QC, including twin-hole analysis, were carried out in a
professional manner.
Current total pit constrained resources in the Measured and Indicated categories, amount to
185.7 million tonnes grading 0.41 g/t Au, equivalent to 2.46 million ounces of gold.
Total pit constrained resources in the Inferred category at Cerro Maricunga, amount to 75.4
milllion tonnes grading 0.39 g/t Au, equivalent to 0.94 million ounces.
Further exploration and infill drilling is warranted.
1.15.2 Mining Studies
The preliminary Cerro Maricunga mining studies are based on Magri’s November, 2012 mineral
resource estimate which includes Measured, Indicated and Inferred category mineral resources.
The reader is cautioned that the mining study is a preliminary assessment and it includes inferred
mineral resources that are considered too speculative geologically to have the economic
considerations applied to them that would enable them to be categorized as mineral reserves. There is
no certainty that the preliminary assessment will be realized. No Mineral Reserves have been
estimated.
The mining study utilizes an open pit mining method. The mineral inventory is estimated at 261 million
tonnes at an average grade of 0.40 g Au/t, with operating costs estimated to be US$1.42 per tonne.
Atacama Pacific Gold Corporation Page 30 Cerro Maricunga Oxide Gold Project Preliminary Economic Assessment
1.15.3 Metallurgical Processing
It is considered the mineralization will be crushed to 19 mm by way of a 3 stage crushing system and
stacked on a conventional leach pad. Average gold recoveries of of 80.3% are projected through
heap leach cyanidation. The recovery for the EW and smelting is considered to be 99.5% for each
stage. The overall gold recovery is considered to be an average of 79.5%.
Further metallurgical testwork is recommended in order to study a possible increase in the
crushing stage product size. Alquimia has information of projects located in the same area as
Cerro Maricunga, whose mineralized material is quite porous. A porous material has a direct
effect in improved cyanidation performance and thus coarser material may be used without a
significant lost in the extraction levels. This would lead to some savings in the crushing capital
and operating costs.
It is recommended to perform test with Cerro Maricunga material in order to confirm the
stability and the hydrodynamic modeling of the heap, with the objective of optimizing the
current design conditions.
1.15.4 Preliminary Economic Assessment Results
The basic cash flow financial models were created by NCL, based on its experience, utilizing the mine
production schedule, associated gold grades, gold recoveries estimated from the preliminary
metallurgical test program, and capital and operating costs as outlined in this technical study. Base
case gold price assumed in the financial modelling was US$ 1,450/oz gold. Total metal recovered
during the life of the Project are estimated to be 2.7 million of ounces. The results of this Preliminary
Economic Assessment support continued work on the Cerro Maricunga property and, contingent on
those results, more advanced feasibility level studies.
1.16 Recommendations
Recommendations for Cerro Maricunga are discussed in detailed in Section 26, however, the key
recommendations for both exploration activities and development-related studies going forward
include the following:
Continue the current balanced drilling strategy of targeted infill drilling to increase resource
confidence and extensional resource definition drilling to add additional mineral resources;
Continue to update relevant mineral resource estimates for all significant mineralized zones to
reflect ongoing changes to mineral resource confidence and the overall Cerro Maricunga
mineral resource base;
Atacama Pacific Gold Corporation Page 31 Cerro Maricunga Oxide Gold Project Preliminary Economic Assessment
Continue mine engineering and planning studies to define and confirm the economic viability of
the Project, and move towards development stage;
Continue mining studies to refine the current mining model, optimize open pit material handling
options;
Carry on geotechnical test work and studies including drilling geotechnical holes for open pits;
Carry out extended water pumping tests at current bore-sites to determine sustainably flow
rates, in addition to continuing prospecting for water and testing of exploration hole if they
intersect substantive water flows;
Refine maximum demand studies for power and progress engineering designs for construction
of powerline; and,
Continue with further metallurgical test work.
Atacama Pacific Gold Corporation Page 32 Cerro Maricunga Oxide Gold Project Preliminary Economic Assessment
2. INTRODUCTION AND TERMS OF REFERENCE
2.1 Introduction
Atacama Pacific commissioned NCL to prepare a Preliminary Economic Assessment (“PEA”) for Cerro
Maricungao. This PEA is based on an updated NI 43-101 compliant mineral resource estimate that
was completed in November, 2012, by Magri.
The study was completed by NCL through the compilation of information generated by consultants
and specialists appointed by Atacama Pacific. NCL was responsible for the compilation of information
from these experts and specialists and the assembly of the overall study.
This report and the resource estimate have been prepared in compliance with the disclosure and
reporting requirements set forth in NI 43-101, Companion Policy 43-101CP, and Form 43-101F1.
2.2 Qualified Persons
The following qualified persons have compiled this technical report:
Carlos Guzman, Principal / Project Director of NCL, was responsible for the mining sections of
the study, together with the financial modelling and compilation of the overall report;
Eduardo Magri, Principal Magri Consultores was responsible for the mineral resource
estimation as well as the resource categorization.
John Wells, Metallurgical Consultant, was resposible of the metallurgical and processing
sections of the Technical Report.
Kristof Fabian, Vice-President and Principal Geotechnical Engineer at ARCADIS, US was
responsible of environmental sections in the report.
Table 9 details the responsibility of the technical report sections to each of the persons involved.
Table 9 Technical Report Responsibility Matrix
Responsible Person Company
Carlos Guzmán NCL Mining study and economical analysis
Eduardo Magri Magri Consultores Limitada Mineral Resource Estimate
John Wells Alquimia Metallurgy
Kristof Fabian Arcadis Environment

Atacama Pacific Gold Corporation Page 33 Cerro Maricunga Oxide Gold Project Preliminary Economic Assessment
2.3 Frequently Used Acronyms, Abbreviations, Definitions, and Units of Measure
Unless otherwise indicated, all references to currency in this report refer to United States dollars
(US$). Frequently used acronyms and abbreviations are listed in Table 10.
Table 10 Frequently used acronyms and abbreviations
Abbreviation Meaning
AAS atomic absorption spectrometry
Ag Silver
As Arsenic
Au Gold
Cu Copper
g/t grams per metric tonne
ha Hectare
Hg Mercury
ICMC International Cyanide Management Code
km Kilometers
l liters
m meters
masl meters above sea level
mm millimetres
oz, koz, Moz ounces, thousands of ounces, million of ounces
Pb Lead
ppm parts per million
QA/QC quality assurance and quality control
RC reverse-circulation drilling method
RQD rock-quality designation
Sb antimony
ºT degrees relative to true north
t, kt, Mt tonnes, kilotonnes, million tonnes
t/y tonnes per year
tpd tonnes per day
Zn Zinc
µm micrometer
µS/cm micro Siemens per centimeter
Atacama Pacific Gold Corporation Page 34 Cerro Maricunga Oxide Gold Project Preliminary Economic Assessment
3. RELIANCE ON OTHER EXPERTS
3.1 Qualified Persons
The following four qualified persons have contributed to this technical report:
Carlos Guzman, Principal / Project Director of NCL, was responsible for the mining sections
of the study, together with the financial modelling and compilation of the overall report;
Eduardo Magri, Principal Magri Consultores was responsible for the mineral resource
estimation as well as the resource categorization.
John Wells, Metallurgical Consultant, was resposible of the metallurgical and processing
sections of the Technical Report.
Kristof Fabian, Vice-President and Principal Geotechnical Engineer at ARCADIS, US was
responsible of environmental sections in the report.
3.2 Other Independent Expert Persons
Other expert persons relied upon for the development of the study:
Natasha Tschischow (Principal NTK) and Antonio Couble (Principal NCL) were in part
responsible of the mineral resource estimation carried out in November, 2012, specifically
in Geology, QA/QC and Modeling.
Walter Cazenave, independent consultant for SBX assisted in the metallurgy and financial
modeling in this report.
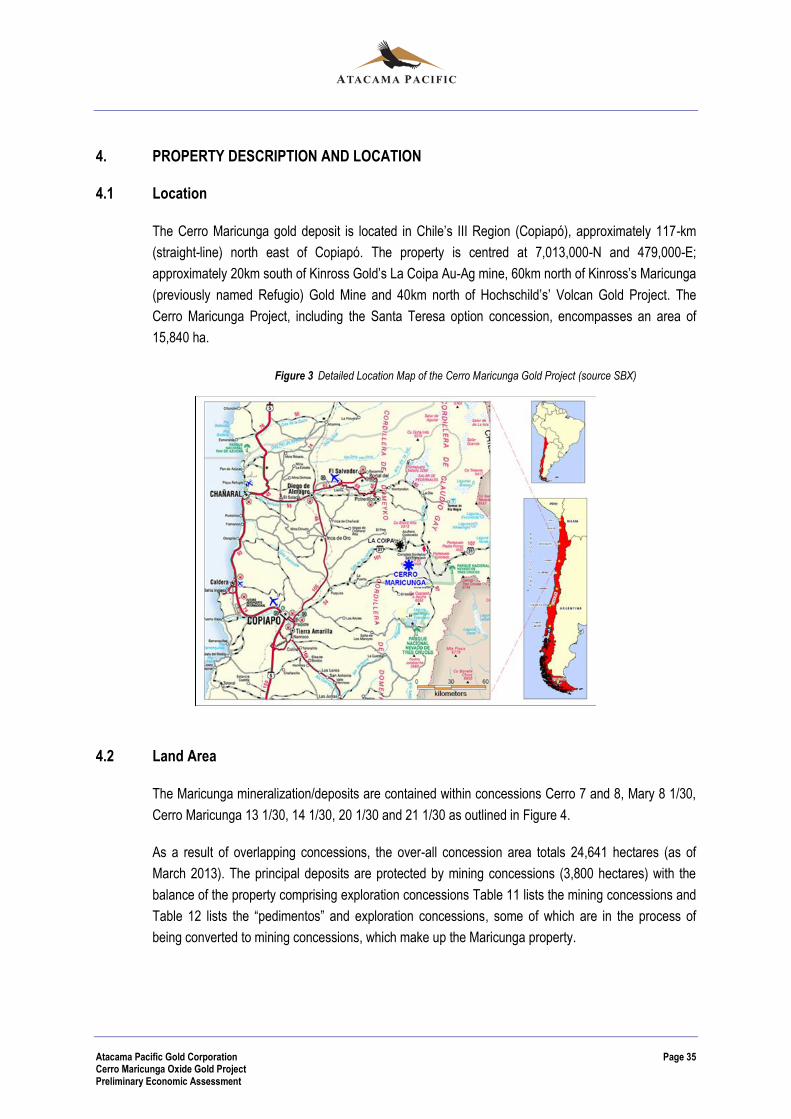
Atacama Pacific Gold Corporation Page 35 Cerro Maricunga Oxide Gold Project Preliminary Economic Assessment
4. PROPERTY DESCRIPTION AND LOCATION
4.1 Location
The Cerro Maricunga gold deposit is located in Chile’s III Region (Copiapó), approximately 117-km
(straight-line) north east of Copiapó. The property is centred at 7,013,000-N and 479,000-E;
approximately 20km south of Kinross Gold’s La Coipa Au-Ag mine, 60km north of Kinross’s Maricunga
(previously named Refugio) Gold Mine and 40km north of Hochschild’s’ Volcan Gold Project. The
Cerro Maricunga Project, including the Santa Teresa option concession, encompasses an area of
15,840 ha.
Figure 3 Detailed Location Map of the Cerro Maricunga Gold Project (source SBX)
4.2 Land Area
The Maricunga mineralization/deposits are contained within concessions Cerro 7 and 8, Mary 8 1/30,
Cerro Maricunga 13 1/30, 14 1/30, 20 1/30 and 21 1/30 as outlined in Figure 4.
As a result of overlapping concessions, the over-all concession area totals 24,641 hectares (as of
March 2013). The principal deposits are protected by mining concessions (3,800 hectares) with the
balance of the property comprising exploration concessions Table 11 lists the mining concessions and
Table 12 lists the “pedimentos” and exploration concessions, some of which are in the process of
being converted to mining concessions, which make up the Maricunga property.
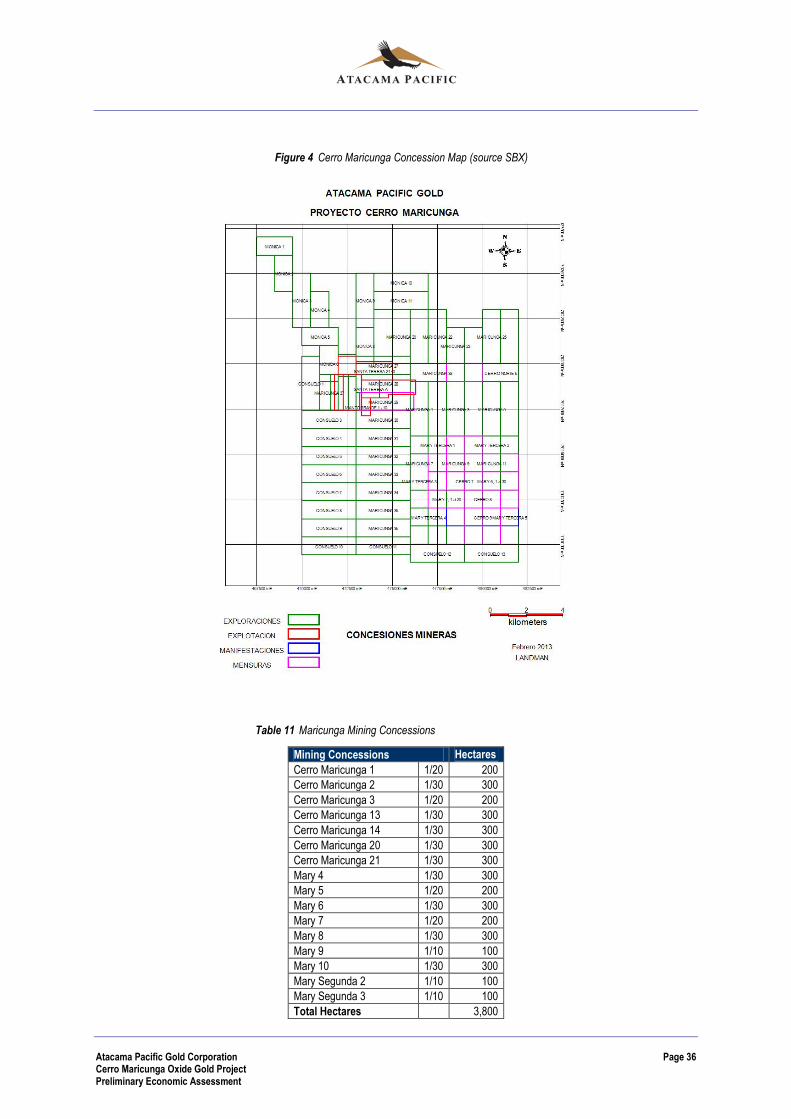
Atacama Pacific Gold Corporation Page 36 Cerro Maricunga Oxide Gold Project Preliminary Economic Assessment
Figure 4 Cerro Maricunga Concession Map (source SBX)
Table 11 Maricunga Mining Concessions
Mining Concessions Hectares Hectares
Cerro Maricunga 1 1/20 200
Cerro Maricunga 2 1/30 300
Cerro Maricunga 3 1/20 200
Cerro Maricunga 13 1/30 300
Cerro Maricunga 14 1/30 300
Cerro Maricunga 20 1/30 300
Cerro Maricunga 21 1/30 300
Mary 4 1/30 300
Mary 5 1/20 200
Mary 6 1/30 300
Mary 7 1/20 200
Mary 8 1/30 300
Mary 9 1/10 100
Mary 10 1/30 300
Mary Segunda 2 1/10 100
Mary Segunda 3 1/10 100
Total Hectares 3,800

Atacama Pacific Gold Corporation Page 37 Cerro Maricunga Oxide Gold Project Preliminary Economic Assessment
Table 12 Cerro Maricunga Exploration Concessions
Concession Hectares Concession Hectares Concession Hectares Cerro Norte 6 200 Maricunga 1 300 Maricunga 29 300
Mary Tercera 1 300 Maricunga 2 300 Maricunga 30 300
Mary Tercera 2 300 Maricunga 3 300 Maricunga 31 300
Mary Tercera 3 300 Maricunga 4 300 Maricunga 33 300
Mary Tercera 4 200 Maricunga 5 300 Maricunga 34 300
Mary Tercera 5 100 Maricunga 6 300 Maricunga 35 300
Cerro 7 200 Maricunga 7 300 Maricunga 36 300
Cerro 8 200 Maricunga 8 300 Maricunga 37 300
Cerro 9 200 Maricunga 9 300 Maricunga 38 300
Manto Grande A 200 Maricunga 10 300 Maricunga 39 300
Santa Teresa A 100 Maricunga 11 300 Maricunga 32 300
Consuelo 1 300 Maricunga 12 300 Santa Teresa 1/20 200
Consuelo 2 200 Maricunga 13 300 Santa Teresa 21/40
191
Consuelo 3 300 Maricunga 14 300 Santa Teresa 41/50
100
Consuelo 4 300 Maricunga 15 300 Montogrande 1/10 50
Consuelo 5 300 Maricunga 16 300 Montogrande 1/10 100
Consuelo 6 300 Maricunga 17 300 Montogrande 1/10 100
Consuelo 7 300 Maricunga 18 300 Monica 1 200
Consuelo 8 300 Maricunga 19 300 Monica 2 200
Consuelo 9 300 Maricunga 20 300 Monica 3 300
Consuelo 10 300 Maricunga 21 300 Monica 4 200
Consuelo 11 300 Maricunga 22 300 Monica 5 200
Consuelo 12 300 Maricunga 23 300 Monica 6 200
Consuelo 13 300 Maricunga 24 300 Monica 7 100
Maricunga 25 300 Monica 8 200
Maricunga 26 300 Monica 9 300
Maricunga 27 300 Monica 10 300
Maricunga 28 300 Monica 11 300
TOTAL 21,041
The concessions have various dates at which the holding fees are due. Atacama Pacific confirmed
that the majority of the concessions are in good standing until April, 2013 at which time property
payments of Chilean Peso $32,232,349 are to be made by Atacama Pacific to keep the concessions
in good standing for the period April 2013 through April 2014. Some concessions, such as the Monica
concession group are presently in good standing until June 2013 at which time the appropriate
payments are due to keep the concession in good standing for an additional 12 month period. Per
data provided by Atacama, the total cost paid to maintain the Maricunga concessions, as they are
currently constituted, for the period 2012-2013 was Chilean Peso $37,445,342 (US$76,490.87).
Atacama filed for, and obtained, the appropriate permits which have allowed it to conduct two phases
of exploration at Maricunga to date. Atacama controls the surface rights at Maricunga, and has
prepared access to the Project. Atacama filed an Environmental Impact Declaration with CONEMA
which will allow it to conduct the proposed Phase III exploration (predominantly drilling) at Maricunga.
Arcadis Chile prepared and filed the Environmental Impact Declaration on behalf of Atacama. The
conclusions reached by Arcadis are as summarized following:
Atacama Pacific Gold Corporation Page 38 Cerro Maricunga Oxide Gold Project Preliminary Economic Assessment
The Cerro Maricunga Project is not located near populations protected by special laws. No
indigenous communities were identified within or proximal to the project area and which could
be affected by the project.
The project doesn’t affect any officially protected area. The nearest protected area is the
National Park “NevadoTres Cruces”, located 2.3km in a straight line from the SE side of the
project area.
The project doesn’t affect any protected wetlands or glaciers.
The project area has neither touristic nor scenic value which could be affected. The project
area doesn’t contain Natural Monuments, Natural Sanctuaries or Historical Monuments.
Part of the project is located inside a semi-protected (buffer zone) Priority Site for biodiversity
conservation (“SitioPrioritario Regional NevadoTres Cruces”). Nevertheless, the exploration
activities will be located in areas which do not contain flora, vegetation, fauna, archeology or
biodiversity which would create a priority site.
The author is not aware of any significant factors and risks, including any environmental liabilities, that
may affect access, title, or the right or ability to perform work at Maricunga.
Atacama Pacific Gold Corporation Page 39 Cerro Maricunga Oxide Gold Project Preliminary Economic Assessment
5. ACCESS, CLIMATE, LOCAL RESOURCES, INFRASTRUCTURE AND PHYSIOGRAPHY
5.1 Access
The Cerro Maricunga gold project is accessed from the centre of Copiapó by a combination of paved
highway, two-lane asphalted road to (just before the La Coipa Mine), and then by maintained single
track dirt roads. Access to the property by pickup (standard or 4-wheel drive) takes approximately 2.5
hours (155km) from the centre of Copiapó. Directions to the property are as follows: from Copiapó,
travel southeast approximately 10km out of the centre of town towards the ENAMI Paipote smelter,
and then turning north on the Inca de Oro road for 15-km and then turning off NE along the salt-paved
road to Paso de San Francisco for 104km, and to the turn-off for La Coipa Mine. At approximately
800m south east of the La Coipa Mine turn-off, swing right to the south west and follow the dirt road
which follows the Quebrada (drainage) Pelada gulch for 25km to reach the project site.
5.2 Climate
Precipitation consists largely of snow during winter months of June through mid-September, with
sporadic, but intense, rain storms of short duration occurring during the summer and autumn months
(January to May). Strong winds may develop during these periods due the high altitude. White-outs,
termed “Bolivian Winter”, which can create hazardous conditions, may occur during the summer
months.
The average annual temperature is of the order of 11°Celsius, and ranges between -30°Celsius at
night in winter to 20°Celsius during the day in summer.
Precipitation in the Andes averages 200 to 300 mm/yr at an elevation of 4,000 masl, while evaporation
from surface water and soils varies between 1,500 to 2,000 mm/yr (Bartlett, et. al., 2004) resulting in
the extremely arid conditions observed in the various areas.
Local wildlife is sparse although vicuñas may occasionally be encountered.
The typical exploration field season at these elevations is from approximately October through May, or
a duration of 7 to 8 months. However, should a mine be put into production, the property could be
operated year round.
5.3 Local Resources and Infrastructure
The nearest major city to the Cerro Maricunga deposit is Copiapó, some 155km south west by road.
Copiapó has an approximate population of 150,000 people. Experienced mine and plant personnel
should be easily sourced from Copiapó, or elsewhere in Chile where a generally well trained and
experienced workforce exists. Furthermore, Copiapó is a well-established support and logistics centre
for mining activities in the region.

Atacama Pacific Gold Corporation Page 40 Cerro Maricunga Oxide Gold Project Preliminary Economic Assessment
5.4 Physiography
The project is located approximately 40km west of the Argentine border in the high Andes and at
elevations of between 3,800 and 5,000 masl. The principal topographic features are the result of the
combination of horst and graben block tectonics in the Cordillera Occidental and the Cenozoic to
Recent volcanism that has produced the various strato volcanoes and dome complexes, which host
the alteration/mineralization that has been identified to date.
Atacama Pacific Gold Corporation Page 41 Cerro Maricunga Oxide Gold Project Preliminary Economic Assessment
6. HISTORY
6.1 Cerro Maricunga History
Preliminary exploration conducted in the early 1980’s identified a “possible high level, high sulfidation
system” in the Ojo de Maricunga stratovolcano containing silica (opaline)-clay altered pyritic breccia,
tuff and quartz-feldspar porphyry.
In January and February, 2008 Minera Newcrest Chile Ltda (“MNCL”), the then Chilean subsidiary of
Newcrest Mining Inc., conducted a preliminary evaluation of the property during which time MNCL
took 325 samples which confirmed the presence of elevated gold mineralization along a NW-SE
trending zone. Newcrest elected not to continue exploration at Maricunga as a result of a change in
focus from gold to copper exploration.
In 2008, Gold Fields (GFC) entered into an exploration/joint venture/option agreement with SBX and
during which time they conducted trenching, mapping and channel sampling, and performed an
Induced Potential/Resistivity and Magnetic Survey during the 2008-2009 field season. The work
performed by GFC confirmed that Maricunga was a potential gold target, and that the property
warranted additional exploration including additional mapping, trenching/sampling and drilling.
6.2 Recent Exploration at Cerro Maricunga
During years 2008-2010 the Maricunga deposit and surroundings areas were extensively mapped and
sampled (rock chips and trenches). Local mapping, at a scale of 1:2,500, centered in the deposit, was
carried out by A. Hodgkin. Surroundings, totaling 163-km2, were mapped at scales of 1:10,000 and
1:25,000 by Dr. A. Dietrich. Petrographical studies have been performed by Dr. P. Cornejo on
approximately 50 samples taken from the field and drill core.
Exploration work, other than drilling and trenching were not carried out during 2011-2012 seasons.
Atacama Pacific Gold Corporation Page 42 Cerro Maricunga Oxide Gold Project Preliminary Economic Assessment
7. GEOLOGY
7.1 Regional Geology
The basement rocks in the Maricunga Mineral Belt comprise a series of volcanic-plutonic-sedimentary
arcs of Mesozoic-Cenozoic age which are associated with the subuction of the Pacific Plate below the
South American Plate. A large volcanic caldera complex developed over basement rocks of
Paleozoic-Triassic and Mesozoic-Early Tertiary age and beginning with the development of large
andesitic (dacitic) stratovolcanoes starting in the Oligocene-Miocene (23-14 Ma – based on K/Ar
dates) and which developed principally on the western side of Lake Maricunga (Bartlett, 2004,
Geoexploraciones, 2003).
The Miocene volcanics and contained alteration and mineralization are subdivided into two partly
overlapping sub-belts – the western early Miocene (24-20 Ma) and the eastern middle Miocene (14-13
Ma) sub-belts. High angle reverse faulting occurred between the two epochs in response to regional
compression induced by subduction zone flattening. A northwest alignment is also prominent in the
belt as reflected by the strike of the several components of the alteration and mineralized zones.
Several hydrothermal systems developed during this time, which resulted in the formation of the
currently known deposits: Marte, La Pepa and La Coipa. The hydrothermal activity lasted through to
12 Ma when it is considered that Marte was being formed. Hydrothermal and solfataric activity resulted
in the generation of sulfur deposits above large numbers of argillized and silicified zones. The gold-(+/-
copper) porphyry-type mineralization is considered to be related to earlier (?) deeper seated
(telescoped) K-silicate alteration which is preserved at the Maricunga Mine and the Aldebaran (Cerro
Casale) deposit and which is most typically overprinted and obliterated by sericite-clay-chlorite
assemblages of intermediate argillic type. Vila, et al (1991) indicate that several of the porphyry-type
stockworks are overlain by “pyrite and alunite rich advanced argillic alteration carrying barite, native
sulfur, enargite and at La Pepa by high sulfidation, high grade epithermal vein-type gold
mineralization”. The quartz stockworks and advanced argillic caps are telescoped at Marte, La Pepa,
etc., and are separated by a chloritized zone transected by a swarm of gold-poor polymetallic veins
with quartz-alunite selvedges at Aldebaran.”
Figure 5 depicts the regional geology and relates Cerro Maricunga to various other Gold-Silver
deposits in the Maricunga Belt.
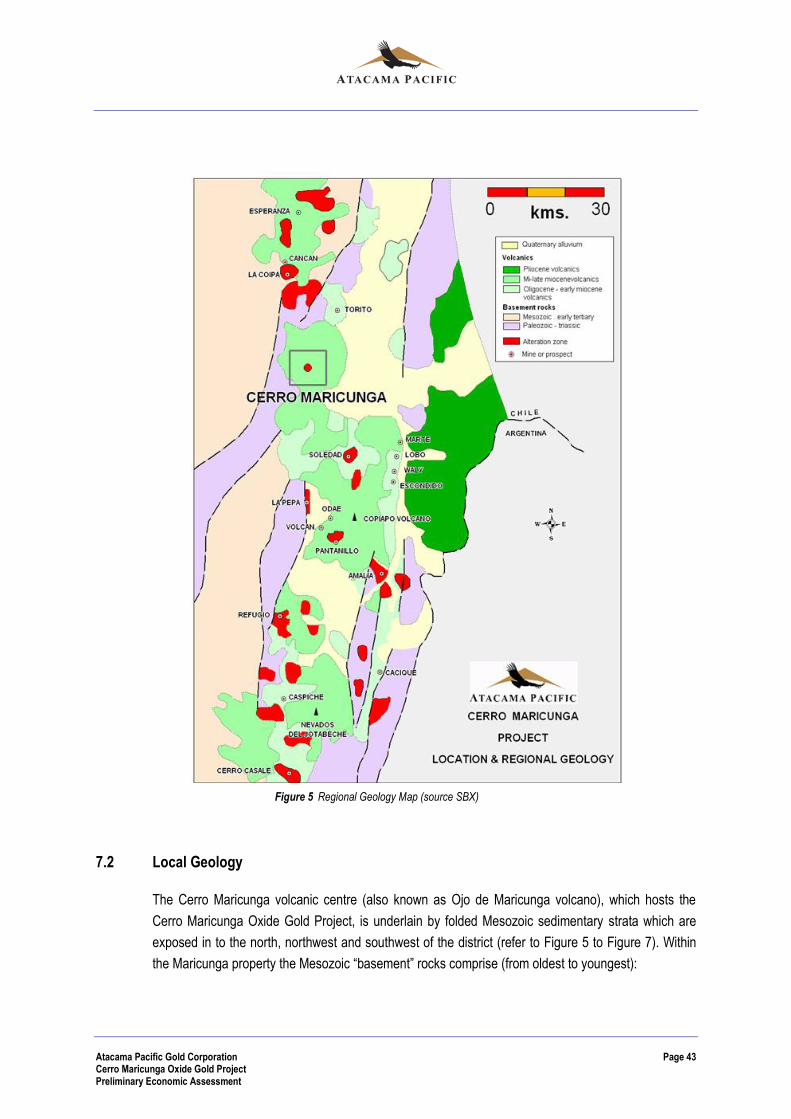
Atacama Pacific Gold Corporation Page 43 Cerro Maricunga Oxide Gold Project Preliminary Economic Assessment
Figure 5 Regional Geology Map (source SBX)
7.2 Local Geology
The Cerro Maricunga volcanic centre (also known as Ojo de Maricunga volcano), which hosts the
Cerro Maricunga Oxide Gold Project, is underlain by folded Mesozoic sedimentary strata which are
exposed in to the north, northwest and southwest of the district (refer to Figure 5 to Figure 7). Within
the Maricunga property the Mesozoic “basement” rocks comprise (from oldest to youngest):

Atacama Pacific Gold Corporation Page 44 Cerro Maricunga Oxide Gold Project Preliminary Economic Assessment
A siliciclastic sequence, mapped as Estratos del Mono Formation, which is equivalent to
the La Ternera Formation (Triassic – Lower Jurassic). At Cerro Maricunga it comprises coarse
arkosic sandstones intercalated with conglomerates, which areoverlain by a facies of coarse
arkosic sandstones intercalated with shaly siltstones.
A Carbonate sequence, which can be correlated with the Jurassic Lautaro Formation
(Iriarte et al) which consists of interbedded fossil-rich limestone intercalated with calcarenite, and
which lies on top of the siliciclastic sequence.
Two andesitic sequences overlie the Carbonate Sequence: an older andesite sequence,
consisting of andesitic tuff which is intercalated with minor andesitic lava flows, overlain by
another unit of prominent andesite lava flows (Carneros Andesite). Dietrich (2011) correlates both
units with the Quebrada Paipote and Las Pircas Formations (Late Cretaceous to Early Tertiary).
Cornejo et al mapped these units as the intermediate level of Estratos de Cerro Los Carneros
Formation, and obtained an age of 67 ± 2 Ma..
The Mesozoic sedimentary strata are folded along a NNE-striking and 25-30°NNE-plunging fold axis.
The Mesozoic units are intruded by plugs, dikes and possibly sills of monzodioritic to gabbroic
composition, and by ocoite dikes. They are described by Dietrich as being halocristalline rocks,
consisting of feldspars, pyroxene, minor hornblende, biotite and quartz. These units are unaltered and
apparently are not related to mineralization. However, an andesitic dike on the SW side of the district
is accompanied by a narrow halo of quartz veinlets which has a weak gold anomaly. A stock of
andesitic porphyry (or diorite) intrudes along the inferred anticline axis into the Mesozoic strata in the
Santa Teresa South area, and displays mineralization within the hornfels and calc-silicate contact-
metamorphic halo.
The Ojo de Maricunga volcanic centre is surrounded by a sub-horizontal blanket of un-altered, non- to
partially welded rhyodacitic ignimbrite, which has been named the “Maricunga Ignimbrite” by Cornejo
and Iriarte. They describe this unit as a pumiceous pyroclastic flow deposit, which is white to pink in
color, and is deposited in 5 m to 15m thick flow units which is covered by gravel deposits (Gravas de
Atacama unit) and pyroclastic deposits from the Ojo de Maricunga volcano and the unconformably
overlying the Mesozoic units.
The Maricunga Ignimbrite is composed of coarse lapilli rhyodacitic tuff, with abundant pumice and a
vitreous pumiceous matrix with accidental and crystal fragments of biotite and hornblende. The
Maricunga Ignimbrite has been dated (Cornejo et al; Iriarte et al) at 13.7 ± 2.6 Ma to 17.9 ± 1.4 Ma.
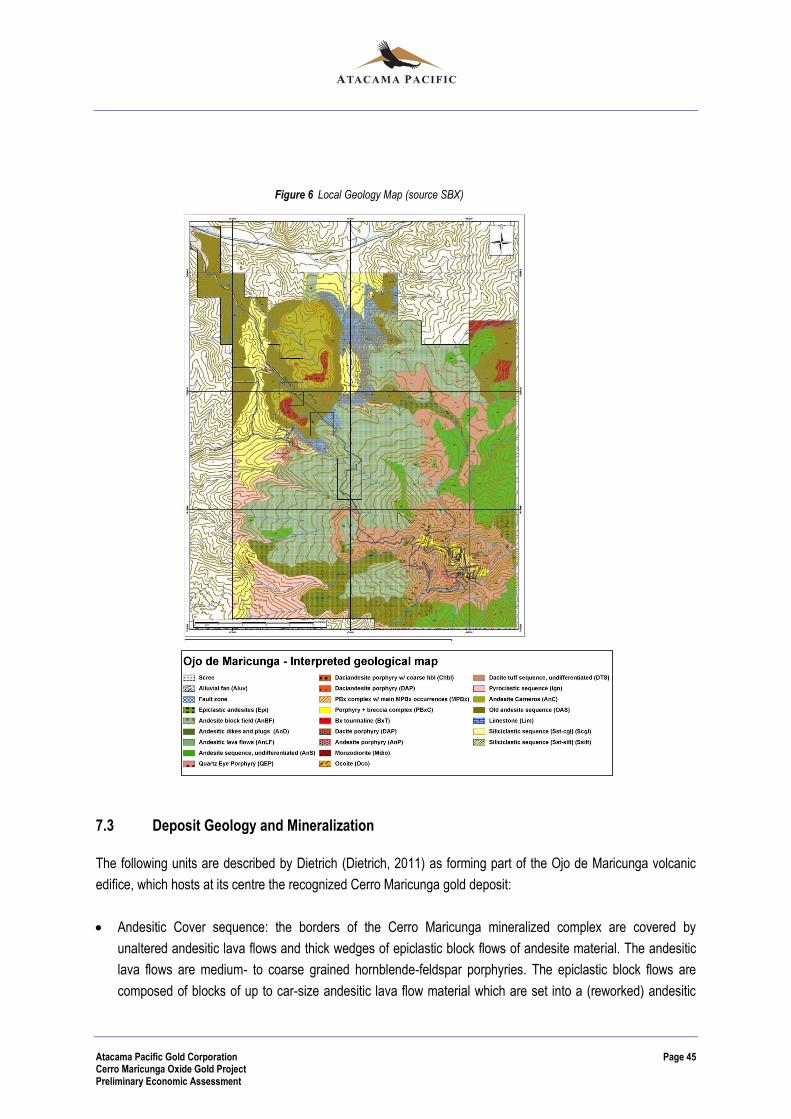
Atacama Pacific Gold Corporation Page 45 Cerro Maricunga Oxide Gold Project Preliminary Economic Assessment
Figure 6 Local Geology Map (source SBX)
7.3 Deposit Geology and Mineralization
The following units are described by Dietrich (Dietrich, 2011) as forming part of the Ojo de Maricunga volcanic
edifice, which hosts at its centre the recognized Cerro Maricunga gold deposit:
Andesitic Cover sequence: the borders of the Cerro Maricunga mineralized complex are covered by
unaltered andesitic lava flows and thick wedges of epiclastic block flows of andesite material. The andesitic
lava flows are medium- to coarse grained hornblende-feldspar porphyries. The epiclastic block flows are
composed of blocks of up to car-size andesitic lava flow material which are set into a (reworked) andesitic
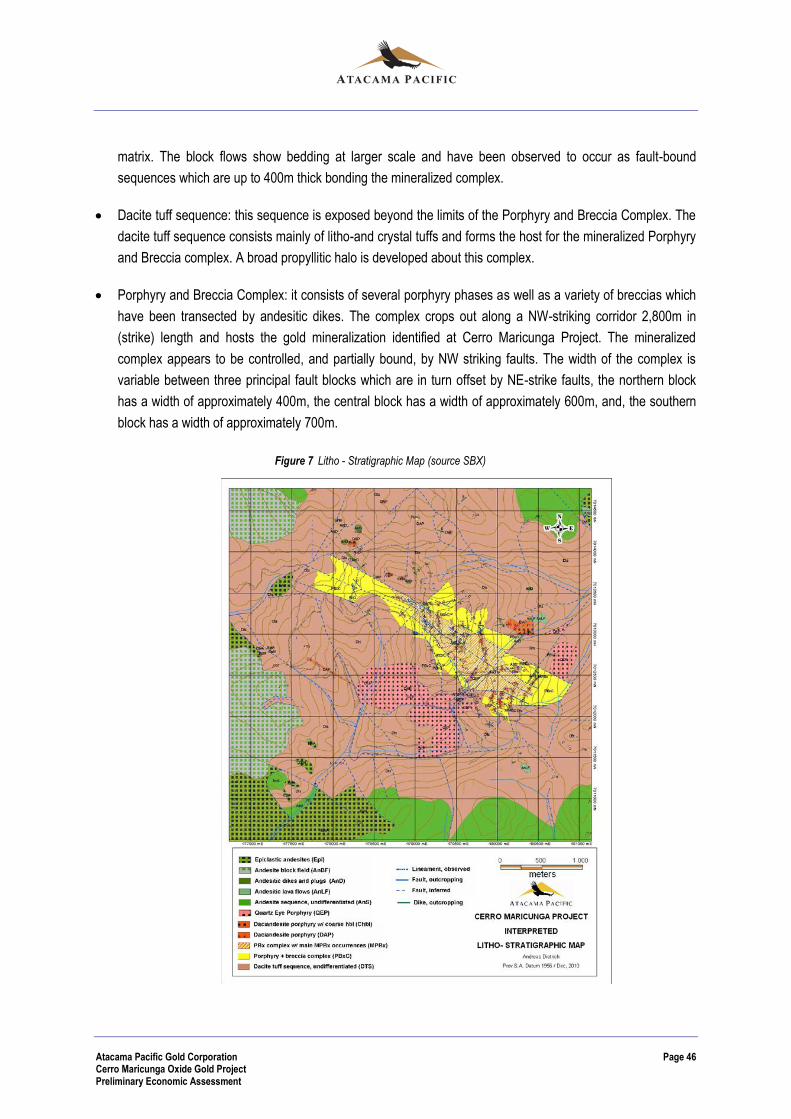
Atacama Pacific Gold Corporation Page 46 Cerro Maricunga Oxide Gold Project Preliminary Economic Assessment
matrix. The block flows show bedding at larger scale and have been observed to occur as fault-bound
sequences which are up to 400m thick bonding the mineralized complex.
Dacite tuff sequence: this sequence is exposed beyond the limits of the Porphyry and Breccia Complex. The
dacite tuff sequence consists mainly of litho-and crystal tuffs and forms the host for the mineralized Porphyry
and Breccia complex. A broad propyllitic halo is developed about this complex.
Porphyry and Breccia Complex: it consists of several porphyry phases as well as a variety of breccias which
have been transected by andesitic dikes. The complex crops out along a NW-striking corridor 2,800m in
(strike) length and hosts the gold mineralization identified at Cerro Maricunga Project. The mineralized
complex appears to be controlled, and partially bound, by NW striking faults. The width of the complex is
variable between three principal fault blocks which are in turn offset by NE-strike faults, the northern block
has a width of approximately 400m, the central block has a width of approximately 600m, and, the southern
block has a width of approximately 700m.
Figure 7 Litho - Stratigraphic Map (source SBX)
Atacama Pacific Gold Corporation Page 47 Cerro Maricunga Oxide Gold Project Preliminary Economic Assessment
8. DEPOSIT TYPES
The authors consider that Cerro Maricunga shares characteristics with similar to other known deposits
which occur within the Maricunga Gold-(Copper) Belt of Chile. The deposit type being explored for is a
porphyry / breccia gold deposit developed in, and associated with, Miocene domal intrusives. These
characteristics can include mineralization/alteration types which appear to be intimately associated
with, or occur below, high level, high sulfidation epithermal mineralizing systems developed in variably
eroded and collapsed Oligocene-Upper Miocene stratovolcanoes and within recurrent intrusive dacitic
domes. Hydrothermal and phreatic breccias are frequently developed flanking and transecting (and
below the steam heated zones) the domal intrusives and most commonly at fault intersections and/or
zones of dilation.

Atacama Pacific Gold Corporation Page 48 Cerro Maricunga Oxide Gold Project Preliminary Economic Assessment
9. EXPLORATION
During years 2008-2010 the Maricunga deposit and surroundings areas were extensively mapped and
sampled (rock chips and trenches). Local mapping, at a scale of 1:2,500, centered in the deposit, was
carried out by A. Hodgkin. Surroundings, totaling 163-km2, were mapped at scales of 1:10,000 and
1:25,000 by Dr. A. Dietrich.
Geophysical surveys, both ground magnetics and induced polarization, were completed by the
Company over the Cerro Maricunga property. The survey results are summarizing in the October 7,
2011 technical report appropriately filed by Atacama Pacific.
During the Phase II program (November 2010 through to April 2011), Atacama Pacific continued with
a program of extensive surface trenching following up on results the period 2008 through 2010. These
results are summarized in the October 7, 2011 technical report.
Drilling represented the main exploration activity during the Phase III (November 2011 – May 2012)
program.
Atacama Pacific is currently undertaking a 20,000m Phase IV drilling program which commenced in
November 2012.
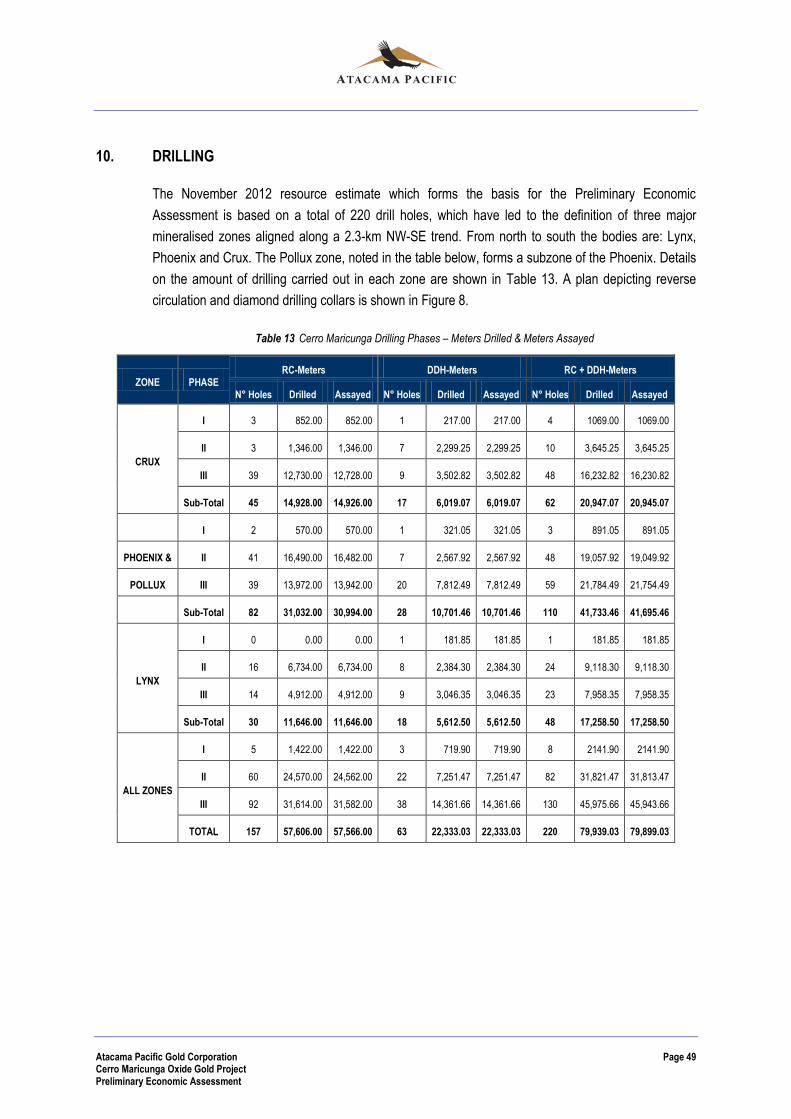
Atacama Pacific Gold Corporation Page 49 Cerro Maricunga Oxide Gold Project Preliminary Economic Assessment
10. DRILLING
The November 2012 resource estimate which forms the basis for the Preliminary Economic
Assessment is based on a total of 220 drill holes, which have led to the definition of three major
mineralised zones aligned along a 2.3-km NW-SE trend. From north to south the bodies are: Lynx,
Phoenix and Crux. The Pollux zone, noted in the table below, forms a subzone of the Phoenix. Details
on the amount of drilling carried out in each zone are shown in Table 13. A plan depicting reverse
circulation and diamond drilling collars is shown in Figure 8.
Table 13 Cerro Maricunga Drilling Phases – Meters Drilled & Meters Assayed
ZONE PHASE RC-Meters DDH-Meters RC + DDH-Meters
N° Holes Drilled Assayed N° Holes Drilled Assayed N° Holes Drilled Assayed
CRUX
I 3 852.00 852.00 1 217.00 217.00 4 1069.00 1069.00
II 3 1,346.00 1,346.00 7 2,299.25 2,299.25 10 3,645.25 3,645.25
III 39 12,730.00 12,728.00 9 3,502.82 3,502.82 48 16,232.82 16,230.82
Sub-Total 45 14,928.00 14,926.00 17 6,019.07 6,019.07 62 20,947.07 20,945.07
I 2 570.00 570.00 1 321.05 321.05 3 891.05 891.05
PHOENIX & II 41 16,490.00 16,482.00 7 2,567.92 2,567.92 48 19,057.92 19,049.92
POLLUX III 39 13,972.00 13,942.00 20 7,812.49 7,812.49 59 21,784.49 21,754.49
Sub-Total 82 31,032.00 30,994.00 28 10,701.46 10,701.46 110 41,733.46 41,695.46
LYNX
I 0 0.00 0.00 1 181.85 181.85 1 181.85 181.85
II 16 6,734.00 6,734.00 8 2,384.30 2,384.30 24 9,118.30 9,118.30
III 14 4,912.00 4,912.00 9 3,046.35 3,046.35 23 7,958.35 7,958.35
Sub-Total 30 11,646.00 11,646.00 18 5,612.50 5,612.50 48 17,258.50 17,258.50
ALL ZONES
I 5 1,422.00 1,422.00 3 719.90 719.90 8 2141.90 2141.90
II 60 24,570.00 24,562.00 22 7,251.47 7,251.47 82 31,821.47 31,813.47
III 92 31,614.00 31,582.00 38 14,361.66 14,361.66 130 45,975.66 45,943.66
TOTAL 157 57,606.00 57,566.00 63 22,333.03 22,333.03 220 79,939.03 79,899.03
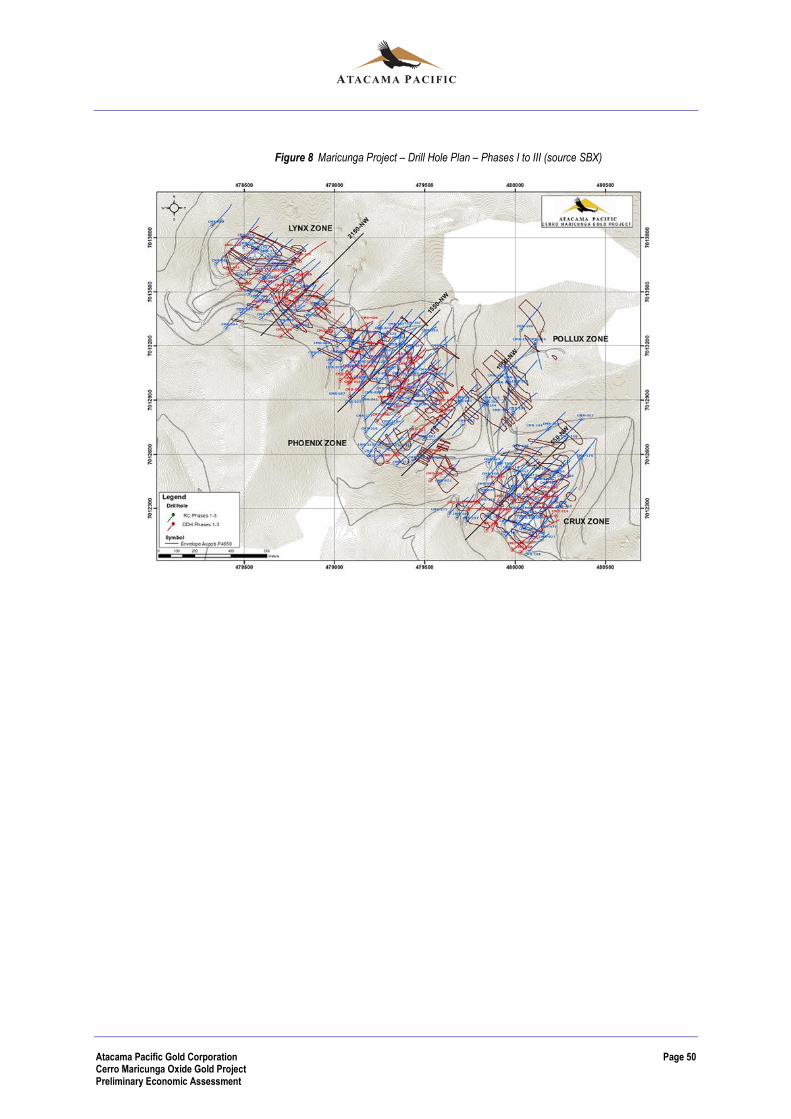
Atacama Pacific Gold Corporation Page 50 Cerro Maricunga Oxide Gold Project Preliminary Economic Assessment
Figure 8 Maricunga Project – Drill Hole Plan – Phases I to III (source SBX)
Atacama Pacific Gold Corporation Page 51 Cerro Maricunga Oxide Gold Project Preliminary Economic Assessment
11. SAMPLE PREPARATION, ANALYSES AND SECURITY
11.1 Sample Preparation
This section describes the handling of samples used in the resource estimation; drill-hole data-assays,
as well as procedures applied for quality control in sample preparation and analytical procedures. The
sample preparation for non-drill (core or RC) samples, such as trench, geochemical and hand samples
are not discussed in this section as the results have these samples have not been used in the
estimation of the resource..
The following paragraphs summarize the manner in which Atacama Pacific manages and prepares
reverse circulation and diamond drill hole samples:
Atacama uses a carefully designed and controlled QA/QC (Quality assessment/quality
control) program.
Drill core and cuttings are handled by Atacama personnel and/or SBX sub-contracted
personnel from the moment that the core/cuttings exit the drill. Core and cuttings are
transported weekly to the Atacama Paipote core logging and core/cuttings storage facility.
Reverse Circulation Holes - The RC cuttings are split in a standard cuttings splitter with ¼ of
the sample (17-18 kg) being put into a pre-labeled plastic bag under the supervision and
control of Atacama personnel at the drill site. At the RC drill rig, a geological technician
collects a representative sample (dust and cuttings) at 2-meters intervals in properly marked
and identified plastic “chip” trays, which are used for logging purposes. Field duplicate
samples are inserted at a rate of approximately 1 per 20 samples. Once the holes are
completed, samples are transported to the core shed located in Paipote.
At Paipote, 7kg bagged blank reference material are inserted after each duplicate and then
sent to the sample preparation facility run by Geoanalitica, located approximately 1-km from
ATM’s core shed. The sample preparation stream, as well as the QA/QC protocol is shown in
Figure 9.
Diamond Drill Holes - Diamond drill core is boxed in aluminum trays at the drill site, where it
is properly taken from the core barrel. The recovery, RQD, and fracture frequency are
measured by a geological technician. The core boxes are properly sealed such that there will
be no movement or separation of the core, and are then transported to the camp.
The core is pre-logged and marked for splitting at the camp by a senior geologist. Thereafter,
the geologist carefully selects “mineralized” 2-m samples for duplicates. Diamond saw
splitting is carried out in the ATM core shed located in Paipote.
One half of the core is returned to the core box for final logging and storage; the other half is
properly bagged and labeled, blanks are inserted, and delivered to Geoanalítica for
preparation together with the list of samples selected as duplicates. The sample preparation
stream for DDH is shown in Figure 10.

Atacama Pacific Gold Corporation Page 52 Cerro Maricunga Oxide Gold Project Preliminary Economic Assessment
Figure 9 Sample Preparation Protocol – RC and QA/QC

Atacama Pacific Gold Corporation Page 53 Cerro Maricunga Oxide Gold Project Preliminary Economic Assessment
Figure 10 Sample Preparation Protocol – DDH and QA/QC

Atacama Pacific Gold Corporation Page 54 Cerro Maricunga Oxide Gold Project Preliminary Economic Assessment
11.2 Analysis and Security
Quality control protocols include the following:
Insertion of standards acquired at Geostats Pty.
Insertion of commercial blanks acquired at Geostats Pty (analytical control).
Insertion of in-house blank material (sample preparation control).
Insertion of field duplicates for reverse circulation holes.
Insertion of coarse rejects (-10#) for diamond drill holes.
Insertion of -150# pulp duplicates.
Analytical test work during the 2011-2012 campaign was carried out in Activation Laboratories located
in Coquimbo. Gold assays were performed utilizing 50-gr fire assay with an Atomic Absorption
Spectroscopy (AAS) finish and copper via acid digestion with an AAS finish.
Samples for specific gravity determinations are 10-cm core specimens taken every 50-m from
diamond drill holes.

Atacama Pacific Gold Corporation Page 55 Cerro Maricunga Oxide Gold Project Preliminary Economic Assessment
12. DATA VERIFICATION
During drilling of 2010 through 2012 drilling campaigns, sample quality assurance and quality control
measures included the insertion of duplicates, standards and blanks. This section of the report
presents statistical analyses of data collected during Phase III (2011-2012) campaign. Analyses were
performed for the following: 655 field/coarse rejects, and 655 pulp duplicates (-150#) for chemical
laboratory analysis. Additionally, grade QAQC analyses were performed for 894 Geostats standards,
and 388 in-house and 265 Geostats blank samples. Further details are shown in Table 14.
Table 14 Cerro Maricunga Database Quality Assessment and Quality Control
PHASE I II III Total
Years 2010 2010-2011 2011-2012 2010-2012
N° Drillholes 8 82 130 220
Meters Assayed 2,141.90 31,444.57 45,945.66 79,532.13
N° Samples Assayed 1,072 15,722 22,974 39,768
QA - QC Assays
N° Standards 48 534 894 1,476
N° Blanks In-House 18 187 388 593
N° Blanks-Geostats 0 0 265 265
N° Field/Coarse Rejects 39 534 655 1,228
N° Pulp Duplicates 39 534 655 1,228
Total QA - QC Assays 144 1,789 2,857 4,790
% QA - QC Assays 13.4 11.4 12.4 12.0
Results indicate that sample preparation and analyses were acceptably precise and exact during the
2010-2012 drilling campaigns.
12.1 Data Management
The following action was taken in preparing the data for statistical analyses:
Values for Au reported as “<0.005” were replaced by “0.0025” (this corresponds to values below the 5
ppb detection limit for gold).
12.2 Analysis of Duplicate Samples
Table 15 summarizes the QA/QC results for all RC field duplicates, DDH coarse duplicates (10#) and
pulp duplicates.

Atacama Pacific Gold Corporation Page 56 Cerro Maricunga Oxide Gold Project Preliminary Economic Assessment
Table 15 Summary of QA-QC results for duplicate samples – Au
Results
RC – Au (ppm) DDH – Au (ppm) Pulp – Au (ppm)
Original Duplicate Original Duplicate Original Duplicate
Number of samples 417 417 238 238 655 655
Minimum 0.003 0.003 0.009 0.009 0.003 0.003
Maximum 2.615 2.607 4.502 3.142 3.142 3.137
Mean 0.224 0.224 0.360 0.352 0.270 0.271
Std. Deviation 0.292 0.286 0.503 0.455 0.362 0.367
Test T (of the means) 0.19 1.10 -0.47
Mean Relative Error (%) 13.31 7.83 10.61
Correlation (r) 0.994 0.979 0.994
Intercept 0.005 0.033 -0.002
Slope 0.975 0.887 1.009
In all cases the original and duplicate data showed good agreement:
Results for the T Tests (all values are within [-1.96, 1.96]) show that the original and duplicate
means are not significantly different, based on 95% confidence intervals.
Mean relative errors are close to 13% for the RC field duplicates and around 8% for DDH
coarse duplicates. However, the mean relative error for pulp duplicates is 10.61%, which is
considerably higher than that for DDH coarse duplicates. The reason for this increase is due
to the fact that there are many low grade values in the pulp duplicates, which inflate the
relative errors.
In all three cases, correlation values are high (very close to 1), intercepts are low and slopes
are close to 1, indicating a high degree of correspondence between the original and duplicate
samples.
The effect of low grade samples on the mean relative error for pulp (and other) duplicates was verified
by repeating the statistical analyses presented in Table 15 after pairs with an average Au value lower
than 0.1 ppm had been eliminated. Results of this reanalysis are presented in Table 16. A threshold of
0.1 ppm was selected because samples with grades lower than this are not likely to be of interest for
modeling the resources for open pit planning, and they contribute large amounts of relative error as
many of them are close to the gold detection limit.
As can be seen, 178 RC duplicates, 78 DDH duplicates and 256 pulp duplicates were eliminated,
indicating that a considerable amount of the data was below 0.1 ppm Au.
Eliminating low grade duplicates had the following effects:

Atacama Pacific Gold Corporation Page 57 Cerro Maricunga Oxide Gold Project Preliminary Economic Assessment
The mean Au grades increased from 0.224 to 0.355 ppm for RC, from 0.352 to 0.497ppm for
DDH and from 0.271 to 0.413 ppm for pulps.
The mean relative errors decreased. This was especially notorious for pulp duplicates, where
the mean relative error decreased from 10.61 to 6.21%.
The elimination of low grade samples also affected the percentage of data meeting the
absolute relative difference criteria, as summarized in Table 17.
Table 16 Summary of QAQC results for duplicate samples ≥0.1 ppm-Au
Results
RC – Au (ppm) DDH – Au (ppm) Pulp – Au (ppm)
Original Duplicate Original Duplicate Original Duplicate
Number of samples 239 239 160 160 399 399
Minimum 0.093 0.094 0.099 0.101 0.098 0.055
Maximum 2.615 2.607 4.502 3.142 3.142 3.137
Mean 0.355 0.355 0.508 0.497 0.412 0.413
Std. Deviation 0.328 0.319 0.556 0.495 0.404 0.412
Test T (of the means) -0.05 1.11 -0.33
Mean Relative Error (%) 7.78 6.44 6.21
Correlation (r) 0.992 0.974 0.993
Intercept 0.013 0.056 -0.004
Slope 0.964 0.867 1.011
Table 17 QA-QC criteria and results for Au duplicates.
Duplicate type Criteria Result for all Au data Result for Au >0.1 ppm
Reverse circulation drilling 90% data have | rel diff| < 20% 91.3 % data 96.5 % data
Diamond drilling 90% data have | rel diff| < 15% 93.5 % data 96.8 % data
Chemical laboratory pulp 90% data have | rel diff| < 10% 87.3 % data 95.4 % data
Acceptability criteria were not met for pulp duplicates when all the data were analyzed, most likely due
to a large dispersion of relative difference values for low grade samples. When low grade samples
(<0.1 ppm Au) were excluded, all three types of samples met the acceptability criteria.
In general, statistical analyses of all Au duplicate data examined (reverse circulation field duplicates,
diamond drillhole 10# duplicates and duplicate assays), especially those above 0.1 ppm Au show
good precision, indicating that the protocols used for sample preparation and assaying were adequate.
12.3 Analysis of Standard Samples and Blank acquired at Geostats Pty
Characteristics of the standard samples used for quality control are shown in Table 18.
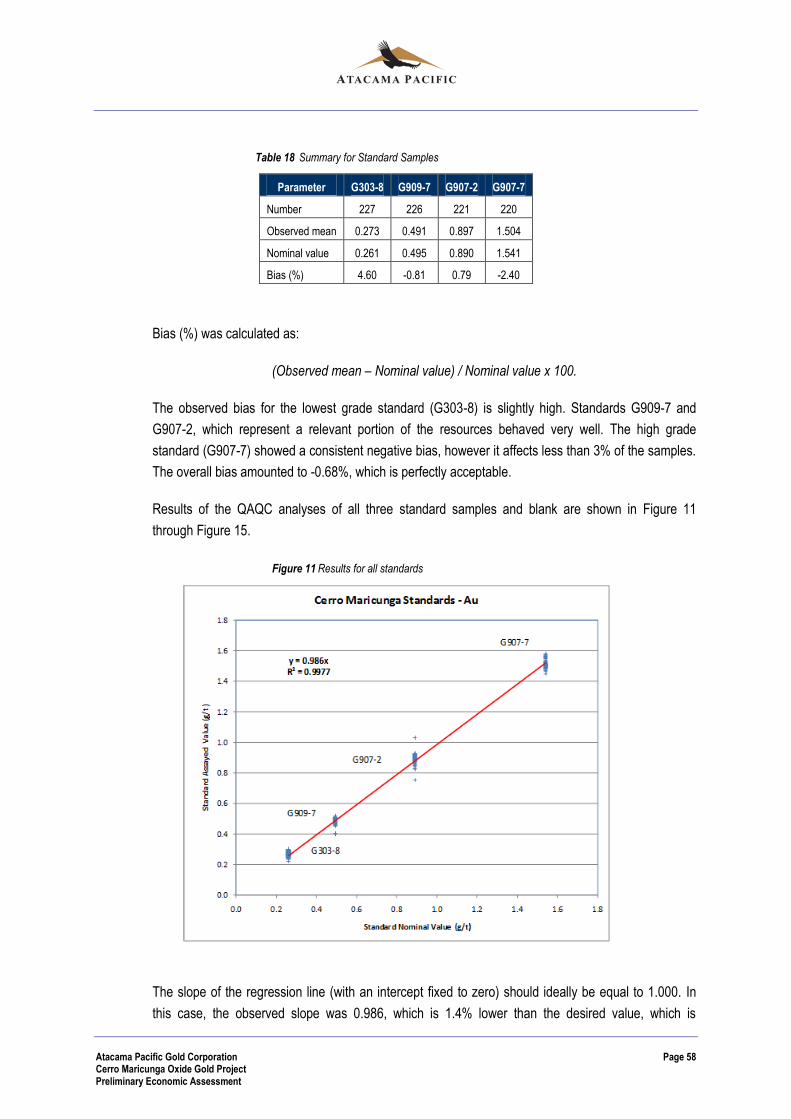
Atacama Pacific Gold Corporation Page 58 Cerro Maricunga Oxide Gold Project Preliminary Economic Assessment
Table 18 Summary for Standard Samples
Parameter G303-8 G909-7 G907-2 G907-7
Number 227 226 221 220
Observed mean 0.273 0.491 0.897 1.504
Nominal value 0.261 0.495 0.890 1.541
Bias (%) 4.60 -0.81 0.79 -2.40
Bias (%) was calculated as:
(Observed mean – Nominal value) / Nominal value x 100.
The observed bias for the lowest grade standard (G303-8) is slightly high. Standards G909-7 and
G907-2, which represent a relevant portion of the resources behaved very well. The high grade
standard (G907-7) showed a consistent negative bias, however it affects less than 3% of the samples.
The overall bias amounted to -0.68%, which is perfectly acceptable.
Results of the QAQC analyses of all three standard samples and blank are shown in Figure 11
through Figure 15.
Figure 11 Results for all standards
The slope of the regression line (with an intercept fixed to zero) should ideally be equal to 1.000. In
this case, the observed slope was 0.986, which is 1.4% lower than the desired value, which is

Atacama Pacific Gold Corporation Page 59 Cerro Maricunga Oxide Gold Project Preliminary Economic Assessment
acceptable. The correlation coefficient is very high (0.999), indicating that the deviations from the
regression line are low. Additionally, dispersions of the assay values for all three standards are low,
indicating good assay accuracy.
Figure 12 Control chart for standard G303-8
Figure 13 Control chart for standard G909-7
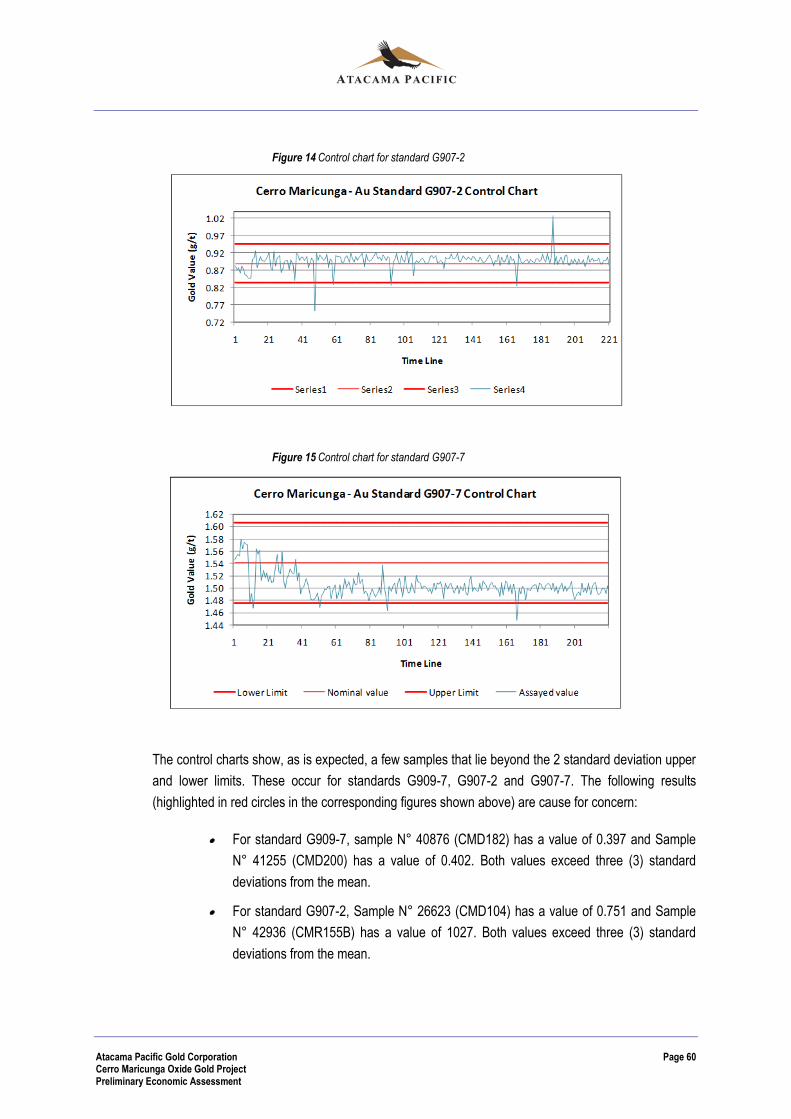
Atacama Pacific Gold Corporation Page 60 Cerro Maricunga Oxide Gold Project Preliminary Economic Assessment
Figure 14 Control chart for standard G907-2
Figure 15 Control chart for standard G907-7
The control charts show, as is expected, a few samples that lie beyond the 2 standard deviation upper
and lower limits. These occur for standards G909-7, G907-2 and G907-7. The following results
(highlighted in red circles in the corresponding figures shown above) are cause for concern:
For standard G909-7, sample N° 40876 (CMD182) has a value of 0.397 and Sample
N° 41255 (CMD200) has a value of 0.402. Both values exceed three (3) standard
deviations from the mean.
For standard G907-2, Sample N° 26623 (CMD104) has a value of 0.751 and Sample
N° 42936 (CMR155B) has a value of 1027. Both values exceed three (3) standard
deviations from the mean.
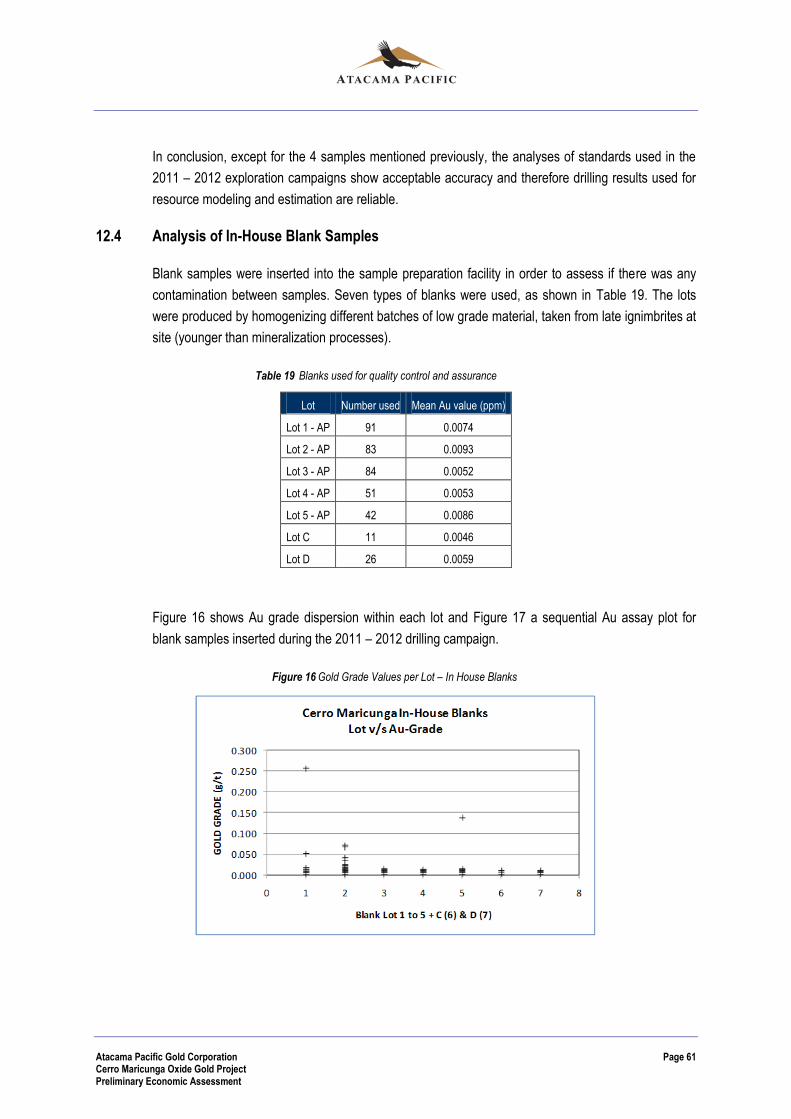
Atacama Pacific Gold Corporation Page 61 Cerro Maricunga Oxide Gold Project Preliminary Economic Assessment
In conclusion, except for the 4 samples mentioned previously, the analyses of standards used in the
2011 – 2012 exploration campaigns show acceptable accuracy and therefore drilling results used for
resource modeling and estimation are reliable.
12.4 Analysis of In-House Blank Samples
Blank samples were inserted into the sample preparation facility in order to assess if there was any
contamination between samples. Seven types of blanks were used, as shown in Table 19. The lots
were produced by homogenizing different batches of low grade material, taken from late ignimbrites at
site (younger than mineralization processes).
Table 19 Blanks used for quality control and assurance
Lot Number used Mean Au value (ppm)
Lot 1 - AP 91 0.0074
Lot 2 - AP 83 0.0093
Lot 3 - AP 84 0.0052
Lot 4 - AP 51 0.0053
Lot 5 - AP 42 0.0086
Lot C 11 0.0046
Lot D 26 0.0059
Figure 16 shows Au grade dispersion within each lot and Figure 17 a sequential Au assay plot for
blank samples inserted during the 2011 – 2012 drilling campaign.
Figure 16 Gold Grade Values per Lot – In House Blanks

Atacama Pacific Gold Corporation Page 62 Cerro Maricunga Oxide Gold Project Preliminary Economic Assessment
Figure 17 Time Sequenced Au Values – In House Blanks
Five anomalous values were encountered (marked with red dots in Figure 17):
N° LOT Au Assay Preceding Au Assay Hole-ID Sample
1 1 0.256 0.054 CMR113 23345
2 1 0.051 0.138 CMD096 22925
3 2 0.067 0.718 CMD111 26198
4 2 0.071 0.534 CMD104 25506
5 5 0.138 0.392 CMD145 36741
Value N°1 probably corresponds to Standard G303-8, which was misplaced. The remaining
anomalous values may be due to slight contamination of four (4) out of some 23,000 samples assayed
during Phase III.
12.5 Analysis of Commercial Blank Samples
A set of 265 500-g sachets of blank certified material, acquired at Geostats Pty, were inserted to
control possible contamination in the analytical laboratory.
Figure 18 shows assayed gold values. The first plot (top) includes an anomalous results that
corresponds to a sample of standard G-308-3 (0.250 g/t) which was mislabeled; the second (bottom)
graph corresponds to gold values obtained for the remaining 264 samples. Results are reasonably
good.

Atacama Pacific Gold Corporation Page 63 Cerro Maricunga Oxide Gold Project Preliminary Economic Assessment
Figure 18 Geostats Blank Certified Material- Au
Overall conclusions drawn from the QAQC analyses are as follows:
Analyses of duplicates show good precision, indicating that the protocols used
for sample preparation and assaying were adequate.
Analyses of standards used during exploration show good accuracy.
Analyses of blanks show no serious contamination problems between
samples.
The overall conclusion is that QAQC data generated throughout the 2011 – 2012 drilling campaigns at
Cerro Maricunga meets acceptability criteria and therefore the exploration data used complies with
required confidence for resource modeling and estimation.
Atacama Pacific Gold Corporation Page 64 Cerro Maricunga Oxide Gold Project Preliminary Economic Assessment
13. MINERAL PROCESSING AND METALLURGICAL TESTING
A number of metallurgical test campaigns have been undertaken on mineralized material from Cerro
Maricunga with 14 column tests and over 100 bottle roll tests completed. The test work has been
completed by established mineral processing laboratories: Kappes, Cassidy and Associates (“KCA”),
Reno, Nevada; Laboratorio Plenge, Lima, Peru; and, AMTEL (Advanced Mineral Technology
Laboratory Ltd), London, Canada. The results from the metallurgical test work completed to date are
described in Company’s November 9, 2012 technical report.
The following summarizes the results from metallurgical tests completed on seven composites
samples of Cerro Maricunga mineralized material completed in the KCA facilities in Reno (2010 and
2011). Tests results were reviewed and summarized by AMTEL. The key results are shown as
following.
13.1 Characterization of samples
Chemical, physical and mineralogical analyses were carried out on some of the samples. The
corresponding results are shown in the following sections.
13.1.1 Physical characterization
Hardness estimation (BWi) and abrasion characterization was conducted to some of the samples by
SGS laboratories. The following table shows the results.
Table 20 Hardness and abrasion index results
13.1.2 Chemical characterization
A chemical analysis was carried out on all seven samples. The following table shows the samples
head grades for Au, Ag and Cu.
Bwi
KWh/t
1 10.63 0.0669
2 11.26 0.1239
3 --- ---
4 10.67 ---
5 10.49 ---
6 9.77 ---
7 ---
Composite Ai
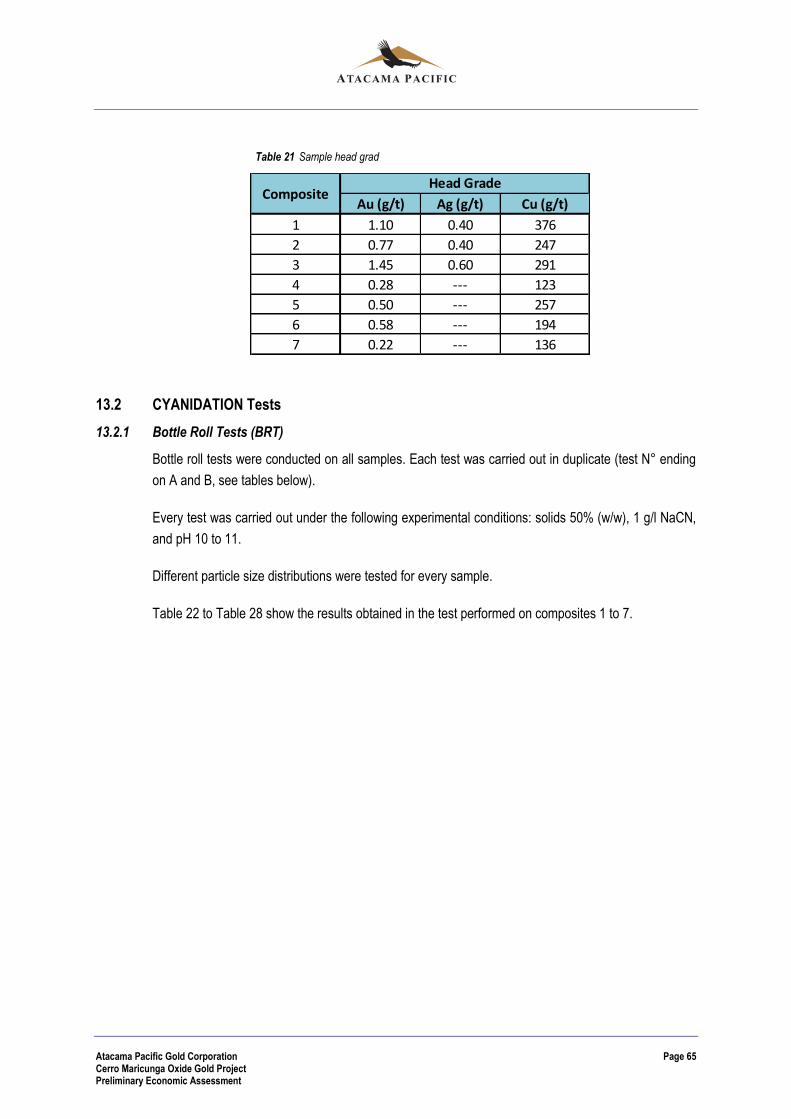
Atacama Pacific Gold Corporation Page 65 Cerro Maricunga Oxide Gold Project Preliminary Economic Assessment
Table 21 Sample head grad
13.2 CYANIDATION Tests
13.2.1 Bottle Roll Tests (BRT)
Bottle roll tests were conducted on all samples. Each test was carried out in duplicate (test N° ending
on A and B, see tables below).
Every test was carried out under the following experimental conditions: solids 50% (w/w), 1 g/l NaCN,
and pH 10 to 11.
Different particle size distributions were tested for every sample.
Table 22 to Table 28 show the results obtained in the test performed on composites 1 to 7.
Au (g/t) Ag (g/t) Cu (g/t)
1 1.10 0.40 376
2 0.77 0.40 247
3 1.45 0.60 291
4 0.28 --- 123
5 0.50 --- 257
6 0.58 --- 194
7 0.22 --- 136
CompositeHead Grade

Atacama Pacific Gold Corporation Page 66 Cerro Maricunga Oxide Gold Project Preliminary Economic Assessment
BRT for Composite 1
Table 22 Bottle roll tests results of Composite 1
Test N° = (A, B) correspond to the same test in duplicate
For composite 1, gold extraction increases from 81% to 88% when the P80 is reduced from 19 mm to
1 mm (for a residence time of 10 days). A gold extraction of 92 % is achieved after 4 days for P80 0.1
mm.
Sodium cyanide (NaCN) consumption is very low and within the range 0.07 through 0.31 kg/t.
Test N° P80
Calc. Head
Grade
(Sol + Tails)
Gold
Extraction
Residence
Time
NaCN
Consumption
Addition of
Ca(OH)2
Addition of
CaO
mm g/t Au % days Kg/t Kg/t Kg/t
45206 A 19.0 1.06 81 10 0.23 2.5 1.9
45206 B 19.0 1.13 81 10 0.26 2.5 1.9
45207 A 12.5 1.13 83 10 0.28 2.8 2.1
45207 B 12.5 1.11 83 10 0.31 2.8 2.1
45208 A 9.5 1.07 86 10 0.12 3.0 2.3
45208 B 9.5 1.02 85 10 0.12 3.0 2.3
45209 A 6.3 1.03 85 10 < 0,01 3.5 2.6
45209 B 6.3 1.36 80 10 0.19 3.0 2.3
45210 A 1.0 1.05 88 10 0.12 3.5 2.6
45210 B 1.0 1.06 88 10 0.11 3.5 2.6
45238 A 0.1 1.35 92 4 0.07 3.5 2.6
45238 B 0.1 1.13 91 4 0.17 3.5 2.6
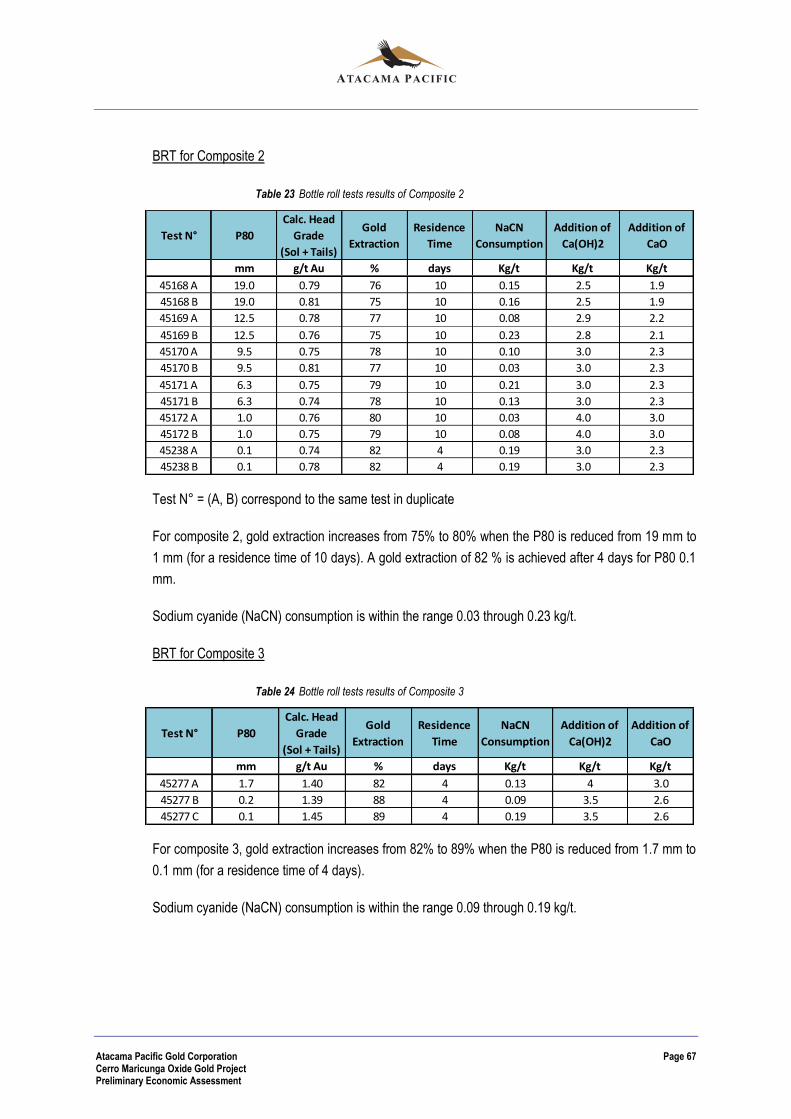
Atacama Pacific Gold Corporation Page 67 Cerro Maricunga Oxide Gold Project Preliminary Economic Assessment
BRT for Composite 2
Table 23 Bottle roll tests results of Composite 2
Test N° = (A, B) correspond to the same test in duplicate
For composite 2, gold extraction increases from 75% to 80% when the P80 is reduced from 19 mm to
1 mm (for a residence time of 10 days). A gold extraction of 82 % is achieved after 4 days for P80 0.1
mm.
Sodium cyanide (NaCN) consumption is within the range 0.03 through 0.23 kg/t.
BRT for Composite 3
Table 24 Bottle roll tests results of Composite 3
For composite 3, gold extraction increases from 82% to 89% when the P80 is reduced from 1.7 mm to
0.1 mm (for a residence time of 4 days).
Sodium cyanide (NaCN) consumption is within the range 0.09 through 0.19 kg/t.
Test N° P80
Calc. Head
Grade
(Sol + Tails)
Gold
Extraction
Residence
Time
NaCN
Consumption
Addition of
Ca(OH)2
Addition of
CaO
mm g/t Au % days Kg/t Kg/t Kg/t
45168 A 19.0 0.79 76 10 0.15 2.5 1.9
45168 B 19.0 0.81 75 10 0.16 2.5 1.9
45169 A 12.5 0.78 77 10 0.08 2.9 2.2
45169 B 12.5 0.76 75 10 0.23 2.8 2.1
45170 A 9.5 0.75 78 10 0.10 3.0 2.3
45170 B 9.5 0.81 77 10 0.03 3.0 2.3
45171 A 6.3 0.75 79 10 0.21 3.0 2.3
45171 B 6.3 0.74 78 10 0.13 3.0 2.3
45172 A 1.0 0.76 80 10 0.03 4.0 3.0
45172 B 1.0 0.75 79 10 0.08 4.0 3.0
45238 A 0.1 0.74 82 4 0.19 3.0 2.3
45238 B 0.1 0.78 82 4 0.19 3.0 2.3
Test N° P80
Calc. Head
Grade
(Sol + Tails)
Gold
Extraction
Residence
Time
NaCN
Consumption
Addition of
Ca(OH)2
Addition of
CaO
mm g/t Au % days Kg/t Kg/t Kg/t
45277 A 1.7 1.40 82 4 0.13 4 3.0
45277 B 0.2 1.39 88 4 0.09 3.5 2.6
45277 C 0.1 1.45 89 4 0.19 3.5 2.6
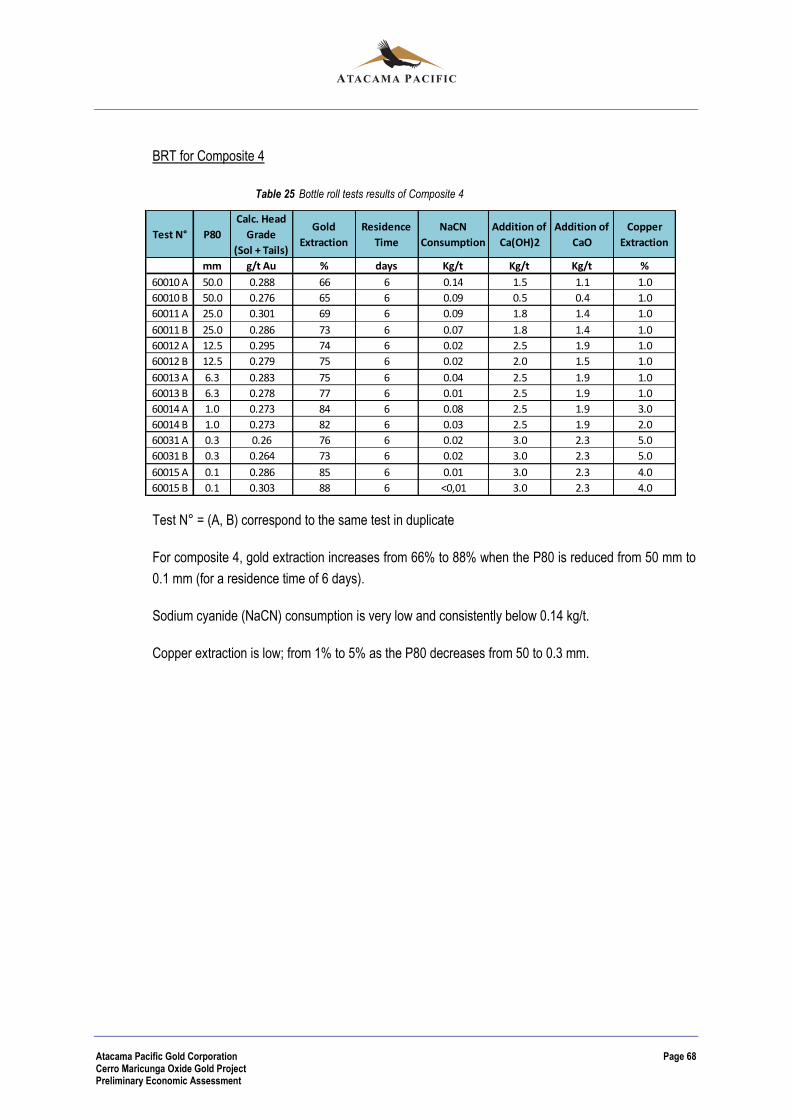
Atacama Pacific Gold Corporation Page 68 Cerro Maricunga Oxide Gold Project Preliminary Economic Assessment
BRT for Composite 4
Table 25 Bottle roll tests results of Composite 4
Test N° = (A, B) correspond to the same test in duplicate
For composite 4, gold extraction increases from 66% to 88% when the P80 is reduced from 50 mm to
0.1 mm (for a residence time of 6 days).
Sodium cyanide (NaCN) consumption is very low and consistently below 0.14 kg/t.
Copper extraction is low; from 1% to 5% as the P80 decreases from 50 to 0.3 mm.
Test N° P80
Calc. Head
Grade
(Sol + Tails)
Gold
Extraction
Residence
Time
NaCN
Consumption
Addition of
Ca(OH)2
Addition of
CaO
Copper
Extraction
mm g/t Au % days Kg/t Kg/t Kg/t %
60010 A 50.0 0.288 66 6 0.14 1.5 1.1 1.0
60010 B 50.0 0.276 65 6 0.09 0.5 0.4 1.0
60011 A 25.0 0.301 69 6 0.09 1.8 1.4 1.0
60011 B 25.0 0.286 73 6 0.07 1.8 1.4 1.0
60012 A 12.5 0.295 74 6 0.02 2.5 1.9 1.0
60012 B 12.5 0.279 75 6 0.02 2.0 1.5 1.0
60013 A 6.3 0.283 75 6 0.04 2.5 1.9 1.0
60013 B 6.3 0.278 77 6 0.01 2.5 1.9 1.0
60014 A 1.0 0.273 84 6 0.08 2.5 1.9 3.0
60014 B 1.0 0.273 82 6 0.03 2.5 1.9 2.0
60031 A 0.3 0.26 76 6 0.02 3.0 2.3 5.0
60031 B 0.3 0.264 73 6 0.02 3.0 2.3 5.0
60015 A 0.1 0.286 85 6 0.01 3.0 2.3 4.0
60015 B 0.1 0.303 88 6 <0,01 3.0 2.3 4.0

Atacama Pacific Gold Corporation Page 69 Cerro Maricunga Oxide Gold Project Preliminary Economic Assessment
BRT for Composite 5
Table 26 Bottle roll tests results of Composite 5
Test N° = (A, B) correspond to the same test in duplicate
For composite 5, gold extraction increases from 64% to 92% when the P80 is reduced from 50 mm to
0.1 mm (for a residence time of 6 days).
Sodium cyanide (NaCN) consumption is within the range 0.02 through 0.16 kg/t.
Copper extraction is in a low range. It goes from 1% to 6% when the P80 decreases from 50 to 0.3
mm.
Test N° P80
Calc. Head
Grade
(Sol + Tails)
Gold
Extraction
Residence
Time
NaCN
Consumption
Addition of
Ca(OH)2
Addition of
CaO
Copper
Extraction
mm g/t Au % days Kg/t Kg/t Kg/t %
60016 A 50.0 0.546 64 6 0.08 1.0 0.8 1.0
60016 B 50.0 0.445 66 6 0.08 1.0 0.8 1.0
60017 A 25.0 0.508 65 6 0.16 1.0 0.8 1.0
60017 B 25.0 0.558 69 6 0.13 1.0 0.8 1.0
60018 A 12.5 0.469 79 6 0.1 1.5 1.1 2.0
60018 B 12.5 0.448 82 6 0.06 1.5 1.1 2.0
60019 A 6.3 0.474 82 6 0.02 2.0 1.5 3.0
60019 B 6.3 0.477 82 6 0.03 2.0 1.5 3.0
60020 A 1.0 0.513 74 6 0.12 2.5 1.9 4.0
60020 B 1.0 0.488 79 6 0.04 2.5 1.9 4.0
60032 A 0.3 0.505 82 6 <0,01 2.5 1.9 6.0
60032 B 0.3 0.491 84 6 <0,01 2.5 1.9 6.0
60021 A 0.1 0.513 92 6 0.025 1.5 1.1 5.0
60021 B 0.1 0.577 86 6 0.02 1.5 1.1 5.0
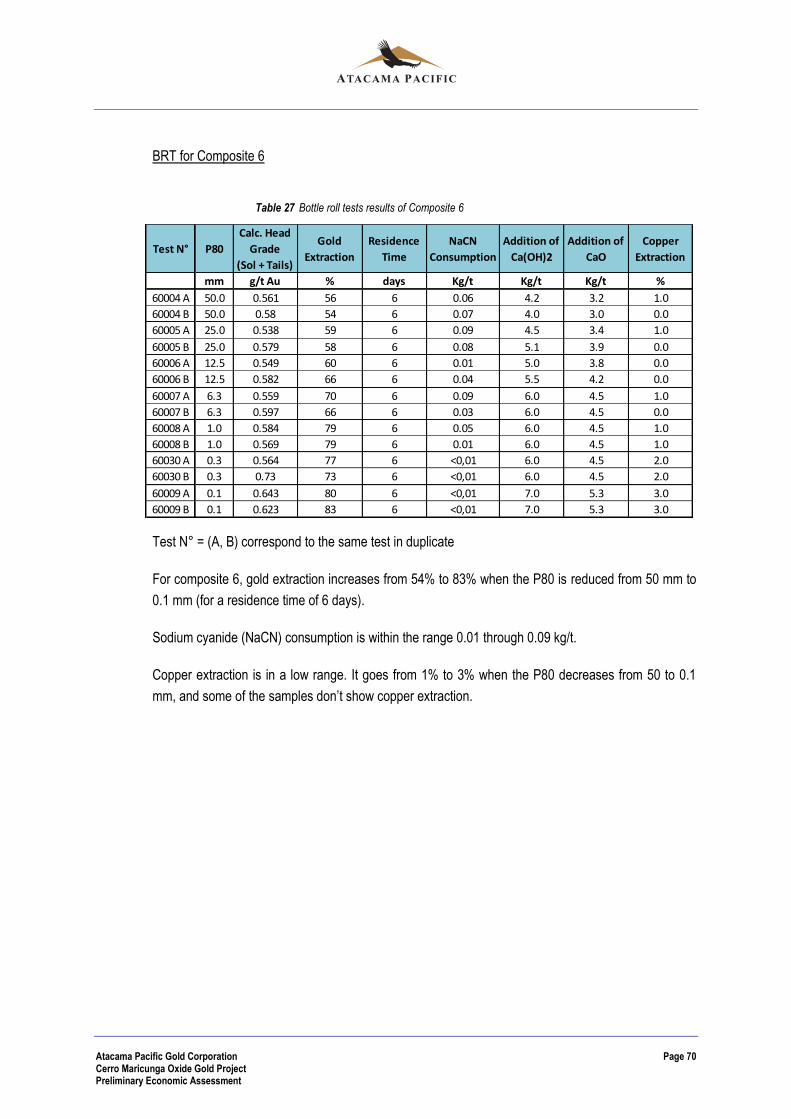
Atacama Pacific Gold Corporation Page 70 Cerro Maricunga Oxide Gold Project Preliminary Economic Assessment
BRT for Composite 6
Table 27 Bottle roll tests results of Composite 6
Test N° = (A, B) correspond to the same test in duplicate
For composite 6, gold extraction increases from 54% to 83% when the P80 is reduced from 50 mm to
0.1 mm (for a residence time of 6 days).
Sodium cyanide (NaCN) consumption is within the range 0.01 through 0.09 kg/t.
Copper extraction is in a low range. It goes from 1% to 3% when the P80 decreases from 50 to 0.1
mm, and some of the samples don’t show copper extraction.
Test N° P80
Calc. Head
Grade
(Sol + Tails)
Gold
Extraction
Residence
Time
NaCN
Consumption
Addition of
Ca(OH)2
Addition of
CaO
Copper
Extraction
mm g/t Au % days Kg/t Kg/t Kg/t %
60004 A 50.0 0.561 56 6 0.06 4.2 3.2 1.0
60004 B 50.0 0.58 54 6 0.07 4.0 3.0 0.0
60005 A 25.0 0.538 59 6 0.09 4.5 3.4 1.0
60005 B 25.0 0.579 58 6 0.08 5.1 3.9 0.0
60006 A 12.5 0.549 60 6 0.01 5.0 3.8 0.0
60006 B 12.5 0.582 66 6 0.04 5.5 4.2 0.0
60007 A 6.3 0.559 70 6 0.09 6.0 4.5 1.0
60007 B 6.3 0.597 66 6 0.03 6.0 4.5 0.0
60008 A 1.0 0.584 79 6 0.05 6.0 4.5 1.0
60008 B 1.0 0.569 79 6 0.01 6.0 4.5 1.0
60030 A 0.3 0.564 77 6 <0,01 6.0 4.5 2.0
60030 B 0.3 0.73 73 6 <0,01 6.0 4.5 2.0
60009 A 0.1 0.643 80 6 <0,01 7.0 5.3 3.0
60009 B 0.1 0.623 83 6 <0,01 7.0 5.3 3.0
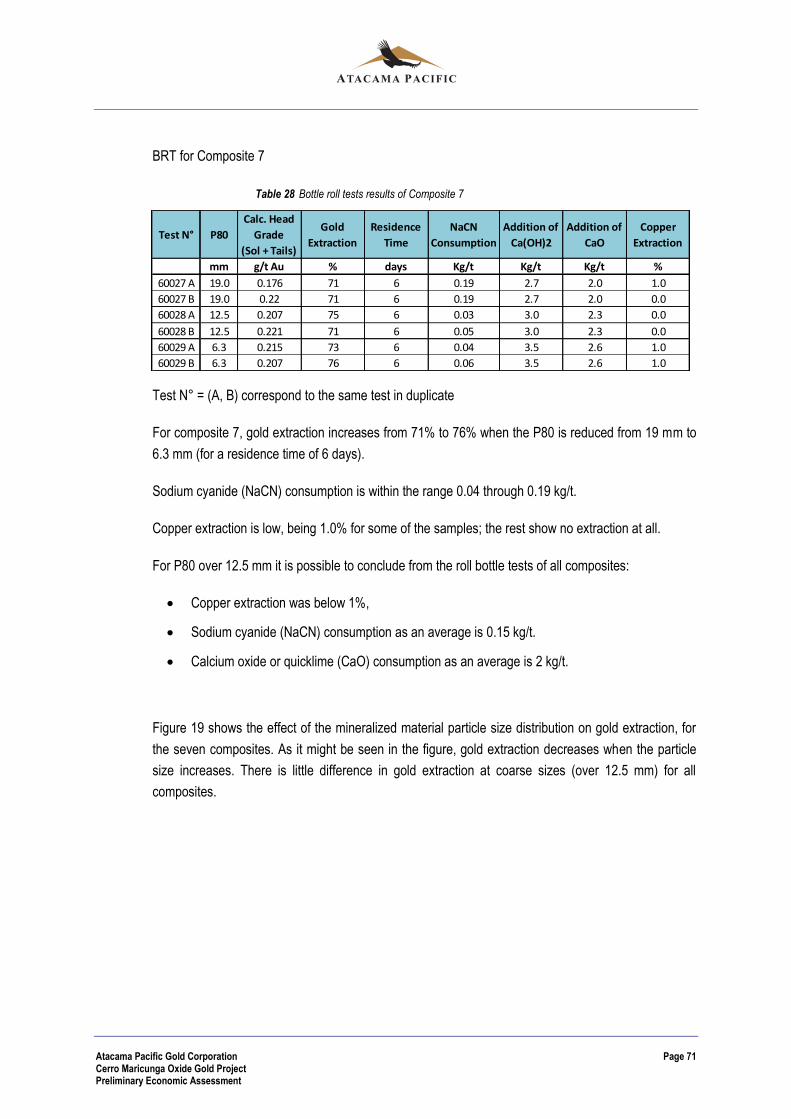
Atacama Pacific Gold Corporation Page 71 Cerro Maricunga Oxide Gold Project Preliminary Economic Assessment
BRT for Composite 7
Table 28 Bottle roll tests results of Composite 7
Test N° = (A, B) correspond to the same test in duplicate
For composite 7, gold extraction increases from 71% to 76% when the P80 is reduced from 19 mm to
6.3 mm (for a residence time of 6 days).
Sodium cyanide (NaCN) consumption is within the range 0.04 through 0.19 kg/t.
Copper extraction is low, being 1.0% for some of the samples; the rest show no extraction at all.
For P80 over 12.5 mm it is possible to conclude from the roll bottle tests of all composites:
Copper extraction was below 1%,
Sodium cyanide (NaCN) consumption as an average is 0.15 kg/t.
Calcium oxide or quicklime (CaO) consumption as an average is 2 kg/t.
Figure 19 shows the effect of the mineralized material particle size distribution on gold extraction, for
the seven composites. As it might be seen in the figure, gold extraction decreases when the particle
size increases. There is little difference in gold extraction at coarse sizes (over 12.5 mm) for all
composites.
Test N° P80
Calc. Head
Grade
(Sol + Tails)
Gold
Extraction
Residence
Time
NaCN
Consumption
Addition of
Ca(OH)2
Addition of
CaO
Copper
Extraction
mm g/t Au % days Kg/t Kg/t Kg/t %
60027 A 19.0 0.176 71 6 0.19 2.7 2.0 1.0
60027 B 19.0 0.22 71 6 0.19 2.7 2.0 0.0
60028 A 12.5 0.207 75 6 0.03 3.0 2.3 0.0
60028 B 12.5 0.221 71 6 0.05 3.0 2.3 0.0
60029 A 6.3 0.215 73 6 0.04 3.5 2.6 1.0
60029 B 6.3 0.207 76 6 0.06 3.5 2.6 1.0

Atacama Pacific Gold Corporation Page 72 Cerro Maricunga Oxide Gold Project Preliminary Economic Assessment
Figure 19 Effect of mineralized material particle size distribution on gold extraction. Bottle roll tests.
50
55
60
65
70
75
80
85
90
95
100
00 05 10 15 20 25 30 35 40 45 50
Gold
Extr
acti
on (
%)
P80 (mm)
Composite 1 BRT 1.08 g/t Au Composite 2 BRT 0.78 g/t Au Composite 3 BRT 1.45 g/t Au
Composite 4 BRT 0.28 g/t Au Composite 5 BRT 0.50 g/t Au Composite 6 BRT 0.58 g/t Au
Composite 7 BRT 0.22 g/t Au

Atacama Pacific Gold Corporation Page 73 Cerro Maricunga Oxide Gold Project Preliminary Economic Assessment
13.2.2 Column percolation leach testwork (CLT)
Column percolation leach testwork was conducted on six of the seven composites (composite 3 was
not tested). Columns of 12.7 cm diameter and 170 cm height were utilized for every test. Residence
time was 57 days for composites 1 and 2, and 87 days for composites 4 through 7.
Different particle size distributions were tested.
Results of column testwork, are shown Table 29
Table 29 Columns percolation leach testwork
Gold extraction for composite 1 at P80 19 mm was 89%.
Gold extraction for composite 2 at P80 19 mm was 79%. A minor increment is observed when P80
decreases to 9.5 mm (80% of extraction).
The average gold extraction for composite 4 at P80 19 mm was 81%.
The average gold extraction for composite 5 at P80 19 mm was 85%.
Gold extraction for composite 6 at P80 19 mm was 80%. Gold extraction decreases to 78% when P80
is increased to 50 mm and to 77% when P80 is increased to 100 mm.
Gold extraction for composite 7 at P80 19 mm was 78%.
Sodium cyanide (NaCN) consumption as an average of all composite for P80= 19 mm is 0.8 Kg/t.
Calcium oxide (CaO) addition as an average of all composite is 2.7 Kg/t.
Analyzing the results obtained in both BTR and CLT test, the following can be concluded:
For an average material grade of 0.57 g/t Au and P80 50 mm, gold extraction reaches 56% in a
bottle leaching test and 79% in a column test.
Test N° Ore Composite P80
Calc. Head
Grade
(Sol + Tails)
Gold
Extraction
Residence
Time
NaCN
Consumption
Addition of
Ca(OH)2
Addition of
Ca(OH)2
Av/composite
Addition of
CaO
Av/composite
mm g/t Au % días Kg/t Kg/t Kg/t Kg/t
45640 Compósito 1 19,0 1,13 89 57 1,0 3,1 3,1 2,3
45643 Compósito 2 19,0 0,76 79 57 1,1 3,1
45646 Compósito 2 9,5 0,79 80 57 1,2 3,1
60042 Compósito 4 19,0 0,28 80 87 0,8 2,5
60045 Compósito 4 19,0 0,25 82 87 0,5 2,5
60048 Compósito 5 19,0 0,46 86 87 0,7 2,0
60051 Compósito 5 19,0 0,43 84 87 1,0 2,0
60033 Compósito 6 100 0,53 77 87 0,1 6,6
60036 Compósito 6 50,0 0,46 78 87 0,1 6,7
60039 Compósito 6 19,0 0,43 80 87 0,4 6,5
60054 Compósito 7 19,0 0,16 78 87 0,6 4,0 4,0 3,0
2,3
1,9
1,5
5,0
3,1
2,5
2,0
6,6
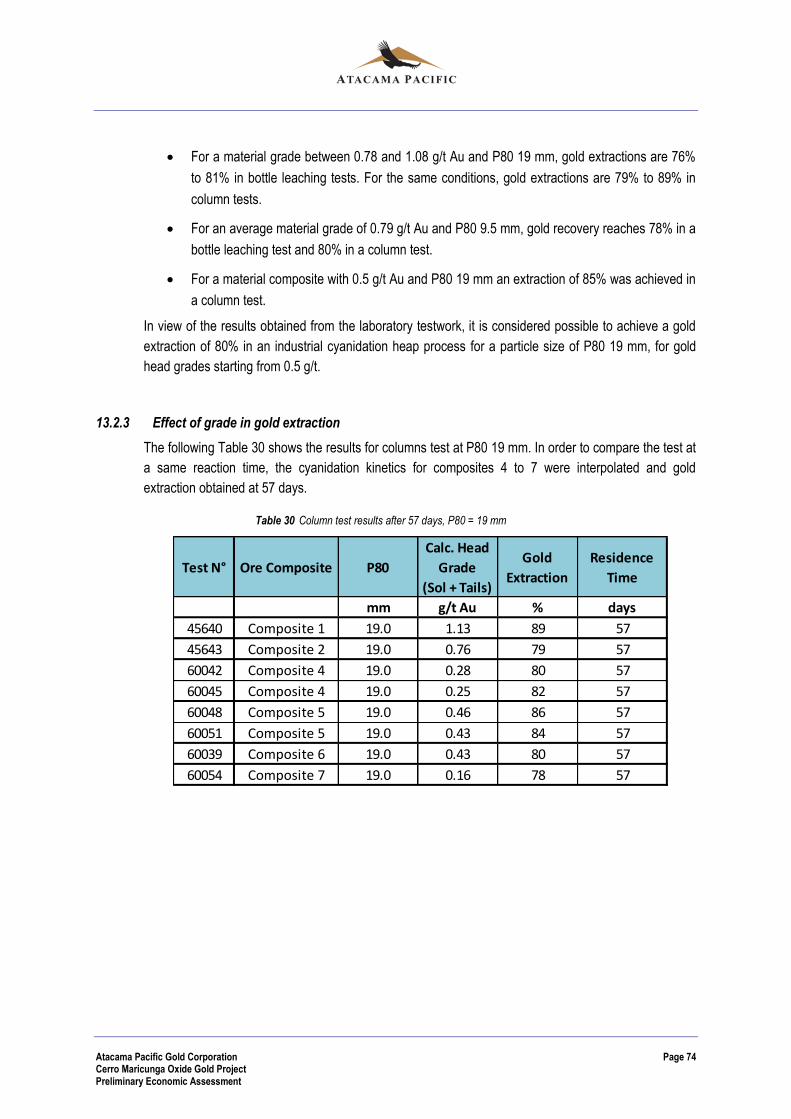
Atacama Pacific Gold Corporation Page 74 Cerro Maricunga Oxide Gold Project Preliminary Economic Assessment
For a material grade between 0.78 and 1.08 g/t Au and P80 19 mm, gold extractions are 76%
to 81% in bottle leaching tests. For the same conditions, gold extractions are 79% to 89% in
column tests.
For an average material grade of 0.79 g/t Au and P80 9.5 mm, gold recovery reaches 78% in a
bottle leaching test and 80% in a column test.
For a material composite with 0.5 g/t Au and P80 19 mm an extraction of 85% was achieved in
a column test.
In view of the results obtained from the laboratory testwork, it is considered possible to achieve a gold
extraction of 80% in an industrial cyanidation heap process for a particle size of P80 19 mm, for gold
head grades starting from 0.5 g/t.
13.2.3 Effect of grade in gold extraction
The following Table 30 shows the results for columns test at P80 19 mm. In order to compare the test at
a same reaction time, the cyanidation kinetics for composites 4 to 7 were interpolated and gold
extraction obtained at 57 days.
Table 30 Column test results after 57 days, P80 = 19 mm
Test N° Ore Composite P80
Calc. Head
Grade
(Sol + Tails)
Gold
Extraction
Residence
Time
mm g/t Au % days
45640 Composite 1 19.0 1.13 89 57
45643 Composite 2 19.0 0.76 79 57
60042 Composite 4 19.0 0.28 80 57
60045 Composite 4 19.0 0.25 82 57
60048 Composite 5 19.0 0.46 86 57
60051 Composite 5 19.0 0.43 84 57
60039 Composite 6 19.0 0.43 80 57
60054 Composite 7 19.0 0.16 78 57
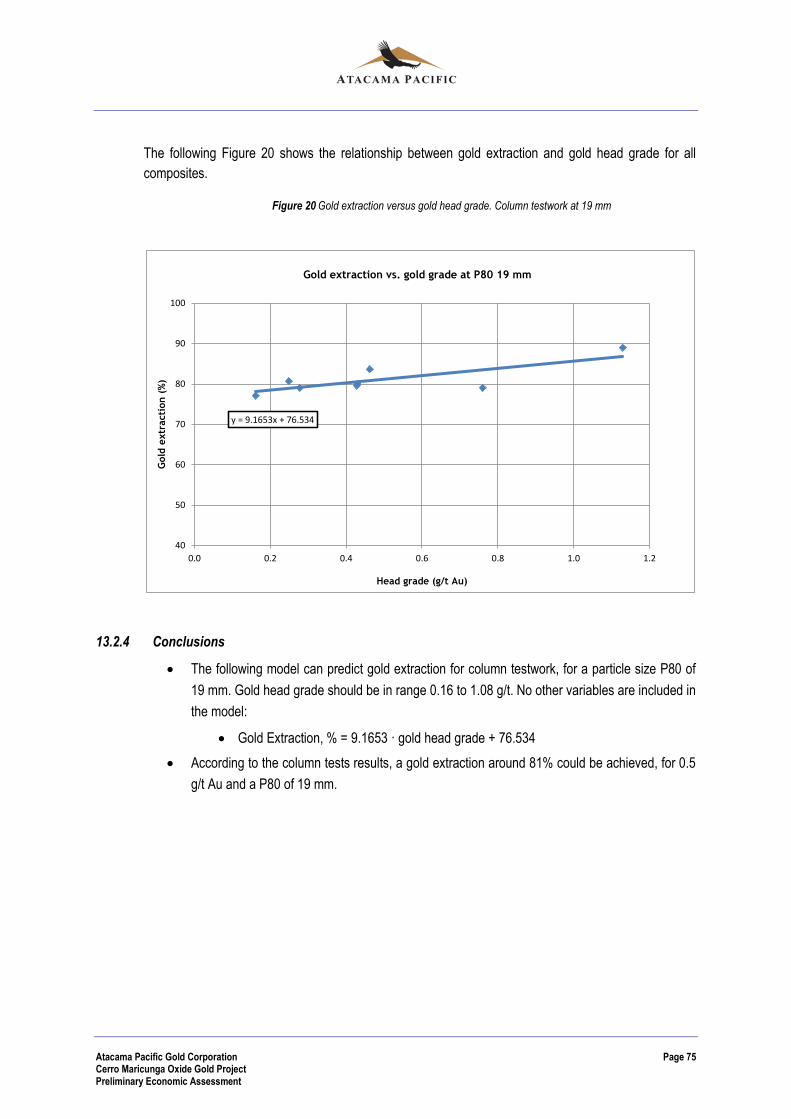
Atacama Pacific Gold Corporation Page 75 Cerro Maricunga Oxide Gold Project Preliminary Economic Assessment
The following Figure 20 shows the relationship between gold extraction and gold head grade for all
composites.
Figure 20 Gold extraction versus gold head grade. Column testwork at 19 mm
13.2.4 Conclusions
The following model can predict gold extraction for column testwork, for a particle size P80 of
19 mm. Gold head grade should be in range 0.16 to 1.08 g/t. No other variables are included in
the model:
Gold Extraction, % = 9.1653 · gold head grade + 76.534
According to the column tests results, a gold extraction around 81% could be achieved, for 0.5
g/t Au and a P80 of 19 mm.
y = 9.1653x + 76.534
40
50
60
70
80
90
100
0.0 0.2 0.4 0.6 0.8 1.0 1.2
Gold
extr
acti
on (
%)
Head grade (g/t Au)
Gold extraction vs. gold grade at P80 19 mm

Atacama Pacific Gold Corporation Page 76 Cerro Maricunga Oxide Gold Project Preliminary Economic Assessment
14. MINERAL RESOURCE ESTIMATE
The global mineral resource estimate, used as the basis for the preparation of the preliminary
economic assessment, was prepared by Magri Consultores Limitada and presented in the NI 43-101
compliant technical report “Technical Report on the Cerro Maricunga Gold Project, Region III, Chile”
dated November 9, 2012. The report can be found appropriately filed on the System for Electronic
Document Analysis and Retrieval at www.sedar.com.
The November 9, 2012 technical report includes details regarding the following items noted below and
should be reference for further information on the methodology used to prepare the current global
resource estimate:
QA/QC
Modeling Procedure
Exploratory data analysis - EDA
Variography
Block model and resource estimation
Model validation
Specific gravity model
Resource classification
Resource tabulation
The following sections briefly summarize methodology used to prepare the current resource estimate.
14.1 Modelling Procedure
The global resource model was generated using the following data from surface maps and geological
descriptions from diamond drill core and RC chip logging. The data was used to prepare 48 sections
and 12 plans spaced at 50m intervals using a ± 25m influence. A grade-shell of 150 ppb was
contoured and interpolated, as well as known barren porphyry units were modelled.
Four (4) main mineralized areas were defined (from north to south): Lynx , Phoenix, Pollux and Crux.
Each solid was assigned a specific code: Lynx = 1, Phoenix = 2, Crux = 3 and Pollux = 4. Barren zone
surrounding these solids are referred to as “Outside” and assigned a code = 5.
Figure 21 shows a three-dimensional view of the final solids.
As can be seen, the Lynx and Phoenix are separated by an approximately NS, sub-vertical porphyry
dike, which hosts low-grade Au mineralization. In general, Lynx, Phoenix and Pollux have a NW
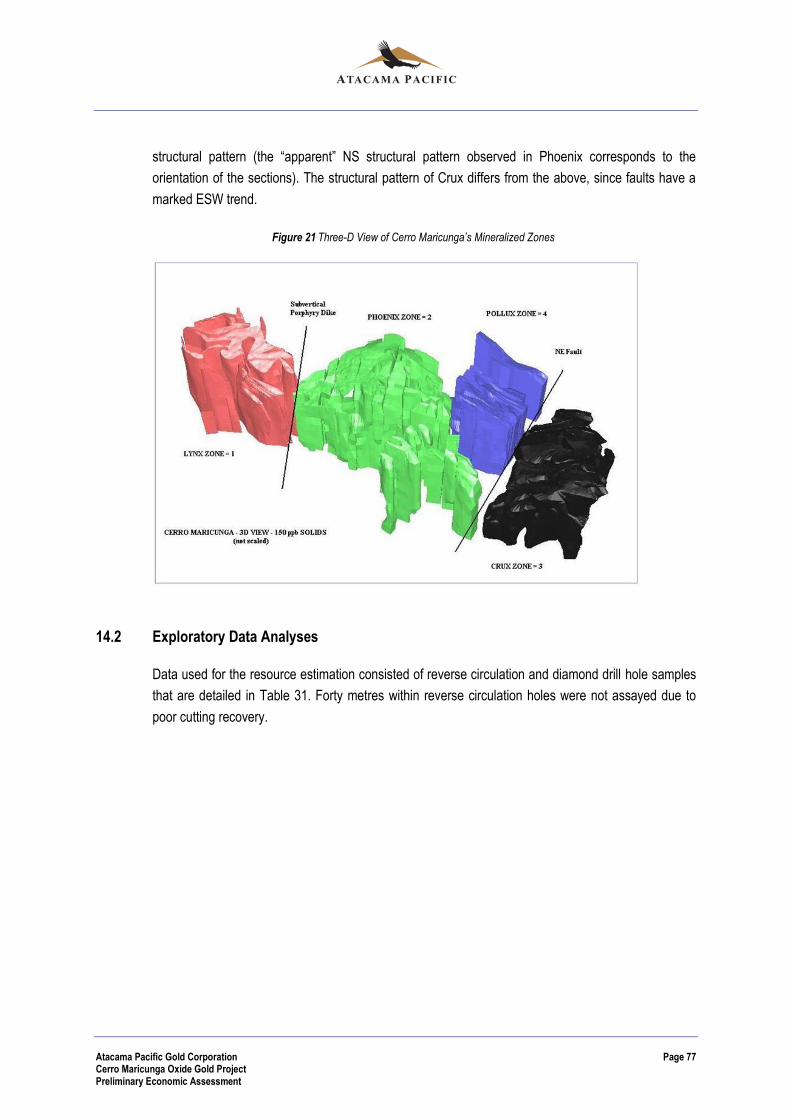
Atacama Pacific Gold Corporation Page 77 Cerro Maricunga Oxide Gold Project Preliminary Economic Assessment
structural pattern (the “apparent” NS structural pattern observed in Phoenix corresponds to the
orientation of the sections). The structural pattern of Crux differs from the above, since faults have a
marked ESW trend.
Figure 21 Three-D View of Cerro Maricunga’s Mineralized Zones
14.2 Exploratory Data Analyses
Data used for the resource estimation consisted of reverse circulation and diamond drill hole samples
that are detailed in Table 31. Forty metres within reverse circulation holes were not assayed due to
poor cutting recovery.
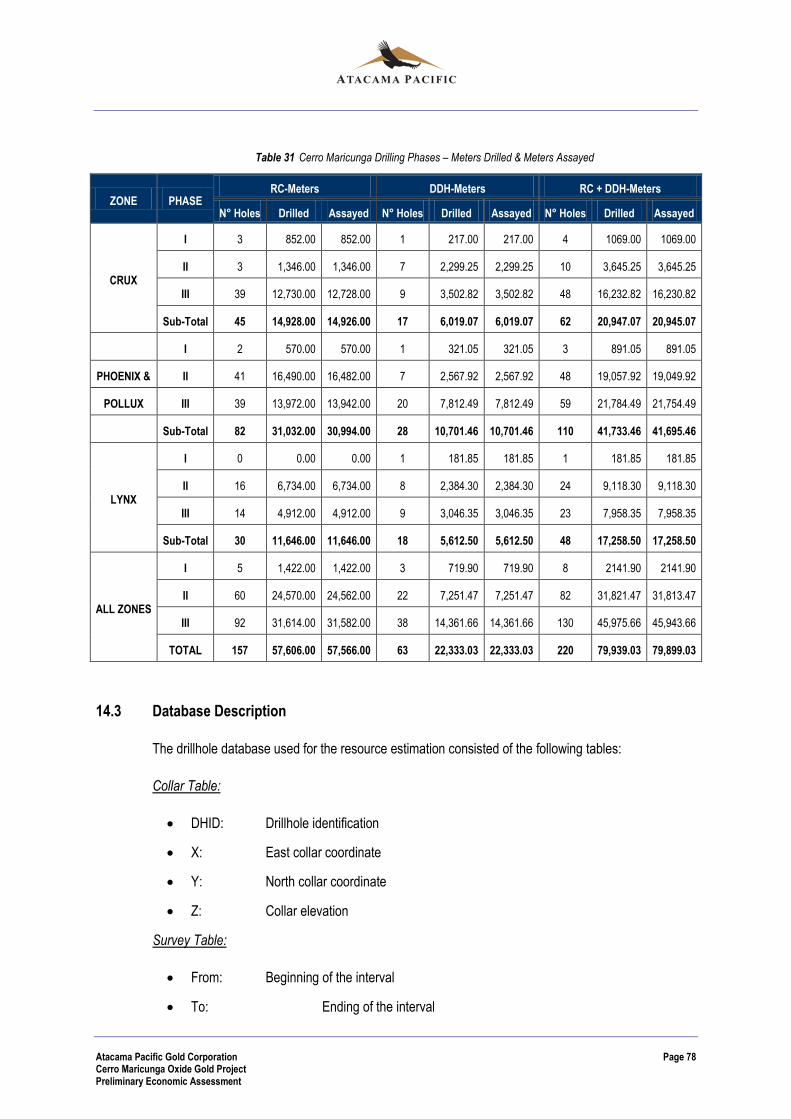
Atacama Pacific Gold Corporation Page 78 Cerro Maricunga Oxide Gold Project Preliminary Economic Assessment
Table 31 Cerro Maricunga Drilling Phases – Meters Drilled & Meters Assayed
ZONE PHASE RC-Meters DDH-Meters RC + DDH-Meters
N° Holes Drilled Assayed N° Holes Drilled Assayed N° Holes Drilled Assayed
CRUX
I 3 852.00 852.00 1 217.00 217.00 4 1069.00 1069.00
II 3 1,346.00 1,346.00 7 2,299.25 2,299.25 10 3,645.25 3,645.25
III 39 12,730.00 12,728.00 9 3,502.82 3,502.82 48 16,232.82 16,230.82
Sub-Total 45 14,928.00 14,926.00 17 6,019.07 6,019.07 62 20,947.07 20,945.07
I 2 570.00 570.00 1 321.05 321.05 3 891.05 891.05
PHOENIX & II 41 16,490.00 16,482.00 7 2,567.92 2,567.92 48 19,057.92 19,049.92
POLLUX III 39 13,972.00 13,942.00 20 7,812.49 7,812.49 59 21,784.49 21,754.49
Sub-Total 82 31,032.00 30,994.00 28 10,701.46 10,701.46 110 41,733.46 41,695.46
LYNX
I 0 0.00 0.00 1 181.85 181.85 1 181.85 181.85
II 16 6,734.00 6,734.00 8 2,384.30 2,384.30 24 9,118.30 9,118.30
III 14 4,912.00 4,912.00 9 3,046.35 3,046.35 23 7,958.35 7,958.35
Sub-Total 30 11,646.00 11,646.00 18 5,612.50 5,612.50 48 17,258.50 17,258.50
ALL ZONES
I 5 1,422.00 1,422.00 3 719.90 719.90 8 2141.90 2141.90
II 60 24,570.00 24,562.00 22 7,251.47 7,251.47 82 31,821.47 31,813.47
III 92 31,614.00 31,582.00 38 14,361.66 14,361.66 130 45,975.66 45,943.66
TOTAL 157 57,606.00 57,566.00 63 22,333.03 22,333.03 220 79,939.03 79,899.03
14.3 Database Description
The drillhole database used for the resource estimation consisted of the following tables:
Collar Table:
DHID: Drillhole identification
X: East collar coordinate
Y: North collar coordinate
Z: Collar elevation
Survey Table:
From: Beginning of the interval
To: Ending of the interval
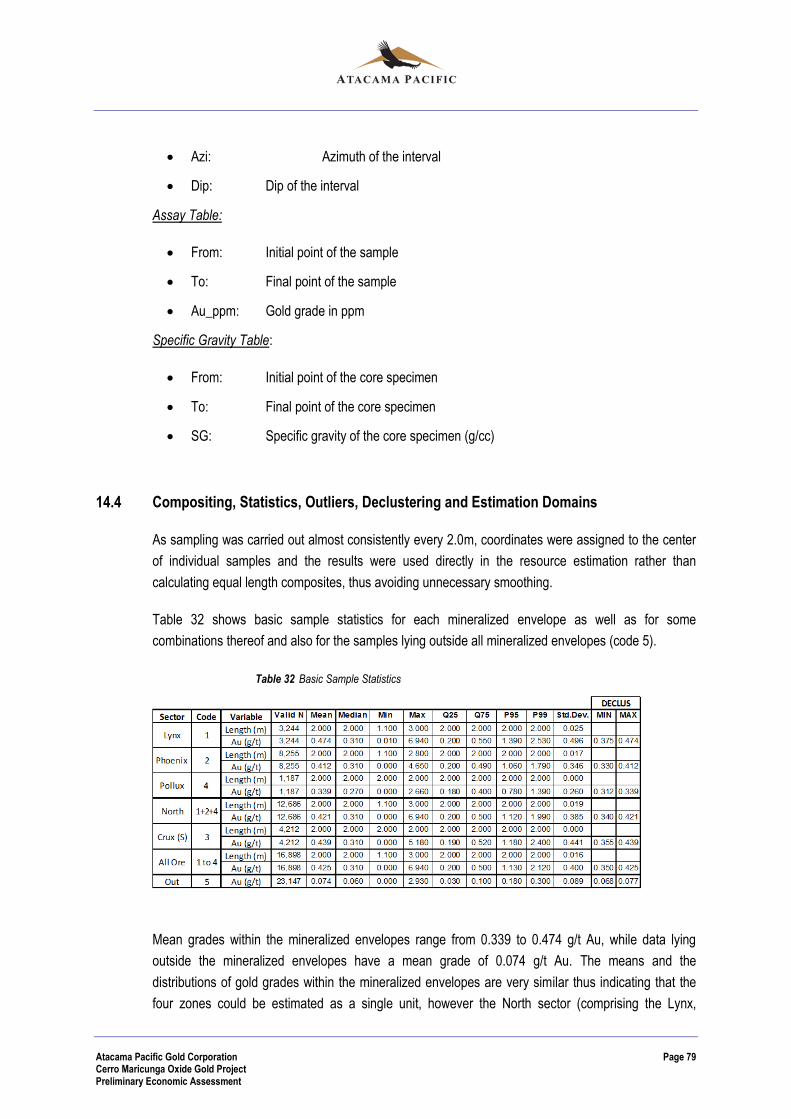
Atacama Pacific Gold Corporation Page 79 Cerro Maricunga Oxide Gold Project Preliminary Economic Assessment
Azi: Azimuth of the interval
Dip: Dip of the interval
Assay Table:
From: Initial point of the sample
To: Final point of the sample
Au_ppm: Gold grade in ppm
Specific Gravity Table:
From: Initial point of the core specimen
To: Final point of the core specimen
SG: Specific gravity of the core specimen (g/cc)
14.4 Compositing, Statistics, Outliers, Declustering and Estimation Domains
As sampling was carried out almost consistently every 2.0m, coordinates were assigned to the center
of individual samples and the results were used directly in the resource estimation rather than
calculating equal length composites, thus avoiding unnecessary smoothing.
Table 32 shows basic sample statistics for each mineralized envelope as well as for some
combinations thereof and also for the samples lying outside all mineralized envelopes (code 5).
Table 32 Basic Sample Statistics
Mean grades within the mineralized envelopes range from 0.339 to 0.474 g/t Au, while data lying
outside the mineralized envelopes have a mean grade of 0.074 g/t Au. The means and the
distributions of gold grades within the mineralized envelopes are very similar thus indicating that the
four zones could be estimated as a single unit, however the North sector (comprising the Lynx,

Atacama Pacific Gold Corporation Page 80 Cerro Maricunga Oxide Gold Project Preliminary Economic Assessment
Phoenix and Pollux zones) has a NW structural pattern while South sector (Crux zone) has an almost
EW pattern. It was decided, therefore, to estimate the North sector separately from South sector.
The area lying outside the mineralized envelopes was estimated separately in order to have an
estimation of the dilution material even though the mean grade is almost negligible.
As isolated high grades (outliers) may cause overestimation during the kriging process, relative high
grades were “capped”. The capping grade was set to 3.5 g/t for the northern zone as well as the
southern zone. This capping grade corresponds to the 99.83 and 99.90 percentiles respectively and
was chosen since slight deviations from the linear trend are present. Grade capping was introduced to
be slightly conservative and only affects 13 and 7 samples out of a total of 12,686 and 4,212 samples
available in the North and South sectors respectively. Outside the mineralized envelopes, a grade
capping of 1.2 g/t, equivalent to the 99.87 percentile was used.
As “higher” grade zones are more densely drilled than low grade zones, equal weighted sample
means usually produce a biased estimate of the global distribution average. These estimates are
generally too high and to avoid the effect of high grade clustering, the cell declustering technique was
used. The following mean versus cell size graphs were analyzed:
Figure 22 – Zones Lynx, Phoenix, Pollux and Crux separately. Figure 23 – Northern zone (Lynx-
Phoenix-Pollux) and all mineralised zones combined. Figure 24 – All samples lying outside the
mineralized envelopes.
Figure 22 Cell Declustering for Lynx, Phoenix, Pollux and Crux zones separately

Atacama Pacific Gold Corporation Page 81 Cerro Maricunga Oxide Gold Project Preliminary Economic Assessment
Figure 23 Cell declustering for the northern and all Mineralised zones combined
Figure 24 Cell declustering for all samples lying outside the mineralized envelopes
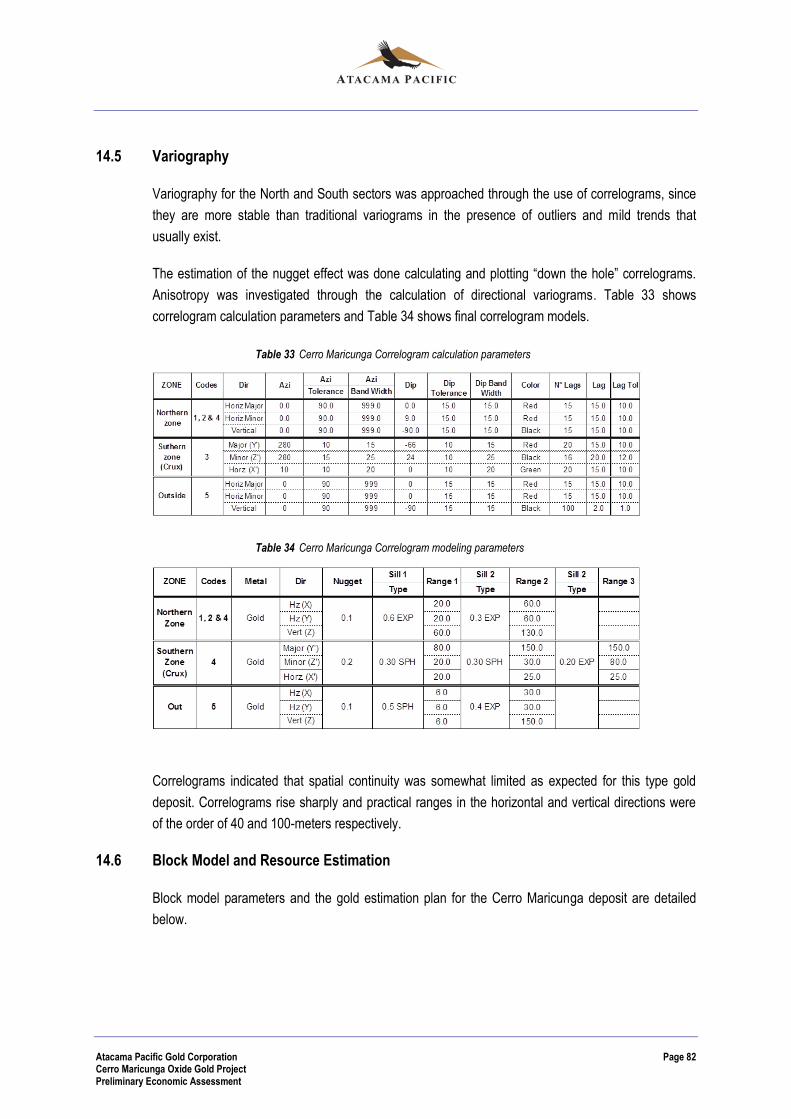
Atacama Pacific Gold Corporation Page 82 Cerro Maricunga Oxide Gold Project Preliminary Economic Assessment
14.5 Variography
Variography for the North and South sectors was approached through the use of correlograms, since
they are more stable than traditional variograms in the presence of outliers and mild trends that
usually exist.
The estimation of the nugget effect was done calculating and plotting “down the hole” correlograms.
Anisotropy was investigated through the calculation of directional variograms. Table 33 shows
correlogram calculation parameters and Table 34 shows final correlogram models.
Table 33 Cerro Maricunga Correlogram calculation parameters
Table 34 Cerro Maricunga Correlogram modeling parameters
Correlograms indicated that spatial continuity was somewhat limited as expected for this type gold
deposit. Correlograms rise sharply and practical ranges in the horizontal and vertical directions were
of the order of 40 and 100-meters respectively.
14.6 Block Model and Resource Estimation
Block model parameters and the gold estimation plan for the Cerro Maricunga deposit are detailed
below.
Atacama Pacific Gold Corporation Page 83 Cerro Maricunga Oxide Gold Project Preliminary Economic Assessment
Block Model Definition
A gold block model consisting of 10 x 10 x 10-m blocks was created. Block model parameters are
given below:
X Origin: 480,000
Y Origin: 7,011,600
Z Origin: 5,150 (origin at the top of the model)
Bearing: 45° (anti clockwise starting from x-axis)
Plunge: 0°
Dip: 0°
Model Size X-Axis: 2,000 m
Model Size Y-Axis: 3,000 m
Model Sixe Z-Axis: 1,000 m
Block Size X: 10 m
Block Size Y: 10 m
Block Size Z: 10 m
Block Discretization: 3 x 3 x 3 (in X, Y and Z directions)
The most important variables of the model are:
Au: Estimated Au grade in g/t
Density: Block density
Corrida: Au estimation pass
NN: number of samples used in Au estimation
Var Au: Au kriging variance
Categ: Resource classification category
Au Estimation Plan
The grade estimation plan for Cerro Maricunga Project was carried out in four (4) passes. General
settings are detailed below:
The search radii for the first kriging pass were set at approximately the variogram ranges that
correspond to 90% of the total sill in each direction.
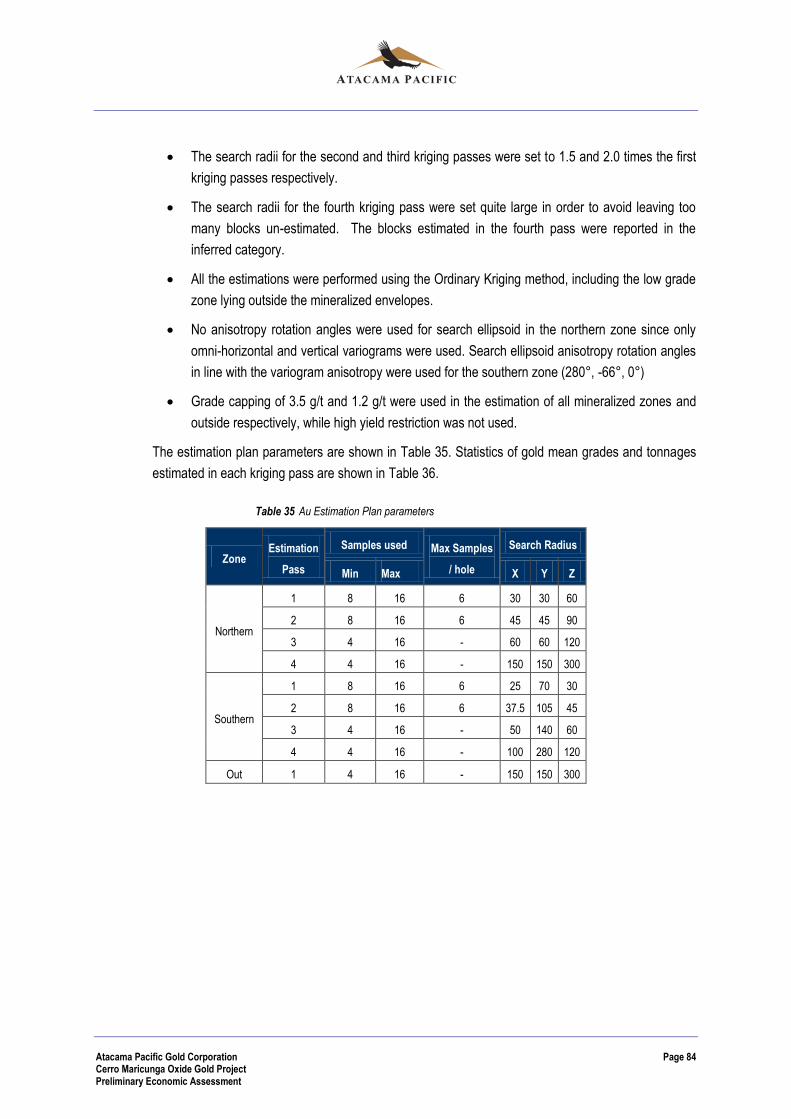
Atacama Pacific Gold Corporation Page 84 Cerro Maricunga Oxide Gold Project Preliminary Economic Assessment
The search radii for the second and third kriging passes were set to 1.5 and 2.0 times the first
kriging passes respectively.
The search radii for the fourth kriging pass were set quite large in order to avoid leaving too
many blocks un-estimated. The blocks estimated in the fourth pass were reported in the
inferred category.
All the estimations were performed using the Ordinary Kriging method, including the low grade
zone lying outside the mineralized envelopes.
No anisotropy rotation angles were used for search ellipsoid in the northern zone since only
omni-horizontal and vertical variograms were used. Search ellipsoid anisotropy rotation angles
in line with the variogram anisotropy were used for the southern zone (280°, -66°, 0°)
Grade capping of 3.5 g/t and 1.2 g/t were used in the estimation of all mineralized zones and
outside respectively, while high yield restriction was not used.
The estimation plan parameters are shown in Table 35. Statistics of gold mean grades and tonnages
estimated in each kriging pass are shown in Table 36.
Table 35 Au Estimation Plan parameters
Zone Estimation
Pass
Samples used Max Samples
/ hole
Search Radius
Min Max X Y Z
Northern
1 8 16 6 30 30 60
2 8 16 6 45 45 90
3 4 16 - 60 60 120
4 4 16 - 150 150 300
Southern
1 8 16 6 25 70 30
2 8 16 6 37.5 105 45
3 4 16 - 50 140 60
4 4 16 - 100 280 120
Out 1 4 16 - 150 150 300
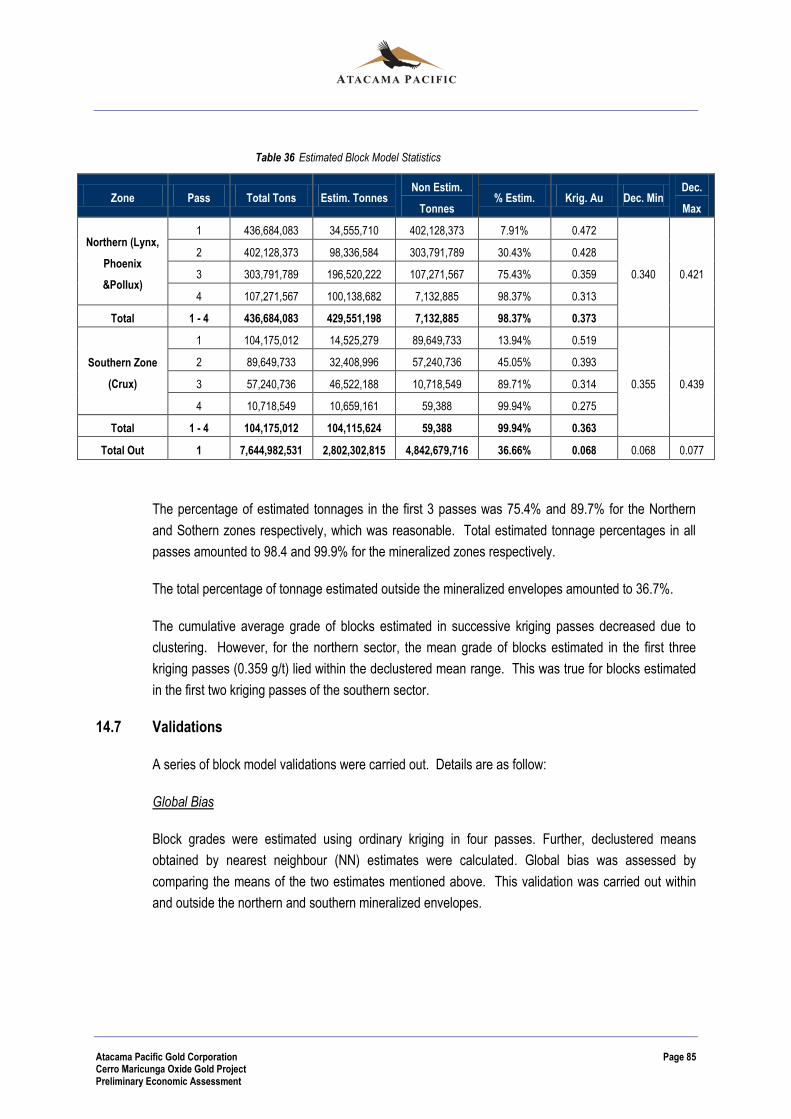
Atacama Pacific Gold Corporation Page 85 Cerro Maricunga Oxide Gold Project Preliminary Economic Assessment
Table 36 Estimated Block Model Statistics
Zone Pass Total Tons Estim. Tonnes Non Estim.
Tonnes % Estim. Krig. Au Dec. Min
Dec.
Max
Northern (Lynx,
Phoenix
&Pollux)
1 436,684,083 34,555,710 402,128,373 7.91% 0.472
0.340 0.421
2 402,128,373 98,336,584 303,791,789 30.43% 0.428
3 303,791,789 196,520,222 107,271,567 75.43% 0.359
4 107,271,567 100,138,682 7,132,885 98.37% 0.313
Total 1 - 4 436,684,083 429,551,198 7,132,885 98.37% 0.373
Southern Zone
(Crux)
1 104,175,012 14,525,279 89,649,733 13.94% 0.519
0.355 0.439
2 89,649,733 32,408,996 57,240,736 45.05% 0.393
3 57,240,736 46,522,188 10,718,549 89.71% 0.314
4 10,718,549 10,659,161 59,388 99.94% 0.275
Total 1 - 4 104,175,012 104,115,624 59,388 99.94% 0.363
Total Out 1 7,644,982,531 2,802,302,815 4,842,679,716 36.66% 0.068 0.068 0.077
The percentage of estimated tonnages in the first 3 passes was 75.4% and 89.7% for the Northern
and Sothern zones respectively, which was reasonable. Total estimated tonnage percentages in all
passes amounted to 98.4 and 99.9% for the mineralized zones respectively.
The total percentage of tonnage estimated outside the mineralized envelopes amounted to 36.7%.
The cumulative average grade of blocks estimated in successive kriging passes decreased due to
clustering. However, for the northern sector, the mean grade of blocks estimated in the first three
kriging passes (0.359 g/t) lied within the declustered mean range. This was true for blocks estimated
in the first two kriging passes of the southern sector.
14.7 Validations
A series of block model validations were carried out. Details are as follow:
Global Bias
Block grades were estimated using ordinary kriging in four passes. Further, declustered means
obtained by nearest neighbour (NN) estimates were calculated. Global bias was assessed by
comparing the means of the two estimates mentioned above. This validation was carried out within
and outside the northern and southern mineralized envelopes.

Atacama Pacific Gold Corporation Page 86 Cerro Maricunga Oxide Gold Project Preliminary Economic Assessment
Drift Analysis
Drift analyses were carried out only for measured plus indicated resources by comparing the average
kriging estimated block grades against the average nearest neighbor estimates along 50-m slices in
the X, Y and Z directions. These analyses were carried out for the North and South sectors.
The results from the drift analysis showed that kriging estimates have very similar behavior to the
declustered or nearest neighbor estimates, as both curves follow very similar trends and therefore,
results can be considered satisfactory.
Graphic Validation
Four cross sections were prepared in order to compare block estimates against drillhole sample
grades. One section was chosen for each of the following zones: Lynx, Phoenix, Phoenix plus Pollux,
and Crux. Generally, higher and lower grade intervals from drill holes were well reproduced in the
block model. Results were considered satisfactory.
14.8 Specific Gravity Model
A total of 391 10-cm core specimens were tested for specific gravity via the wax coated method. All
core specimens were photographed and described in detail for future use.
Statistics and distribution of specific gravity determinations are shown in Table 37 and Figure 25.
Table 37 Statistics – Specific Gravity Determinations
ZONE SPECIFIC GRAVITY DETERMINATIONS
N° Specimens Mean Minimum Maximum STD
Lynx 92 2.38 1.95 2.69 0.18
Phoenix 189 2.44 2.05 2.72 0.13
Crux 110 2.46 2.13 2.69 0.13
Total 391 2.43 1.95 2.72 0.15

Atacama Pacific Gold Corporation Page 87 Cerro Maricunga Oxide Gold Project Preliminary Economic Assessment
Figure 25 Distribution of Specific Gravity Values (North=1, Central=2, South=3)
Estimation parameters used for specific gravity are shown in Table 38. General considerations are:
Specific Gravity was estimated using Inverse Distance Squared.
Specific gravity was estimated for each group with two passes.
Flat ellipsoids were used in order to avoid vertical drift.
Table 38 Specific Gravity Estimation Plan
ESTIMATION PLAN SPECIFIC GRAVITY - INVERSE DISTANCE SQUARED
ZONE Code Profile-ID Search Radii N° of Samples
X Y Z Min Max
Lynx-Phoenix-Pollux 1, 2,4 DENS124_1 200 200 100 1 12
DENS124_2 1000 1000 1000 1 8
Crux 3 DENS3_1 200 200 100 1 12
DENS3_2 1000 1000 1000 1 8
Out 5 Global mean assigned for dilution purposes: SG = 2.439
14.9 Resource Categorization
Resource categorization consists of assigning categories of Measured, Indicated and Inferred to the
estimated blocks within the block model. Denser drilling grids are associated with more reliable
category (Measured) and very sparse drilling grids will generate blocks that will be classified as
Inferred.
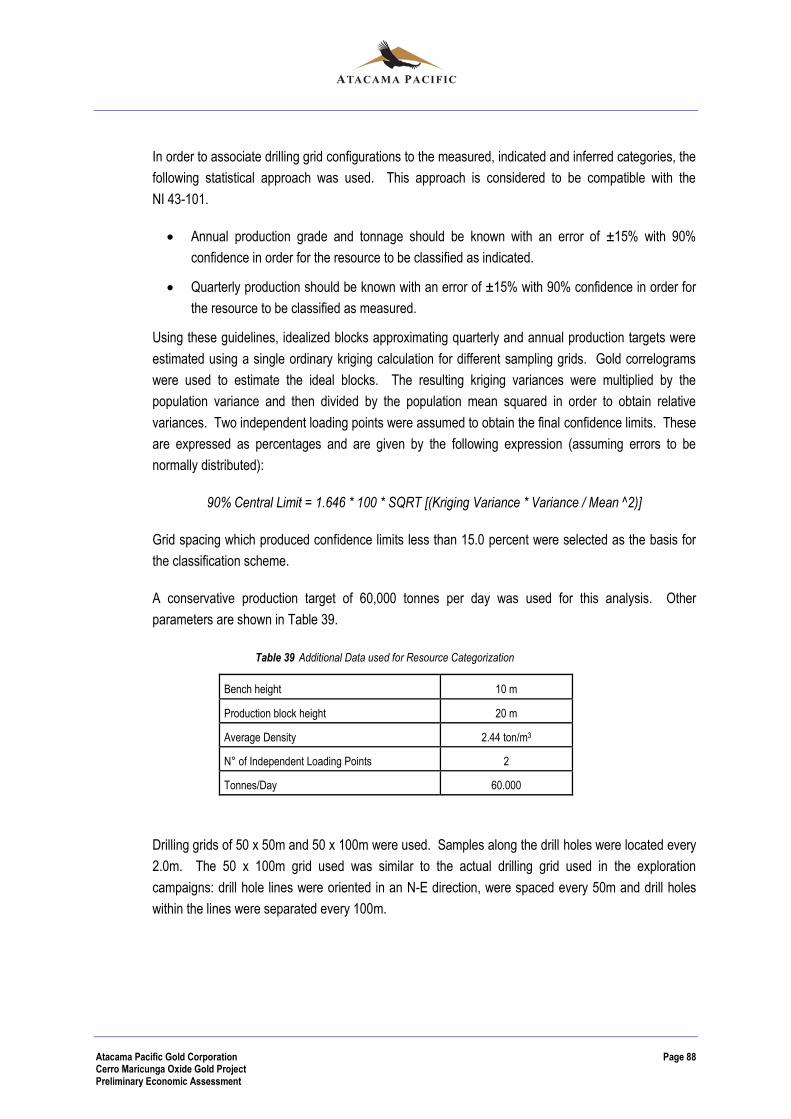
Atacama Pacific Gold Corporation Page 88 Cerro Maricunga Oxide Gold Project Preliminary Economic Assessment
In order to associate drilling grid configurations to the measured, indicated and inferred categories, the
following statistical approach was used. This approach is considered to be compatible with the
NI 43-101.
Annual production grade and tonnage should be known with an error of ±15% with 90%
confidence in order for the resource to be classified as indicated.
Quarterly production should be known with an error of ±15% with 90% confidence in order for
the resource to be classified as measured.
Using these guidelines, idealized blocks approximating quarterly and annual production targets were
estimated using a single ordinary kriging calculation for different sampling grids. Gold correlograms
were used to estimate the ideal blocks. The resulting kriging variances were multiplied by the
population variance and then divided by the population mean squared in order to obtain relative
variances. Two independent loading points were assumed to obtain the final confidence limits. These
are expressed as percentages and are given by the following expression (assuming errors to be
normally distributed):
90% Central Limit = 1.646 * 100 * SQRT [(Kriging Variance * Variance / Mean ^2)]
Grid spacing which produced confidence limits less than 15.0 percent were selected as the basis for
the classification scheme.
A conservative production target of 60,000 tonnes per day was used for this analysis. Other
parameters are shown in Table 39.
Table 39 Additional Data used for Resource Categorization
Bench height 10 m
Production block height 20 m
Average Density 2.44 ton/m3
N° of Independent Loading Points 2
Tonnes/Day 60.000
Drilling grids of 50 x 50m and 50 x 100m were used. Samples along the drill holes were located every
2.0m. The 50 x 100m grid used was similar to the actual drilling grid used in the exploration
campaigns: drill hole lines were oriented in an N-E direction, were spaced every 50m and drill holes
within the lines were separated every 100m.
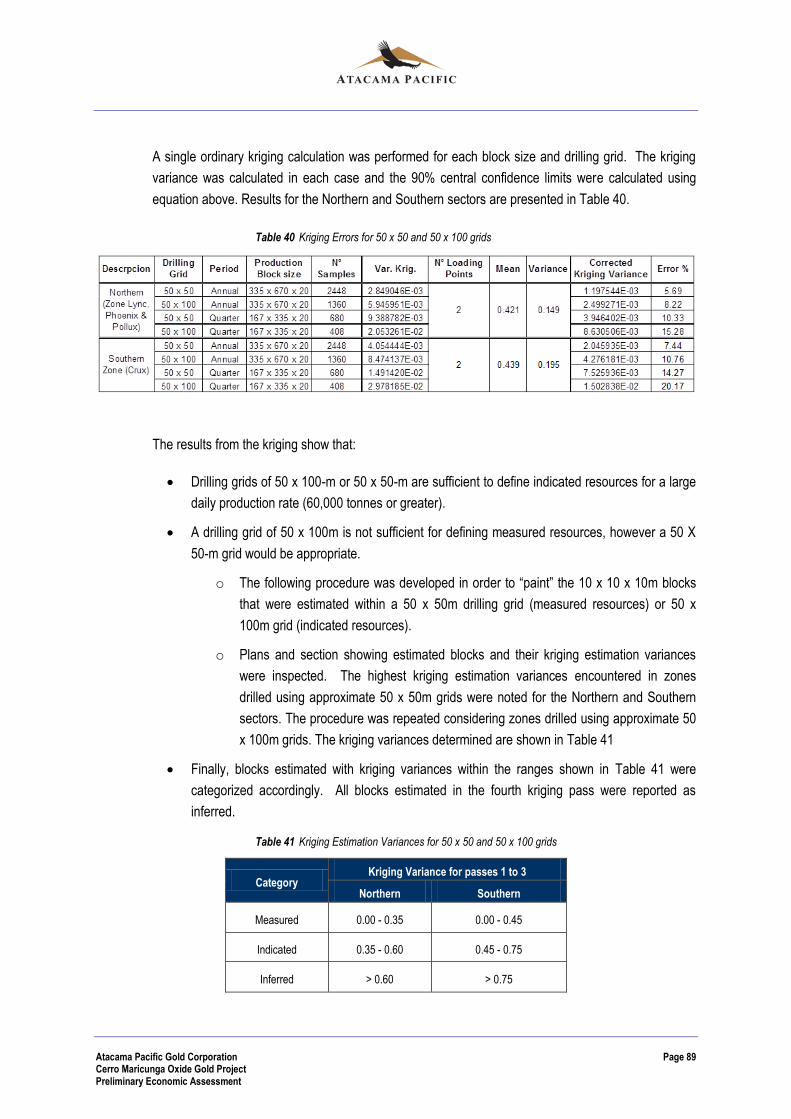
Atacama Pacific Gold Corporation Page 89 Cerro Maricunga Oxide Gold Project Preliminary Economic Assessment
A single ordinary kriging calculation was performed for each block size and drilling grid. The kriging
variance was calculated in each case and the 90% central confidence limits were calculated using
equation above. Results for the Northern and Southern sectors are presented in Table 40.
Table 40 Kriging Errors for 50 x 50 and 50 x 100 grids
The results from the kriging show that:
Drilling grids of 50 x 100-m or 50 x 50-m are sufficient to define indicated resources for a large
daily production rate (60,000 tonnes or greater).
A drilling grid of 50 x 100m is not sufficient for defining measured resources, however a 50 X
50-m grid would be appropriate.
o The following procedure was developed in order to “paint” the 10 x 10 x 10m blocks
that were estimated within a 50 x 50m drilling grid (measured resources) or 50 x
100m grid (indicated resources).
o Plans and section showing estimated blocks and their kriging estimation variances
were inspected. The highest kriging estimation variances encountered in zones
drilled using approximate 50 x 50m grids were noted for the Northern and Southern
sectors. The procedure was repeated considering zones drilled using approximate 50
x 100m grids. The kriging variances determined are shown in Table 41
Finally, blocks estimated with kriging variances within the ranges shown in Table 41 were
categorized accordingly. All blocks estimated in the fourth kriging pass were reported as
inferred.
Table 41 Kriging Estimation Variances for 50 x 50 and 50 x 100 grids
Category Kriging Variance for passes 1 to 3
Northern Southern
Measured 0.00 - 0.35 0.00 - 0.45
Indicated 0.35 - 0.60 0.45 - 0.75
Inferred > 0.60 > 0.75

Atacama Pacific Gold Corporation Page 90 Cerro Maricunga Oxide Gold Project Preliminary Economic Assessment
Results of the resource categorization procedure are shown graphically in four cross sections, shown
in Figure 26 to Figure 29. Yellow coloured blocks represent Measured plus Indicated category
resources and green coloured blocks represent Inferred category resources.
Figure 26 Lynx Resource Categorization Cross Section (2150)
Figure 27 Phoenix Resource Categorization Cross Section (1550)
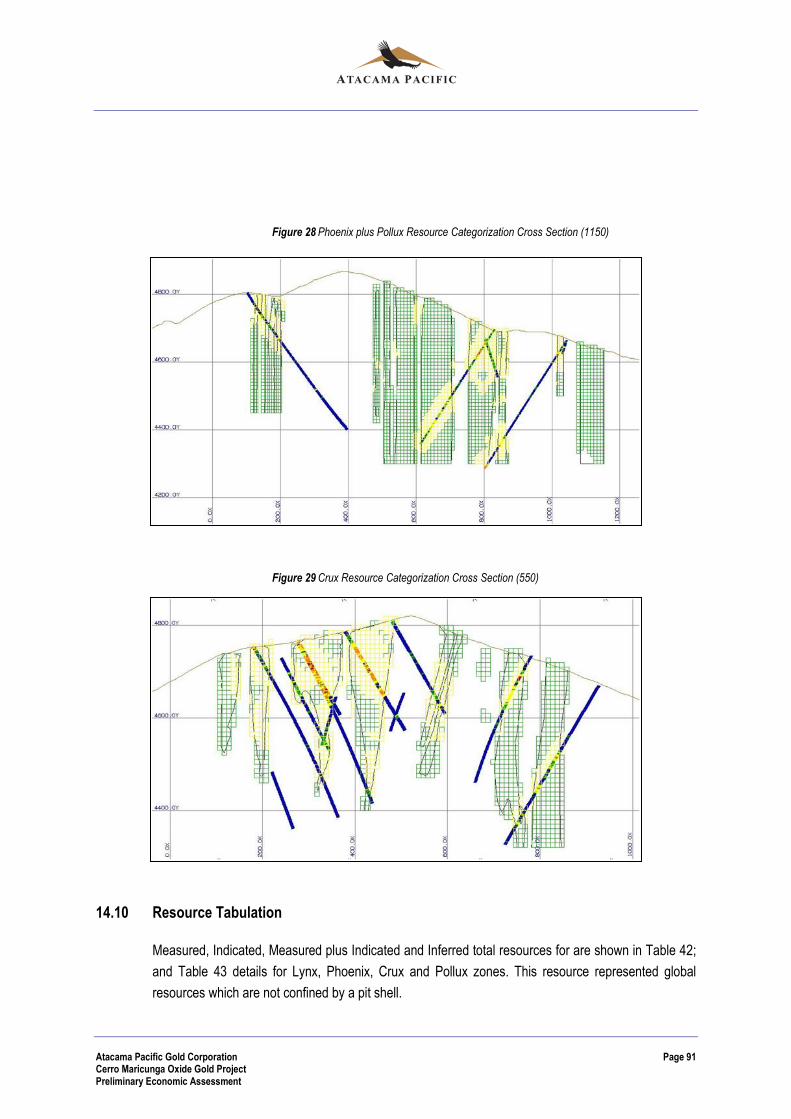
Atacama Pacific Gold Corporation Page 91 Cerro Maricunga Oxide Gold Project Preliminary Economic Assessment
Figure 28 Phoenix plus Pollux Resource Categorization Cross Section (1150)
Figure 29 Crux Resource Categorization Cross Section (550)
14.10 Resource Tabulation
Measured, Indicated, Measured plus Indicated and Inferred total resources for are shown in Table 42;
and Table 43 details for Lynx, Phoenix, Crux and Pollux zones. This resource represented global
resources which are not confined by a pit shell.

Atacama Pacific Gold Corporation Page 92 Cerro Maricunga Oxide Gold Project Preliminary Economic Assessment
Table 42 CerroMaricunga Project – Geological Resources November, 2012 - Summary
Cut-Off Measured Indicated Measured + Indicated Inferred
Au-g/t Mtonnes Au-g/t Moz Mtonnes
Au-g/t Moz Mtonnes
Au-g/t Moz Mtonnes
Au-g/t Moz
0.0 66.6 0.41 0.9 202.6 0.4 2.6 269.2 0.40 3.5 271.6 0.33 2.9
0.1 66.6 0.41 0.9 202.6 0.4 2.6 269.1 0.40 3.5 271.3 0.33 2.9
0.2 60.4 0.44 0.9 187.5 0.41 2.5 247.9 0.42 3.3 226.3 0.36 2.6
0.3 40.7 0.53 0.7 123.1 0.5 2.0 163.9 0.51 2.7 120.7 0.47 1.8
0.4 24.5 0.64 0.5 71.2 0.61 1.4 95.8 0.62 1.9 57.8 0.6 1.1
0.5 15.1 0.77 0.4 42.8 0.72 1.0 57.9 0.73 1.4 32.3 0.73 0.8
0.6 9.9 0.88 0.3 26.3 0.84 0.7 36.3 0.85 1.0 19.7 0.84 0.5
0.7 6.8 1.00 0.2 16.4 0.95 0.5 23.2 0.96 0.7 12.8 0.95 0.4
0.8 4.6 1.12 0.2 10.5 1.07 0.4 15.1 1.09 0.5 8.1 1.06 0.3
Table 43 CerroMaricunga Project – Geological Resources November, 2012 – per Sector
Cut-Off Measured Indicated Measured + Indicated Inferred
Au-g/t Mtonnes Au-g/t
Moz Mtonnes Au-g/t
Moz Mtonnes Au-g/t
Moz Mtonnes Au-g/t
Moz
LYNX
0.0 14.6 0.45 0.2 48.8 0.43 0.7 63.4 0.43 0.9 45.4 0.37 0.5
0.1 14.6 0.45 0.2 48.8 0.43 0.7 63.4 0.43 0.9 45.4 0.37 0.5
0.2 13.5 0.47 0.2 45.6 0.45 0.7 59.1 0.45 0.9 40.2 0.39 0.5
0.3 9.1 0.58 0.2 30.8 0.55 0.5 39.8 0.56 0.7 19.6 0.54 0.3
0.4 5.8 0.71 0.1 19.9 0.66 0.4 25.7 0.67 0.6 11.5 0.69 0.3
0.5 4.0 0.83 0.1 13.5 0.76 0.3 17.6 0.78 0.4 8.0 0.8 0.2
0.6 3.0 0.92 0.1 9.0 0.86 0.2 12.0 0.87 0.3 6.0 0.88 0.2
0.7 2.2 1.03 0.1 5.9 0.97 0.2 8.1 0.99 0.3 4.5 0.96 0.1
0.8 1.5 1.15 0.1 3.9 1.1 0.1 5.4 1.11 0.2 2.7 1.09 0.1
PHOENIX
0.0 32.4 0.40 0.4 92.3 0.4 1.2 124.7 0.40 1.6 96.4 0.35 1.1
0.1 32.4 0.40 0.4 92.3 0.4 1.2 124.7 0.40 1.6 96.3 0.35 1.1
0.2 29.8 0.42 0.4 86.5 0.41 1.1 116.3 0.41 1.5 85.5 0.37 1.0
0.3 20.2 0.50 0.3 57.6 0.49 0.9 77.7 0.49 1.2 52.8 0.45 0.8
0.4 12.0 0.61 0.2 33.5 0.6 0.6 45.5 0.60 0.9 22.6 0.6 0.4
0.5 7.1 0.73 0.2 19.5 0.7 0.4 26.5 0.71 0.6 12.4 0.72 0.3
0.6 4.4 0.84 0.1 11.8 0.81 0.3 16.2 0.82 0.4 8.1 0.81 0.2
0.7 2.9 0.95 0.1 7.0 0.92 0.2 9.9 0.93 0.3 5.0 0.92 0.1
0.8 1.8 1.06 0.1 4.3 1.03 0.1 6.1 1.04 0.2 3.1 1.03 0.1
CRUX
0.0 14.4 0.42 0.2 44.5 0.38 0.5 58.9 0.39 0.7 45.3 0.33 0.5
0.1 14.4 0.42 0.2 44.5 0.38 0.5 58.8 0.39 0.7 45.0 0.33 0.5
0.2 12.8 0.45 0.2 41.3 0.4 0.5 54.1 0.41 0.7 38.2 0.36 0.4
0.3 8.8 0.54 0.2 26.5 0.48 0.4 35.3 0.49 0.6 19.6 0.46 0.3
0.4 5.5 0.66 0.1 13.9 0.6 0.3 19.4 0.62 0.4 9.8 0.59 0.2
0.5 3.4 0.79 0.1 7.6 0.73 0.2 10.9 0.75 0.3 5.0 0.73 0.1
0.6 2.1 0.92 0.1 4.2 0.88 0.1 6.4 0.89 0.2 2.6 0.9 0.1
0.7 1.4 1.06 0.0 2.7 1.01 0.1 4.1 1.03 0.1 1.7 1.04 0.1
0.8 1.0 1.18 0.0 1.8 1.13 0.1 2.9 1.15 0.1 1.2 1.15 0.0
POLLUX
0.0 5.2 0.35 0.1 17.0 0.34 0.2 22.2 0.34 0.2 84.6 0.3 0.8
0.1 5.2 0.35 0.1 17.0 0.34 0.2 22.2 0.34 0.2 84.6 0.3 0.8
0.2 4.3 0.38 0.1 14.1 0.37 0.2 18.4 0.37 0.2 62.4 0.34 0.7
0.3 2.7 0.46 0.0 8.3 0.46 0.1 11.0 0.46 0.2 28.8 0.44 0.4
0.4 1.3 0.60 0.0 3.9 0.58 0.1 5.2 0.58 0.1 13.9 0.55 0.2
0.5 0.7 0.73 0.0 2.2 0.69 0.0 2.9 0.70 0.1 7.0 0.65 0.1
0.6 0.4 0.84 0.0 1.2 0.81 0.0 1.7 0.82 0.0 3.0 0.79 0.1
0.7 0.3 0.93 0.0 0.8 0.9 0.0 1.1 0.91 0.0 1.7 0.9 0.0
0.8 0.2 1.01 0.0 0.6 0.95 0.0 0.8 0.97 0.0 1.1 1.0 0.0

Atacama Pacific Gold Corporation Page 93 Cerro Maricunga Oxide Gold Project Preliminary Economic Assessment
Table 44, below, presents the resource estimate which includes those resources, which lie within the
boundary of a conceptual open pit designed at an average gold price of $1,400 using the mining and
processing parameters and associated costs outlined in this PEA. The pit constrained resource
estimate was determined using the Whittle Four-X model and carried out using Gems software (see
Section 16.3 for further details). The cut off grade determined by the Whittle Four-X model resource is
variable at 0.18 g/t Au up to the third year and at 0.15 g/t Au from year 4 to the end of the proposed
mine life. The pit constrained resource estimate was based upon the resource estimate presented
Table 42 and Table 43.
The pit constrained resource estimate includes approximately 75% of the Measured and Indicated and
33% Inferred resources from the global unconstrained resource estimate at a 0.2 g/t Au cut off grade.
Table 44 Cerro Maricunga Oxide Gold Project Pit Constrained Resource Estimate
Constrained at $1,400/oz Au Tonnes Grade Gold Ounces
(millions) (g/t Au) (Oz ‘000)
Measured 48.6 0.43 668
Indicated 137.1 0.41 1,791
Measured and Indicated 185.8 0.41 2,460
Inferred 75.4 0.39 938
Atacama Pacific Gold Corporation Page 94 Cerro Maricunga Oxide Gold Project Preliminary Economic Assessment
15. MINERAL RESERVES ESTIMATE
The mineral resources at Cerro Maricunga have not been proven to a mineral reserve level at the
stage of writing this study.

Atacama Pacific Gold Corporation Page 95 Cerro Maricunga Oxide Gold Project Preliminary Economic Assessment
16. MINING METHODS
16.1 Summary
The mineral resource estimate for Cerro Maricunga, established in Atacama Pacific’s NI 43-101
compliant technical report dated November 9, 2012 which includes Measured, Indicated and Inferred
category mineral resources, forms the basis for this Preliminary Economic Assessment.
The reader is cautioned that the mining study is part of a preliminary economic assessment that is
preliminary in nature and includes Inferred mineral resources that are considered too speculative
geologically to have the economic considerations applied to them that would enable them to be
categorized as mineral reserves. There is no certainty that the preliminary economic assessment will
be realized. No Mineral Reserves have been estimated.
This study is categorised as a Preliminary Economic Assessment (PEA).
A mine plan was developed for Cerro Maricunga Oxide Gold Project to process 80,000 tpd of resource
material, as defined by the base case. The total required material movement was determined to
average 84.55 million tonnes per year for the first 5 years of the mine. The mine plan assumes run of
mine (ROM) is transported by haul trucks to the selected location for the primary crusher, located to
the immediate west of the Lynx zone, and to selected waste storage facilities. The mine is scheduled
to work seven days per week and 350 days per year (considering 15 days of weather delays). Each
day will consist of two 12-hour shifts. Four mining crews will cover the operation. Included in these
operations will be normal drilling, blasting, loading and hauling activities, as well as the supporting
functions of dewatering, grade control and equipment maintenance.
The study is based on operating the proposed Cerro Maricunga mine with hydraulic excavators of 38
cubic yards capacity and 290t haul trucks in 10 metre benches.
16.2 Geotechnical Studies
Atacama Pacific has engaged AKL Ingeniería & Geomecánica Ltda (AKL), a Chilean geotechnical
consultancy company, based in Santiago (www.akl.cl ), to carry out a geotechnical evaluation for the
designs of the pits.
The basis for this study was the collation and analysis of data by AKL professionals. A geotechnical
mapping was carried out of four partial drillholes and a review of the drillholes photographs database.
The results of these analysis enable AKL to classify the rock mass as “fairly good” to “good” and a
rock mass rating (RMR) of 55 to 65.
AKL recommendation for pit design is as follows:
Overall slope angle : 45° (42° used by NCL for modelling)
Atacama Pacific Gold Corporation Page 96 Cerro Maricunga Oxide Gold Project Preliminary Economic Assessment
Inter-ramp angle : 48°
Inter-ramp height : 160m
Bench height : 10m or more
Safety berm width : 30m.
All of the above parameters should be validated during the next stage of development of the studies.
16.3 Pit Optimization and Mine Design
Whittle Four-X pit optimization software was applied in conjunction with Gems for the mining model
preparation and pit optimization runs.
The economic parameters assume a nominal 29.2 million tonnes per year treatment plant throughput
rate.
16.3.1 Whittle Pit Optimization Model Construction
The mineral resource model was provided to NCL by Atacama Pacific and corresponds to November
9, 2012 mineral resource estimate, in the form of a Gems block model. Each block contains
information for gold, density, percentage within the mineralised zone and category.
NCL developed a diluted block model for pit optimization and mine planning purposes. The waste
portion of the blocks was estimated with the drill-holes gold grades outsides the mineralized zones,
and used to dilute the mineralized estimated material. The result at the calculated cut-off of 0.15 g/t Au
is an increase of 7.7% of the tonnage, 92.5% of the grade and consequently a 0.3% less contained
gold. Table 45 shows the tonnage/grade distribution for both models, in-situ and diluted.
The Whittle Four-X model development was carried out using Gems software. Whittle Four-X uses the
amount of metal in a block for assessment, rather than the block’s grade value. The process
calculates the grade from the supplied tonnage and metal content, which are provided for each model
block. The metal content for each block is calculated using the grade derived from the diluted model.

Atacama Pacific Gold Corporation Page 97 Cerro Maricunga Oxide Gold Project Preliminary Economic Assessment
Table 45 Tonnage/Grade for In-Situ and Diluted Models
Cut-Off
In situ Block Model Diluted Block Model Dilution
Mineralized Material Contained gold Mineralized Material Contained gold tonnes grade contained gold
g/t Au Mt g/t Au Moz Mt g/t Au Moz
1.00 9.1 1.33 0.4 10.1 1.33 0.4 -10.1% 100.1% -10.0%
0.50 82.4 0.73 1.9 90.0 0.73 2.1 -8.4% 99.7% -8.7%
0.30 259.1 0.49 4.1 283.8 0.49 4.5 -8.7% 100.0% -8.8%
0.25 351.8 0.43 4.9 380.0 0.44 5.3 -7.4% 99.4% -7.9%
0.24 371.1 0.42 5.0 398.1 0.43 5.5 -6.8% 99.2% -7.6%
0.23 392.0 0.41 5.2 417.4 0.42 5.6 -6.1% 98.9% -7.2%
0.22 413.5 0.40 5.4 436.3 0.41 5.7 -5.2% 98.5% -6.7%
0.21 437.1 0.39 5.5 456.5 0.40 5.9 -4.3% 98.1% -6.1%
0.20 459.5 0.38 5.7 473.5 0.39 6.0 -3.0% 97.5% -5.4%
0.19 481.6 0.38 5.8 488.9 0.39 6.1 -1.5% 96.8% -4.6%
0.18 506.6 0.37 6.0 505.9 0.38 6.2 0.1% 96.1% -3.8%
0.15 575.3 0.34 6.3 534.0 0.37 6.3 7.7% 92.5% -0.3%
0.10 673.4 0.31 6.7 540.4 0.37 6.4 24.6% 84.6% 5.5%
0.00 728.8 0.29 6.9 540.9 0.37 6.4 34.7% 79.9% 7.6%
16.3.2 Base Parameters
Table 46 summarises the Base Case economic parameters used for Whittle Four-X economic shells
analysis and mine design.
The mining cost estimate for the pit optimization process is based on recent figures used by NCL for
other similar mining studies, also in Chile. The difference between waste and mineralized material
mining cost is because the primary crusher is planned to be located close to mine exit.
Table 46 Initial Lerch-Grossman Optimization Parameters
Mining Cost
Mineralized material US$/t 1.40
Waste US$/t 1.80
Processing Cost US$/t 3.0
Metallurgical Recovery % 81
Selling Cost US$/oz 300
Minimum cut-off g/t Au 0.18
Overall slope angle º 42
Gold price US$/oz 1,400
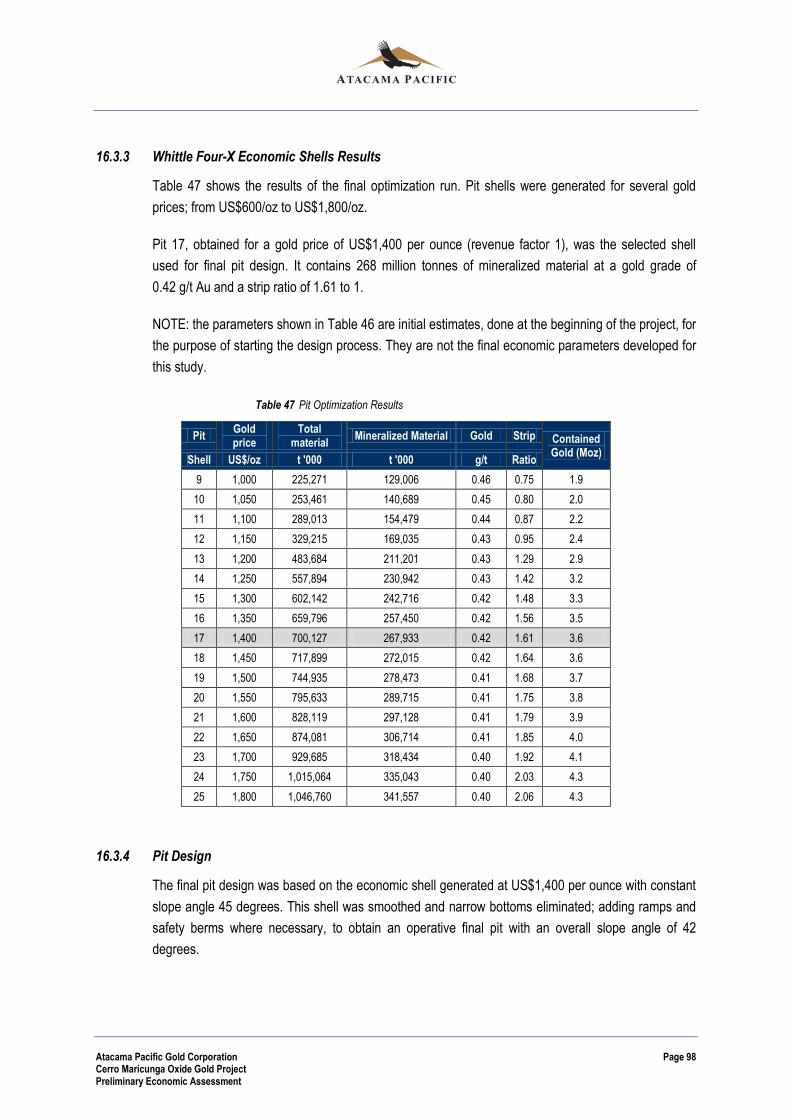
Atacama Pacific Gold Corporation Page 98 Cerro Maricunga Oxide Gold Project Preliminary Economic Assessment
16.3.3 Whittle Four-X Economic Shells Results
Table 47 shows the results of the final optimization run. Pit shells were generated for several gold
prices; from US$600/oz to US$1,800/oz.
Pit 17, obtained for a gold price of US$1,400 per ounce (revenue factor 1), was the selected shell
used for final pit design. It contains 268 million tonnes of mineralized material at a gold grade of
0.42 g/t Au and a strip ratio of 1.61 to 1.
NOTE: the parameters shown in Table 46 are initial estimates, done at the beginning of the project, for
the purpose of starting the design process. They are not the final economic parameters developed for
this study.
Table 47 Pit Optimization Results
Pit Gold price
Total material
Mineralized Material Gold Strip Contained Gold (Moz)
Shell US$/oz t '000 t '000 g/t Ratio
9 1,000 225,271 129,006 0.46 0.75 1.9
10 1,050 253,461 140,689 0.45 0.80 2.0
11 1,100 289,013 154,479 0.44 0.87 2.2
12 1,150 329,215 169,035 0.43 0.95 2.4
13 1,200 483,684 211,201 0.43 1.29 2.9
14 1,250 557,894 230,942 0.43 1.42 3.2
15 1,300 602,142 242,716 0.42 1.48 3.3
16 1,350 659,796 257,450 0.42 1.56 3.5
17 1,400 700,127 267,933 0.42 1.61 3.6
18 1,450 717,899 272,015 0.42 1.64 3.6
19 1,500 744,935 278,473 0.41 1.68 3.7
20 1,550 795,633 289,715 0.41 1.75 3.8
21 1,600 828,119 297,128 0.41 1.79 3.9
22 1,650 874,081 306,714 0.41 1.85 4.0
23 1,700 929,685 318,434 0.40 1.92 4.1
24 1,750 1,015,064 335,043 0.40 2.03 4.3
25 1,800 1,046,760 341,557 0.40 2.06 4.3
16.3.4 Pit Design
The final pit design was based on the economic shell generated at US$1,400 per ounce with constant
slope angle 45 degrees. This shell was smoothed and narrow bottoms eliminated; adding ramps and
safety berms where necessary, to obtain an operative final pit with an overall slope angle of 42
degrees.

Atacama Pacific Gold Corporation Page 99 Cerro Maricunga Oxide Gold Project Preliminary Economic Assessment
Figure 30 shows the final pit design. There are planned three exits on the west of the pit which give
accesses to the primary crusher and to the waste storage areas. From the top level, at 4980mRL,
down to 4610mRL the pit has accesses directly from topography (no ramping needed).
The final pit is 2500m long in the south-east north-west direction and up to 800m wide in the north-
east south-west direction. Four pit bottoms can be identified, from north to south at 4490mRL,
4470mRL, 4530mRL and 4540mRL. The highest wall is about 400 metres on the south side of the
central pit. The total area disturbed by the pit is about 167 hectares.
Figure 30 Final Pit Design
Mining Phases
NCL designed a set of 9 mining phases, or pushbacks, by analysing the Whittle Four-X series of
nested shells. Pit Bottoms were selected to project them to surface, applying the slopes
recommendation. Figure 2.1 6 shows the phases outlines on bench 4760, 4710, 4660 and 4610.
0 250m
N
4490
4470
4530
4540

Atacama Pacific Gold Corporation Page 100 Cerro Maricunga Oxide Gold Project Preliminary Economic Assessment
Figure 31 Mining Phases
Pit Constrained Resources
Table 48 summarises the resources contained in the proposed final pit at several different gold cut-off
grades, and Table 49 is for the individual mining phases. The tables include “Inferred”.
Table 48 Total Pit Constrained Mineralization
Cut-off Au (g/t)
Mineralized Material Strip Ratio t '000 Au (g/t)
0.50 59,323 0.75 10.5
0.25 192,779 0.48 2.5
0.18 247,450 0.42 1.8
0.15 268,087 0.40 1.5
0.00 319,022 0.35 1.1
Total Material 683,281 t '000
0 250m
N
F09
F08
F08
F07
F06
F05
F04 F03
F02
F01
Level 4760
0 250m
N
F09
F08F07
F06
F05
F04F03
F02
F01
Level 4710
0 250m
N
F09
F08F07
F06
F04
F03
F01
Level 4660
0 250m
N
F09
F08F07
F06
F04
F03
Level 4610
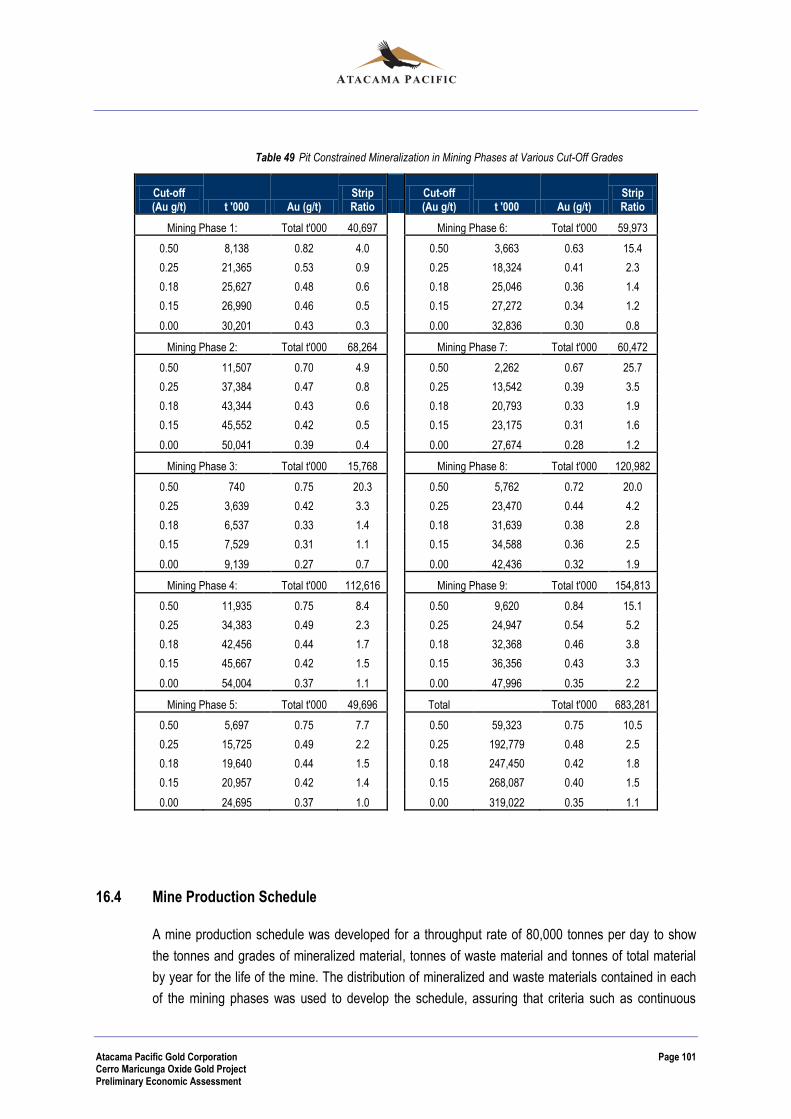
Atacama Pacific Gold Corporation Page 101 Cerro Maricunga Oxide Gold Project Preliminary Economic Assessment
Table 49 Pit Constrained Mineralization in Mining Phases at Various Cut-Off Grades
Cut-off (Au g/t) t '000 Au (g/t)
Strip Ratio
Cut-off (Au g/t) t '000 Au (g/t)
Strip Ratio
Mining Phase 1: Total t'000 40,697 Mining Phase 6: Total t'000 59,973
0.50 8,138 0.82 4.0 0.50 3,663 0.63 15.4
0.25 21,365 0.53 0.9 0.25 18,324 0.41 2.3
0.18 25,627 0.48 0.6 0.18 25,046 0.36 1.4
0.15 26,990 0.46 0.5 0.15 27,272 0.34 1.2
0.00 30,201 0.43 0.3 0.00 32,836 0.30 0.8
Mining Phase 2: Total t'000 68,264 Mining Phase 7: Total t'000 60,472
0.50 11,507 0.70 4.9 0.50 2,262 0.67 25.7
0.25 37,384 0.47 0.8 0.25 13,542 0.39 3.5
0.18 43,344 0.43 0.6 0.18 20,793 0.33 1.9
0.15 45,552 0.42 0.5 0.15 23,175 0.31 1.6
0.00 50,041 0.39 0.4 0.00 27,674 0.28 1.2
Mining Phase 3: Total t'000 15,768 Mining Phase 8: Total t'000 120,982
0.50 740 0.75 20.3 0.50 5,762 0.72 20.0
0.25 3,639 0.42 3.3 0.25 23,470 0.44 4.2
0.18 6,537 0.33 1.4 0.18 31,639 0.38 2.8
0.15 7,529 0.31 1.1 0.15 34,588 0.36 2.5
0.00 9,139 0.27 0.7 0.00 42,436 0.32 1.9
Mining Phase 4: Total t'000 112,616 Mining Phase 9: Total t'000 154,813
0.50 11,935 0.75 8.4 0.50 9,620 0.84 15.1
0.25 34,383 0.49 2.3 0.25 24,947 0.54 5.2
0.18 42,456 0.44 1.7 0.18 32,368 0.46 3.8
0.15 45,667 0.42 1.5 0.15 36,356 0.43 3.3
0.00 54,004 0.37 1.1 0.00 47,996 0.35 2.2
Mining Phase 5: Total t'000 49,696 Total Total t'000 683,281
0.50 5,697 0.75 7.7 0.50 59,323 0.75 10.5
0.25 15,725 0.49 2.2 0.25 192,779 0.48 2.5
0.18 19,640 0.44 1.5 0.18 247,450 0.42 1.8
0.15 20,957 0.42 1.4 0.15 268,087 0.40 1.5
0.00 24,695 0.37 1.0 0.00 319,022 0.35 1.1
16.4 Mine Production Schedule
A mine production schedule was developed for a throughput rate of 80,000 tonnes per day to show
the tonnes and grades of mineralized material, tonnes of waste material and tonnes of total material
by year for the life of the mine. The distribution of mineralized and waste materials contained in each
of the mining phases was used to develop the schedule, assuring that criteria such as continuous
Atacama Pacific Gold Corporation Page 102 Cerro Maricunga Oxide Gold Project Preliminary Economic Assessment
exposure of material to feed the plant, mining accessibility, and consistent material movements were
met.
NCL used an in-house developed system to evaluate several potential mine production schedules.
Required annual tonnes and user specified annual total material movements are provided to the
algorithm, which then calculates the mine schedule. Several runs at various proposed total material
movement schedules and different operating cut-off grades for the year were carried out to determine
an efficient production schedule strategy. It is important to note that this program is not a simulation
package, but a tool for calculation the mine schedule and haulage profiles for a given set of phases
and constraints that must be set by the user.
The mine plans developed by NCL considers a diluted resources block model, including between 1%
and 8% dilution (Table 45).
Operational cut-off grades of 0.18 g/t Au during the first three years and 0.15 g/t Au from year four
were used as a strategy to improve the grade of the plant feed during production.
Table 50 shows the final production schedule and plant feed for each mining year. The schedule is
based on 29.2 million tonnes of ore per year for plant feed. The table also shows the total material
movement from the mine by year, which considers a total maximum mining rate of 84.55 million
tonnes per year. The limit on the production is the number of benches it is possible to mine in a year in
any single phase (sinking rate).
The preproduction period requires the mining of 11.4 million tonnes of total material to expose
sufficient material to provide reliable source for the start of production in Year 1. The preproduction
period will require approximately 12 months to complete, including the construction of initial accesses.
The resource material mined during preproduction will be stockpiled near the crusher to make up part
of Year 1 plant feed.

Atacama Pacific Gold Corporation Page 103 Cerro Maricunga Oxide Gold Project Preliminary Economic Assessment
Table 50 Mine Production Schedule
Year
Mineralized Material Waste Total
Plant Feed
t '000 Au (g/t)
Contained gold (koz)
t '000 t '000
t '000 Au (g/t)
Contained gold (koz)
Average Recovery (%)
Recovered Gold (koz)
Pre-strip 6,624 0.38 81 4,776 11,400
Y1 22,576 0.44 319 27,874 50,450
29,200 0.43 400 79.6% 318
Y2 29,200 0.41 389 55,350 84,550
29,200 0.41 389 79.5% 309
Y3 29,200 0.41 384 55,350 84,550
29,200 0.41 384 79.5% 305
Y4 29,200 0.40 374 55,350 84,550
29,200 0.40 374 79.4% 297
Y5 29,200 0.35 330 55,350 84,550
29,200 0.35 330 79.0% 261
Y6 29,200 0.36 340 55,273 84,473
29,200 0.36 340 79.1% 269
Y7 29,200 0.38 357 49,929 79,129
29,200 0.38 357 79.2% 283
Y8 26,759 0.40 340 41,040 67,799
26,759 0.40 340 79.4% 270
Y9 20,685 0.47 309 18,615 39,300
20,685 0.47 309 80.0% 247
Y10 8,537 0.58 159 3,132 11,670
8,537 0.58 159 81.0% 129
Y11 742 0.66 16 118 860
742 0.66 16 81.7% 13
TOTAL 261,123 0.40 3,397 422,158 683,281
261,123 0.40 3,397 79.5% 2,700
16.5 Waste Storage Area
One waste rock storage area was designed for the Cerro Maricunga Project. The area available for
waste storage is located at the west of the pit. . The east of the pit was excluded to minimize impact of
the mine to the drainage basins.
The total extent of the pile is 2.7km by 1.2km and a maximum height of 315m. The final configuration
is shown on Figure 32.
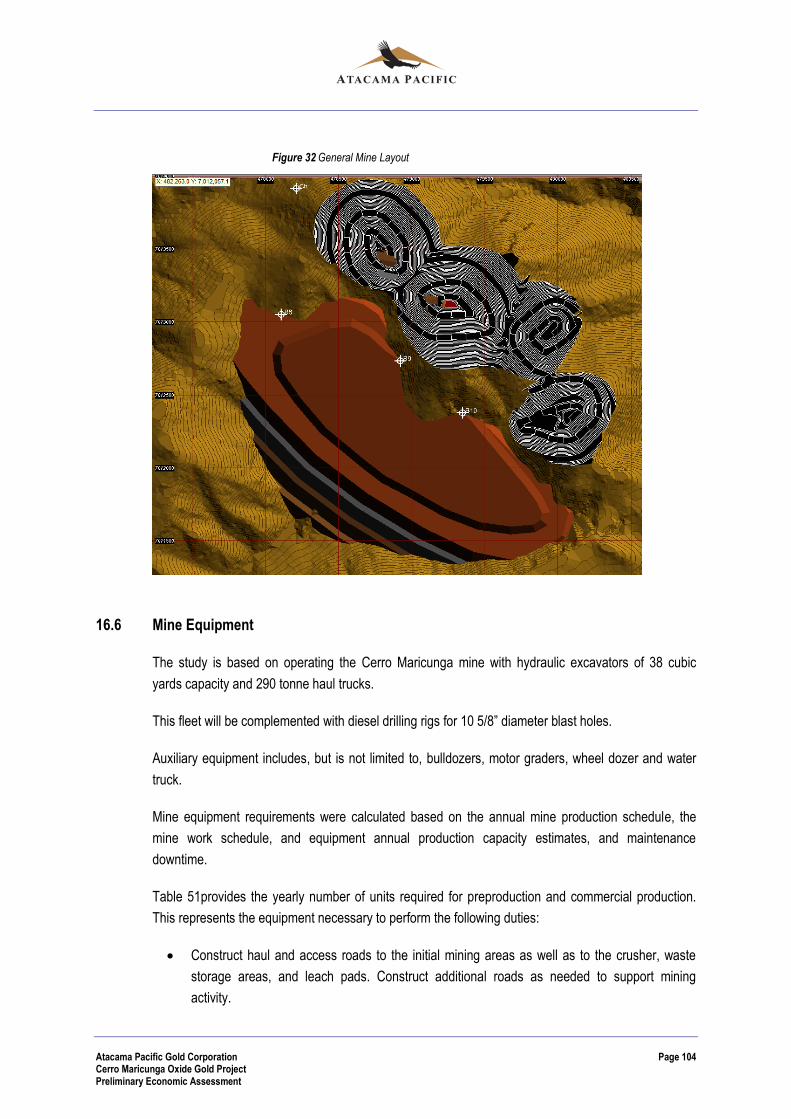
Atacama Pacific Gold Corporation Page 104 Cerro Maricunga Oxide Gold Project Preliminary Economic Assessment
Figure 32 General Mine Layout
16.6 Mine Equipment
The study is based on operating the Cerro Maricunga mine with hydraulic excavators of 38 cubic
yards capacity and 290 tonne haul trucks.
This fleet will be complemented with diesel drilling rigs for 10 5/8” diameter blast holes.
Auxiliary equipment includes, but is not limited to, bulldozers, motor graders, wheel dozer and water
truck.
Mine equipment requirements were calculated based on the annual mine production schedule, the
mine work schedule, and equipment annual production capacity estimates, and maintenance
downtime.
Table 51provides the yearly number of units required for preproduction and commercial production.
This represents the equipment necessary to perform the following duties:
Construct haul and access roads to the initial mining areas as well as to the crusher, waste
storage areas, and leach pads. Construct additional roads as needed to support mining
activity.
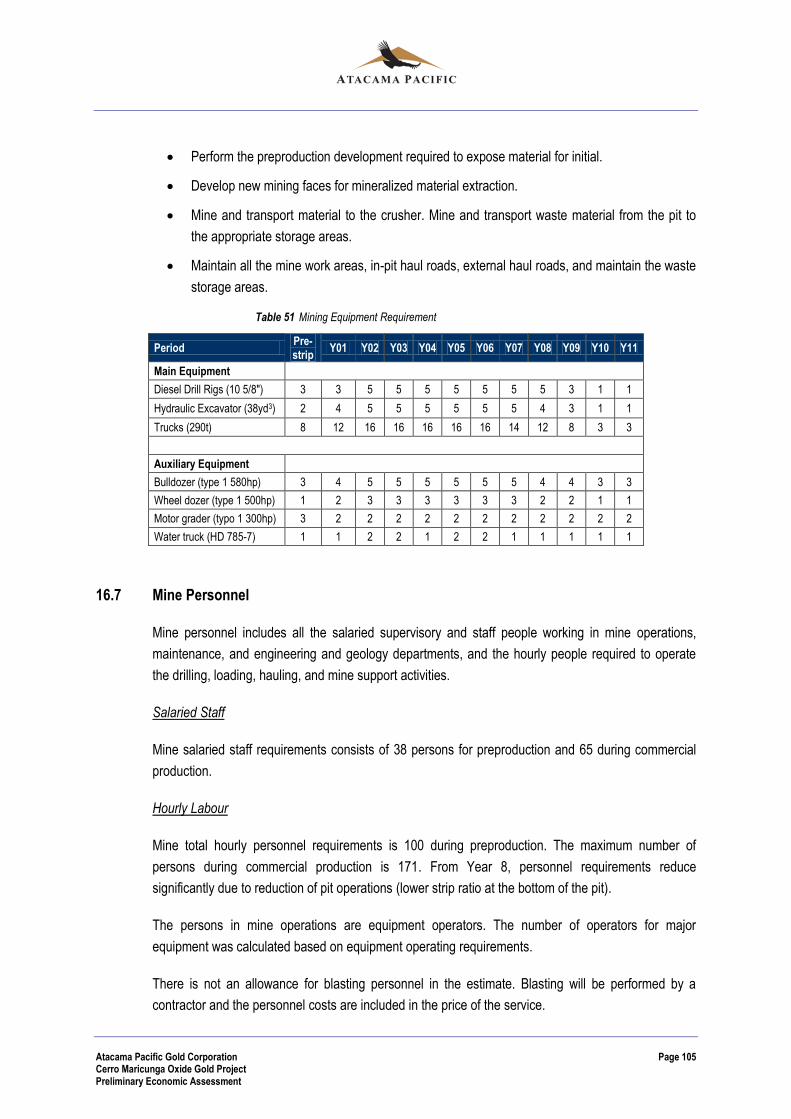
Atacama Pacific Gold Corporation Page 105 Cerro Maricunga Oxide Gold Project Preliminary Economic Assessment
Perform the preproduction development required to expose material for initial.
Develop new mining faces for mineralized material extraction.
Mine and transport material to the crusher. Mine and transport waste material from the pit to
the appropriate storage areas.
Maintain all the mine work areas, in-pit haul roads, external haul roads, and maintain the waste
storage areas.
Table 51 Mining Equipment Requirement
Period Pre-strip
Y01 Y02 Y03 Y04 Y05 Y06 Y07 Y08 Y09 Y10 Y11
Main Equipment
Diesel Drill Rigs (10 5/8") 3 3 5 5 5 5 5 5 5 3 1 1
Hydraulic Excavator (38yd3) 2 4 5 5 5 5 5 5 4 3 1 1
Trucks (290t) 8 12 16 16 16 16 16 14 12 8 3 3
Auxiliary Equipment
Bulldozer (type 1 580hp) 3 4 5 5 5 5 5 5 4 4 3 3
Wheel dozer (type 1 500hp) 1 2 3 3 3 3 3 3 2 2 1 1
Motor grader (typo 1 300hp) 3 2 2 2 2 2 2 2 2 2 2 2
Water truck (HD 785-7) 1 1 2 2 1 2 2 1 1 1 1 1
16.7 Mine Personnel
Mine personnel includes all the salaried supervisory and staff people working in mine operations,
maintenance, and engineering and geology departments, and the hourly people required to operate
the drilling, loading, hauling, and mine support activities.
Salaried Staff
Mine salaried staff requirements consists of 38 persons for preproduction and 65 during commercial
production.
Hourly Labour
Mine total hourly personnel requirements is 100 during preproduction. The maximum number of
persons during commercial production is 171. From Year 8, personnel requirements reduce
significantly due to reduction of pit operations (lower strip ratio at the bottom of the pit).
The persons in mine operations are equipment operators. The number of operators for major
equipment was calculated based on equipment operating requirements.
There is not an allowance for blasting personnel in the estimate. Blasting will be performed by a
contractor and the personnel costs are included in the price of the service.

Atacama Pacific Gold Corporation Page 106 Cerro Maricunga Oxide Gold Project Preliminary Economic Assessment
There is not an allowance for maintenance personnel in the estimate. Maintenance will be performed
by a contractor in MARC basis and the personnel costs are included in the hourly cost of the service.

Atacama Pacific Gold Corporation Page 107 Cerro Maricunga Oxide Gold Project Preliminary Economic Assessment
17. MINERAL PROCESSING AND RECOVERY METHODS
The proposed processing operation is designed for a nominal throughput of 80,000 tpd with an average
head grade of 0.4 g/t of Au. Resources are estimated about 261 Mt, given 10.1 years of project life.
It is considered that 80.3% of the gold will be recovered through heap cyanidation. The recovery for the
EW and smelting stages is considered to be 99.5% (overall recovery of 79.5% to payable gold).
The final product of the process plant corresponds to dore bullion, with at least 80% of gold content.
All the stages comprised in the process plant will be described in the following sections, according to:
Crushing
Heap leaching
Solution management
ADR, EW and smelting
Figure 33 shows a general diagram of the selected process. Figure 34 shows a flowsheet of the
crushing stage. Figure 35 shows the plot plan of the project.
17.1 Primary Crushing and Coarse Stockpile
The plan is for the mineralized material from the mine to be transported by truck to the primary crushing
facility where will be unloaded into the dump pocket. The material will then reclaimed by an apron
feeder and a vibrating grizzly. The grizzly oversize feeds a 60” x 89” gyratory crusher (600 kW, open
side setting 165 mm - 6.5”). Crushed mineral size (P80) is estimated to be 128 mm. A rock breaker will
be available to break oversize fragments.
The crusher discharge and the grizzly undersize will be transported by a belt conveyor to the covered
coarse material stockpile (60,000 live tons, equivalent to 18 hours).
The primary crushing facility considers a dust management system by suppression and collection.
Suppression consists of wetting the generated dust with specially-designed spray nozzles, avoiding its
suspension in the atmosphere, and thus keeping it in the process. Collection consists of gathering the
generated dust through a bag filter system then sending it to a wet process.
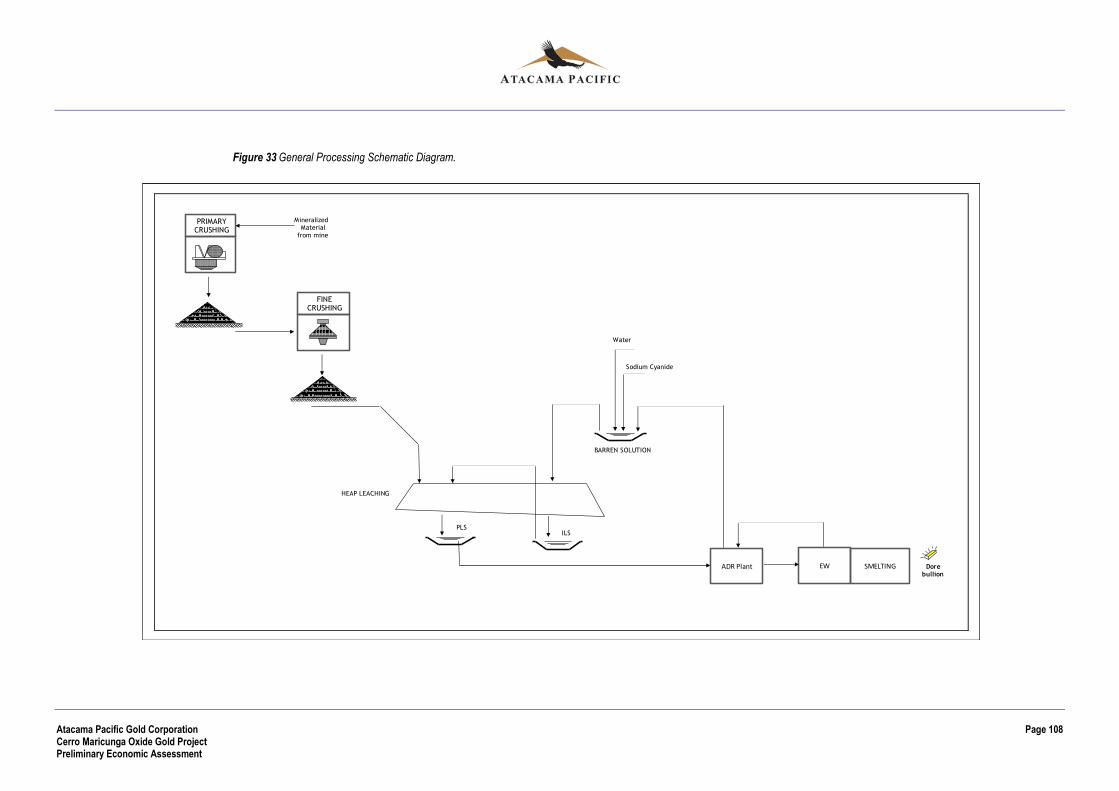
Atacama Pacific Gold Corporation Page 108 Cerro Maricunga Oxide Gold Project Preliminary Economic Assessment
Figure 33 General Processing Schematic Diagram.
PRIMARY CRUSHING
FINE CRUSHING
ILSPLS
BARREN SOLUTION
ADR Plant EW Dore bullion
SMELTING
Water
Sodium Cyanide
HEAP LEACHING
MineralizedMaterial
from mine

Atacama Pacific Gold Corporation Page 109 Cerro Maricunga Oxide Gold Project Preliminary Economic Assessment
Figure 34 Schematic Diagram (Crushing Stage)
Main Equipment
Item Number Description Power HP Comments
Aa 1 600
Ab 1
Ac 3 100
Ad 3 1,000 Heavy Duty
Ae 3 100
Af 3 1,000 Heavy Duty
Ag 1 Covered Fines Stockpile 40 kt
Gyratory Crusher
Covered Coarse Stockpile 60 kt
Banana Sreener Double Deck 12' x 24'
Cone crusher type MP1000
Banana Sreener Double Deck 12' x 24'
Cone crusher type MP1000
Secondary Crushing
Mineralized Material
from Mine
To Heap Leaching
PrimaryCrushing
TertiaryCrushing
Aa
Ab
Ad Ad Ad
Af Af Af
AcAcAc
Ae Ae Ae
Ag

Atacama Pacific Gold Corporation Page 110 Cerro Maricunga Oxide Gold Project Preliminary Economic Assessment
Figure 35 Plan of the Processing Operations
Atacama Pacific Gold Corporation Page 111 Cerro Maricunga Oxide Gold Project Preliminary Economic Assessment
17.2 Secondary and Tertiary Crushing
The mineralized material will be reclaimed from the coarse material stockpile and feeds three (3)
secondary crushing banana screens (12’ x 24’, double deck, 75 kW each). The screen oversize is sent
to three (3) secondary cone crushers (type MP1000, 750 kW each), operating in open circuit. The
product of the secondary crushers will be conveyed towards intermediate bins.
Tertiary banana screens (12’ x 24’, double deck, 75 kW each) are fed from the bins. The screen
oversize is sent to three (3) tertiary cone crushers (type MP1000, 750 kW each), also operating in open
circuit. A belt conveyor collects the undersize of the secondary and tertiary screens, and the product of
the tertiary crushers, transporting them towards the fine material stockpile (40,000 live tons, equivalent
to 12 hours).
The crushing product final size (P80) will planned to be 19 mm.
The secondary and tertiary crushing facility shall also include a dust collection system. All equipment is
enclosed.
17.3 Heap Leaching
The P80 19mm crushed material will be sent to the heap leaching area, through a conveying system, to
build the heap modules. The material will be firstly fed to a tripper located on one side of the heap; the
tripper discharges the material into successive grasshoppers, which in turn transport the material to a
radial stacker, whose purpose is to build the heap. At the same time that the radial stacker moves the
heap forward, the piping that goes under the heap is being connected.
Prior to material stacking, the place where the heap will be located is modified to achieve the heap
stability grade, prepared, and covered by a geomembrane. Every five layers, a new waterproof
membrane is planned. The final heap height will be approximately 100 meters. The total estimated area
of the leach pad will be 2.7 million m2, which should allow the leaching of about 270 million ton of
mineralized material.
The heap operation starts with the irrigation of the material; for Cerro Maricunga, a twostage drip
irrigation has been considered, according to which solution is used: barren solution (“BLS”) or
IIntermediate Leaching Solution (“ILS”). An irrigation rate of 10 l/h/m2 has been considered, with an
evaporation rate of 8 l/d/m2 for the heap and 4 l/d/m2 for the process ponds.
Both solutions in the mineral leaching – the pregnant leaching solution (“PLS”) and ILS - percolate
through the heap and are collected in their respective ponds. The BLS, PLS and ILS ponds have a
residence time of 5 hours, each. An emergency pond has also been contemplated, with a residence
time of 2 days. The emergency pond is located next to the PLS pond.
The PLS contains the gold dissolved from the mineralized material. The PLS is pumped from the PLS
pond to the ADR plant.
Figure 36 shows a general view of the heap leaching area, including heaps and ponds.

Atacama Pacific Gold Corporation Page 112 Cerro Maricunga Oxide Gold Project Preliminary Economic Assessment
Figure 36 Heap Leaching Area
17.4 ADR, EW, and Smelting
In order to recover gold from the PLS, the use of activated carbon has been considered. The process
will be applied in three stages: adsorption, desorption, and regeneration (ADR plant).
In the adsorption stage, activated carbon loads the gold contained in the PLS. The BLS obtained in
this stage is sent to a BLS pond for pad irrigation.
The loaded carbon is transferred to the elution circuit, where it is acid washed and desorbed
(desorption stage): gold is effectively removed from the carbon surface and are transferred to a rich
eluted solution. The stripped carbon is subsequently fed to a rotatory kiln when is reactivated and
returned to the adsorption columns.
Gold is recovered from the eluted solution in an electrowinning circuit, where it is deposited on the
electrowinning cathodes. Gold is then washed from the cathodes and is then smelted, where dore
bullion is produced as the final product.
Salar de
Maricunga
Heap Leaching Facility
(Cap.: 270 Mt)
Process Ponds
(PLS, ILS, BLS, and Emergency)
Process Plant
Atacama Pacific Gold Corporation Page 113 Cerro Maricunga Oxide Gold Project Preliminary Economic Assessment
18. PROJECT INFRASTURUCTURE
18.1 Introduction
The Cerro Maricunga Project comprises significant infrastructure, which is principally used to sustain
the operation. Infrastructure includes roads, electrical supply, water supply, workshops, warehouse,
offices and camp facilities, among other facilities.
18.1.1 Water Supply
The project considers a water pumping system from wells located in the area of the Salar de
Pedernales, located approximately 100km north of Cerro Maricunga.
The pumping system contemplates to collect the water from a number of wells, using deep well pumps
and booster pumps, where required. The water will be pumped to the Cerro Maricunga plant, through
an Intermediate Pumping Station which in turn will drive the water by means of horizontal centrifugal
pumps.
18.1.2 Process Plant Earthworks
For ADR process plant platform, 72,900 m3 of excavations and 21,870 m3 of fillings are required.
18.1.3 Roads
For the access road it has been considered to design a 22km road, connected from the International
Ch 31 road and over an existing route. The following figure shows the projected road. The road has
8m of width and is built on a compacted, rolled bare over its entire length.
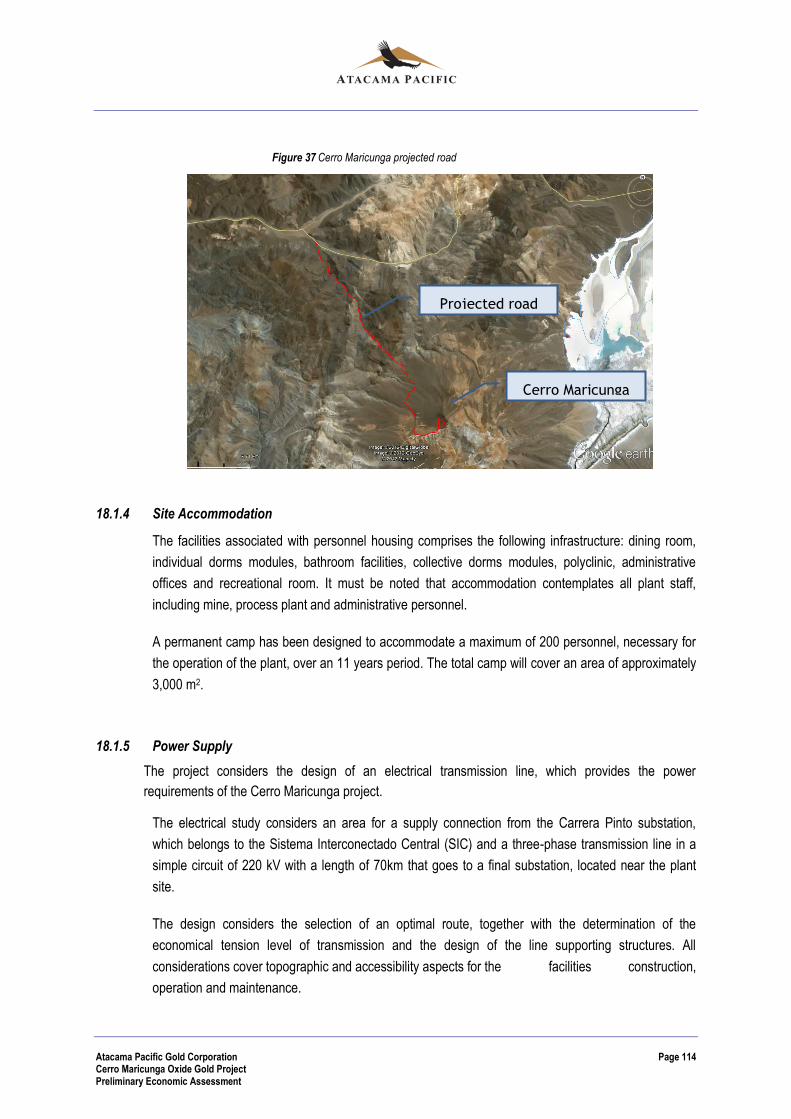
Atacama Pacific Gold Corporation Page 114 Cerro Maricunga Oxide Gold Project Preliminary Economic Assessment
Figure 37 Cerro Maricunga projected road
18.1.4 Site Accommodation
The facilities associated with personnel housing comprises the following infrastructure: dining room,
individual dorms modules, bathroom facilities, collective dorms modules, polyclinic, administrative
offices and recreational room. It must be noted that accommodation contemplates all plant staff,
including mine, process plant and administrative personnel.
A permanent camp has been designed to accommodate a maximum of 200 personnel, necessary for
the operation of the plant, over an 11 years period. The total camp will cover an area of approximately
3,000 m2.
18.1.5 Power Supply
The project considers the design of an electrical transmission line, which provides the power
requirements of the Cerro Maricunga project.
The electrical study considers an area for a supply connection from the Carrera Pinto substation,
which belongs to the Sistema Interconectado Central (SIC) and a three-phase transmission line in a
simple circuit of 220 kV with a length of 70km that goes to a final substation, located near the plant
site.
The design considers the selection of an optimal route, together with the determination of the
economical tension level of transmission and the design of the line supporting structures. All
considerations cover topographic and accessibility aspects for the facilities construction,
operation and maintenance.
Cerro Maricunga
Projected road
Atacama Pacific Gold Corporation Page 115 Cerro Maricunga Oxide Gold Project Preliminary Economic Assessment
The electrical study is developed at a prefeasibility level, and considers general information of the
geographic area and preliminary route sketch, but does not contemplate an environmental evaluation
(Base Line), lands registries or mining claims. The precision level of the study is around ±30%, in
accordance a prefeasibility level of accuracy.
18.1.6 Maintenance Facilities and Fuel Storage
The workshops contemplate the following facilities: maintenance shop, welding shop, warehouse,
cleaning shop, oiling shop, and tires change shop.
The buildings will have a steel structure with reinforced concrete foundations, and it will cover a
surface area of approximately 2,000 m2.
18.1.7 Potable Water Supply
The Project considers a desalination plant to treat the saline water from Salar de Pedernales.
18.1.8 Waste Treatment
All solid domestic wastes, industrial wastes and toxic wastes, generated by the plant, will be
temporally stored in the warehouse. A wastewater treatment plant is also included.
18.1.9 Vehicle Washdown
Included in maintenance facilities and fuel storage.
18.1.10 Heavy Vehicle Workshop
Included in maintenance facilities and fuel storage.
18.1.11 Administration Office Complex
A 5 people capacity administrative office module is contemplated.
18.1.12 Laboratory and Reagents Plant
A laboratory is projected for sample analysis, located in the electrowinning and smelting area.
A reagent plant has been considered for the storage and supply of the reagents.
Other facilities considered for the project include a drill core shed.
Atacama Pacific Gold Corporation Page 116 Cerro Maricunga Oxide Gold Project Preliminary Economic Assessment
18.1.13 Communications
A satellite communication system is considered to transmit voice, data and video.
18.2 Mining Facilities
18.2.1 Magazine & Fuel Storage
It is anticipated that the vendors will provide storage for fuel, lubricants, and explosives as part of their
contract of work and that the prices for these items are included in the delivered price.
18.2.2 Workshop
Truck workshop is planned to be built near the mine, close to the primary crusher area. A local
experienced manufacturer was contacted to quote a 4 bay facility.

Atacama Pacific Gold Corporation Page 117 Cerro Maricunga Oxide Gold Project Preliminary Economic Assessment
19. MARKETING
Doré production from the Project could be sold either on the spot market or under agreements with
refineries. Sales and marketing considerations would be evaluated during feasibility-level studies. It is
expected that any sales and refining agreements would be negotiated in line with industry norms.
Changes in market price for gold will affect both cash flows and profitability of the Project. Figure 38
indicate the variability of gold price during the last 5 years (February 23, 2008, to February 22, 2013).
Gold prices during this period ranged from a low of US$ 724/oz (on October 31, 2008) to a high of
US$ 1,884/oz (on September 2, 2011) and consistently exceeded the price assumptions utilized in the
base case financial modelling for Cerro Maricunga, during the past two years.
Figure 38 Gold Spot Price – February 23, 2008 to February 22, 2013 (Source: www.kitco.com)
Atacama Pacific Gold Corporation Page 118 Cerro Maricunga Oxide Gold Project Preliminary Economic Assessment
20. ENVIRONMENTAL STUDIES, PERMITTING AND SOCIAL OR COMMUNITY IMPACT
20.1 Summary
The legal framework for environmental, health and safety aspects related to the Cerro Maricunga
development project is comprised of general laws and decrees as well as sector specific regulatory
decrees.
As part of this process, on November 3, 2011, Atacama Pacific received approval of its Declaration of
Environmental Impact (“DIA”) by Resolution Number 232 by the Environmental Evaluation
Commission of the III Region, Republic of Chile and received an Environmental Resolution
Qualification allowing the Company to precede with advanced exploration activities. The DIA was
prepared by ARCADIS Chile on behalf of the Company.
The declaration was necessary as the scale of drilling planned for the Cerro Maricunga project had
progressed beyond what is considered by the Environmental Evaluation Commission as exploration.
The permit, which required the approval of various administrative bodies of the State, certified that the
Cerro Maricunga environmental declaration complied with the environmental regulations and
formalized the conditions for further advanced stage exploration activities.
The DIA took into account Air Quality, Light Contamination, Noise, Potable Water, Domestic
Wastewater, Solid and Hazardous Waste Management, Vehicle Weights on Public Roads, Terrestrial
Fauna, Flora, Cultural Heritage, Electrical utilities, Flammable Liquids and Land Planning. The DIA
demonstrated compliance with all respective regulations.
20.2 Social
With the exception of the La Coipa mining camp, all other surrounding population are at least 30km
away from the where the proposed activities will take place. Indigenous people closest to the Project
Area belong to the Pastos Grandes, Pai-Ote and Sinchi Waira communities. Based on the literature
review and field survey, there are no signs of nomadic activity, agriculture, or artisanal mining within
the project area. There are no lands assigned to indigenous communities per Law 19.253, nor are
there herding routes in the project area.
In terms of potential socioeconomic impacts, it is anticipate that a mining operation would not cause
any significant alteration in the distribution of nearby inhabitants or dwellings and it is not expected to
generate any cultural or anthropological changes of human groups near the area. Positive impacts are
anticipated in terms of local employment and the purchase of consumables, equipment and services
from local businesses whenever practicable. The development of a mining operation at Cerro
Maricunga Project would result in further long-term stable employment and support to local
businesses. Impacts to tourism have been evaluated to be minor, and there are potential opportunities
to provide support to tourism in the area.
Atacama Pacific Gold Corporation Page 119 Cerro Maricunga Oxide Gold Project Preliminary Economic Assessment
20.2.1 Social Monitoring Programs
Social monitoring consists of monitoring stakeholder relations and perceptions towards the project.
Stakeholders include, but are not limited to nearby community members, general public (particularly
tourists in the area), and government authorities. At the institutional level, Atacama Pacific continues
to report to applicable government authorities to comply with permit requirements and modifications.
20.3 Hydrology
The Project is situated at the top of the Quebrada Paipote en Junta Quebrada San Andrés watershed.
The average annual surface runoff in these watersheds is less than 20 mm/year. The soil conditions
and typically steep slopes are not conducive to surface infiltration therefore practically all precipitation
either evaporates from accumulated snow or, to a lesser degree, becomes surface runoff.
The three main ravines (quebradas) in the Area of Influence of the Exploration Area of the Project are
Quebrada Larga, Quebrada Vizcachas and Quebrada de Maricunga (Figure 39). A smaller ravine,
Quebrada de la Pelada (not shown in Figure 39), parallels the access road and the current exploration
camp. These ravines are nearly always dry and when water flows do occur in the ravines, they are low
– typically on the order of 10 l/s. The Project area is bordered by the Quebrada San Andrés
watershed to the north and the Campo de Piedra Pomez y Río Lamas watershed to the east, which
drains to the large salt flat known as the Salar de Maricunga.
The Project area does not have any hydro-geological features of importance. Exploration drillings in
the deposit area, reaching as much as 600 m of vertical depth, have not intercepted groundwater. This
is further supported from the hydro-geological mapping which showed that the presence of an aquifer
in the Project area to be unlikely.
In contrast to the project area, the main hydro-geological features in the region are localized below the
Maricunga salt flat, which consists of an alluvial aquifer. This aquifer is located within in different water
shed and therefore no impact is expected from future activities.
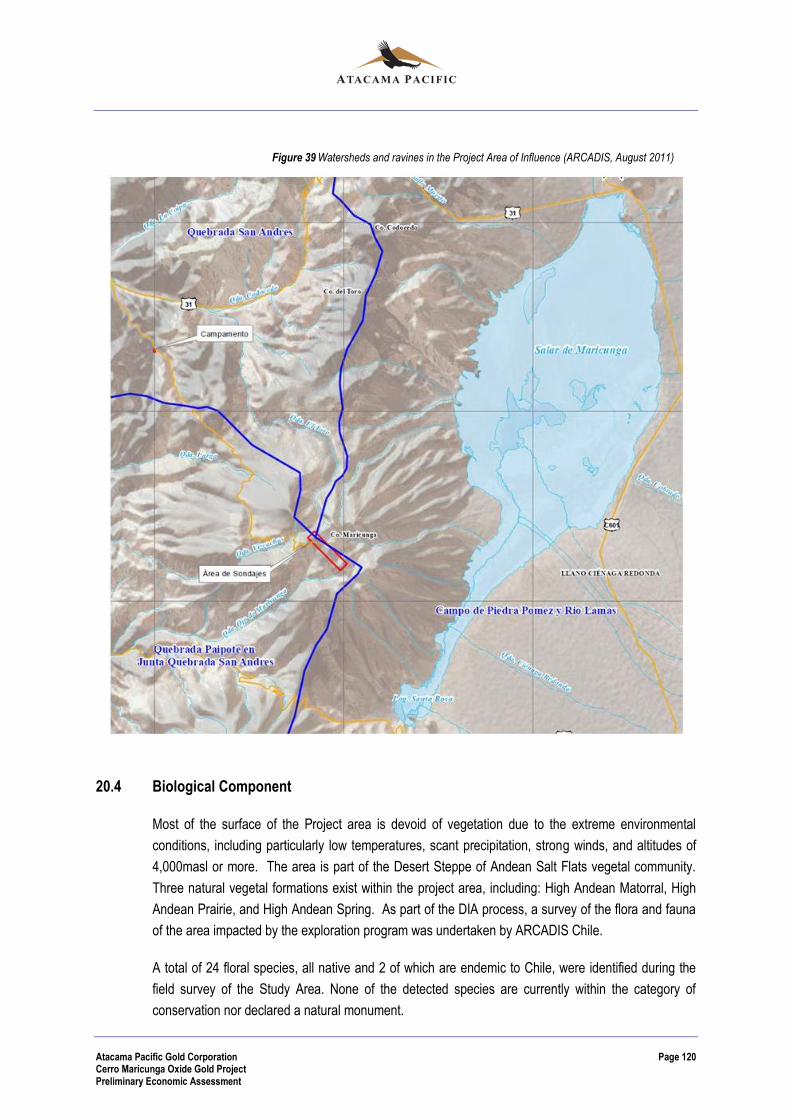
Atacama Pacific Gold Corporation Page 120 Cerro Maricunga Oxide Gold Project Preliminary Economic Assessment
Figure 39 Watersheds and ravines in the Project Area of Influence (ARCADIS, August 2011)
20.4 Biological Component
Most of the surface of the Project area is devoid of vegetation due to the extreme environmental
conditions, including particularly low temperatures, scant precipitation, strong winds, and altitudes of
4,000masl or more. The area is part of the Desert Steppe of Andean Salt Flats vegetal community.
Three natural vegetal formations exist within the project area, including: High Andean Matorral, High
Andean Prairie, and High Andean Spring. As part of the DIA process, a survey of the flora and fauna
of the area impacted by the exploration program was undertaken by ARCADIS Chile.
A total of 24 floral species, all native and 2 of which are endemic to Chile, were identified during the
field survey of the Study Area. None of the detected species are currently within the category of
conservation nor declared a natural monument.
Atacama Pacific Gold Corporation Page 121 Cerro Maricunga Oxide Gold Project Preliminary Economic Assessment
Given that the Study area has very limited vegetative cover, an absence of waterbodies (and any kind
of aquatic ecosystems), and altitudes are typically above 4,000masl or more, the quantity and diversity
of fauna species is limited to select species. A survey of fauna in the area, undertaken during the DIA
noted the following:
Amphibians are unlikely to be found in the area due to the absence of surface water bodies.
A total of 10 bird species were recorded, none of which are listed for conservation
Camelids, such as guanacos (Lama guanicoe) and, in elevations above 4,000 msl, vicuñas
(Vicugna vicugna). Vicuñas were the only fauna species that were observed in the proposed
drill sites areas during the field survey. Possible carnivores include the Andean Fox
(Lycalopexculpaeus) and the Patagonian Fox or Grey Fox (Lycalopexgriseus), “quiques”
(Galictiscuja), pampas cats (Leoparduscolocolo) and pumas (Puma concolor). Rodents in the
Study Area may include the Atacama Tuco-tuco (Ctenomys fulvus), Darwin´s Leaf-Eared
Mouse (Phyllotis darwinii), the Andean Altiplano Mouse (Abrothrix andinus), the Southern
Viscacha (Lagidium viscacia), among other species. Although few mammal individuals were
found during the field survey, four (4) species of mammals were registered that are under
some category of conservation: the Vicuña (Vicugna vicugna) and the Guanaco (Lama
guanicoe) are Threatened; the Atacama Tuco-tuco (Ctenomysfulvus) is Vulnerable; and the
Patagonian Fox (Lycalopexgriseus) is considered to be Inadequately Known.
20.4.1 Biological Monitoring Programs
Atacama Pacific has been collecting baseline environment since late 2011 for the preparation of an
Environmental Impact Assessment.
Given the limited scope of the present exploration activities, the current monitoring program consists
of completing regular and unannounced compliance inspections as part of the overall Environmental
Health and Safety program. Additionally, per the request of Chile’s National Environmental
Commission (CONAMA), Atacama Pacific has implementing a biological monitoring program
specifically for guanacos and vicuñas in the area
20.5 Protected Areas
Part of the Project is located within the limits of the Nevado Tres Cruces Regional Priority Site, which was
defined by the Atacama Biodiversity Regional Strategy (2010 – 2017). The Priority Site (an area of
1,297.7 km²) encompasses the Santa Rosa and the del Negro Francisco Lagoons with the objective of
creating a biological corridor between these two lagoons. The Nevado Tres Cruces National Park, created
in 1994, is located within the boundaries of the Priority Site, as can be seen in the Figure 40 below.
The proposed mine and processing area does not exist within or near any areas that have been identified
as having special characteristics for biodiversity conservation (i.e. flora, vegetation, fauna, etc).
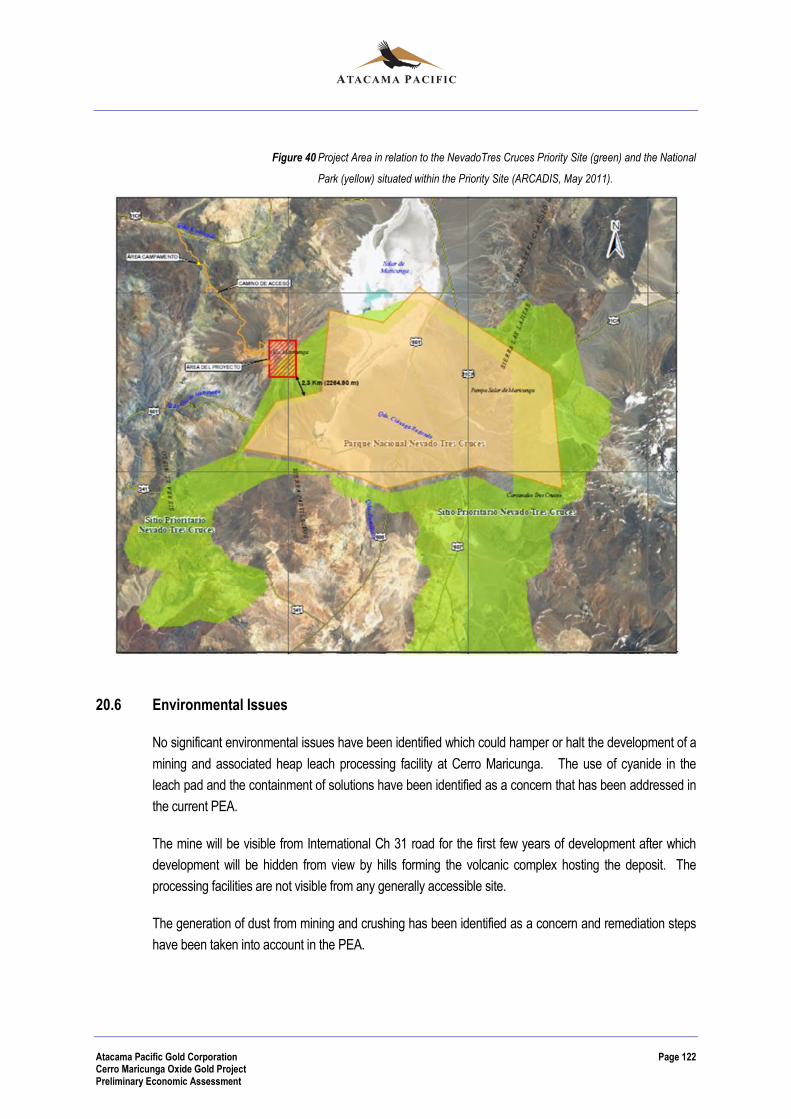
Atacama Pacific Gold Corporation Page 122 Cerro Maricunga Oxide Gold Project Preliminary Economic Assessment
Figure 40 Project Area in relation to the NevadoTres Cruces Priority Site (green) and the National
Park (yellow) situated within the Priority Site (ARCADIS, May 2011).
20.6 Environmental Issues
No significant environmental issues have been identified which could hamper or halt the development of a
mining and associated heap leach processing facility at Cerro Maricunga. The use of cyanide in the
leach pad and the containment of solutions have been identified as a concern that has been addressed in
the current PEA.
The mine will be visible from International Ch 31 road for the first few years of development after which
development will be hidden from view by hills forming the volcanic complex hosting the deposit. The
processing facilities are not visible from any generally accessible site.
The generation of dust from mining and crushing has been identified as a concern and remediation steps
have been taken into account in the PEA.
Atacama Pacific Gold Corporation Page 123 Cerro Maricunga Oxide Gold Project Preliminary Economic Assessment
20.7 Closure and Reclamation
The reclamation and closure activities will include removal of all buildings, power lines, pipe lines and
process components, securing the pit and waste rock storage facilities, ensuring that the spent leach
pad and tailings storage facility are chemically and structurally stabilized, and returning the area to its
previous land use. To the extent possible, reclamation will be carried out concurrently with operations.
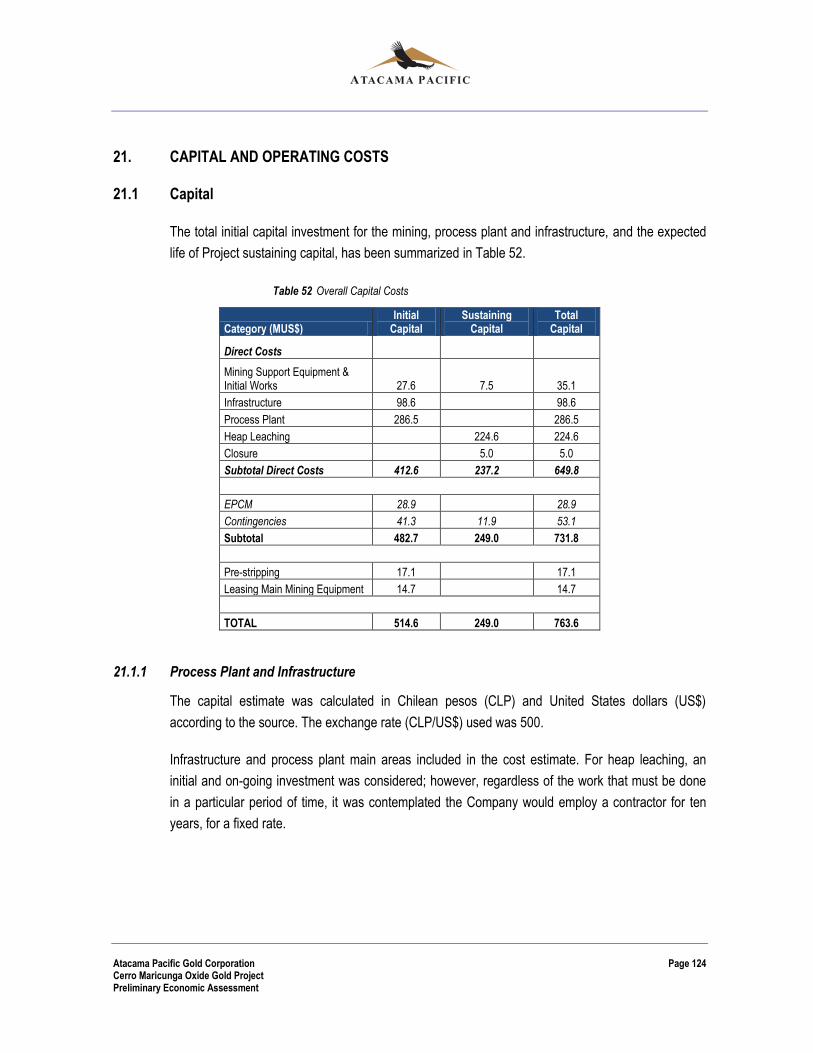
Atacama Pacific Gold Corporation Page 124 Cerro Maricunga Oxide Gold Project Preliminary Economic Assessment
21. CAPITAL AND OPERATING COSTS
21.1 Capital
The total initial capital investment for the mining, process plant and infrastructure, and the expected
life of Project sustaining capital, has been summarized in Table 52.
Table 52 Overall Capital Costs
Category (MUS$) Initial
Capital Sustaining
Capital Total
Capital
Direct Costs
Mining Support Equipment & Initial Works 27.6 7.5 35.1
Infrastructure 98.6 98.6
Process Plant 286.5 286.5
Heap Leaching 224.6 224.6
Closure 5.0 5.0
Subtotal Direct Costs 412.6 237.2 649.8
EPCM 28.9 28.9
Contingencies 41.3 11.9 53.1
Subtotal 482.7 249.0 731.8
Pre-stripping 17.1 17.1
Leasing Main Mining Equipment 14.7 14.7
TOTAL 514.6 249.0 763.6
21.1.1 Process Plant and Infrastructure
The capital estimate was calculated in Chilean pesos (CLP) and United States dollars (US$)
according to the source. The exchange rate (CLP/US$) used was 500.
Infrastructure and process plant main areas included in the cost estimate. For heap leaching, an
initial and on-going investment was considered; however, regardless of the work that must be done
in a particular period of time, it was contemplated the Company would employ a contractor for ten
years, for a fixed rate.

Atacama Pacific Gold Corporation Page 125 Cerro Maricunga Oxide Gold Project Preliminary Economic Assessment
Table 53 Areas included in the cost estimation
The capital cost estimate is composed of the following:
Direct cost of construction and assembly: Acquisitions of equipment supply, labor, auxiliary
equipment for construction and building materials.
Indirect cost of construction and assembly: Temporary camp, surveillance and administration,
transportation and nutrition, general and financial cost and utilities of contractor.
Indirect costs of project: Transportation, insurance of equipment, and general spare parts.
Indirect costs of the project such as import duties, vendor’s representatives, detailed engineering,
EPCM, PEM and owner costs and contingency costs were not included in the capital costs
estimation and will be contemplated in the economic evaluation of the project.
A general overview of the initial infrastructure costs, estimated for the project, is presented on Table
54, while an overview of the plant capital cost is presented on Table 55.
Area Item
Workshop, warehouse, offices, etc.
Water supply
Electrical supply
Roads
Primary crushing
Coarse stock pile
Secondary crushing
Tertiary crushing
Fine stock pile
Heap leaching
ADR Plant
EW / Smelting
Infrastructure
Plant
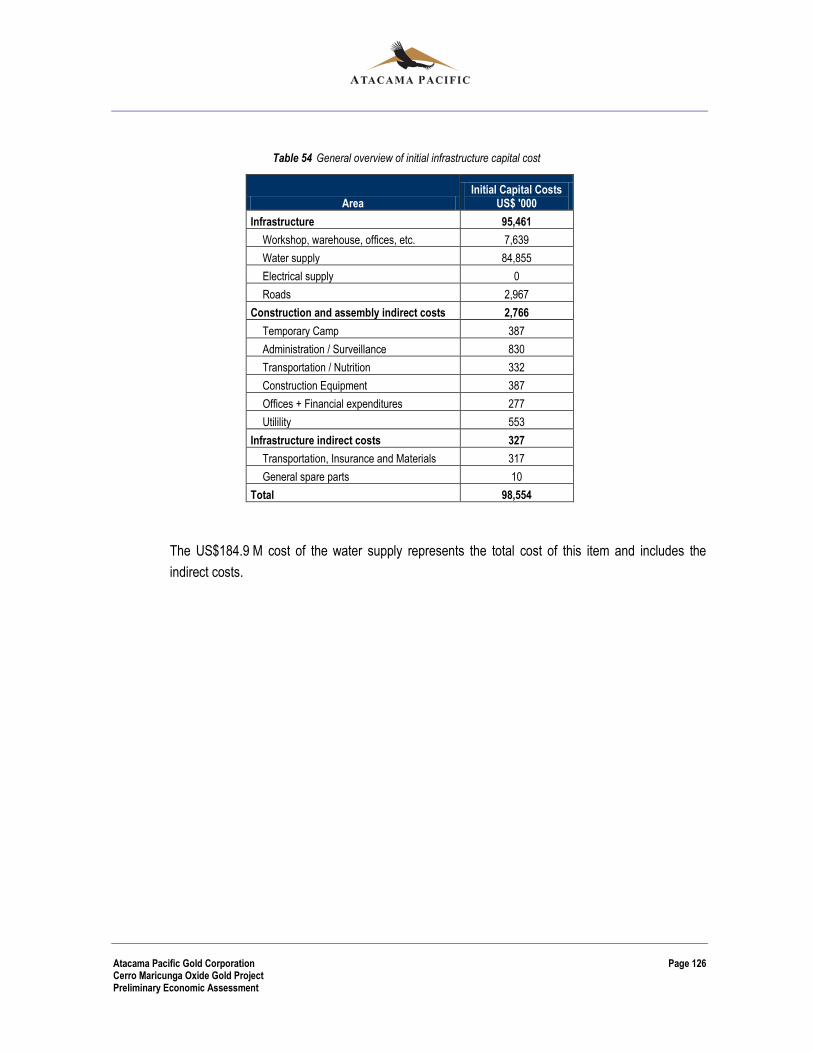
Atacama Pacific Gold Corporation Page 126 Cerro Maricunga Oxide Gold Project Preliminary Economic Assessment
Table 54 General overview of initial infrastructure capital cost
Area Initial Capital Costs
US$ '000
Infrastructure 95,461
Workshop, warehouse, offices, etc. 7,639
Water supply 84,855
Electrical supply 0
Roads 2,967
Construction and assembly indirect costs 2,766
Temporary Camp 387
Administration / Surveillance 830
Transportation / Nutrition 332
Construction Equipment 387
Offices + Financial expenditures 277
Utilility 553
Infrastructure indirect costs 327
Transportation, Insurance and Materials 317
General spare parts 10
Total 98,554
The US$184.9 M cost of the water supply represents the total cost of this item and includes the
indirect costs.
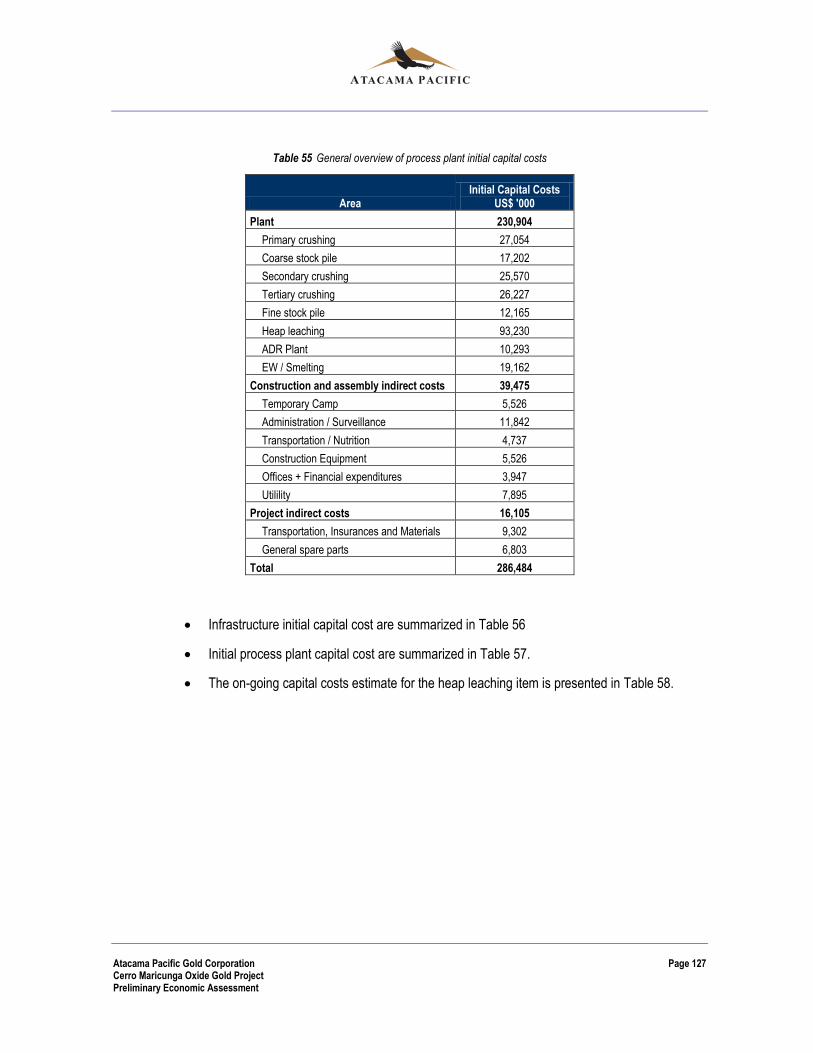
Atacama Pacific Gold Corporation Page 127 Cerro Maricunga Oxide Gold Project Preliminary Economic Assessment
Table 55 General overview of process plant initial capital costs
Area Initial Capital Costs
US$ '000
Plant 230,904
Primary crushing 27,054
Coarse stock pile 17,202
Secondary crushing 25,570
Tertiary crushing 26,227
Fine stock pile 12,165
Heap leaching 93,230
ADR Plant 10,293
EW / Smelting 19,162
Construction and assembly indirect costs 39,475
Temporary Camp 5,526
Administration / Surveillance 11,842
Transportation / Nutrition 4,737
Construction Equipment 5,526
Offices + Financial expenditures 3,947
Utilility 7,895
Project indirect costs 16,105
Transportation, Insurances and Materials 9,302
General spare parts 6,803
Total 286,484
Infrastructure initial capital cost are summarized in Table 56
Initial process plant capital cost are summarized in Table 57.
The on-going capital costs estimate for the heap leaching item is presented in Table 58.
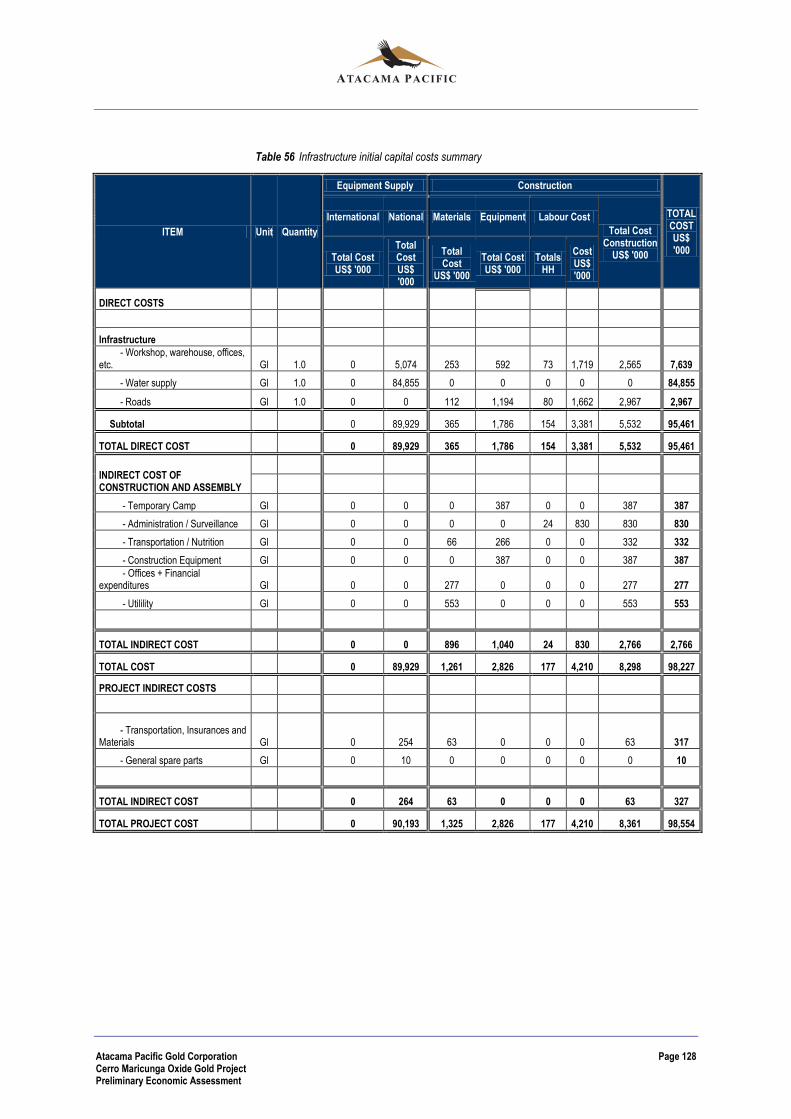
Atacama Pacific Gold Corporation Page 128 Cerro Maricunga Oxide Gold Project Preliminary Economic Assessment
Table 56 Infrastructure initial capital costs summary
ITEM Unit Quantity
Equipment Supply Construction
TOTAL COST US$ '000
International National Materials Equipment Labour Cost
Total Cost Construction
US$ '000 Total Cost US$ '000
Total Cost US$ '000
Total Cost
US$ '000
Total Cost US$ '000
Totals HH
Cost US$ '000
DIRECT COSTS
Infrastructure
- Workshop, warehouse, offices, etc. Gl 1.0 0 5,074 253 592 73 1,719 2,565 7,639
- Water supply Gl 1.0 0 84,855 0 0 0 0 0 84,855
- Roads Gl 1.0 0 0 112 1,194 80 1,662 2,967 2,967
Subtotal 0 89,929 365 1,786 154 3,381 5,532 95,461
TOTAL DIRECT COST 0 89,929 365 1,786 154 3,381 5,532 95,461
INDIRECT COST OF CONSTRUCTION AND ASSEMBLY
- Temporary Camp Gl 0 0 0 387 0 0 387 387
- Administration / Surveillance Gl 0 0 0 0 24 830 830 830
- Transportation / Nutrition Gl 0 0 66 266 0 0 332 332
- Construction Equipment Gl 0 0 0 387 0 0 387 387
- Offices + Financial expenditures Gl 0 0 277 0 0 0 277 277
- Utilility Gl 0 0 553 0 0 0 553 553
TOTAL INDIRECT COST 0 0 896 1,040 24 830 2,766 2,766
TOTAL COST 0 89,929 1,261 2,826 177 4,210 8,298 98,227
PROJECT INDIRECT COSTS
- Transportation, Insurances and Materials Gl 0 254 63 0 0 0 63 317
- General spare parts Gl 0 10 0 0 0 0 0 10
TOTAL INDIRECT COST 0 264 63 0 0 0 63 327
TOTAL PROJECT COST 0 90,193 1,325 2,826 177 4,210 8,361 98,554

Atacama Pacific Gold Corporation Page 129 Cerro Maricunga Oxide Gold Project Preliminary Economic Assessment
Table 57 Initial process plant capital costs summary
ITEM Unit Quantity
Equipment Supply Construction
TOTAL COST US$ '000
International National Materials Equipment Labour Cost
Total Cost Construction
US$ '000 Total Cost US$ '000
Total Cost US$ '000
Total Cost
US$ '000
Total Cost US$ '000
Totals HH
Cost US$ '000
DIRECT COSTS
Plant
- Primary crushing Gl 1.0 21,091 1,203 404 178 4,356 5,963 27,054
- Coarse stock pile Gl 1.0 10,671 2,916 205 148 3,410 6,531 17,202
- Secondary crushing Gl 1.0 22,100 1,328 557 68 1,585 3,470 25,570
- Tertiary crushing Gl 1.0 22,294 1,463 586 81 1,883 3,932 26,227
- Fine stock pile Gl 1.0 7,076 2,211 140 119 2,739 5,090 12,165
- Heap leaching Gl 1.0 43,502 10,458 14,335 1,071 24,935 49,728 93,230
- ADR Plant Gl 1.0 8,425 694 278 39 897 1,869 10,293
- EW / Smelting Gl 1.0 16,796 1,031 345 43 990 2,366 19,162
Subtotal 0 151,954 21,305 16,850 1,747 40,794 78,949 230,904
TOTAL DIRECT COST 0 151,954 21,305 16,850 1,747 40,794 78,949 230,904
INDIRECT COST OF CONSTRUCTION AND ASSEMBLY
- Temporary Camp Gl 0 5,526 0 0 5,526 5,526
- Administration / Surveillance Gl 0 0 338 11,842 11,842 11,842
- Transportation / Nutrition Gl 947 3,790 0 0 4,737 4,737
- Construction Equipment Gl 0 5,526 0 0 5,526 5,526
- Offices + Financial expenditures Gl 3,947 0 0 0 3,947 3,947
- Utilility Gl 7,895 0 0 0 7,895 7,895
TOTAL INDIRECT COST 0 0 12,790 14,842 338 11,842 39,475 39,475
TOTAL COST 0 151,954 34,094 31,693 2,085 52,637 118,424 270,378
PROJECT INDIRECT COSTS
- Transportation, Insurances and Materials Gl 7,598 1,705 0 0 0 1,705 9,302
- General spare parts Gl 6,803 0 0 0 0 0 6,803
TOTAL INDIRECT COST 0 14,400 1,705 0 0 0 1,705 16,105
TOTAL PROJECT COST 0 14,400 1,705 0 0 0 1,705 286,484
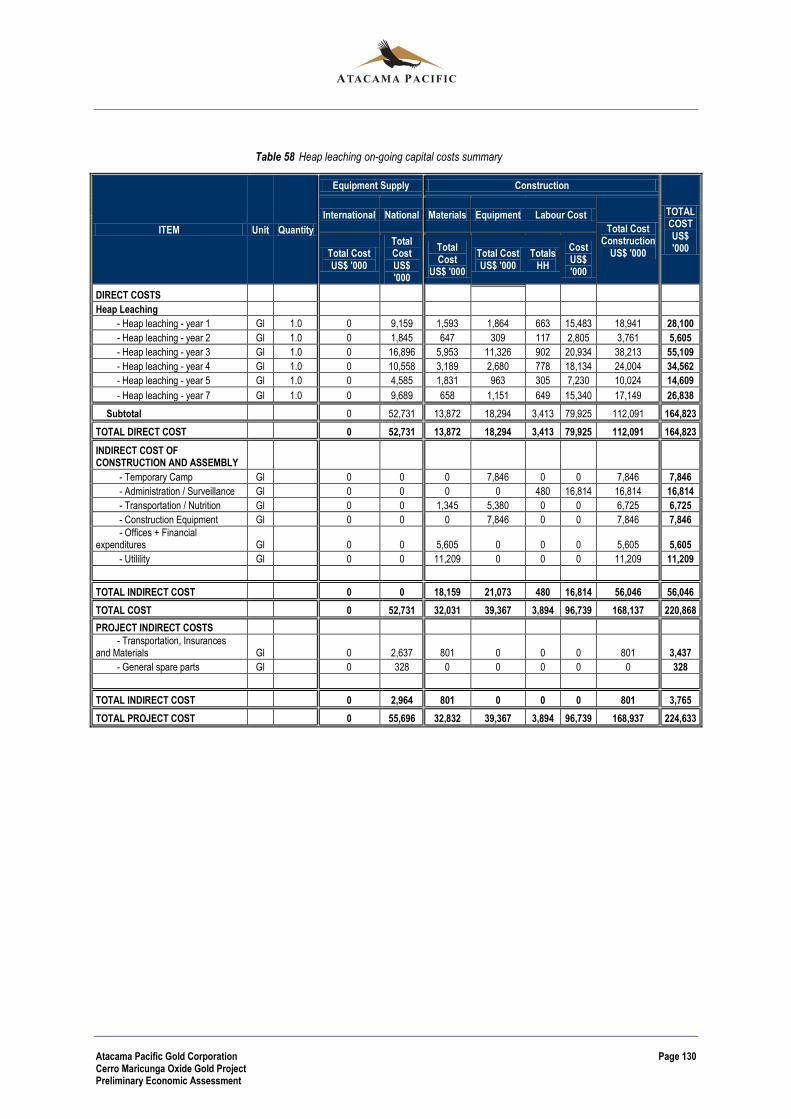
Atacama Pacific Gold Corporation Page 130 Cerro Maricunga Oxide Gold Project Preliminary Economic Assessment
Table 58 Heap leaching on-going capital costs summary
ITEM Unit Quantity
Equipment Supply Construction
TOTAL COST US$ '000
International National Materials Equipment Labour Cost
Total Cost Construction
US$ '000 Total Cost US$ '000
Total Cost US$ '000
Total Cost
US$ '000
Total Cost US$ '000
Totals HH
Cost US$ '000
DIRECT COSTS
Heap Leaching
- Heap leaching - year 1 Gl 1.0 0 9,159 1,593 1,864 663 15,483 18,941 28,100
- Heap leaching - year 2 Gl 1.0 0 1,845 647 309 117 2,805 3,761 5,605
- Heap leaching - year 3 Gl 1.0 0 16,896 5,953 11,326 902 20,934 38,213 55,109
- Heap leaching - year 4 Gl 1.0 0 10,558 3,189 2,680 778 18,134 24,004 34,562
- Heap leaching - year 5 Gl 1.0 0 4,585 1,831 963 305 7,230 10,024 14,609
- Heap leaching - year 7 Gl 1.0 0 9,689 658 1,151 649 15,340 17,149 26,838
Subtotal 0 52,731 13,872 18,294 3,413 79,925 112,091 164,823
TOTAL DIRECT COST 0 52,731 13,872 18,294 3,413 79,925 112,091 164,823
INDIRECT COST OF CONSTRUCTION AND ASSEMBLY
- Temporary Camp Gl 0 0 0 7,846 0 0 7,846 7,846
- Administration / Surveillance Gl 0 0 0 0 480 16,814 16,814 16,814
- Transportation / Nutrition Gl 0 0 1,345 5,380 0 0 6,725 6,725
- Construction Equipment Gl 0 0 0 7,846 0 0 7,846 7,846
- Offices + Financial expenditures Gl 0 0 5,605 0 0 0 5,605 5,605
- Utilility Gl 0 0 11,209 0 0 0 11,209 11,209
TOTAL INDIRECT COST 0 0 18,159 21,073 480 16,814 56,046 56,046
TOTAL COST 0 52,731 32,031 39,367 3,894 96,739 168,137 220,868
PROJECT INDIRECT COSTS
- Transportation, Insurances and Materials Gl 0 2,637 801 0 0 0 801 3,437
- General spare parts Gl 0 328 0 0 0 0 0 328
TOTAL INDIRECT COST 0 2,964 801 0 0 0 801 3,765
TOTAL PROJECT COST 0 55,696 32,832 39,367 3,894 96,739 168,937 224,633
Atacama Pacific Gold Corporation Page 131 Cerro Maricunga Oxide Gold Project Preliminary Economic Assessment
21.1.2 Mining
The estimated mine capital cost includes the following items:
Initial mine development
Support equipment.
Mine infrastructure.
The mine shop, offices, and warehouse.
This estimate does not include the following mine physical structures:
Fuel and lubricant storage facilities.
Explosive storage facilities.
Main mine equipment and ancillary fleets will be acquired through a manufacture lease arrangement
payable over periods of 10 and five years, respectively, upon a quote received from Komatsu.
It is anticipated that the vendors will provide storage for fuel, lubricants, and explosives as part of their
contract of work and that the prices for these items are included in the delivered price.
Table 59 details the capital cost in mining support equipment and initial required works.
Table 60 shows the leasing strategy developed for the mining main equipment, prepared from a quote
received from Komatsu. The first payment, during pre-stripping is considered as part of the initial
capital and the payments during the following years as part of the operating costs.

Atacama Pacific Gold Corporation Page 132 Cerro Maricunga Oxide Gold Project Preliminary Economic Assessment
Table 59 Mining Support Equipment and Initial Works
Period
Pre-strip Y01 Y02
Support Equipment
Support Drill rig (6 1/2") US$ 1,335,000 Purchase 1 0 1
Small backhoe US$ 105,374 Purchase 1 0 0
Fuel truck 85 m3 US$ 1,733,970 Purchase 1 0 0
Mobile crane 200t US$ 1,560,000 Purchase 1 0 0
Lowboy truck 110t US$ 322,353 Purchase 1 0 0
Mobile lighting tower 4x1000w US$ 10,981 Purchase 8 2 4
TOTAL SUPPORT EQUIPMENT MUS$ 5.1 0.0 1.4
OTHERS MUS$ 22.4 5.4 0.7
Rescue Truck MUS$ 0.3 0.0 0.0
FEL Cat 966 5yd3 MUS$ 0.0 0.4 0.0
Tires Truck 360t MUS$ 0.3 0.0 0.0
Tires Wheeldozer 834 MUS$ 0.0 0.0 0.0
Tires Motorgrader 16 M MUS$ 0.0 0.0 0.0
Tires Water Truck MUS$ 0.1 0.0 0.0
Forklift 4.5 t MUS$ 0.1 0.0 0.0
Forklift 23.5t MUS$ 0.0 0.1 0.0
Soil Compactor MUS$ 0.2 0.0 0.0
Extra Bucket for Hydraulic Shovel MUS$ 0.0 1.3 0.0
Extra Body for Truck MUS$ 0.0 0.2 0.0
Computer Equipment (Tech Service) MUS$ 0.0 0.0 0.0
Mining - Geology Soft Ware MUS$ 0.5 0.5 0.0
Furnitures MUS$ 0.2 0.0 0.0
Radio Equipment MUS$ 0.1 0.0 0.0
Handy radio equipment MUS$ 0.0 0.0 0.0
Spare parts (6% Main Equip.) MUS$ 3.4 0.0 0.0
Consulting / Engineering MUS$ 0.5 0.5 0.0
Survey Equipment MUS$ 0.6 0.0 0.0
Mining Haul Roads MUS$ 10.0 1.8 0.0
Light Vehicles (4x4 pick up) MUS$ 0.5 0.2 0.0
Crew Bus MUS$ 0.1 0.0 0.0
Truck Shop MUS$ 3.2 0.0 0.0
Dispatch MUS$ 2.3 0.6 0.7
TOTAL MINING CAPEX MUS$ 27.6 5.5 2.1
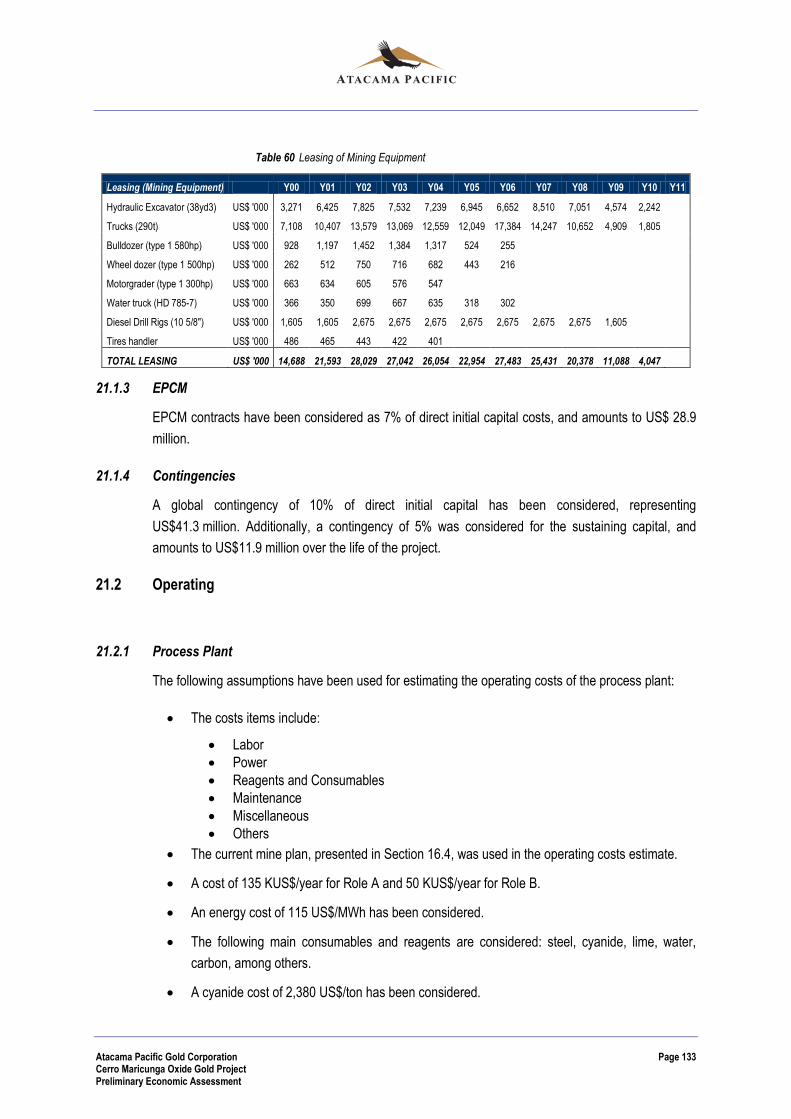
Atacama Pacific Gold Corporation Page 133 Cerro Maricunga Oxide Gold Project Preliminary Economic Assessment
Table 60 Leasing of Mining Equipment
Leasing (Mining Equipment) Y00 Y01 Y02 Y03 Y04 Y05 Y06 Y07 Y08 Y09 Y10 Y11
Hydraulic Excavator (38yd3) US$ '000 3,271 6,425 7,825 7,532 7,239 6,945 6,652 8,510 7,051 4,574 2,242
Trucks (290t) US$ '000 7,108 10,407 13,579 13,069 12,559 12,049 17,384 14,247 10,652 4,909 1,805
Bulldozer (type 1 580hp) US$ '000 928 1,197 1,452 1,384 1,317 524 255
Wheel dozer (type 1 500hp) US$ '000 262 512 750 716 682 443 216
Motorgrader (type 1 300hp) US$ '000 663 634 605 576 547
Water truck (HD 785-7) US$ '000 366 350 699 667 635 318 302
Diesel Drill Rigs (10 5/8") US$ '000 1,605 1,605 2,675 2,675 2,675 2,675 2,675 2,675 2,675 1,605
Tires handler US$ '000 486 465 443 422 401
TOTAL LEASING US$ '000 14,688 21,593 28,029 27,042 26,054 22,954 27,483 25,431 20,378 11,088 4,047
21.1.3 EPCM
EPCM contracts have been considered as 7% of direct initial capital costs, and amounts to US$ 28.9
million.
21.1.4 Contingencies
A global contingency of 10% of direct initial capital has been considered, representing
US$41.3 million. Additionally, a contingency of 5% was considered for the sustaining capital, and
amounts to US$11.9 million over the life of the project.
21.2 Operating
21.2.1 Process Plant
The following assumptions have been used for estimating the operating costs of the process plant:
The costs items include:
Labor
Power
Reagents and Consumables
Maintenance
Miscellaneous
Others
The current mine plan, presented in Section 16.4, was used in the operating costs estimate.
A cost of 135 KUS$/year for Role A and 50 KUS$/year for Role B.
An energy cost of 115 US$/MWh has been considered.
The following main consumables and reagents are considered: steel, cyanide, lime, water,
carbon, among others.
A cyanide cost of 2,380 US$/ton has been considered.
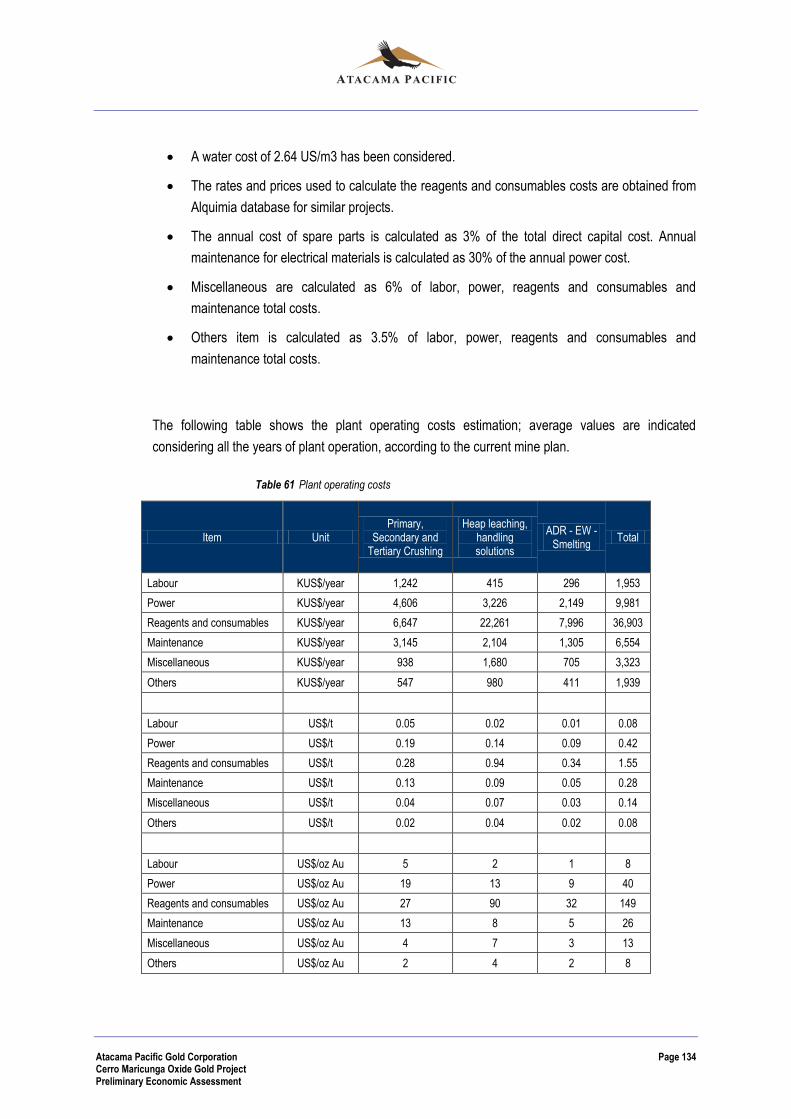
Atacama Pacific Gold Corporation Page 134 Cerro Maricunga Oxide Gold Project Preliminary Economic Assessment
A water cost of 2.64 US/m3 has been considered.
The rates and prices used to calculate the reagents and consumables costs are obtained from
Alquimia database for similar projects.
The annual cost of spare parts is calculated as 3% of the total direct capital cost. Annual
maintenance for electrical materials is calculated as 30% of the annual power cost.
Miscellaneous are calculated as 6% of labor, power, reagents and consumables and
maintenance total costs.
Others item is calculated as 3.5% of labor, power, reagents and consumables and
maintenance total costs.
The following table shows the plant operating costs estimation; average values are indicated
considering all the years of plant operation, according to the current mine plan.
Table 61 Plant operating costs
Item Unit Primary,
Secondary and Tertiary Crushing
Heap leaching, handling solutions
ADR - EW - Smelting
Total
Labour KUS$/year 1,242 415 296 1,953
Power KUS$/year 4,606 3,226 2,149 9,981
Reagents and consumables KUS$/year 6,647 22,261 7,996 36,903
Maintenance KUS$/year 3,145 2,104 1,305 6,554
Miscellaneous KUS$/year 938 1,680 705 3,323
Others KUS$/year 547 980 411 1,939
Total KUS$/year 17,125 30,667 12,861 60,653
Labour US$/t 0.05 0.02 0.01 0.08
Power US$/t 0.19 0.14 0.09 0.42
Reagents and consumables US$/t 0.28 0.94 0.34 1.55
Maintenance US$/t 0.13 0.09 0.05 0.28
Miscellaneous US$/t 0.04 0.07 0.03 0.14
Others US$/t 0.02 0.04 0.02 0.08
Total US$/t 0.72 1.29 0.54 2.56
Labour US$/oz Au 5 2 1 8
Power US$/oz Au 19 13 9 40
Reagents and consumables US$/oz Au 27 90 32 149
Maintenance US$/oz Au 13 8 5 26
Miscellaneous US$/oz Au 4 7 3 13
Others US$/oz Au 2 4 2 8
Atacama Pacific Gold Corporation Page 135 Cerro Maricunga Oxide Gold Project Preliminary Economic Assessment
21.2.2 Mining
Mine operating costs were developed from the recommended equipment requirements and the
personnel requirements. The mine operating costs include all the parts, supplies, and labour costs
associated with mine supervision, operation, and maintenance.
Table 62 shows the yearly total mining expenses per item and Table 63 shows the yearly unit cost
(US$/t mined).

Atacama Pacific Gold Corporation Page 136 Cerro Maricunga Oxide Gold Project Preliminary Economic Assessment
Table 62 Mining Operating Cost (US$ ‘000)
US$ '000 Year -1 Year 1 Year 2 Year 3 Year 4 Year 5 Year 6 Year 7 Year 8 Year 9 Year 10 Year 11 TOTAL
Mine Total Expenses US$ '000 17,132 77,447 110,892 120,121 114,500 113,787 115,175 106,898 92,874 66,902 34,811 2,871 973,411
Loading US$ '000 2,031 10,879 15,522 15,654 15,746 16,159 16,088 14,539 12,644 7,595 2,284 171 129,312
Hauling US$ '000 5,091 25,612 38,443 46,555 42,364 40,847 42,789 38,097 31,633 21,617 7,345 604 340,998
Drilling US$ '000 1,597 6,959 12,194 12,849 12,886 12,431 12,275 12,009 10,807 7,041 3,135 269 104,451
Blasting US$ '000 2,700 11,098 17,261 17,544 17,466 17,051 17,049 16,277 14,159 9,192 4,155 356 144,308
Ancillary US$ '000 1,520 5,950 8,465 8,607 7,218 8,401 8,237 7,413 6,317 5,633 4,266 351 72,379
Support US$ '000 748 2,412 2,584 2,580 2,579 2,657 2,497 2,634 2,450 2,388 2,290 188 26,009
Engineering and Administration US$ '000 1,101 4,238 4,587 4,574 4,560 4,560 4,560 4,514 4,332 4,058 3,614 298 44,996
Labour US$ '000 2,344 10,299 11,834 11,758 11,680 11,680 11,680 11,416 10,531 9,378 7,723 635 110,958
Table 63 Mining Operating Costs (US$/t mined)
US$/t Year -1 Year 1 Year 2 Year 3 Year 4 Year 5 Year 6 Year 7 Year 8 Year 9 Year 10 Year 11 TOTAL
Mining cost (t rom) US$/t 1.50 1.54 1.31 1.42 1.35 1.35 1.36 1.35 1.37 1.70 2.98 3.34 1.42
Loading US$/t 0.18 0.22 0.18 0.19 0.19 0.19 0.19 0.18 0.19 0.19 0.20 0.20 0.19
Hauling US$/t 0.45 0.51 0.45 0.55 0.50 0.48 0.51 0.48 0.47 0.55 0.63 0.70 0.50
Drilling US$/t 0.14 0.14 0.14 0.15 0.15 0.15 0.15 0.15 0.16 0.18 0.27 0.31 0.15
Blasting US$/t 0.24 0.22 0.20 0.21 0.21 0.20 0.20 0.21 0.21 0.23 0.36 0.41 0.21
Ancillary US$/t 0.13 0.12 0.10 0.10 0.09 0.10 0.10 0.09 0.09 0.14 0.37 0.41 0.11
Support US$/t 0.07 0.05 0.03 0.03 0.03 0.03 0.03 0.03 0.04 0.06 0.20 0.22 0.04
Engineering and Administration US$/t 0.10 0.08 0.05 0.05 0.05 0.05 0.05 0.06 0.06 0.10 0.31 0.35 0.07
Labour US$/t 0.21 0.20 0.14 0.14 0.14 0.14 0.14 0.14 0.16 0.24 0.66 0.74 0.16
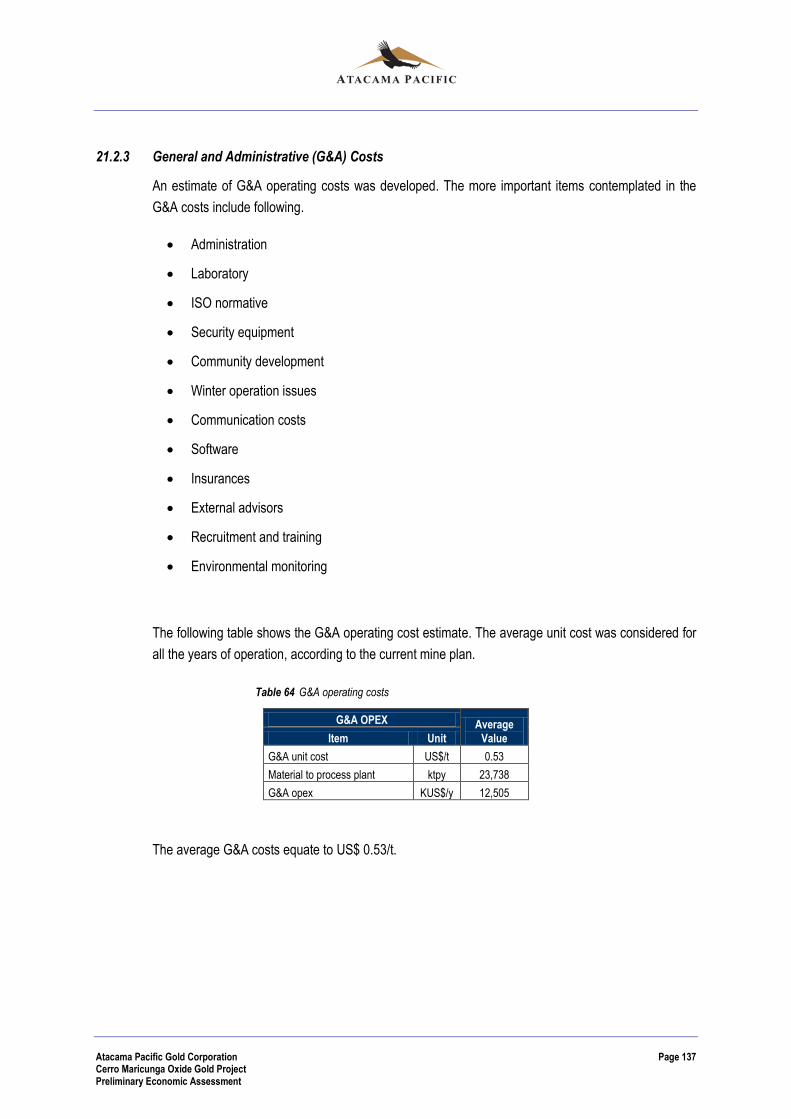
Atacama Pacific Gold Corporation Page 137 Cerro Maricunga Oxide Gold Project Preliminary Economic Assessment
21.2.3 General and Administrative (G&A) Costs
An estimate of G&A operating costs was developed. The more important items contemplated in the
G&A costs include following.
Administration
Laboratory
ISO normative
Security equipment
Community development
Winter operation issues
Communication costs
Software
Insurances
External advisors
Recruitment and training
Environmental monitoring
The following table shows the G&A operating cost estimate. The average unit cost was considered for
all the years of operation, according to the current mine plan.
Table 64 G&A operating costs
G&A OPEX Average Value Item Unit
G&A unit cost US$/t 0.53
Material to process plant ktpy 23,738
G&A opex KUS$/y 12,505
The average G&A costs equate to US$ 0.53/t.
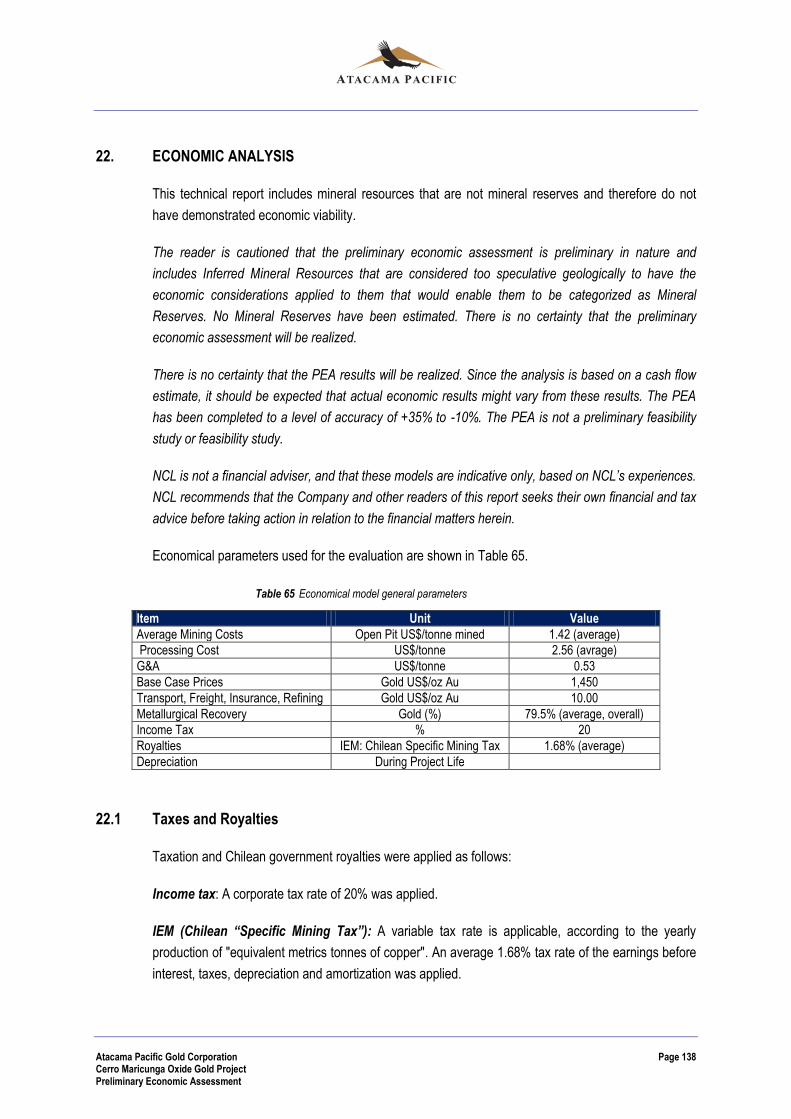
Atacama Pacific Gold Corporation Page 138 Cerro Maricunga Oxide Gold Project Preliminary Economic Assessment
22. ECONOMIC ANALYSIS
This technical report includes mineral resources that are not mineral reserves and therefore do not
have demonstrated economic viability.
The reader is cautioned that the preliminary economic assessment is preliminary in nature and
includes Inferred Mineral Resources that are considered too speculative geologically to have the
economic considerations applied to them that would enable them to be categorized as Mineral
Reserves. No Mineral Reserves have been estimated. There is no certainty that the preliminary
economic assessment will be realized.
There is no certainty that the PEA results will be realized. Since the analysis is based on a cash flow
estimate, it should be expected that actual economic results might vary from these results. The PEA
has been completed to a level of accuracy of +35% to -10%. The PEA is not a preliminary feasibility
study or feasibility study.
NCL is not a financial adviser, and that these models are indicative only, based on NCL’s experiences.
NCL recommends that the Company and other readers of this report seeks their own financial and tax
advice before taking action in relation to the financial matters herein.
Economical parameters used for the evaluation are shown in Table 65.
Table 65 Economical model general parameters
Item Unit Value
Average Mining Costs Open Pit US$/tonne mined 1.42 (average)
Processing Cost US$/tonne 2.56 (avrage)
G&A US$/tonne 0.53
Base Case Prices Gold US$/oz Au 1,450
Transport, Freight, Insurance, Refining Gold US$/oz Au 10.00
Metallurgical Recovery Gold (%) 79.5% (average, overall)
Income Tax % 20
Royalties IEM: Chilean Specific Mining Tax 1.68% (average)
Depreciation During Project Life
22.1 Taxes and Royalties
Taxation and Chilean government royalties were applied as follows:
Income tax: A corporate tax rate of 20% was applied.
IEM (Chilean “Specific Mining Tax”): A variable tax rate is applicable, according to the yearly
production of "equivalent metrics tonnes of copper". An average 1.68% tax rate of the earnings before
interest, taxes, depreciation and amortization was applied.

Atacama Pacific Gold Corporation Page 139 Cerro Maricunga Oxide Gold Project Preliminary Economic Assessment
22.2 Economic Analysis
The total estimated initial capital cost of the Project is US$514.6 million, which comprises
i) US$412.6 million for all plant, infrastructure, energy and open pit mining equipment; ii) an additional
$US70.1 million for EPCM and contingencies; and iii) US$32.1 million for initial pre-stripping and
leasing for main mining equipment during the pre-production period. Adding sustaining capital and
closure, the total capital cost for the life of the Project is estimated to be US$ 763.6 million.
It must be noted that this economical model considers a leasing option for the main mining equipment:
ten years for loading and hauling; and five years for auxiliary equipment.
The base case financial model assumes a gold price of US$ 1450 per ounce. Results of the
discounted cash flow modelling (NPV5% and NPV10%) for the PRoject, together with the projected
Internal Rate of Return (IRR) and payback period, are presented in Table 66.
Table 66 Economical Evaluation Results Summary
Financial Model
NPV5% Free cash flow (pre-tax) US$ 741M
NPV5% Free cash flow (after tax) US$ 531M
NPV10% Free cash flow (pre-tax) US$ 485M
NPV10% Free cash flow (after tax) US$ 324M
IRR (pre-tax) 33.9%
IRR (after tax) 26.6%
Years to payback from start of production (pre-tax at 0% discount)
2.5
Years to payback from start of production (free cash flow at 0% discount)
3.1
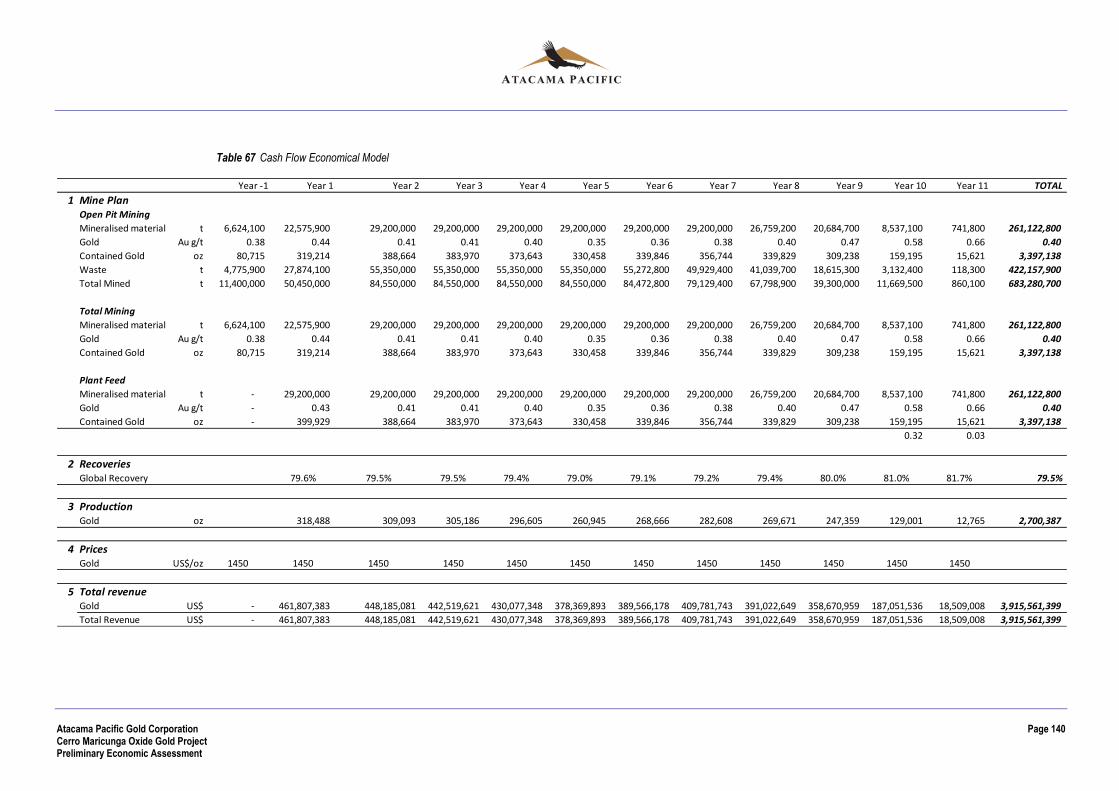
Atacama Pacific Gold Corporation Page 140 Cerro Maricunga Oxide Gold Project Preliminary Economic Assessment
Table 67 Cash Flow Economical Model
Year -1 Year 1 Year 2 Year 3 Year 4 Year 5 Year 6 Year 7 Year 8 Year 9 Year 10 Year 11 TOTAL
1 Mine PlanOpen Pit Mining
Mineralised material t 6,624,100 22,575,900 29,200,000 29,200,000 29,200,000 29,200,000 29,200,000 29,200,000 26,759,200 20,684,700 8,537,100 741,800 261,122,800
Gold Au g/t 0.38 0.44 0.41 0.41 0.40 0.35 0.36 0.38 0.40 0.47 0.58 0.66 0.40
Contained Gold oz 80,715 319,214 388,664 383,970 373,643 330,458 339,846 356,744 339,829 309,238 159,195 15,621 3,397,138
Waste t 4,775,900 27,874,100 55,350,000 55,350,000 55,350,000 55,350,000 55,272,800 49,929,400 41,039,700 18,615,300 3,132,400 118,300 422,157,900
Total Mined t 11,400,000 50,450,000 84,550,000 84,550,000 84,550,000 84,550,000 84,472,800 79,129,400 67,798,900 39,300,000 11,669,500 860,100 683,280,700
Total Mining
Mineralised material t 6,624,100 22,575,900 29,200,000 29,200,000 29,200,000 29,200,000 29,200,000 29,200,000 26,759,200 20,684,700 8,537,100 741,800 261,122,800
Gold Au g/t 0.38 0.44 0.41 0.41 0.40 0.35 0.36 0.38 0.40 0.47 0.58 0.66 0.40
Contained Gold oz 80,715 319,214 388,664 383,970 373,643 330,458 339,846 356,744 339,829 309,238 159,195 15,621 3,397,138
Plant Feed
Mineralised material t - 29,200,000 29,200,000 29,200,000 29,200,000 29,200,000 29,200,000 29,200,000 26,759,200 20,684,700 8,537,100 741,800 261,122,800
Gold Au g/t - 0.43 0.41 0.41 0.40 0.35 0.36 0.38 0.40 0.47 0.58 0.66 0.40
Contained Gold oz - 399,929 388,664 383,970 373,643 330,458 339,846 356,744 339,829 309,238 159,195 15,621 3,397,138
0.32 0.03
2 RecoveriesGlobal Recovery 79.6% 79.5% 79.5% 79.4% 79.0% 79.1% 79.2% 79.4% 80.0% 81.0% 81.7% 79.5%
3 ProductionGold oz 318,488 309,093 305,186 296,605 260,945 268,666 282,608 269,671 247,359 129,001 12,765 2,700,387
4 PricesGold US$/oz 1450 1450 1450 1450 1450 1450 1450 1450 1450 1450 1450 1450
5 Total revenueGold US$ - 461,807,383 448,185,081 442,519,621 430,077,348 378,369,893 389,566,178 409,781,743 391,022,649 358,670,959 187,051,536 18,509,008 3,915,561,399
Total Revenue US$ - 461,807,383 448,185,081 442,519,621 430,077,348 378,369,893 389,566,178 409,781,743 391,022,649 358,670,959 187,051,536 18,509,008 3,915,561,399

Atacama Pacific Gold Corporation Page 141 Cerro Maricunga Oxide Gold Project Preliminary Economic Assessment
Table 67Cash Flow Economical Model (cont)
Year -1 Year 1 Year 2 Year 3 Year 4 Year 5 Year 6 Year 7 Year 8 Year 9 Year 10 Year 11 TOTAL
6 Operating CostsMining US$ 77,447,042 110,891,926 120,121,481 114,500,144 113,786,596 115,175,231 106,898,360 92,874,100 66,902,037 34,811,017 2,870,982 956,278,915
Processing US$ 72,758,713 72,758,713 72,758,713 72,758,713 72,758,713 72,758,713 72,758,713 68,654,552 58,440,389 26,673,314 4,105,581 667,184,826
G&A US$ 15,382,143 15,382,143 15,382,143 15,382,143 15,382,143 15,382,143 15,382,143 14,096,364 10,896,404 4,497,222 390,770 137,555,761
Total Operating Cost US$ 165,587,898 199,032,782 208,262,337 202,641,000 201,927,452 203,316,086 195,039,215 175,625,016 136,238,830 65,981,553 7,367,333 1,761,019,501
Total Operating Cost US$/t 7.33 6.82 7.13 6.94 6.92 6.96 6.68 6.56 6.59 7.73 9.93 6.74
7 Operating Cash Flow US$ - 296,219,486 249,152,299 234,257,284 227,436,349 176,442,442 186,250,091 214,742,527 215,397,633 222,432,128 121,069,983 11,141,675 2,154,541,898
8 Cash CostCash cost US$/oz - 519.92 643.92 682.41 683.20 773.83 756.76 690.14 651.26 550.77 511.48 577.16 652.14
9 LeasingElectrical Supply US$ 2,073,188 2,073,188 2,073,188 2,073,188 2,073,188 2,073,188 2,073,188 2,073,188 2,073,188 2,073,188 - 20,731,879
Mining Equipment US$ 21,593,325 28,029,042 27,041,764 26,054,486 22,954,027 27,483,155 25,431,379 20,377,821 11,088,183 4,047,007 - 214,100,191
Total Leasing US$ - 23,666,512 30,102,230 29,114,952 28,127,674 25,027,215 29,556,343 27,504,567 22,451,009 13,161,371 6,120,195 - 234,832,070
10 Transport + insuranceGold US$ - 3,184,879 3,090,932 3,051,859 2,966,051 2,609,448 2,686,663 2,826,081 2,696,708 2,473,593 1,290,011 127,648 27,003,872
Total Transport + insuranceUS$ - 3,184,879 3,090,932 3,051,859 2,966,051 2,609,448 2,686,663 2,826,081 2,696,708 2,473,593 1,290,011 127,648 27,003,872
11 Net Revenue US$ - 269,368,095 215,959,138 202,090,473 196,342,624 148,805,779 154,007,085 184,411,879 190,249,916 206,797,165 113,659,777 11,014,027 1,892,705,957
12 Total cost per ounce, including leasing and transport + insurance
Total cost per ounce US$/oz - 604.23 751.31 787.81 788.03 879.74 876.77 797.46 744.51 613.98 568.92 587.16 749.10
13 Total Gross Margin US$ - 269,368,095 215,959,138 202,090,473 196,342,624 148,805,779 154,007,085 184,411,879 190,249,916 206,797,165 113,659,777 11,014,027 1,892,705,957
14 Reclamation US$ -
15 EBITDA US$ - 269,368,095 215,959,138 202,090,473 196,342,624 148,805,779 154,007,085 184,411,879 190,249,916 206,797,165 113,659,777 11,014,027 1,892,705,957

Atacama Pacific Gold Corporation Page 142 Cerro Maricunga Oxide Gold Project Preliminary Economic Assessment
Table 67Cash Flow Economical Model (cont)
Year -1 Year 1 Year 2 Year 3 Year 4 Year 5 Year 6 Year 7 Year 8 Year 9 Year 10 Year 11 TOTAL
16 Depreciation & AmortizationUS$ - 43,885,278 46,789,291 49,370,152 51,752,626 54,135,100 56,517,574 58,900,048 61,282,522 63,664,996 486,297,584
(see capex tab)
17 EBIT US$ - 225,482,817 169,169,847 152,720,321 144,589,998 94,670,679 97,489,511 125,511,832 128,967,394 143,132,169 113,659,777 11,014,027 1,406,408,373
18 Interests on debt US$ - - - - - - - - - - - - -
19 Sunk Costs US$ - 120,000,000 - - - - - - - - - - 120,000,000
20 EBT US$ - 105,482,817 169,169,847 152,720,321 144,589,998 94,670,679 97,489,511 125,511,832 128,967,394 143,132,169 113,659,777 11,014,027 1,286,408,373
21 TaxesChilean IEM (see IEM tab) - 5,753,788 4,457,786 4,108,490 3,851,504 2,175,451 2,319,569 2,913,412 2,876,024 2,848,561 439,685 - 31,744,270
Taxes (20%) US$ - 19,945,806 32,942,412 29,722,366 28,147,699 18,499,046 19,033,988 24,519,684 25,218,274 28,056,722 22,644,019 2,202,805 250,932,820
Total Taxes US$ - 25,699,594 37,400,198 33,830,856 31,999,203 20,674,496 21,353,557 27,433,096 28,094,298 30,905,283 23,083,703 2,202,805 282,677,091
22 Net Earnings US$ - 199,783,223 131,769,648 118,889,465 112,590,795 73,996,183 76,135,954 98,078,736 100,873,096 112,226,887 90,576,074 8,811,222 1,123,731,282
23 CASH FLOW US$ - 243,668,501 178,558,939 168,259,617 164,343,421 128,131,282 132,653,527 156,978,783 162,155,618 175,891,882 90,576,074 8,811,222 1,610,028,866
24 Net CapexCapex US$ 482,738,059 482,738,059
Pre-stripping US$ 17,131,893 17,131,893
Leasing US$ 14,687,913 14,687,913
Sustaining / Closure US$ 31,944,144 28,389,465 26,207,214 26,207,214 26,207,214 26,207,214 26,207,214 26,207,214 26,207,214 - 5,250,000 249,034,105
Total Capex US$ 514,557,865 31,944,144 28,389,465 26,207,214 26,207,214 26,207,214 26,207,214 26,207,214 26,207,214 26,207,214 - 5,250,000 763,591,971
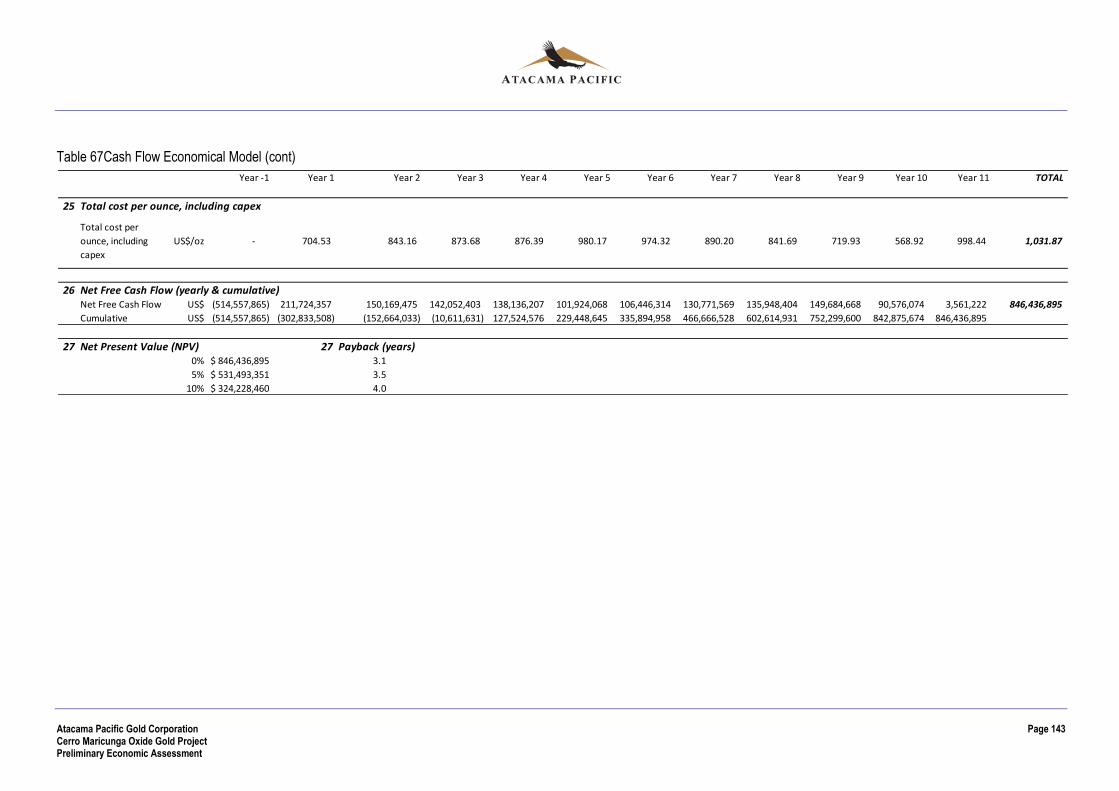
Atacama Pacific Gold Corporation Page 143 Cerro Maricunga Oxide Gold Project Preliminary Economic Assessment
Table 67Cash Flow Economical Model (cont)
Year -1 Year 1 Year 2 Year 3 Year 4 Year 5 Year 6 Year 7 Year 8 Year 9 Year 10 Year 11 TOTAL
25 Total cost per ounce, including capex
Total cost per
ounce, including
capex
US$/oz - 704.53 843.16 873.68 876.39 980.17 974.32 890.20 841.69 719.93 568.92 998.44 1,031.87
26 Net Free Cash Flow (yearly & cumulative)Net Free Cash Flow US$ (514,557,865) 211,724,357 150,169,475 142,052,403 138,136,207 101,924,068 106,446,314 130,771,569 135,948,404 149,684,668 90,576,074 3,561,222 846,436,895
Cumulative US$ (514,557,865) (302,833,508) (152,664,033) (10,611,631) 127,524,576 229,448,645 335,894,958 466,666,528 602,614,931 752,299,600 842,875,674 846,436,895
27 Net Present Value (NPV) 27 Payback (years)0% $ 846,436,895 3.1
5% $ 531,493,351 3.5
10% $ 324,228,460 4.0
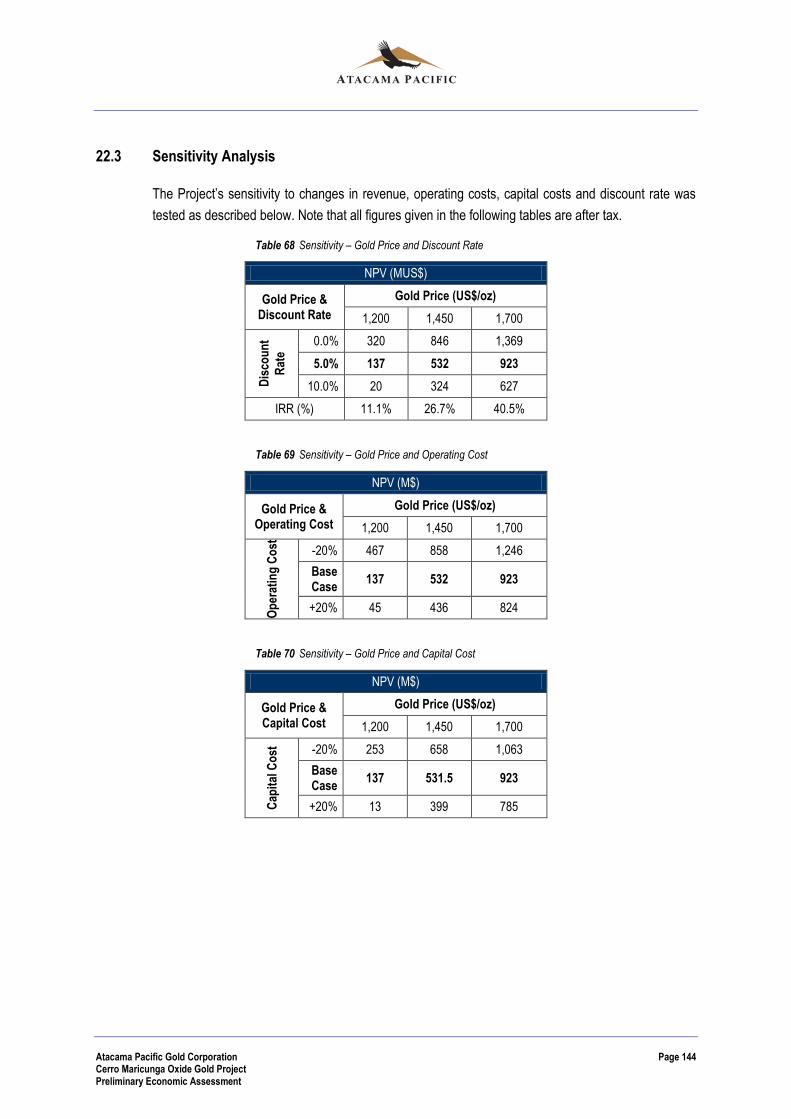
Atacama Pacific Gold Corporation Page 144 Cerro Maricunga Oxide Gold Project Preliminary Economic Assessment
22.3 Sensitivity Analysis
The Project’s sensitivity to changes in revenue, operating costs, capital costs and discount rate was
tested as described below. Note that all figures given in the following tables are after tax.
Table 68 Sensitivity – Gold Price and Discount Rate
NPV (MUS$)
Gold Price & Discount Rate
Gold Price (US$/oz)
1,200 1,450 1,700
Dis
cou
nt
Rat
e
0.0% 320 846 1,369
5.0% 137 532 923
10.0% 20 324 627
IRR (%) 11.1% 26.7% 40.5%
Table 69 Sensitivity – Gold Price and Operating Cost
NPV (M$)
Gold Price & Operating Cost
Gold Price (US$/oz)
1,200 1,450 1,700
Op
erat
ing
Co
st
-20% 467 858 1,246
Base Case
137 532 923
+20% 45 436 824
Table 70 Sensitivity – Gold Price and Capital Cost
NPV (M$)
Gold Price & Capital Cost
Gold Price (US$/oz)
1,200 1,450 1,700
Cap
ital
Co
st
-20% 253 658 1,063
Base Case
137 531.5 923
+20% 13 399 785
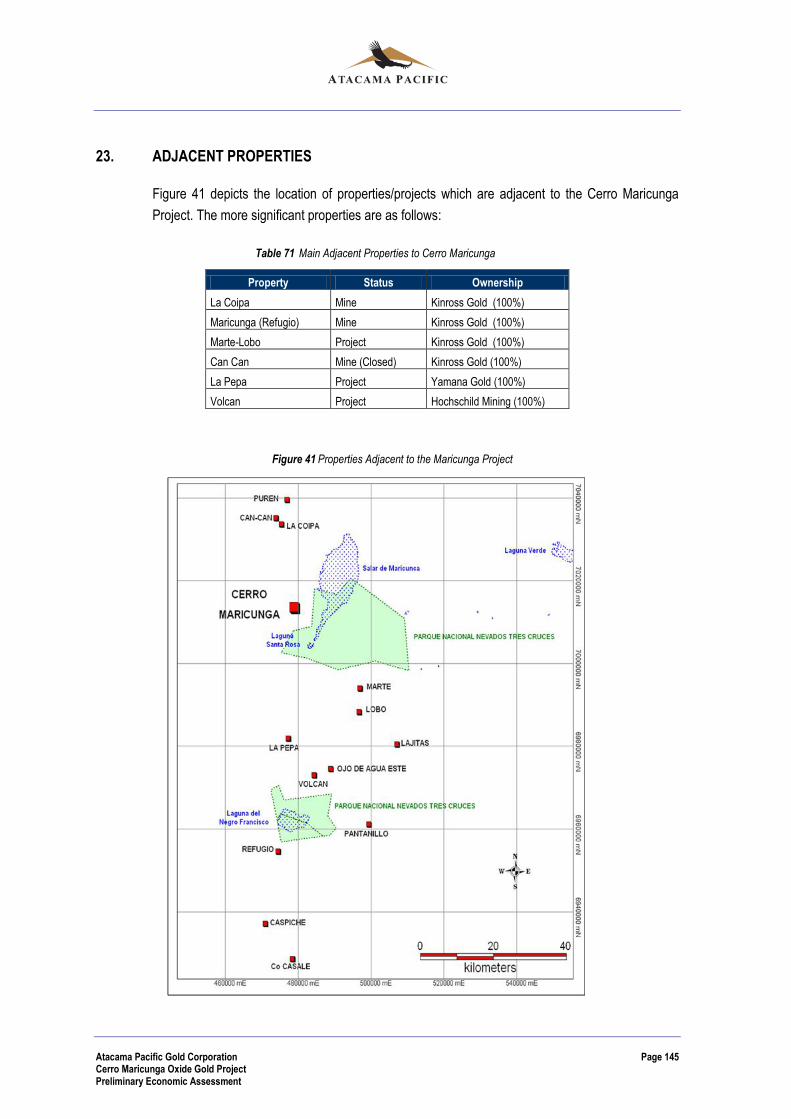
Atacama Pacific Gold Corporation Page 145 Cerro Maricunga Oxide Gold Project Preliminary Economic Assessment
23. ADJACENT PROPERTIES
Figure 41 depicts the location of properties/projects which are adjacent to the Cerro Maricunga
Project. The more significant properties are as follows:
Table 71 Main Adjacent Properties to Cerro Maricunga
Property Status Ownership
La Coipa Mine Kinross Gold (100%)
Maricunga (Refugio) Mine Kinross Gold (100%)
Marte-Lobo Project Kinross Gold (100%)
Can Can Mine (Closed) Kinross Gold (100%)
La Pepa Project Yamana Gold (100%)
Volcan Project Hochschild Mining (100%)
Figure 41 Properties Adjacent to the Maricunga Project
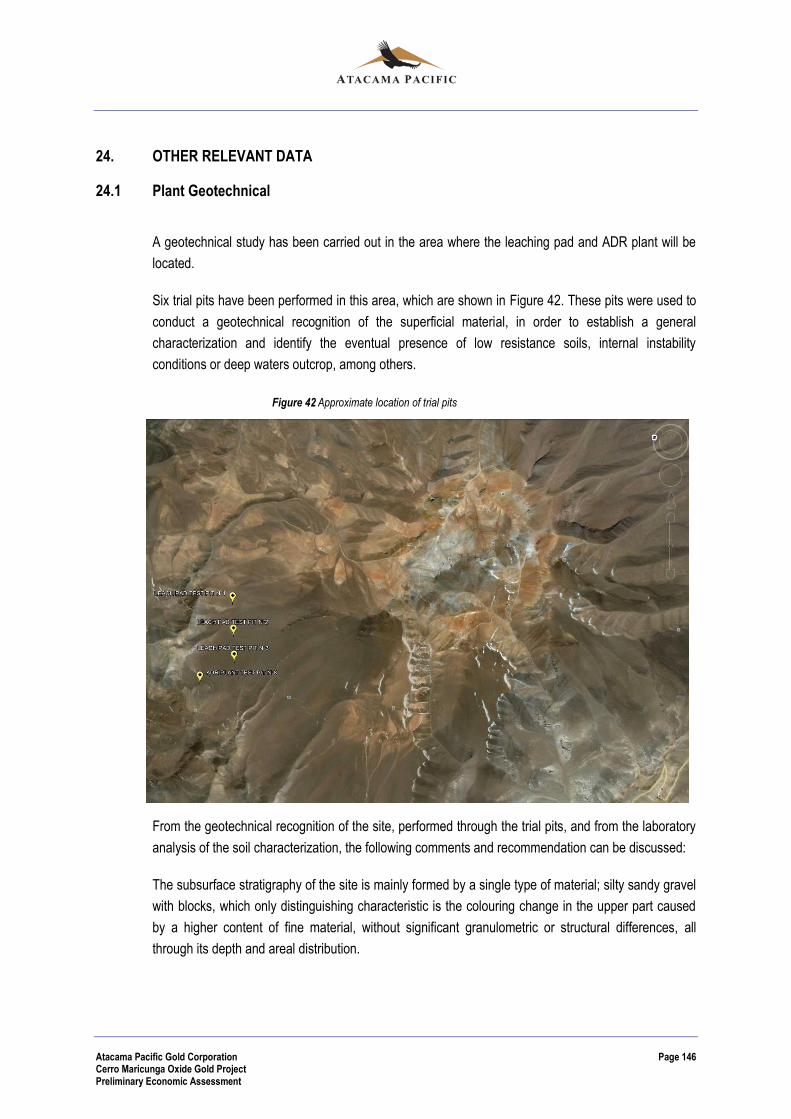
Atacama Pacific Gold Corporation Page 146 Cerro Maricunga Oxide Gold Project Preliminary Economic Assessment
24. OTHER RELEVANT DATA
24.1 Plant Geotechnical
A geotechnical study has been carried out in the area where the leaching pad and ADR plant will be
located.
Six trial pits have been performed in this area, which are shown in Figure 42. These pits were used to
conduct a geotechnical recognition of the superficial material, in order to establish a general
characterization and identify the eventual presence of low resistance soils, internal instability
conditions or deep waters outcrop, among others.
Figure 42 Approximate location of trial pits
From the geotechnical recognition of the site, performed through the trial pits, and from the laboratory
analysis of the soil characterization, the following comments and recommendation can be discussed:
The subsurface stratigraphy of the site is mainly formed by a single type of material; silty sandy gravel
with blocks, which only distinguishing characteristic is the colouring change in the upper part caused
by a higher content of fine material, without significant granulometric or structural differences, all
through its depth and areal distribution.
Atacama Pacific Gold Corporation Page 147 Cerro Maricunga Oxide Gold Project Preliminary Economic Assessment
According to the above, the natural soil stratum can be used as a foundation soil, from the minimal
seal depth established (0.5 m) and as long as the contact pressures are restricted to the
recommended values.
It is convenient that the foundations support is constructed over a layer of equal or higher stiffness
than the intact natural soil; it is recommended that once the excavations reach the seal depth, a
mechanical compacting shall be performed over the superficial material of the seal, in order to reach
at least a 95% of the maximum density obtained in the Procter test.
24.2 Operations Project Organisation
The process plant personnel have been estimated as follows:
Operations and maintenance personnel were classified into two roles; (A) for managers/supervisors
and (B) for employees.
To determine role (A) human resources, an estimation was made of a typical administrative day’s work
as well as the number of workers necessary per shift, considering absenteeism, vacations and
substitute workers.
To determine role (B) human resources, the total allowance required by shift is estimated, considering
absenteeism, vacations and substitute workers.
For regular operations, four shifts are considered in order to satisfy the two shifts per day working
requirement, plus two “swing” shift.
For mechanical and electrical maintenance operations, four shifts are considered in order to satisfy the
two shifts per day working requirement, plus two “swing” shift.
Two supervisor and two instrumentation maintenance employees are considered, in order to satisfy
the one shift per day working requirement (one operating and the other one waiting for their shift).
The following table shows both the operations personnel and the maintenance personnel considered
for the process plant. The operations personnel are organized by plant areas, according to crushing,
heap leaching and solution management and ADR, EW and smelting.

Atacama Pacific Gold Corporation Page 148 Cerro Maricunga Oxide Gold Project Preliminary Economic Assessment
Table 72 Process plant personnel
24.3 Project Implementation
Atacama Pacific must complete an environmental impact study, a feasibility study and an EPCM
contract, in order to meet all the required technical studies for the Cerro Maricunga project
development to commence.
Once the regional authorities approve the environmental impact study, a construction program and
pre-stripping activities can commence.
The construction phase of the Cerro Maricunga Project is estimated to last 19 months, beginning in
August 2015. The climatic conditions and altitude are of consideration, with major foundation work to
be completed during the early summer months.
Advanced Economic Studies July 2013 – April 2014
Environmental Impact Preparation August 2013 – June 2014
Permitting / EPCM Contract August 2013 – August 2015
Construction August 2015 – March 2017
Start up and Commissioning March 2017 – June 2017
Primary,
Secondary and
Tertiary Crushing
Heap leaching,
solution
management
ADR - EW -
SmeltingTotal
10 6 5 21Operation supervisor Role A 2 2 1 5Control room operator Role B 4 0 0 4Ground operator Role B 4 4 4 12
13 0 0 13Maintenance supervisor Role A 1 0 0 1Supervisors Role B 2 0 0 2Mechanics Role B 4 0 0 4Electricians Role B 4 0 0 4Instrumentalists Role B 2 0 0 2
23 6 5 34
10 6 5 21
2 2 1 5
8 4 4 16
13 0 0 13
1 0 0 1
12 0 0 12
23 6 5 34
3 2 1 6
20 4 4 28
Role A
Personnel
Operation
Maintenance
Total
Operation
Role B
Role B
Maintenance
Role A
Role B
Total
Role A
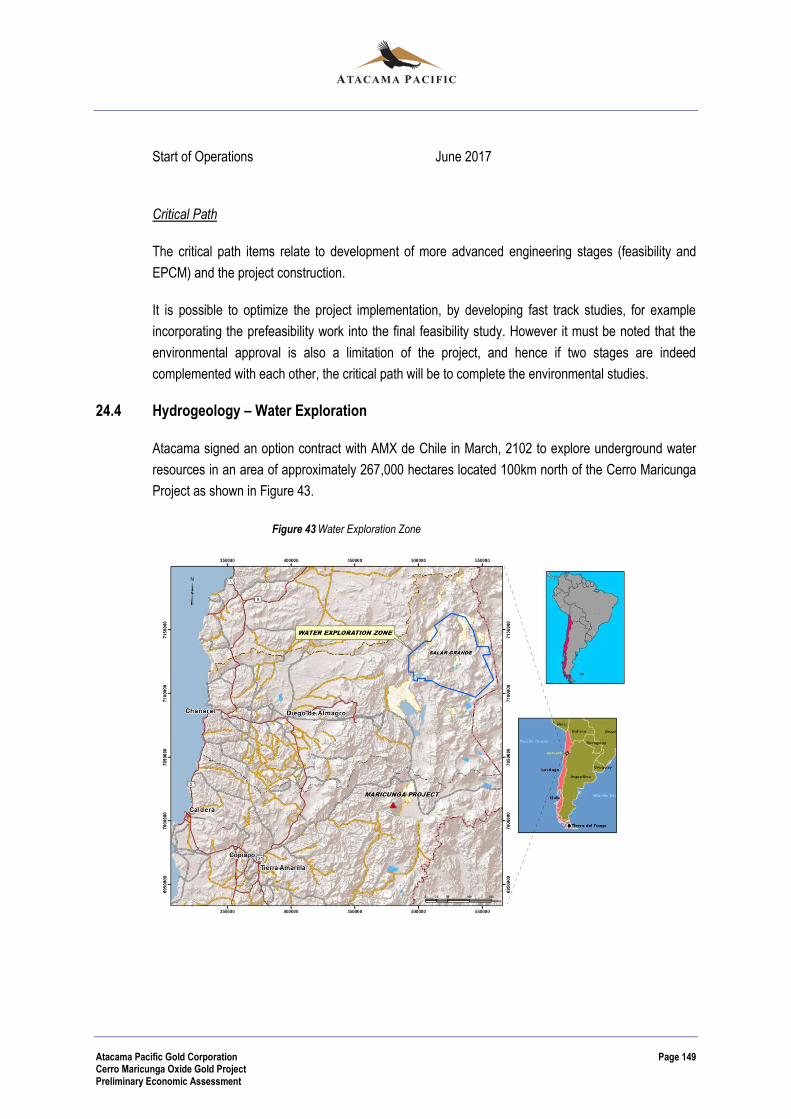
Atacama Pacific Gold Corporation Page 149 Cerro Maricunga Oxide Gold Project Preliminary Economic Assessment
Start of Operations June 2017
Critical Path
The critical path items relate to development of more advanced engineering stages (feasibility and
EPCM) and the project construction.
It is possible to optimize the project implementation, by developing fast track studies, for example
incorporating the prefeasibility work into the final feasibility study. However it must be noted that the
environmental approval is also a limitation of the project, and hence if two stages are indeed
complemented with each other, the critical path will be to complete the environmental studies.
24.4 Hydrogeology – Water Exploration
Atacama signed an option contract with AMX de Chile in March, 2102 to explore underground water
resources in an area of approximately 267,000 hectares located 100km north of the Cerro Maricunga
Project as shown in Figure 43.
Figure 43 Water Exploration Zone
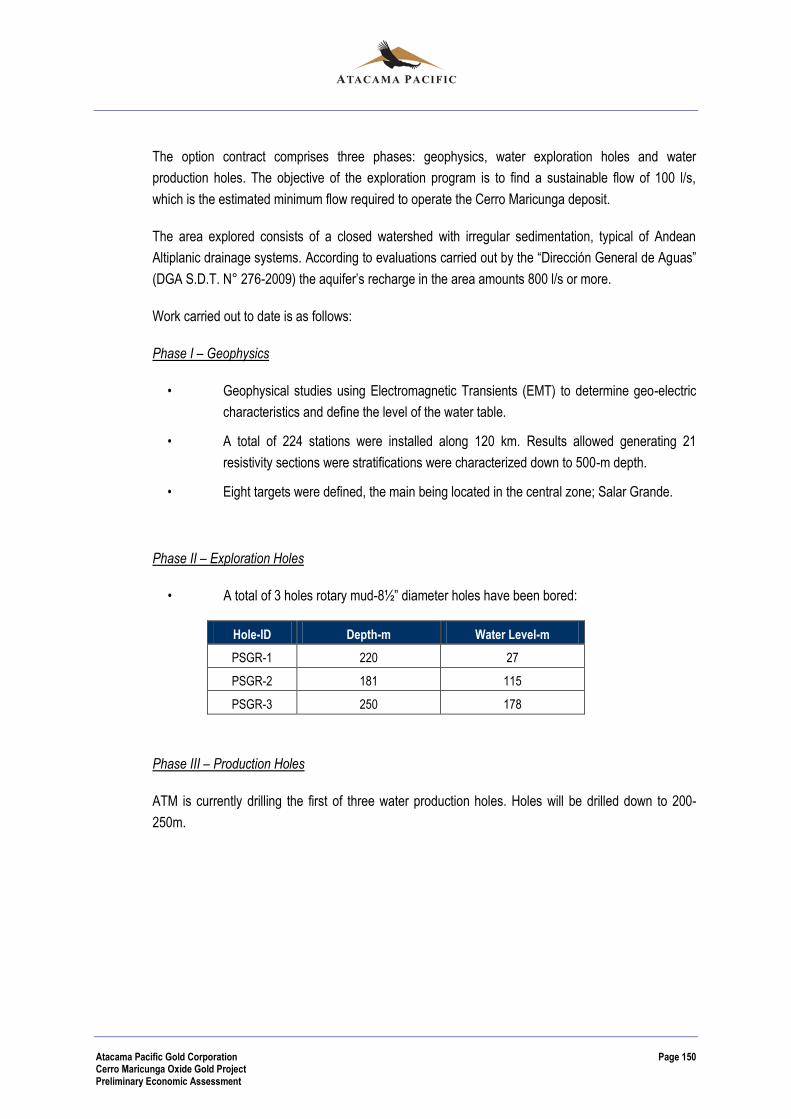
Atacama Pacific Gold Corporation Page 150 Cerro Maricunga Oxide Gold Project Preliminary Economic Assessment
The option contract comprises three phases: geophysics, water exploration holes and water
production holes. The objective of the exploration program is to find a sustainable flow of 100 l/s,
which is the estimated minimum flow required to operate the Cerro Maricunga deposit.
The area explored consists of a closed watershed with irregular sedimentation, typical of Andean
Altiplanic drainage systems. According to evaluations carried out by the “Dirección General de Aguas”
(DGA S.D.T. N° 276-2009) the aquifer’s recharge in the area amounts 800 l/s or more.
Work carried out to date is as follows:
Phase I – Geophysics
• Geophysical studies using Electromagnetic Transients (EMT) to determine geo-electric
characteristics and define the level of the water table.
• A total of 224 stations were installed along 120 km. Results allowed generating 21
resistivity sections were stratifications were characterized down to 500-m depth.
• Eight targets were defined, the main being located in the central zone; Salar Grande.
Phase II – Exploration Holes
• A total of 3 holes rotary mud-8½” diameter holes have been bored:
Hole-ID Depth-m Water Level-m
PSGR-1 220 27
PSGR-2 181 115
PSGR-3 250 178
Phase III – Production Holes
ATM is currently drilling the first of three water production holes. Holes will be drilled down to 200-
250m.
Atacama Pacific Gold Corporation Page 151 Cerro Maricunga Oxide Gold Project Preliminary Economic Assessment
25. INTERPRETATION AND CONCLUSIONS
25.1 Mineral Resource
25.2 Mining Studies
No mineral reserves have been declared within this current study.
Preliminary mining studies have been completed using the resource estimate as of November 9, 2012,
and include de following aspects:
Pit optimization using Whittle FX to determine the ultimate pits limits.
A final have been proposed for Cerro Maricunga. Bench and overall pit slope design was
based on recommendations by the geotechnical consultants (AKL).
Open pit contained mineral inventory amounts to 261 million tonnes at an average grade of
0.40 g/t Au. Inferred mineral resources have been included that are considered too speculative
geologically to have the economic considerations applied to them that would enable them to be
categorised as mineral reserves.
Waste storage areas close to the pits were designed in accordance with geotechnical
recommendations.
Identification of suitable mining equipment types and calculation of mining fleet requirements
for open pit mining.
Estimates of both mine capital (CAPEX) and operating (OPEX) costs. Capital costs consider
owner-operator mining, and include a provision for preproduction mining. Replacement and
additional equipment purchase costs have been included over the life of Project.
The mining operating cost (OPEX) estimate is dominated by equipment operating costs (fuel,
tyres, labour, and maintenance). Blasting, administration/management and services have also
been included.
25.3 Metallurgical Information and Process Design
Cerro Maricunga envisions a conventional plant for the treatment of its gold bearing material,
according to the following process: three stages crushing of the whole mineralized material, transport
of the crushed material to the leaching heap through a belt system, gold leaching in heaps with NaCN,
treatment of the pregnant leaching solution in an ADR plant (carbon adsorption) and gold recovery as
dore bullion through an electrowinning and smelting process.
To evaluate the feasibility of processing the material through heap leaching and to determine the
optimum design of the crushing plant, metallurgical testwork was carried out with Cerro Maricunga
mineralized material, according to:
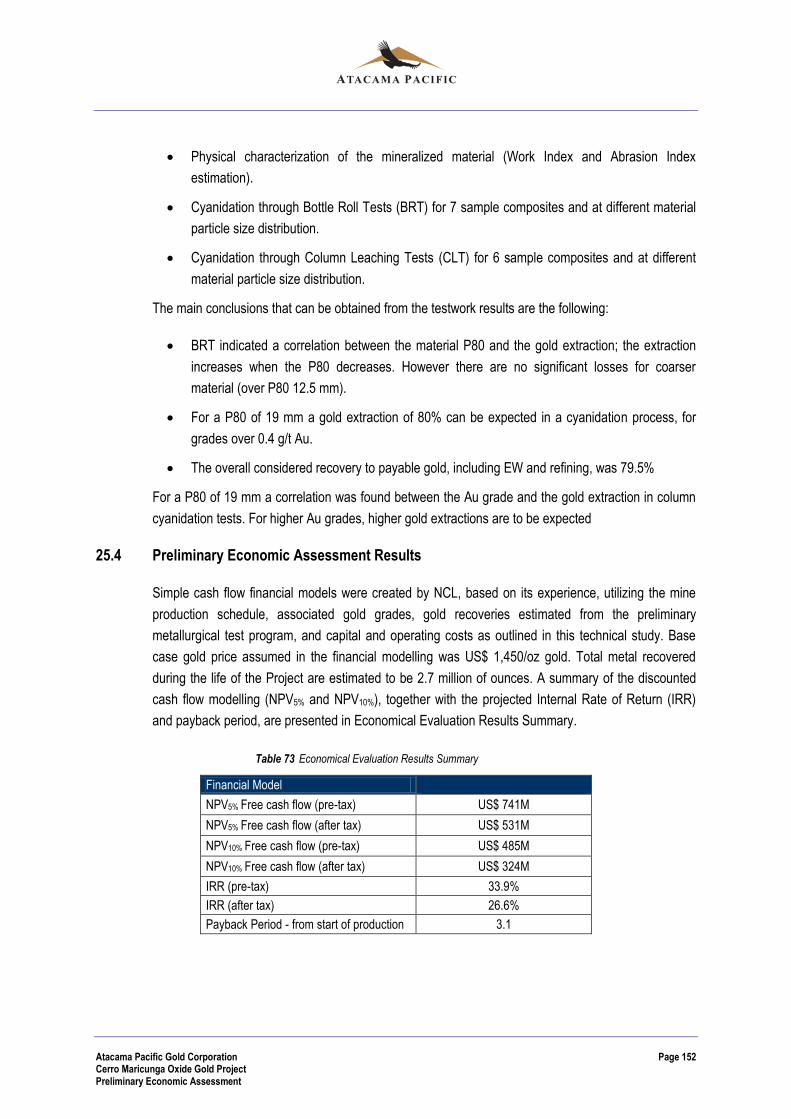
Atacama Pacific Gold Corporation Page 152 Cerro Maricunga Oxide Gold Project Preliminary Economic Assessment
Physical characterization of the mineralized material (Work Index and Abrasion Index
estimation).
Cyanidation through Bottle Roll Tests (BRT) for 7 sample composites and at different material
particle size distribution.
Cyanidation through Column Leaching Tests (CLT) for 6 sample composites and at different
material particle size distribution.
The main conclusions that can be obtained from the testwork results are the following:
BRT indicated a correlation between the material P80 and the gold extraction; the extraction
increases when the P80 decreases. However there are no significant losses for coarser
material (over P80 12.5 mm).
For a P80 of 19 mm a gold extraction of 80% can be expected in a cyanidation process, for
grades over 0.4 g/t Au.
The overall considered recovery to payable gold, including EW and refining, was 79.5%
For a P80 of 19 mm a correlation was found between the Au grade and the gold extraction in column
cyanidation tests. For higher Au grades, higher gold extractions are to be expected
25.4 Preliminary Economic Assessment Results
Simple cash flow financial models were created by NCL, based on its experience, utilizing the mine
production schedule, associated gold grades, gold recoveries estimated from the preliminary
metallurgical test program, and capital and operating costs as outlined in this technical study. Base
case gold price assumed in the financial modelling was US$ 1,450/oz gold. Total metal recovered
during the life of the Project are estimated to be 2.7 million of ounces. A summary of the discounted
cash flow modelling (NPV5% and NPV10%), together with the projected Internal Rate of Return (IRR)
and payback period, are presented in Economical Evaluation Results Summary.
Table 73 Economical Evaluation Results Summary
Financial Model
NPV5% Free cash flow (pre-tax) US$ 741M
NPV5% Free cash flow (after tax) US$ 531M
NPV10% Free cash flow (pre-tax) US$ 485M
NPV10% Free cash flow (after tax) US$ 324M
IRR (pre-tax) 33.9%
IRR (after tax) 26.6%
Payback Period - from start of production 3.1
Atacama Pacific Gold Corporation Page 153 Cerro Maricunga Oxide Gold Project Preliminary Economic Assessment
26. RECOMMENDATIONS
26.1 Drilling
Continue the current balanced drilling strategy of targeted infill drilling to increase resource
confidence and extensional resource definition drilling to add additional mineral resources;
Continue to update relevant mineral resource estimates for all significant mineralized zones to
reflect ongoing changes to mineral resource confidence and the overall Cerro Maricunga
mineral resource base;
26.2 Mining
Continue mine engineering and planning studies to define and confirm the economic viability of
the Project, and move towards development stage.
Define grade-control requirements for open pit.
Continue geotechnical testwork and studies including drilling geotechnical holes for open pit.
26.3 Proposed Budget
A budget of US$23 million is proposed to cover exploration and development-related studies at the
Project in 2013. This exploration program is budgeted to comprise approximately 20,000 metres of
drilling along with a program of bulk metallurgical sampling for bench plant test work. The majority of
the drill program (approximately 15,000 metres) will be dedicated to upgrade current Inferred
Resources. Exploration targets will also be tested and defined if warranted with the remaining
budgeted drilling metreage. In addition to drilling, the will include continued metallurgical test work,
with 14 column percolation leach tests presently underway, along with engineering studies and the
collection of environmental baseline data in support of future permitting.
Atacama Pacific Gold Corporation Page 154 Cerro Maricunga Oxide Gold Project Preliminary Economic Assessment
27. REFERENCES
Bartlett, M.G., Chapman, D., and Harris, R., 2004; Snow and the Ground Temperature Record
of Climate Change: Journal of Geophysical Research, Vol. 109, pp. 10-29.
Cornejo, P., et al. 1998. Hoja Salar de Maricunga, Región de Atacama. Escala 1:100,000.
Servicio Nacional de Geología y Minería, Chile. Mapas Geológicos N°7.
Cornejo, P., 2008; Petrographic study of selected samples from Co. Maricunga.
Cornejo, P., 2011; Informe preliminar descripciones petrográficas de muestras de Proyecto
Cerro Maricunga. Unpublished Internal Report prepared for Minera Atacama Pacific Gold Chile
Ltda. June 2011.
Dietrich, A., Dec., 2010; Report October-December, 2010, Ojo de Maricunga Prospect;
prepared for Minera Atacama Pacific Gold Chile.
Dietrich, A., Apr., 2011; Report January-April, 2011, Reconnaissance Map at 1:25,000 scale of
the Ojo de Maricunga District Area; prepared for Minera Atacama Pacific Gold Chile.
Geoexploraciones Ltda, May, 2003; VolcanCopiapó Geology and Mineral Potential, Maricunga
District, Chile: Unpub. Report prepared for MineraCameco Chile Ltda.
Gold Fields Chile S.A. Exploration and Development; 30 April, 2009; Monthly Report – April,
2009, SBX Projects.
Gold Fields Chile S.A.; 30 June, 2009; Monthly Report – May, 2009, SBX Projects.
Gold Fields Chile S.A.; 9 July, 2009; Monthly Report – June, 2009, SBX Projects.
Gold Fields Chile S.A.; 6 August, 2009; Monthly Report – July, 2009, SBX Projects.
Ortuzar, A, July. 2011; Legal Opinion on the Status of the Cerro Maricunga Concessions;
prepared by Cruzát, Ortúzar, &MacKenna, Baker McKenzie International, on behalf of Atacama
Minerals Inc.
Vila, T., et al, 1991; Gold-rich Porphyry Systems in the Maricunga Belt, Northern Chile; Econ.
Geology; A special Issue devoted to the Gold deposits of the Chilean Andes; Vol. 86, No. 6.
Viteri, E., Aug., 2010; Santa Teresa Gold Silver Prospect.
Magri, E, November 2012; Technical Report on the Cerro Maricunga Gold Project, Region III
Chile.
Atacama Pacific Gold Corporation Page 155 Cerro Maricunga Oxide Gold Project Preliminary Economic Assessment
AMTEL, “Evaluation of 2010 Leach Tests of Cerro Maricunga Gold Ores. Report 11/04”,
January 2011. It includes Kappes, Cassiday & Assoc. “Maricunga Project. Report of
Metallurgical Test Works”, November 2010.
AMTEL, “4th Process Report on Cerro Maricunga Ore Leach Testwork: Summary of BRT
Results (as of July 21, 2011). Report 11/31”, July 2011.
AMTEL, “Evaluation of 2011 Leach Tests of Cerro Maricunga Gold Ores”, December 2011.
Estudio Geotécnico Plataforma Pilas de Lixiviación