preliminary data summary for the petroleum refining ... · preliminary data summary for the ....
TRANSCRIPT

Preliminary Data Summary for the
Petroleum Refining Category United States Environmental Protection Agency Office of Water Engineering and Analysis Division 401 M Street, S.W. Washington, D.C. 20460 EPA 821-R-96-015 April 1996

i
Table of Contents List of Figures iv
List of Tables v
Acknowledgments vii 1. Introduction 1
1.1 Background 1
1.2 Status of Categorical Regulations 1
1.3 Software Disk Available 4
2. Description of the Industry 5
2.1 Production Operations 5
2.1.1 Crude Oil and Product Storage 5
2.1.2 Crude Distillation 5
2.1.3 Cracking 6
2.1.4 Hydrocarbon Rebuilding 6
2.1.5 Hydrocarbon Rearrangements 6
2.1.6 Hydrotreating 6
2.1.7 Solvent Refining 7
2.1.8 Asphalt Production 7
2.1.9 Lubricating Oil Manufacture 7
2.1.10 Production of Petrochemicals 8
2.2 Industry Trends 8
3. Summary of Information Sources Used in This Study 13
3.1 Oil And Gas Journal Survey 13
3.2 EPA Office of Air and Radiation Questionnaire 13
3.3 Plant Visits 13
3.4 Permit Compliance System Data 13
3.5 Los Angeles County Sanitation Districts 14
3.6 Other Sewerage Authorities 14
3.7 Province of Ontario, Canada Petroleum Study 14
3.8 Other Data Sources 14
4. Treatment Technologies Used in The Industry 15
4.1 In-Plant Controls 16
4.1.1 Steam Stripping 16
4.1.2 Neutralization of Spent Acids and Caustics 18
4.1.3 Source Control 18
4.1.4 Wastewater Segregation 18
4.1.5 Boiler Condensate Recovery 19
4.1.6 Treated Effluent Reuse 19

ii
4.1.7 Other General Measures 19
4.1.8 Cooling Water Systems 19
4.1.9 Once-Through Cooling Water Systems 20
4.1.10 Cooling Tower Systems 21
4.2 End-of-Pipe Treatment Technologies 21
4.2.1 Preliminary Treatment 21
4.2.2 Biological Treatment 22
4.2.3 Effluent Polishing 23
4.2.3 Activated Carbon Treatment 24
4.2.5 Technologies Used at EPA/OAR Survey Refineries 24
4.2.6 Performance of End-of-Pipe Systems 26
4.2.7 Storm Water Management 29
5. Water Use 30
6. Pretreatment Standards Review And Catalytic Reformer Issues 39
6.1 Indirect Discharging Refineries 39
6.1.1 Treatment Technologies 39
6.2 Dioxins in Catalytic Reformer Wastewaters 45
6.2.1 Waste Characterization 47
6.2.2 Available Treatment Technologies 54
7. Evaluation of Pollutant Discharges And Environmental Issues 58
7.1 Identification And Quantification of Pollutant Releases 58
7.1.1 Permit Compliance System 63
7.1.2 Estimation of Annual Pollutant Loads from PCS 64
7.1.3 Analysis of Average Measured Pollutant Concentrations from PCS 78
7.1.4 Toxic Release Inventory 83
7.1.5 Reported Annual Pollutant Loads from TRI 83
7.2 Fate and Toxicity Evaluation of Released Pollutants 88
7.2.1 Compilation of Physical-Chemical and Toxicity Data and Information to Evaluate Indirect Discharges 88
7.2.2 Categorization of Pollutants 90
7.2.3 Toxic Weighting Factor Analysis 97
7.2.4 Whole Effluent Toxicity Testing 100
7.3 Documented Impacts 102
8. Economic Profile of the Petroleum Refining Industry 104
8.1 U.S. Petroleum Refinery Geographic Distribution and Trends 104
8.1.1 Number and Distribution of Refineries 104
8.1.2 Trends in the Number of Refineries 107
8.2 Economic Profile 109
8.2.1 The FRS Companies 109

iii
8.2.2 Refined Product Margins 112 8.2.3 Refined Products Imports 112
8.3 Impacts of Environmental Regulations 113
8.3.1 Air Pollution Abatement Expenditures 116
8.3.2 Water Pollution Abatement Expenditures 117
Bibliography 120
Index 123

iv
List of Figures 2.1 Number of Refineries per State .............................................................................................10 2.2 Number of Refineries Since 1982 ..........................................................................................12 5.1 Water Use Trends (Graph) .....................................................................................................31 5.2 Comparison of Flow Predicted by BPT and BAT Models (Graph) .......................................33 7.1 Geographic Distribution of 1991 TRI Chemical Releases and Transfers (Map) ...................85 7.2 1991 TRI Priority Pollutant Releases to Surface Water and POTWs (Graphs).....................87 7.3 Ecological Impact Potential (Scatter Plot) .............................................................................95 7.4 Human Health Impact Potential (Scatter Plot) ......................................................................97 8.1 Refinery Pollution Abatement Operating Expenditures (Graph) .........................................115 8.2 Refinery Pollution Abatement Capital Expenditures (Graph) .............................................116

v
List of Tables 2.1 Capacity and Number of United States Refineries in 1991 vs. 1976 .......................................8 4.1 Demonstrated Wastewater Technologies for In-Plant Treatment of Refinery Process Streams
............................................................................................................................................17 4.2 Advantages and Disadvantages of Different Types of Cooling Systems...............................20 4.3 Summary of Current Wastewater Treatment Technologies for 27 Refineries Surveyed .......25 4.4 Summary of Effluent Data: Six Site Visits ............................................................................27 4.5 Summary of Refinery Effluent Data: Canadian Study and PCS Data ...................................28 4.6 Refinery Storm Water Management Practices .......................................................................29 5.1 Predicted and Actual Wastewater Flows for 27 Refineries ...................................................32 5.2 Selected Sources of Wastewaters ..........................................................................................36 5.3 Water Use: Six Site Visits .....................................................................................................38 6.1 Summary Comparison of Locations and Capacities for Indirect Dischargers Between 1976
and 1991 .............................................................................................................................40 6.2 Summary of Discharge Data for Major Refineries Discharging to Los Angeles County
Sanitation Districts (LACSD) ............................................................................................42 6.3 Summary of Discharge Data for Major Refineries Discharging to Local POTWs ................43 6.4 Data Comparison: Indirect Discharging Refineries ...............................................................45 6.5 Shell Canada Products Limited, Sarnia Refinery Range of Dioxins/Furans in Internal Shell
Wastewaters .......................................................................................................................48 6.6 Esso Petroleum Canada, Sarnia Refinery Powerformer Regeneration Study ........................48 6.7 Catalytic Reforming Data: Six Site Visits .............................................................................50 6.8 Summary of CDD/CDF Data for Chevron Richmond Refinery ............................................51 6.9 Summary of CDD/CDF Data for Tosco Martinez Refinery ..................................................52 6.10 Summary of CDD/CDF Data for Unocal Rodeo Refinery ..................................................53 6.11 Suncor-Sarnia Catalytic Reformer Wastewater Treatment ..................................................56 6.12 Shell Canada-Sarnia, Catalytic Reformer Wastewater Treatment Spent Caustic ................57 7.1 Refinery Wastewater Constituents .........................................................................................58 7.2 1992 Annual Loading Data from PCS ...................................................................................65 7.3 Crude Production for 138 Direct Discharging Petroleum Refineries ....................................70 7.4 Comparison of California and Non-California PCS Loads after Production Weighting
(Low-End Estimate) ...........................................................................................................75 7.5 Comparison of California and Non-California PCS Loads after Production Weighting
(High-End Estimate) ..........................................................................................................77 7.6 Comparison of California and Non-California PCS Concentration Data (Low End Estimate)
............................................................................................................................................80 7.7 Comparison of California and Non-California PCS Concentration Data (High-End
Estimate) ............................................................................................................................81 7.8 Direct Discharge Pollutant Concentration Levels Reported in 1982 Effluent Guidelines
Development Document (Current/BPT) ............................................................................82 7.9 POTW Information for Selected Indirect Discharges ............................................................89

vi
7.10 Number of Pollutants by Categorization Group ..................................................................92 7.11 Number of Pollutants with Health Effect Designations .......................................................92 7.12 Petroleum Refining Annual Loads from PCS and TRI .....................................................100 8.1 Number and Capacity of Operable Petroleum Refineries ....................................................105 8.2 Number and Capacity of Refineries in California, Louisiana, and Texas ...........................106 8.3 States with No Refining Capacity ........................................................................................107 8.4 Number of Operable Refineries ...........................................................................................108 8.5 Income from Refining and Marketing Operations ...............................................................110 8.6 Composite Refiner Margin ..................................................................................................111 8.7 Refined Product Import Volumes ........................................................................................112 8.8 National Petroleum Council Estimates of Incremental Cost to Meet the New CAAA
Requirements ...................................................................................................................116 8.9 National Petroleum Council Estimate of Emission Control Investment (by Emission Type)
..........................................................................................................................................117 8.10 National Petroleum Council Estimates of Incremental Cost to Meet the New Requirements
of Clean Water Act Reauthorization ................................................................................118 8.11 National Petroleum Council Estimate for Water Pollution Control Investments ..............119 8.12 National Petroleum Council Projection for Water Pollution Control Investments by Time
Period ...............................................................................................................................119
vii
Acknowledgments
EPA prepared this report with contract support from Science Applications International Corporation (SAIC) under the direction of Barry S. Langer, Project Manager with assistance by K.C. Mahesh, Project Engineer.
Annette Huber and Ed Gardetto of EPA's Exposure Assessment Branch, Standards and Applied Science Division, provided substantial input by analyzing Permit Compliance System (PCS) data, estimating loadings, and writing Section 7 of the report on environmental issues.
Joe Ford and Bill Anderson of EPA's Economic and Statistical Analysis Branch, Engineering and Analysis Division (EAD) wrote Section 8 (Economic Information). Marvin Rubin, Chief, Energy Branch, EAD provided substantial comments on the report. Jim Durham of EPA's Office of Air Quality, Planning and Standards (OAQPS) helped provide updated data on wastewater flow by adding questions to the OAR Clean Air Act questionnaire. Ed McHam and EPA Region 6 staff provided comments pertaining to the permitting program. Many thanks to Dottie Grosse, Carol Swann and Eric Strassler of EAD for editing and word processing to prepare the document for distribution.
EPA appreciates the efforts of the American Petroleum Institute (API) and Alison Kerester for their assistance. Dave Pierce of the Chevron Corporation and the API Refinery Effluent Task Force helped to set up a number of site visits as requested by EPA.
Paul Martyn and Brent Perry of the Los Angeles County Sanitation Districts (LACSD) provided much of the data from refineries that discharge to POTWs. API, National Petroleum Refiners Association, Citizens for a Better Environment, LACSD and staff from EPA's Region VI and VIII offices provided comments on the draft report.
We also thank the staffs of refineries that granted EPA tours of their facilities and provided requested data: Chevron refineries located in Richmond, CA and Philadelphia, PA; Unocal, Rodeo, CA; Shell, Martinez, CA.; Tosco, Martinez, CA.; and Phillips, Borger, TX.
Ron Kirby EPA Task Manager

1
1. Introduction 1.1 Background
The purpose of this study is to provide information for determining whether the current effluent limitations guidelines and standards for the petroleum refining industry contained within Title 40 of the U.S. Code of Federal Regulations at Part 419 (cited as 40 CFR 419), should be revised or updated. This study was conducted to meet EPA's obligations under Section 304(m) of the Clean Water Act (CWA), in accordance with a consent decree in Natural Resources
Defense Council et al v. Reilly (D.D.C. 89-2980, January 31, 1992).
This report is a compilation of data collected during 1992 and 1993, and includes comparisons with data collected in the late 1970's which formed the basis of the existing limitations. The industry has changed significantly since the 1970's and this report summarizes and evaluates these changes. 1.2 Status of Categorical Regulations
EPA's effluent limitations guidelines and standards program was initiated as one of the major provisions of the 1972 Federal Water Pollution Control Act Amendments (Clean Water Act Sections 301, 304, 306, 307 and 501). Under these provisions, EPA is required to establish Best Practicable Control Technology Currently Available (BPT), Best Available Technology Economically Available (BAT), New Source Performance Standards (NSPS) and Pretreatment Standards for Existing Sources and New Sources (PSES and PSNS respectively) regulations for major industrial categories.
In 1974, EPA promulgated BPT and BAT effluent limitations guidelines as well as NSPS and PSNS for the petroleum refining industry. (US EPA, 1974a). These regulations were based on the information presented in the 1974 Development Document for the Petroleum Refining Category (US EPA, 1974b). Data included in this report were gathered from a number of EPA and American Petroleum Institute (API) sources to identify facilities and unit processes employed in this industry, to characterize their wastewater discharges, and to review the performance of wastewater treatment systems within the U.S. petroleum refining industry.
When the 1974 regulations were developed, EPA found that the industry could be divided into five discrete subcategories:
• Topping Refineries (Subcategory A) • Cracking Refineries (Subcategory B) • Petrochemical Refineries (Subcategory C) • Lube Refineries (Subcategory D) • Integrated Refineries (Subcategory E).

2
These subcategories are defined as follows: Subcategory
Basic Refinery Operations Included
Topping
Topping and catalytic reforming whether or not the facility includes any other process in addition to topping and catalytic reforming. This subcategory does not include facilities which include thermal processes (coking, visbreaking, etc.) or catalytic cracking.
Cracking
Topping and cracking, whether or not the facility includes any processes in addition to topping and cracking, unless specified in one of the subcategories listed below.
Petrochemical
Topping, cracking and petrochemical operations, whether or not the facility includes any process in addition to topping, cracking and petrochemical operations1, except lube oil manufacturing operations.
Lube
Topping, cracking and lube oil manufacturing processes, whether or not the facility includes any process in addition to topping, cracking and lube oil manufacturing processes, except petrochemical operations1.
Integrated
Topping, cracking, lube oil manufacturing processes, and petrochemical operations, whether or not the facility includes any processes in addition to topping, cracking, lube oil manufacturing processes and petrochemical operations1.
From the data, a size and complexity factor were determined, and for each individual refinery these factors are calculated to account for additional variations within each subcategory.
The BPT limitations determined in 1974 are based on both in-plant and end-of-pipe technology. BPT in-plant technology consist of control practices widely used within the petroleum refining industry, and includes the following:
• Installation of sour water strippers to reduce the sulfide and ammonia concentrations entering the treatment plant.
• Elimination of once-through barometric condenser water by using surface condensers
or recycle systems with oily water cooling towers.
1 The term "petrochemical operations" means the production of second generation petrochemicals (i.e., alcohols, ketones, cumene, styrene, etc.) or first generation petrochemicals and isomerization products (i.e., BTX, olefins, cyclohexane, etc.) when 15 percent or more of refinery production is as first generation petrochemicals and isomerization products.

3
• Segregation of sewers, so that unpolluted storm run-off and once through cooling waters are not treated normally with the process and other polluted waters.
• Elimination of polluted once-through cooling water, by monitoring and repair of
surface condensers or by use of wet and dry recycle systems.
BPT end-of-pipe treatment technologies consist of equalization and storm water diversion; initial oil and solids removal (API separators or baffle plate separators); carbonaceous (biochemical and chemical oxygen demand, i.e., BOD and COD) waste removal using biological treatment (activated sludge, aerated lagoons, oxidation ponds, trickling filter, or combinations of these); and effluent polishing (polishing ponds or sand, dual-media, or multi-media filters) following biological treatment (US EPA, 1974b).
The BPT and BAT limitations, as well as NSPS were established in 1974. The BPT and BAT limitations, as well as NSPS, were challenged in the U.S. Court of Appeals for the Tenth Circuit. On August 11, 1976, the Court upheld the BPT limitations and NSPS, but remanded the BAT limitations, including limitations issued to control storm water discharges from refineries, to EPA for further consideration.
In 1977, EPA began restudying the BAT and storm water regulations. To update the information needed to establish BAT effluent limitations guidelines for the petroleum refining category, questionnaires were sent to all refineries in the United States and its territorial possessions. The information obtained described petroleum refining industry wastewater treatment practices for the year 1976 (US EPA, 1982a).
Information received as a result of this questionnaire was combined with existing information from the 1974 rulemaking in order to develop an industry profile. This profile included number of plants, their size, geographic location, manufacturing processes, and wastewater generation, treatment, and discharge methods. Information on number, size, and geographic location of refineries was later updated with 1980 data from the U.S. Department of Energy (DOE).
In 1982, EPA determined that BAT for the petroleum refining industry was equivalent to the 1976 (existing) level of control (US EPA, 1982b). However, as a result of litigation, BAT limitations were revised in 1985 to reflect additional flow reduction basis and lower attainable concentrations for phenol and chromium.
For BAT limitations covering phenol and chromium, the revised regulation is based on the following flow model:
FLOW = 0.0021C + 0.0127A + 0.0236K + 0.0549L + 0.0212R Where:

4
FLOW = Net process wastewater in million gallons/day C = Sum of crude process rates in 1000 bbl/day A = Sum of asphalt process rates in 1000 bbl/day K = Sum of cracking and coking process rates in 1000 bbl/day L = Sum of lube process rates in 1000 bbl/day R = Sum of reforming and alkylation process rates in 1000 bbl/day
PSES final regulations were promulgated on March 23, 1977 (US EPA, 1977), codifying
the interim final rule published along with BPT in 1974. These regulations established a daily maximum limitations for oil and grease and ammonia of 100 mg/L each. There are no current pretreatment standards for toxic pollutants. 1.3 Software Disk Available
The calculations for determining permit limitations are simplified somewhat in that Mr. Ed McHam of EPA's Region 6 has developed a software program (spreadsheet) to complete the required calculation. The final spreadsheet is available in Lotus 1-2-3® format, with text in WordPerfect®. The program determines categorical limits and water quality limits after input of process through-put information. EPA Engineering and Analysis Division will provide a disk upon request.
5
2. Description of the Industry 2.1 Production Operations
Generally, a simple petroleum refinery includes catalytic reforming and treating processes in addition to crude oil distillation. A more complex refinery also includes catalytic cracking, polymerization, alkylation and asphalt oxidation as well as other selected unit processes. A very complex refinery may include high vacuum fractionation, solvent extraction, de-asphalting, de-waxing and treating processes, in addition to those found in simple and complex refineries.
Although many minor products can be produced from crude oil by simple physical separation processes, such as fractional distillation, the proportions of each product may not match the desired values, or the quality may not be adequate for the use intended. Therefore, many sophisticated chemical process operations also take place in a petroleum refinery, in order to produce the distribution, quality and quantity of products desired.
The following paragraphs describe the basic processes that are used in petroleum refineries. 2.1.1 Crude Oil and Product Storage
Petroleum refineries require storage facilities for both crude oil and individual final products. The amount of storage required is quite variable, depending on the type and reliability of crude supply and on the location and nature of markets. The crude oil storage area of a refinery serves to provide a working supply, equalize process flow and separate water and suspended solids from the crude oil.
During storage, water and suspended solids in crude oil and, in lesser quantities, in products tend to settle out to form a water layer at the tank bottom. This is typically in the form of a sludge which, in the case of crude oil, usually contains foul sulphur compounds and high dissolved solids concentrations. 2.1.2 Crude Distillation
Distillation is the basic refining process for the separation of crude petroleum into intermediate fractions of specified boiling point ranges. This separation or fractionation takes advantage of the differing boiling points and vapor pressures of the various components in the crude oil mixture.
In addition to the atmospheric distillation process it is normally necessary to subject the residual or bottoms from atmospheric distillation to a second and/or third stage distillation, conducted under vacuum.

6
The steam applied at the various stages to the process is in direct contact with hydrocarbons. It is eventually carried over with various fractions and is separated out by gravity when the fraction is condensed. These steam condensates are invariably foul, and constitute a foul or sour condensate waste stream, containing sulphides, ammonia, chlorides, mercaptans and phenols. 2.1.3 Cracking
In this process, heavy oil fractions are converted into lower molecular weight fractions including domestic heating oils, high octane gasoline stocks and furnace oils. The cracking process increases the yield of gasoline taken from the crude oil and improves its quality. By using cracking, refiners can double their gasoline output per unit volume of crude oil charged to their distillation towers or stills.
The cracking is usually the largest single source of sour and phenolic wastewater in a large refinery. The wastewater is derived from the steam condensate from the overhead accumulator and condensate from steam stripping of side streams. The major pollutants are oil, sulphides, phenols, ammonia and traces of cyanides. 2.1.4 Hydrocarbon Rebuilding
Higher octane products for use in gasoline are manufactured by alkylation. In this process, small hydrocarbon molecules are combined into large molecules: the reverse of cracking. The resulting products are valuable components of high quality motor fuel and aviation gasolines.
This operation produces sour water, high in sulphides, mercaptans, ammonia, suspended solids and oils. 2.1.5 Hydrocarbon Rearrangements
Isomerization and reforming are two process techniques for obtaining higher octane gasoline blending stock. Isomerization, a molecular rearrangement process rather than decomposition process, generates no major pollutant discharge. Catalytic reforming produces aromatics from naptha in the presence of a catalyst by molecular rearrangement. Dehydrogenation is the primary reaction. 2.1.6 Hydrotreating
Hydrotreating processes are used to purify and pretreat various feedstocks by reacting with hydrogen. Product contaminants, including sulphur and nitrogen compounds, odor, color and gum-forming materials, are removed in this process.

7
Many different hydrotreating processes are used, depending on the feedstock and intended use of the product. Common applications include:
• Pretreatment of reformer feedstock • Naphtha de-sulphurization • Lube oil polishing • Pretreatment of cat-cracking feedstock • Heavy gas oil and residual desulphurization • Naphtha hydrogenation.
The strength and quantity of wastewaters generated by hydrotreating is largely dependent
upon the specific process and feedstock used. Wastewaters are derived as condensates from fractionating the product hydrocarbons and are mainly contaminated by ammonia and sulphur compounds. 2.1.7 Solvent Refining
Various chemicals and solvents are used to improve the quality of a particular feedstock component. The compounds removed or isolated by this process may be highly objectionable in the specific product being prepared, but may be desirable in making other products or may be converted into desirable materials. The major pollutants from solvent refining are the solvents themselves, many of which can produce a high BOD. Under ideal conditions the solvents are continually recirculated, but in practice some solvent is always lost, usually through leaks at pump seals and flanges. Oil and solvent are major wastewater constituents. 2.1.8 Asphalt Production
The reduced crude fraction or residual taken from the bottom of the vacuum still may be blended into heavy fuel oil or may be made into asphalt by oxidation in an asphalt still.
Wastewater is derived from steam added to the reactor for stripping volatiles, as well as a small quantity of water produced for oxidation reactions with the asphalt. The water separated out is very oily, high in BOD and usually sour as a result of the normally high sulphur content of the residual. 2.1.9 Lubricating Oil Manufacture
Lubricating oils require closely controlled properties and are generally only manufactured from special high grade feedstocks. However, even with high grade feedstocks, lube oils must be treated to remove asphalt, wax and hydrocarbons whose viscosity is temperature sensitive (generally aromatic compounds).

8
This operation produces acidic rinse waters and acid sludges for disposal, which are high in dissolved and suspended solids, sulphates and sulphonates and which form stable oil emulsions. 2.1.10 Production of Petrochemicals
These operations are extremely varied, and include production of a wide range of products such as alcohols, ketones, cumene, styrene, benzene, toluene, xylene, olefins, cyclohexane, etc. Many petrochemicals are manufactured directly, while others are derivatives from intermediate products. Wastewaters from these processes are quite variable and dependent upon the specific operations employed. 2.2 Industry Trends
EPA identified 256 refineries in 1976. Total average production that year was 16,357,000 barrels per day. During the subsequent 14 years, 64 refineries closed, or approximately 25 percent of the facilities. However, the production capacity only dropped 1,000,000 barrels per day (bbl/day), or approximately six percent. This is because most of the facilities that closed were small inefficient refineries. Their capacity was replaced by increasing production at the larger existing refineries. Table 2.1 presents a summary of the number of refineries, and their associated production rates by state. This table indicates that the number of refineries decreased in 26 states; there was no changes in refinery count in nine states; and the number of refineries actually increased in five states (Alaska, Arizona, Nevada, New Jersey, and Tennessee). Figure 2.1 graphically presents the number of refineries by state.
Table 2.1 Capacity and Number of United States Refineries in 1991 vs. 1976
State
1976
Facilities
1976 Total
Capacity
Crude (b/cd)
1991
Facilities
1991 Total
Capacity
Crude
(b/cd)
Difference
in No. of
Facilities
Difference in
Total
Capacity
Alabama
4
54,250
4
154,250
0
100,000
Alaska
3
73,000
5
224,500
2
151,500 Arizona
1
5,000
2
14,210
1
9,210
Arkansas
4
61,000
3
60,470
-1
-530 California
33
2,269,600
30
2,150,555
-3
-119,045
Colorado
3
65,000
3
91,200
0
26,200 Delaware
1
150,000
1
140,000
0
-10,000
Florida
1
4,000
0
0
-1
-4,000 Georgia
2
17,000
2
35,500
0
18,500

9
Hawaii 2 100,300 2 143,050 0 42,750 Illinois
12
1,272,000
7
948,500
-5
-323,500
Indiana
6
605,820
4
428,900
-2
-176,920 Kansas
10
410,011
8
353,225
-2
-56,786
Kentucky
4
171,200
2
218,900
-2
47,700 Louisiana
21
2,108,173
19
2,299,241
-2
191,068
Maryland
2
30,500
0
0
-2
-30,500 Michigan
6
155,920
4
125,200
-2
-30,720
Minnesota
3
223,900
2
285,600
-1
61,700 Mississippi
5
346,200
5
358,600
0
12,400
Missouri
1
107,000
0
0
-1
-107,000 Montana
6
116,500
4
138,900
-2
22,400
Nebraska
1
5,380
0
0
-1
-5,380 Nevada
0
0
1
4,500
1
4,500
New Hampshire
1
15,000
0
0
-1
-15,000
New Jersey
4
671,000
6
499,250
2
-171,750
New Mexico
7
92,620
4
76,650
-3
-15,970 New York
2
107,000
1
39,900
-1
-67,100
North Dakota
3
60,006
1
58,000
-2
-2,006 Ohio
7
602,000
4
454,150
-3
-147,850
Oklahoma
12
560,400
7
409,500
-5
-150,970 Oregon
1
14,000
1
0
0
-14,000
Pennsylvania
9
800,200
7
741,300
-2
-58,900 Tennessee
0
0
1
75,000
1
75,000
Texas
46
4,231,135
31
3,882,200
-15
-348,935 Utah
7
158,500
6
154,500
-1
-4,000
Virginia
1
55,000
1
53,000
0
-2,000 Washington
8
379,950
7
523,225
-1
143,275
West Virginia
3
22,700
2
29,680
-1
6,980 Wisconsin
1
42,000
1
32,000
0
-10,000
Wyoming
13
194,002
4
122,900
-9
-71,102 Totals
256
16,357,267
192
15,326,556
-64
-1,030,711
Source: Thrash, 1991
10
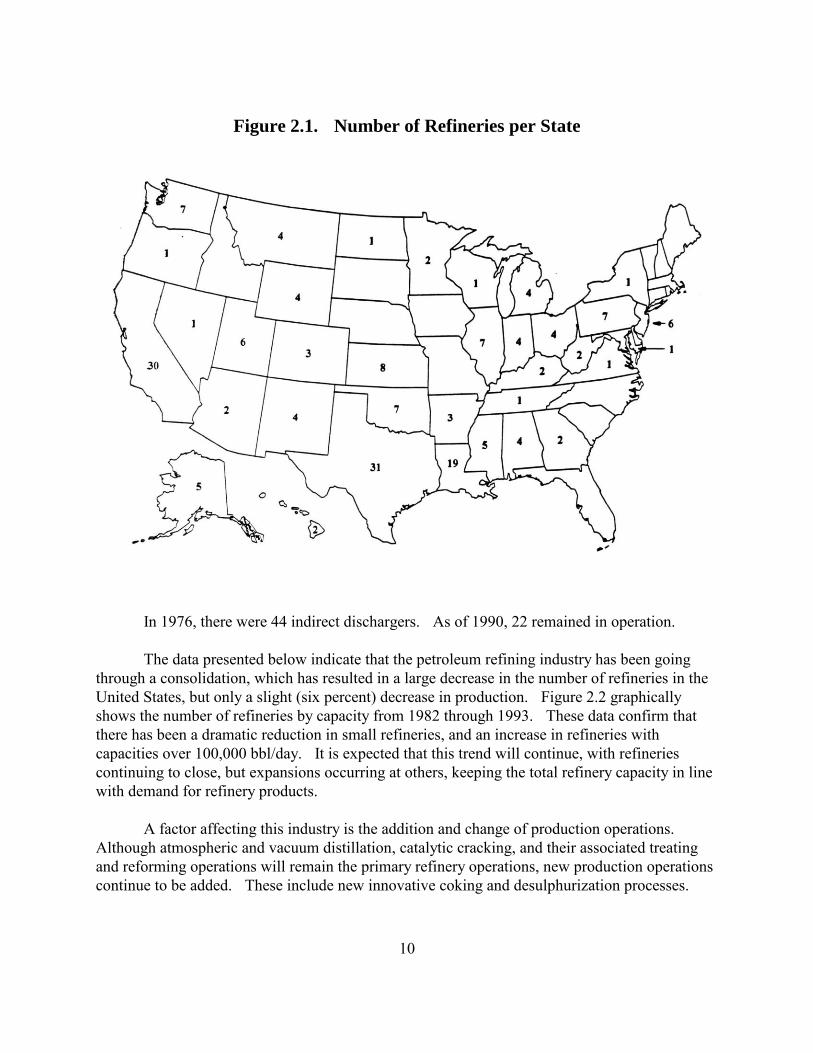
Figure 2.1. Number of Refineries per State
In 1976, there were 44 indirect dischargers. As of 1990, 22 remained in operation.
The data presented below indicate that the petroleum refining industry has been going through a consolidation, which has resulted in a large decrease in the number of refineries in the United States, but only a slight (six percent) decrease in production. Figure 2.2 graphically shows the number of refineries by capacity from 1982 through 1993. These data confirm that there has been a dramatic reduction in small refineries, and an increase in refineries with capacities over 100,000 bbl/day. It is expected that this trend will continue, with refineries continuing to close, but expansions occurring at others, keeping the total refinery capacity in line with demand for refinery products.
A factor affecting this industry is the addition and change of production operations. Although atmospheric and vacuum distillation, catalytic cracking, and their associated treating and reforming operations will remain the primary refinery operations, new production operations continue to be added. These include new innovative coking and desulphurization processes.

11
Many of these process changes occur as a result of the new gasoline reformulation rules designed to reduce the amount of volatile components in gasoline. These rules are causing refineries to make process modifications to their catalytic cracker units, as well as installing additional hydrotreaters and unit processes to manufacture additives. These improvements and changes may greatly effect the amount and quality of wastewaters generated by refineries.
Other process changes are being made to comply with 1990 Clean Air Act Amendments requirements, such as the lead phaseout rules, National Emissions Standards for Hazardous Air Pollutants (NESHAP) requirements covering benzene and hazardous organics and low sulfur diesel standards are in place or in the works.

12
Figure 2.2 Number of Refineries Since 1982
(Classified by Capacity)
Source: Energy Information Administration

13
3. Summary of Information Sources Used in This Study
The preponderance of information collected for use in this study was obtained from a number of readily available data sources. A description of these sources is contained below. 3.1 Oil And Gas Journal Survey
The Oil and Gas Journal publishes a list of all active U.S. and foreign refineries. For this study, the December 1991 report was used to provide an estimate of the number of refineries in use in the United States, their location and production capacity (Thrash, 1991). These data were used to show general industry trends since 1976. 3.2 EPA Office of Air and Radiation Questionnaire
EPA's Office of Air Quality Planning and Standards, in the Office of Air and Radiation (OAR), surveyed nine companies to obtain information on hazardous air pollutants (HAP) and volatile organic compounds (VOC) emissions from refineries. A total of 27 refineries were covered by the responses from these nine companies. For the purpose of this study, an additional data table was added to the survey form to request information on refinery production, process throughput, wastewater discharge rates, wastewater treatment systems and wastewater flow diagrams. The data from these 27 refineries (approximately 15 percent of the industry) have been used as a sample to represent the industry as a whole. 3.3 Plant Visits
EPA visited six refineries as part of this study. Four facilities in California were visited, which represent exemplary refineries in terms of water use and existing wastewater treatment technologies. One refinery in Texas and one in Pennsylvania were also visited to represent refineries that use greater amounts of process water or that did not have stringent water quality standards, but meet the existing effluent limitation guidelines. The data from these six sites have been used to obtain detailed data on site-specific water use practices and treatment system performance. 3.4 Permit Compliance System Data
EPA maintains a large computerized data base called the Permit Compliance System (PCS). This data base contains an inventory of National Pollutant Discharge Elimination System (NPDES) permittees, and discharge monitoring report (DMR) data supplied by industry permittees as part of their self monitoring program. (Generally DMR data are available on PCS only for certain facilities--major facilities as identified by their permit authorities). This data base contains DMR data on 137 refineries, and the data were used to estimate the levels of pollutants in refinery effluents for the reporting year of 1992.

14
3.5 Los Angeles County Sanitation Districts
Information from the Los Angeles County Sanitation Districts (LACSD) was provided for 14 refineries discharging into their municipal sewer system. These data were used to represent the status of refinery effluents to a sewer system with an exemplary pretreatment program. 3.6 Other Sewerage Authorities
Three additional sewerage authorities were contacted to obtain data on discharges from other indirect discharging refineries. These data were used to represent the pollutant levels of refinery discharges to smaller systems with less comprehensive pretreatment programs. 3.7 Province of Ontario, Canada Petroleum Study
Ontario's Ministry of Environment established the Municipal-Industrial Strategy for Abatement (MISA) Program in 1986 with an ultimate goal of achieving "virtual elimination" of the discharge of persistent toxic pollutants. As part of this program, the Ministry is setting sector (categorical) specific best available technology limitations. The petroleum refinery sector (industry) was identified as part of this program.
The data collected as part of this study (data on seven refineries) were used in this effort. The seven existing Ontario refineries collected extensive effluent quality data for a one year period on a full range of toxic pollutants. In addition, the refineries collected data on the presence of dioxins in the wastewaters from the regeneration of catalysts from their catalytic reformers. These data have been used to supplement the data collected on U.S. refineries. 3.8 Other Data Sources
Data from published literature, industry studies, previous effluent limitations guidelines studies and other EPA studies have been collected and also used in this study.

15
4. Treatment Technologies Used in The Industry
Historically (prior to the 1960's), process operations used large quantities of water, and often simple oil separation constituted end-of-pipe treatment. In fact, API separators were originally installed to economically recover oil rather than treat wastewater discharges. When EPA studied this industry in the early 1970's, secondary biological treatment was becoming common, and certain in-plant controls were becoming industry standards. These included sour water stripping and the replacement of barometric condensers with surface condensers.
As a result of the early 1970's studies, EPA promulgated the BPT and NSPS regulations in 1974 that were production-based mass limitations based upon the following technologies:
In-Plant Controls
• Installation of sour water strippers to reduce the sulfide and ammonia concentrations entering the treatment plant.
• Elimination of once through barometric condenser water by using surface condensers or recycle systems with oily water cooling tower.
• Segregation of sewers, so that unpolluted storm run-off and once through cooling waters are not treated normally with the process and other polluted waters.
• Elimination of polluted once through cooling water, by monitoring and repair of surface condensers or by use of wet and dry recycle systems.
End-of-Pipe Treatment
• Equalization • Additional oil separation using dissolved air flotation (DAF) • Biological treatment • Polishing (polishing ponds, sand filtration).
EPA's 1982 BAT rulemaking confirmed the use of the above technologies as the
framework for setting effluent limitations guidelines for priority pollutants. However, further water reduction had been experienced between 1972 and 1976, the years data had been collected by EPA. The new flow data was used to develop a revised (BAT) flow model, which formed the basis for more stringent chromium and phenolic production-based mass limitations.
The following subsections describe the technologies used by the petroleum refinery industry, the performance expected by them, and industry trends since the 1982 EPA rulemaking.

16
4.1 In-Plant Controls
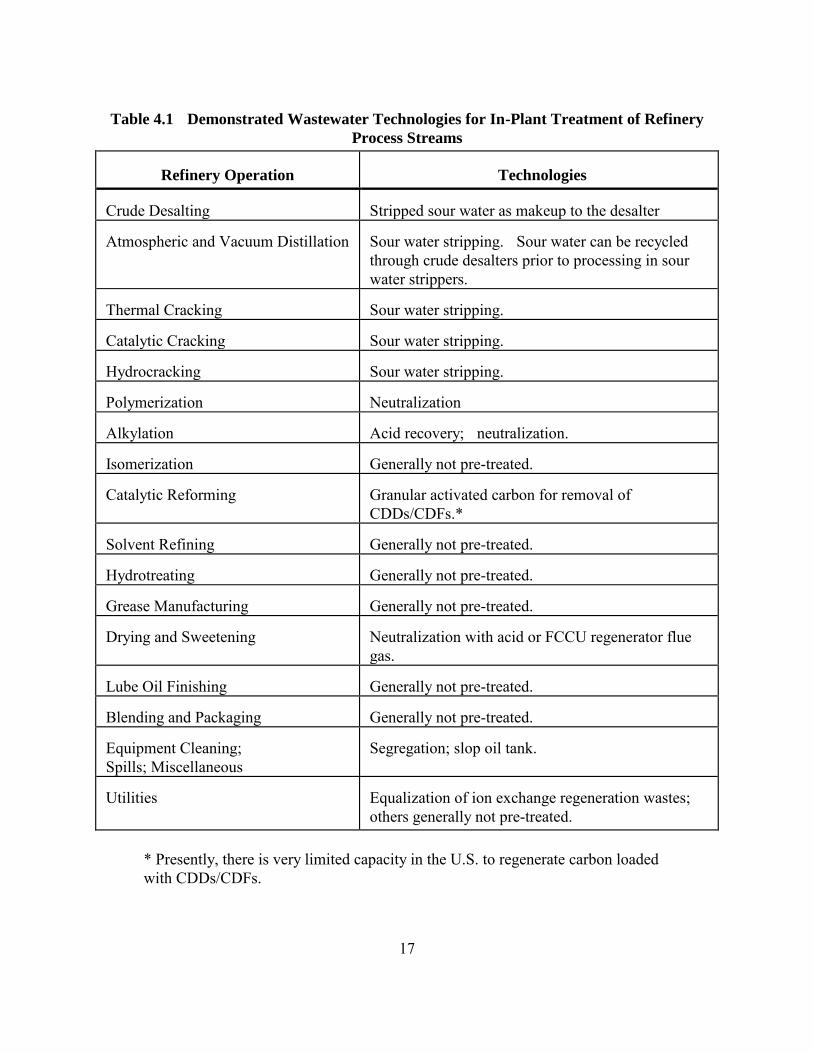
In-plant technologies for refinery wastewater include steam stripping, neutralization, and source control. Table 4.1 summarizes the in-plant treatment technologies currently in use for treating wastewaters generated from specific refinery operations. A description of the technologies is contained below. 4.1.1 Steam Stripping
Sour waters generally result from water brought into direct contact with a hydrocarbon stream. This occurs when steam is used as a stripping or mixing medium or when water is used as a washing medium. Sour waters contain sulfides, ammonia, phenols and other organic chemical constituents of the crude oil.
The most common in-plant treatment for sour waters is steam stripping (i.e., sour water stripping). Sour water stripping is a gas-liquid separation process that uses steam or flue gas to extract the gases (sulfides and ammonia) from the wastewater. The stripper itself is a distillation-type column containing either trays or packing material. Columns range from simple one-pass systems to sophisticated reflux columns with reboilers.
In removing sulfides and ammonia, the efficiency of sour water treatment processes is greatly influenced by pH. In general, sour water strippers remove between 85 and 99 percent of the sulfides present. However, when the pH is lowered by means of acid treatment, stripping efficiency is increased. On the other hand, when caustic is utilized to maintain high pH, up to 95 percent ammonia removal can be achieved. By considering pH in the stripping process, one can either adjust the pH to optimize removal of one or another of sulfides or ammonia, or use a two stage sour water stripping process to obtain maximum removal of both pollutants.
Steam stripping can also be used to remove volatile organic compounds from selected refinery wastewater streams that have high concentrations of these pollutants. Stripping of the organic constituents of the wastewater stream occurs because the organic volatiles tend to vaporize into the steam until its concentration in the vapor and liquid phases (within the stripper) are in equilibrium. The height of the column and the amount of packing material and/or the number of metal trays along with steam pressure in the column generally determine the amounts of volatiles that can be removed and the effluent pollutant concentration levels that can be attained by the stripper.
17
Table 4.1 Demonstrated Wastewater Technologies for In-Plant Treatment of Refinery
Process Streams
Refinery Operation Technologies
Crude Desalting
Stripped sour water as makeup to the desalter
Atmospheric and Vacuum Distillation
Sour water stripping. Sour water can be recycled through crude desalters prior to processing in sour water strippers.
Thermal Cracking
Sour water stripping.
Catalytic Cracking
Sour water stripping.
Hydrocracking
Sour water stripping.
Polymerization
Neutralization
Alkylation
Acid recovery; neutralization.
Isomerization
Generally not pre-treated.
Catalytic Reforming
Granular activated carbon for removal of CDDs/CDFs.*
Solvent Refining
Generally not pre-treated.
Hydrotreating
Generally not pre-treated.
Grease Manufacturing
Generally not pre-treated.
Drying and Sweetening
Neutralization with acid or FCCU regenerator flue gas.
Lube Oil Finishing
Generally not pre-treated.
Blending and Packaging
Generally not pre-treated.
Equipment Cleaning; Spills; Miscellaneous
Segregation; slop oil tank.
Utilities
Equalization of ion exchange regeneration wastes; others generally not pre-treated.
* Presently, there is very limited capacity in the U.S. to regenerate carbon loaded with CDDs/CDFs.

18
4.1.2 Neutralization of Spent Acids and Caustics
Spent caustic solutions are generated by various finishing wet treatment processes aimed at neutralizing and extracting acidic materials occurring naturally in crude, acidic products from various chemical treatment steps, and acidic materials produced in cracking processes. Spent caustics generally contain sulfides, mercaptans, sulfates, sulphonates, phenols and naphthionic acids. The phenol concentrations, in particular, may be high enough to warrant processing of spent caustic for the recovery of phenols.
Spent acid is reclaimed on site or returned to the vendor for reclamation. if the bottoms are then sent to crude desalting, the high phenol content may be recovered within the process by extraction. 4.1.3 Source Control
Source control measures to minimize wastewater generation and contamination can significantly reduce the volume of effluent and the amount of pollutants discharged from refineries. Such measures include water use reduction, and wastewater reuse and recycle.
Along with several general measures to reduce water use, major wastewater discharge reduction techniques address segregation, boiler condensate recovery, and treated effluent reuse. A report entitled "Water Reuse Studies" (API, 1977) discusses the practicality (and costs) of specific wastewater reduction techniques. Another study, "Wastewater Reuse and Recycle in Petroleum Refineries" (Langer, 1983) also presents information on this topic. The Langer study investigated 15 U.S. refineries: three refineries were considered to be exemplary and the remaining 12 were candidates for further effluent discharge volume reduction programs. The report identifies specific wastewater reduction techniques with their anticipated effectiveness and associated costs. A summary of the findings from these studies is presented below. 4.1.4 Wastewater Segregation
Segregation of refinery wastewaters is important to allow for reuse of wastewaters with little or no treatment. Additionally, segregation of severely contaminated streams provides the opportunity for pretreatment, thus reducing the effects of dilution and contamination of the overall combined process wastewater stream. The API study recommended dividing streams into three groups, by level of contamination. The first stream is high quality and is suitable for reuse with only minimal treatment, if any. The second stream has low total dissolved solids (TDS) and requires some treatment prior to reuse, and the final stream, which has high TDS, is not suitable for reuse and requires complete treatment before discharge.

19
4.1.5 Boiler Condensate Recovery
Boiler steam condensate recovery and reuse can also significantly reduce the amount of boiler circuit wastewater requiring discharge. (Note: Many refineries are already recovering and reusing as much condensate as economically feasible.) Specific measures include the following:
• Increase condensate recovery by the installation or expansion of piping systems to collect steam lost by overheating, tracing, tank heating, traps, utility and leaks.
• Reduce vent losses by the elimination of vents at process units, turbines and steam
traps. 4.1.6 Treated Effluent Reuse
For high quality wastestreams, the wastewater may be suitable for direct reuse in cooling systems or for steam generation without treatment. Other examples of reuse (with little or no treatment) include using sour water as make-up for desalters and acid gases for the neutralization of spent caustic solutions.
In the Langer report, several uses of treated effluent were identified. These included wastewater reuse for: exchanger and barometric condenser cooling, dampening of coke fines for dust control, firewater, service water and wash water, pump gland cooling, and other machine cooling processes. Once-through cooling water can be reused as make-up for desalters, cooling towers, or as process water, but may be unsuitable without prior treatment. 4.1.7 Other General Measures
Other general measures for the reduction of wastewater generation include:
• Conversion of barometric condensers to surface condensers. • Improved management of firewater and wash water systems including the elimination
of losses from overflowing sumps, freely running hoses, temporary exchange coolers, and underground leakage.
4.1.8 Cooling Water Systems
Historically, the primary factor considered in selecting cooling water systems was the availability of water and its associated cost. However, impacts of thermal discharges, water conservation, and compliance with discharge limitations have also become relevant considerations. The advantages and disadvantages of different cooling systems are presented in Table 4.2.

20
Table 4.2 Advantages and Disadvantages of Different Types of Cooling Systems
Factor
Once-Through
Cooling Water
Cooling Tower
Air Cooling
Noise
None
low
high
Cold Weather Plumes
none
potential problem
none
Water Contamination Potential from Leaks
high
moderate
none
Soil Contamination Potential from Leaks
low
low
low
Air Contamination Potential
none
moderate
moderate
Cooling Efficiency
high
moderate to high
low to moderate
Energy Required
moderate
high
high
Maintenance and Labor
low
high
low
Potential for Impact for Thermal Shock to Fish
moderate to high
none
none
Potential for Impact of Water Treatment Chemicals
moderate
moderate
none
Costs
low
high
high
Although cooling water can be completely eliminated by converting to 100 percent air cooling systems, this may be impractical or uneconomical for some refineries due to space availability and the orientation of the heat exchanger systems. There are also real process limitations in that many processes designed for cooling water systems (more efficient cooling systems) can not be retrofitted for air cooling systems. 4.1.9 Once-Through Cooling Water Systems
In once-through cooling water (OTCW) systems, due to the use of chlorine and chlorine derivatives as additives, dechlorination using sulfide or sulfite compounds may be necessary to remove residual chlorine. In recent years, as concerns about the environmental impacts of

21
chlorine and chlorination by-products have increased, the use of bromine an bromine compounds for OTCW treatment has also received consideration. 4.1.10 Cooling Tower Systems
There are several methods to minimize cooling tower blowdown streams. Cooling tower blowdown can contribute up to one third of total refinery wastewaters. Although cooling tower systems vary from plant to plant, the following general recommendations were made in the study to reduce cooling tower blowdown:
• Recycle cooling water from pumps, compressors, and sample boxes that use blowdown.
• Replace existing oil-leaking pump gland packing with mechanical seals to permit collection and recycle of blowdown to cooling tower.
• Reduce use of pump gland cooling water where presently overused or eliminate service completely.
• Upgrade maintenance of existing systems to reduce leakage and sump overflow.
Refineries can pretreat raw water to improve the initial quality of the influent which in turn will significantly increase the number of reuse cycles in cooling towers and reduce blowdown amounts. The toxicity of the blowdown can also be reduced. Water treatment chemicals containing zinc and chromate compounds used in the recirculating waters can be replaced with less toxic organic compounds. In the last ten years chromates have been virtually eliminated by substitution for less toxic chemicals. Zinc levels in the effluent discharge average 0.15 mg/l as shown in Table 4.5. 4.2 End-of-Pipe Treatment Technologies
All wastewater treatment that immediately follows the oil/water gravity separators (API or oily water separator) is considered end-of-pipe treatment. (The API separator is recognized as part of the refinery process equipment for the economic recovery of oil and, as such, is not considered a treatment unit.) Conventional end-of-pipe treatment technologies are addressed in this section and are classified as preliminary, biological, and effluent polishing. 4.2.1 Preliminary Treatment
Preliminary treatment commonly consists of equalization, followed by chemical treatment and supplemental oil removal. Filtration may also be included as part of the preliminary treatment system to limit the loading of soils to downstream units.
Equalization is one of the first, and one of the most important steps in the treatment of wastewater. Fluctuations in contaminant concentrations are leveled and the flow and pH of the waste stream are adjusted to provide the optimum conditions for further treatment. Unusually
22
high flows or high contaminant concentrations, which cannot be handled by equalization, may be diverted to auxiliary holding facilities and slowly re-introduced in the treatment system when conditions warrant.
Supplemental oil removal is often accomplished by using parallel plate separators or chemically assisted dissolved air flotation (DAF) units, whereby emulsified oil in the waste stream is dispersed and removed. A parallel plate separator is a device which is very similar to the API separator. It was developed to improve oil and solids removal by mounting parallel plates at an angle along the length of the separator. By vastly increasing surface area, this device permits more efficient collection of oils and solids.
Dissolved air flotation consists of saturating a portion of the wastewater feed, or a portion of the feed or recycled effluent from the flotation unit, with air. The wastewater or effluent recycle is held at elevated pressure, typically for one to five minutes, in a retention tank and then released at atmospheric pressure to the flotation chamber. The sudden reduction in pressure results in the release of microscopic air bubbles which attach themselves to oil and suspended particles in the wastewater in the flotation chamber. This results in agglomerates which rise to the surface to form a froth layer.
Chemical flocculation agents, such as salts of iron and aluminum, with or without organic polyelectrolytes, are often helpful in improving the effectiveness of the air flotation process and in obtaining a high degree of clarification. Induced air flotation (IAF) is similar to DAF systems but IAF adds air to a flotation tank by using impellers rather than by adding dissolved air to a recirculation tank.
Chemical precipitation can be used to remove metals from selected refinery wastewater streams, such as cooling tower blowdown. Most metals are relatively insoluble as hydroxides, sulfides, or carbonates, an can be precipitated in one of these forms. The sludge formed is then separated from solution by physical means such as clarification or filtration. Hydroxide precipitation is the conventional method of removing metals from wastewater. Most commonly, caustic soda (NaOH) or lime (Ca(OH)2) is added to the wastewater to adjust the pH to the point where metal hydroxides exhibit minimum solubilities and are thus precipitated. Sulfide precipitation has also been demonstrated to be an alternative to hydroxide precipitation for removing metals from certain wastewaters. Sulfide, in the form of hydrogen sulfide, sodium sulfide, or ferrous sulfide, is added to the wastewater to precipitate metal ions as insoluble metal sulfides. 4.2.2 Biological Treatment
Biological treatment is the basic process for treating oxygen-demanding compounds, usually measured as biochemical oxygen demand (BOD), chemical oxygen demand (COD) and total organic carbon (TOC). There are a number of variations of which the most common are described below.
23
• Oxidation Ponds. The oxidation pond is practical where land is plentiful and
relatively inexpensive. An oxidation pond has a large surface area and a shallow depth, usually not exceeding two meters. These ponds have long detention periods of 11 to 110 days. This process is not reliable in very cold climates.
• Aerated Lagoons. The aerated lagoon is a smaller, deeper oxidation pond equipped
with mechanical aerators or diffused air units. The addition of oxygen enables the aerated lagoon to have a higher concentration of microbes than the oxidation pond. Where effluent standards are stringent, final clarification is necessary. However, since the effectiveness of conventional clarification on such effluent is often poor, filtration may be necessary to comply with limitations. However, refiners have often addressed this problem by adding polishing ponds after the lagoon.
• Trickling Filters. A trickling filter is an aerobic biological process. It differs from
other processes in that the biomass is attached to the bed medium, which may be rock, slag or plastic. When the biomass reaches a certain thickness, part of it sloughs off. When the filter is used as the major treatment process, a clarifier is used to remove the sloughed biomass.
• Rotating Biological Contactors (RBCs). RBCs are analogous to trickling filters, in
that they are fixed-film reactors. Bacterial slime is grown on plastic discs rotating through the wastewater. Approximately half of the circular disc is out of the water at any one time, being aerated, and half is under water supporting biological growth.
• Activated Sludge. Activated sludge is an aerobic biological treatment process in
which newly grown and recycled microbial biomass are suspended uniformly throughout a holding tank to which raw wastewaters are added. Oxygen is introduced by mechanical aerators, diffused air systems or a combination of the two. The organic materials in the waste are removed from the aqueous phase by the microbial biomass and stabilized by biochemical synthesis and oxidation reactions. The basic activated sludge process consists of an aeration tank followed by a clarification step.
4.2.3 Effluent Polishing
The function of effluent polishing is to remove residual suspended solids (biological floc) which may be carried over from the clarification step. The biological floc will add BOD and certain toxic organic compounds (which are adsorbed onto or absorbed into the floc) to the final effluent, and must be removed.
Most end-of-pipe treatment systems at petroleum refineries include effluent polishing in the form of polishing filters, polishing ponds, or both. Effluent polishing filters are often

24
single-media (sand), however, dual-media (sand, anthracite) and multi-media filters are also used. Both gravity and pressure filtration systems are utilized in refinery applications.
Polishing ponds can be equipped with baffles and oil skimmers on overflows to remove traces of free oil which may have evaded upstream treatment systems. In the event that the final effluent does not meet discharge limitations or standards, some refinery treatment systems allow the transfer of effluent from the polishing ponds back to preliminary treatment. 4.2.3 Activated Carbon Treatment
There are two forms of activated carbon treatment, Granular Activated Carbon (GAC) and Powdered Activated Carbon (PAC). Each is discussed below.
• Granular Activated Carbon. Adsorption on granular activated carbon (GAC) is currently being used for effluent polishing following biological treatment at some refineries to remove trace level toxic organic pollutants, and at least three U.S. refineries to meet bioassay permit requirements based on toxicity for trout or fat-head minnows.
The adsorption process typically requires preliminary filtration or clarification to remove suspended solids. Next, the wastewaters are placed in contact with carbon so adsorption can take place. Normally, two or more beds are used so that adsorption can continue while a depleted bet is reactivated. Reactivation is accomplished by heating the carbon to 870 to 980C (1600 to 1800F) to volatilize and/or oxidize the adsorbed contaminants.
• Powdered Activated Carbon. This technology consists of the addition of powdered
activated carbon (PAC) to biological treatment systems. The adsorbent quality of the carbon aids in the removal of soluble organic materials in the biological treatment unit. This treatment technique also enhances color removal, clarification and system stability. BOD and COD removal may be enhanced but, it is not certain, depending on the treatment system. This treatment technology is currently being used at one U.S. refinery at least.
4.2.5 Technologies Used at EPA/OAR Survey Refineries
A summary of the treatment technologies that are in place at the 27 refineries covered by the OAR survey plants is presented in Table 4.3. Of the 27 refineries, 20 are direct dischargers and 7 are indirect dischargers. All of the 20 direct discharging refineries have some form of biological treatment. Three have sand filtration and one facility has an in-plant activated carbon system in addition to biological treatment.

25
Table 4.3 Summary of Current Wastewater Treatment Technologies for 27
Refineries Surveyed
Treatment Type
Direct Discharge
Refineries (total 20)
Indirect Discharge
Refineries (total 7)
In-Plant Controls
Oil-Water Separator
15
4 Stripper
16
5
Oxidizer
2
0
Activated Carbon
1
1
Primary Treatment
API Separator
9
5
Air Flotation
5
1
Coagulation
1
0
Chemical Precipitation
1
0
Dissolved Air Flotation
10
1
Equalization
16
4
Flocculation
1
1
Grit Chamber
0
1
Gas Flotation
0
1
Induced Air Flotation
4
2
Settling & Skimming
0
1
Secondary
Treatment
Activated Sludge Unit
11
0
Bio Treatment Ponds
6
2
PAC Bio-Treatment
1
0
RBC's
1
1
Secondary Clarifier
12
0
Lagoons
3
0
Filtration (Media & Sand)
3
1
Aeration & Other Biological Treatment
5
0
Source: EPA Office of Air and Radiation Survey (1992)
26
4.2.6 Performance of End-of-Pipe Systems
There are virtually no available data from this industry on the performance of individual treatment units within a treatment system. Therefore, performance must be assessed using effluent data only. However, since most direct discharging plants use the basic treatment train of preliminary treatment (oil removal), biological treatment and effluent polishing (filtration or ponds), effective comparisons of performance can be made using effluent data.
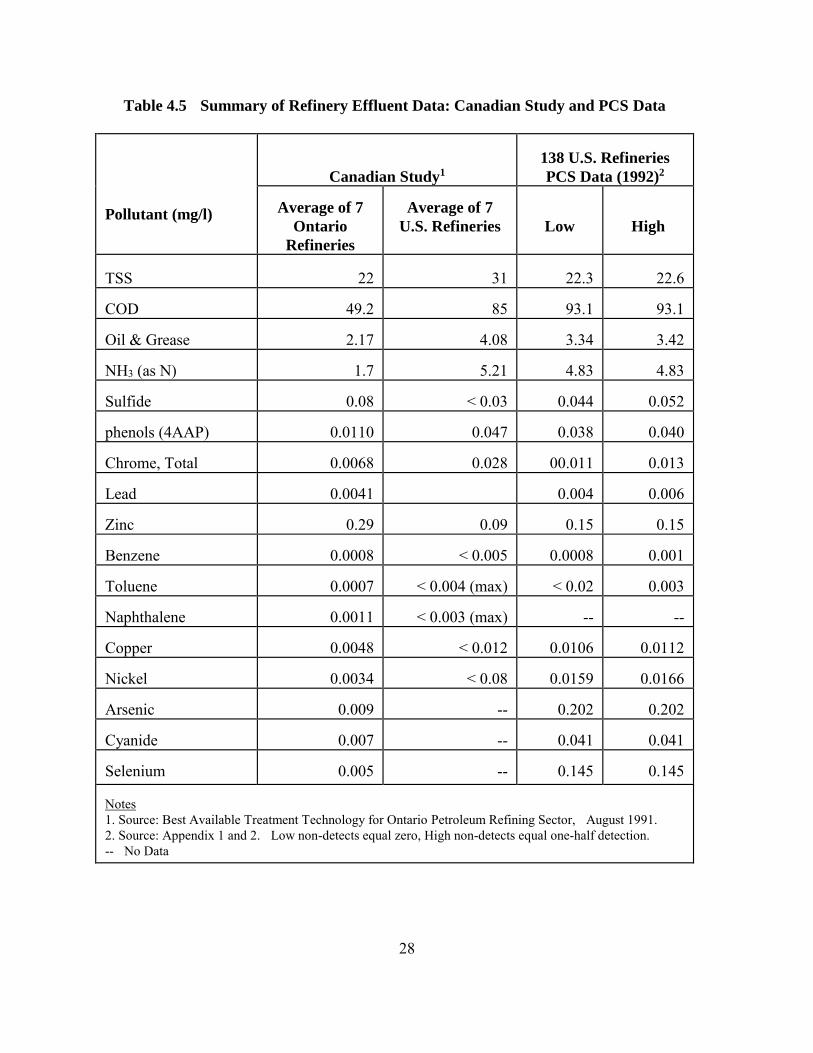
Table 4.4 presents a summary of the effluent data collected from the six refineries visited as part of this study, and compares the pollutants covered by BPT with the concentrations used as a basis to develop BPT limitations in 1974. Table 4.5 summarizes effluent concentration data for a number of pollutants obtained from the following three data sources:
• Average concentration data (over a one-year period) collected during Canada’s “Seven Refineries Study” conducted in 1989,
• Long-term average data collected from seven U.S. refineries during the Canadian
study,
• A summary of PCS data from 138 direct discharging refineries for 1992.
EPA’s PCS system was accessed for priority pollutant data only. The data in this table indicate higher levels of priority pollutants in the PCS data base for chromium (in 1991 only), benzene, toluene, copper and nickel than from the other data sources.

27
Table 4.4 Summary of Effluent Data: Six Site Visits, 1992
Pollutant Average
Values (in mg/l)
4 California
Refineries
Pennsylvania
Refinery
Texas
BPT/BAT Equiv.*
Concentrations
TSS
8.75
11
12
10
COD
--
51
59.5
Oil & Grease
2.7
2.7
4.2
5
NH3 (as N)
1.43
0.94
1.42
Sulfide
< 0.05
0.14
0.018
0.1
Phenols (4AAP)
< 0.02
0.005
0.012
0.1
Chrome, Total
< 0.02
0.02
0.015
0.25
Lead
0.012
0.002
<0.001**
Zinc
0.04
0.147
.025**
Benzene
ND
--
<.005**
Toluene
ND
--
<.005**
Naphthalene
ND
--
--
Copper
0.01
0.011
.013**
Nickel
0.033
--
.039**
Selenium
0.06
0.006
.008**
Notes: * These are concentrations used as a basis to develop the BPT production-based mass
limitations using the BPT flow model. ** Data from permit renewal application (March 1993) ND Non Detectable -- No Data
28
Table 4.5 Summary of Refinery Effluent Data: Canadian Study and PCS Data
Pollutant (mg/l)
Canadian Study1
138 U.S. Refineries
PCS Data (1992)2
Average of 7
Ontario
Refineries
Average of 7
U.S. Refineries
Low
High
TSS
22
31
22.3
22.6
COD
49.2
85
93.1
93.1
Oil & Grease
2.17
4.08
3.34
3.42
NH3 (as N)
1.7
5.21
4.83
4.83
Sulfide
0.08
< 0.03
0.044
0.052
phenols (4AAP)
0.0110
0.047
0.038
0.040
Chrome, Total
0.0068
0.028
00.011
0.013
Lead
0.0041
0.004
0.006
Zinc
0.29
0.09
0.15
0.15
Benzene
0.0008
< 0.005
0.0008
0.001
Toluene
0.0007
< 0.004 (max)
< 0.02
0.003
Naphthalene
0.0011
< 0.003 (max)
--
--
Copper
0.0048
< 0.012
0.0106
0.0112
Nickel
0.0034
< 0.08
0.0159
0.0166
Arsenic
0.009
--
0.202
0.202
Cyanide
0.007
--
0.041
0.041
Selenium
0.005
--
0.145
0.145
Notes 1. Source: Best Available Treatment Technology for Ontario Petroleum Refining Sector, August 1991. 2. Source: Appendix 1 and 2. Low non-detects equal zero, High non-detects equal one-half detection. -- No Data

29
4.2.7 Storm Water Management
Storm water management at petroleum refineries can have a significant bearing on the mass discharge of conventional and toxic pollutants to receiving waters. In addition to increasing wastewater volumes, stormwater also often contributes high levels of total suspended solids (TSS).
Under ideal circumstances, all stormwater should be segregated into the categories identified in Table 4.6 and treated or discharged as indicated.
Storm water segregation can easily be incorporated into grass roots refineries, however, segregation at existing refineries can be difficult. Segregation measures may include sloped or curbed process unit pads, individual or discrete drain and piping systems, and holding ponds for testing and controlled releases of wastewater to treatment systems or direct discharge points.
Table 4.6 Refinery Storm Water Management Practices
Refinery Area
Storm Water Management
Immediate process areas
Collection and co-treatment with refinery process wastewaters.
Developed areas of refinery, but outside immediate process areas
Segregation, collection and diversion to storm water holding pond equipped with oil baffles and skimmers. Controlled discharge after examination and testing.
Undeveloped areas
Segregation and direct discharge.

30
5. Water Use
Historically, U.S. petroleum refineries have been large water users. Water is used for contact and non-contact cooling, steam production, and in process operations such as desalting. Up until the early 1970's, barometric condensers were commonly used, which generated large quantities of contaminated wastewater. However, during the 1970's, barometric condensers were mostly replaced by surface condensers which has eliminated this water source.
Since 1972 (the year of the original EPA study of this industry), the petroleum refining industry has been steadily reducing the amount of water that it uses, and consequently discharges. Figure 5.1 (from EPA’s 1982 Development Document for this industry) presents water use in this industry from 1972 projected to 1984 as a percent of the water use in 1972. This graph indicates a steady reduction of water use, such that only 45 percent of the water used in 1972 was projected to be used in 1984. The BAT regulations promulgated in 1982 did not require any further flow reductions, however, as a result of litigation, the 1986 amendment to BAT and NSPS incorporated additional flow reduction as part of the basis for limitations for phenol and total chromium.
Since the early 1980's, it is believed that refineries have continued to undertake flow reductions. Data collected as part of this study show water use at many refineries well below 50 percent of the flows predicted by the BPT and BAT flow models. Some refineries are as low as 15 percent of their water use rates predicted by the BPT flow model. Table 5.1 presents a water use comparison for the 27 refineries surveyed in the EPA/OAR refineries survey between reported water use and that predicted by the BPT and BAT flow models. The water use rates shown in Table 5.1 for the 27 refineries average 62 percent of their predicted BPT flows, and 66 percent of their BAT predicted flow rates.
Further review of the data presented in Table 5.2 indicates that the unit process water use basis for the BPT and BAT flow models may not represent actual refinery practices. As can be seen in Figure 5.2, the flows predicted by the BPT and BAT flow models for a given refinery can vary by a factor of over 2 to 1. Although the model accounts for some of this difference, many refineries have reduced water consumption by using techniques not directly related to specific refining processes. Techniques such as water reuse, condensate recovery, elimination of leaks, etc., are not necessarily process unit-specific.

31
Figure 5.1 Water Use Trends

32
Table 5.1
ID #
Predicted and Actual Wastewater Flows for 27 Refineries
in Ascending Order of Actual/BPT Ratio
No.
Refiner
y
Size
(bbl/day
)
BPT
Subcategor
y
BPT
Flow
(MGD)
BAT
Flow
(MGD)
Actual
Flow
(MGD)
$
Ratio
Actual/
BPT
Ratio
Actual/
BAT
8
50202
111,765
D
4.40
3.90
0.80
*
0.18
0.21
27
50801
64,000
B
2.20
2.60
0.40
0.18
0.15
4
50102
45,400
A
1.45
0.49
0.40
0.28
0.82
21
50602
127,600
B
3.80
2.70
1.06
0.28
0.39
22
50603
100,000
B
2.70
3.20
0.78
0.29
0.24
9
50301
255,000
B
9.00
9.10
2.70
0.30
0.30
19
50503
209,966
E
7.00
6.20
2.20
0.31
0.35
7
50201
46,467
D
1.50
1.70
0.51
0.34
0.30
20
50601
74,200
B
1.43
1.26
0.55
0.38
0.44
24
50703
161,500
B
6.20
4.24
2.60
0.42
0.61
5
50103
316,600
B
14.40
12.57
6.60
0.46
0.53
10
50302
50,000
B
1.14
1.24
0.60
*
0.53
0.48
14
50402
175,877
B
5.45
5.05
2.90
0.53
0.57
11
50303
70,000
B
2.80
2.70
1.62
*
0.58
0.60
26
50705
120,300
B
6.20
4.30
3.73
*
0.60
0.87
12
50304
68,381
D
1.80
1.10
1.10
0.61
1.00
25
50704
151,359
C
4.60
4.80
2.83
0.62
0.59
17
50501
22,319
D
0.63
0.92
0.40
*
0.63
0.43
23
50701
217,200
D
12.67
9.41
8.10
0.64
0.86
15
50403
132,187
D
4.67
3.13
3.30
0.71
1.05
1
50001
73,100
B
2.07
1.88
1.50
0.72
0.80
16
50404
44,000
B
1.14
0.95
1.00
0.88
1.05
3
50101
57,000
B
1.30
1.43
1.20
*
0.92
0.84
6
50104
187,033
D
8.44
6.00
7.90
0.94
1.32
2
50002
50,000
B
2.50
4.30
3.30
*
1.32
0.77
18
50502
105,000
B
2.84
4.40
4.21
1.48
0.96
13
50401
45,856
B
0.96
1.19
1.50
1.56
1.26 Totals
113.29
100.76
63.79
Avg:
0.62
0.66
* Discharge to POTW Actual flow = Facilities total washwater flow - (stormwater and once through cooling water)

33
Figure 5.2. Comparison of Flow Predicted by BPT and BAT Models

34
The EPA/OAR survey obtained water use information from the 27 refineries surveyed. Each facility supplied a water balance diagram from which specific water flows were obtained. Table 5.2 summarizes these data. Flow information for the wastewater sources are summarized below:
Water Source
Percent of Total Discharge
Sour water stripper
19.6
Ballast water
4.2
Cooling tower blowdown
18.4
Pump compressors
1.94
Boiler blowdown
6.9
Water treatment
3.1
Desalter
20
Land farm
0.02
Cat. Reformer Scrubber
2.2
Tank draw down
2.4
Total
78.76
The remaining 21 percent cannot be accounted for. This is because most refineries do not have flow monitoring stations at their in-process discharge points, and therefore cannot complete a detailed water balance.
Data on water use was also collected from the six refineries visited as part of this study. Water use, as compared to their BPT and BAT flow model rates, is shown in Table 5.3. The four California refineries average 0.46 of their BPT flows, and 0.67 of their BAT model flows. The Texas and Pennsylvania refineries average 1.17 of their BPT model flows and 1.08 of their BAT model flows. Refineries located where there are water shortages and/or stringent local water quality standards have made great strides in reducing water usage.
Environmental concerns have driven refineries to produce additional, significant wastewater as a result of compliance efforts.
• Resource Conservation and Recovery Act (RCRA) or Clean Air Act regulations have resulted in refineries closing certain wastewater ponds, which has reduced evaporation of wastewater in the system.

35
• The need to more frequently and more rigorously test tank and pipeline integrity produces large quantities of hydrotest water, up to several million gallons at a time.
• Some refineries have discovered groundwater contamination (due to past failures in tank or pipeline integrity). To remediate this contamination may generate up to several million gallons of groundwater per day, which may need to be treated and discharged through the NPDES outfall.
• Additional U.S. Coast Guard requirements for accepting ballast water from vessels.

36
Table 5.2 Selected Sources of Wastewaters
Facil. No.
BPT Sub.
Dry Wt Process Flow*
Wastewater Sources in gallons per day
Cooling Tower
Pumps Com-
Boiler
Storm
Water
Desalter
Land
Cat
Reform
Tank Draw
00
Stripper Ballast Blowdn press. B.D. Treatmt Farm Scrub Down
00
50001 B 0.44 270,720 30,420 139,680 N/A 30,240 N/A 86,000 N/A 23,040 3,600
00
50002 B 3.3 N/A N/A N/A N/A N/A 6,067 N/A N/A N/A N/A N/A 50101 B 1.4 N/A 23,040 191,520 27,340 158,400 N/A N/A 130,000 0 14,247 1,370 50102 A 0.40 None N/A 28,800 N/A 21,600 604,800 N/A 144,000 N/A N/A 28,800 50103 B 6.6 1,022,400 20,000 706,000 None None 1,380,000 N/A N/A N/A 28,800 864,00 50104 D 6.57 475,200 N/A N/A N/A N/A 476,640 N/A N/A N/A N/A 140,00 50201 D 0.5 104,000 N/A 53,280 N/A 40,000 17,280 N/A 54,900 90 9,700 4,526 50202 D 0.5 720 N/A 193,000 N/A 25,200 214,000 N/A 254,900 N/A 21,600 5,600 50301 B 2.7 N/A N/A 500,000 N/A 497,000 374,000 N/A 625,000 None 150,000 144,00 50302 D 0.6 1,440 0 260,000 N/A 86,400 102,000 N/A 95,000 N/A N/A 1,440 50303 B 0.33 142,000 N/A N/A N/A N/A N/A N/A 104,000 N/A N/A 613 50304 D 1.1 None N/A N/A N/A N/A N/A N/A 144,000 N/A 535 432 50401 B 0.7 172,800 N/A 64,800 8,640 7,200 20,160 N/A 93,600 N/A N/A 1,440 50402 B 2.9 230,400 330 900,000 N/A None 170,000 N/A N/A N/A 128,000 4,320 50403 D 3.3 201,600 N/A 606,240 4,320 20,160 233,300 N/A N/A N/A 1,440 N/A 50404 B 1.0 1,350,000 N/A 100,000 N/A 10,000 75,000 N/A 110,000 N/A N/A 100 50501 B 0.40 None N/A 115,200 N/A 43,300 390,000 N/A 56,160 N/A 18,720 2,850
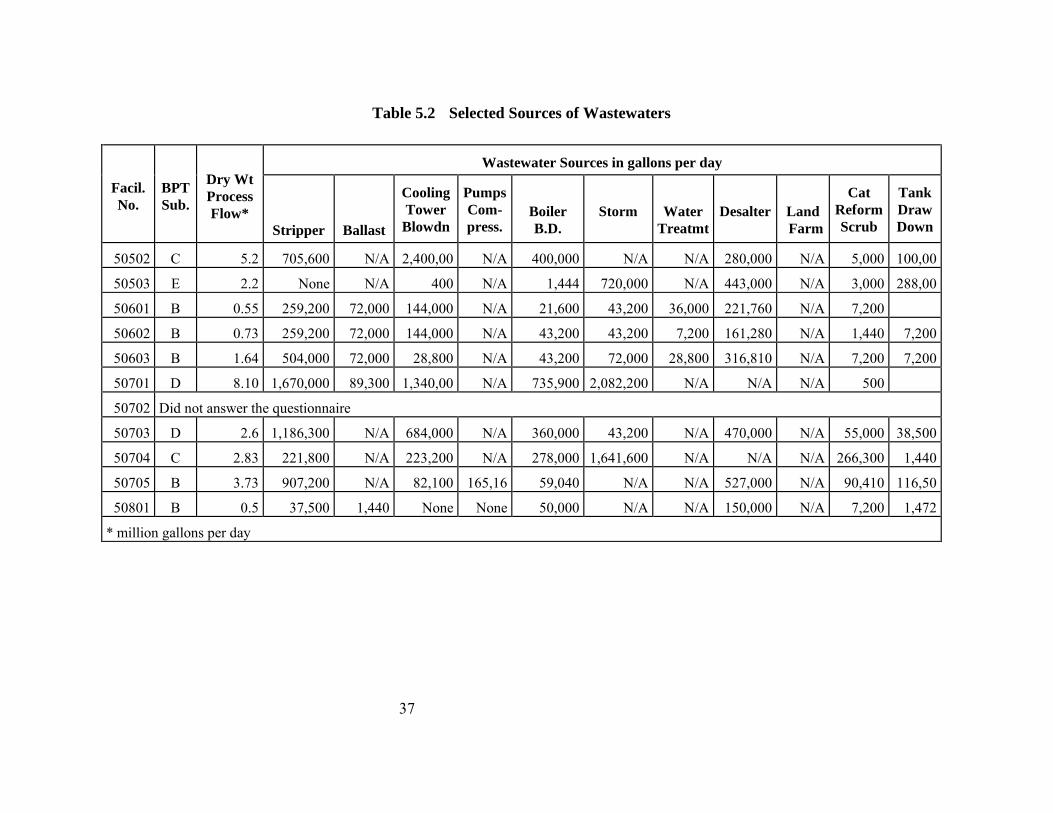
37
Table 5.2 Selected Sources of Wastewaters
Facil. No.
BPT Sub.
Dry Wt Process Flow*
Wastewater Sources in gallons per day
Stripper
Ballast
Cooling Tower
Blowdn
Pumps Com- press.
Boiler B.D.
Storm
Water Treatmt
Desalter
Land Farm
Cat
Reform Scrub
Tank Draw Down
50502
C
5.2
705,600
N/A
2,400,00
0
N/A
400,000
N/A
N/A
280,000
N/A
5,000
100,00
00 50503
E
2.2
None
N/A
400
N/A
1,444
720,000
N/A
443,000
N/A
3,000
288,00
00 50601
B
0.55
259,200
72,000
144,000
N/A
21,600
43,200
36,000
221,760
N/A
7,200
14,400 50602
B
0.73
259,200
72,000
144,000
N/A
43,200
43,200
7,200
161,280
N/A
1,440
7,200
50603
B
1.64
504,000
72,000
28,800
N/A
43,200
72,000
28,800 316,810
N/A
7,200
7,200
50701
D
8.10 1,670,000
89,300
1,340,00
0
N/A
735,900
2,082,200
N/A
N/A
N/A
500
400000
50702
Did not answer the questionnaire
50703
D
2.6 1,186,300
N/A
684,000
N/A
360,000
43,200
N/A
470,000
N/A
55,000
38,500
50704
C
2.83
221,800
N/A
223,200
N/A
278,000 1,641,600
N/A
N/A
N/A
266,300
1,440
50705
B
3.73
907,200
N/A
82,100 165,16
0
59,040
N/A
N/A
527,000
N/A
90,410
116,50
00 50801
B
0.5
37,500
1,440
None
None
50,000
N/A
N/A
150,000
N/A
7,200
1,472
* million gallons per day
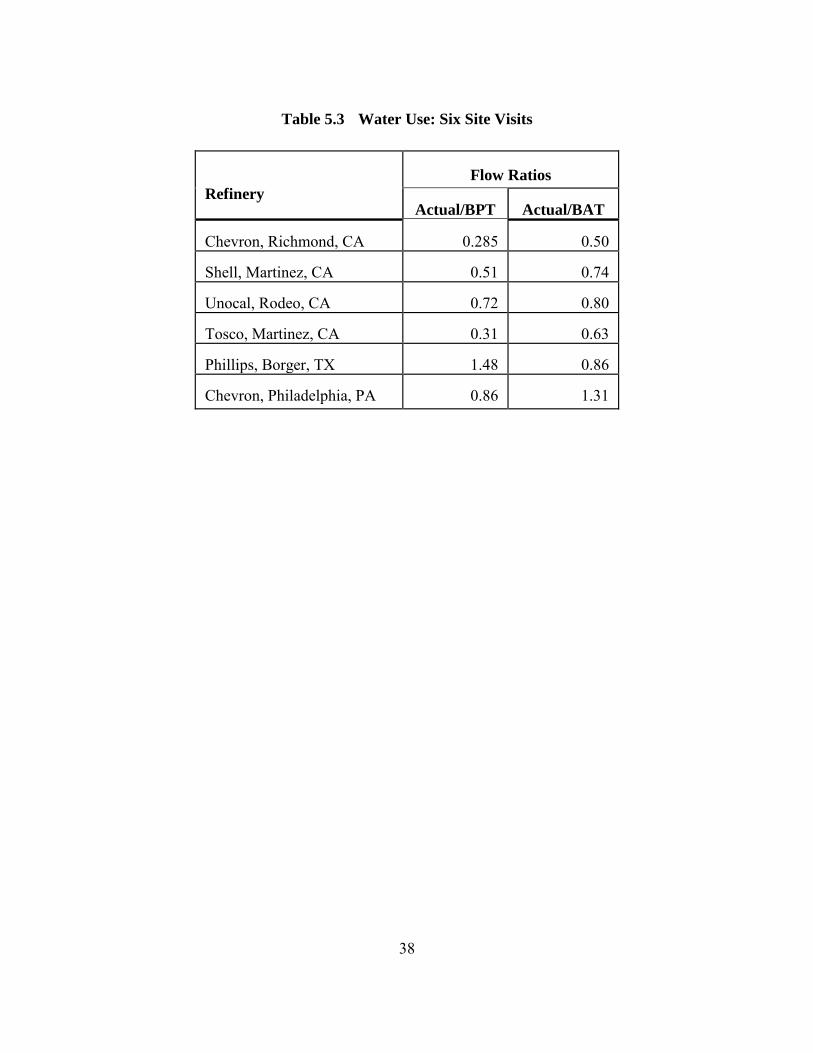
38
Table 5.3 Water Use: Six Site Visits
Refinery
Flow Ratios Actual/BPT
Actual/BAT
Chevron, Richmond, CA
0.285
0.50
Shell, Martinez, CA
0.51
0.74
Unocal, Rodeo, CA
0.72
0.80
Tosco, Martinez, CA
0.31
0.63
Phillips, Borger, TX
1.48
0.86
Chevron, Philadelphia, PA
0.86
1.31

39
6. Pretreatment Standards Review And Catalytic Reformer Issues 6.1 Indirect Discharging Refineries
EPA’s 1976 survey of this industry identified 44 indirect discharging refineries. Table 6.1 lists these facilities, along with their location and refining capacities. This list was compared to the Oil and Gas Journal 1991 list of operating refineries. Only 22 indirect discharging facilities are now believed to be in operation, and their 1991 refinery capacities are also shown in Table 6.1. As can be seen, a greater proportion of smaller refineries have closed since 1976. Although the number of indirect dischargers have been reduced by one half, total capacity of indirect discharge refineries has only dropped by 25 percent. 6.1.1 Treatment Technologies
The current pretreatment standards (PSES and PSNS) are based on the use of oil/water gravity separators and in-plant sour water stripping for ammonia. However, indirect discharging refineries use a variety of technologies. Table 4.3 presents a summary of the technologies in place at the seven indirect refineries included in the EPA/OAR survey. These seven facilities use a range of technologies including enhanced oil removal (four facilities), biological treatment (three facilities), sand filtration and activated carbon (one facility). Effluent Characteristics
Two data collection efforts were undertaken as part of this study to obtain effluent quality data from indirect discharging refineries. The first source of data was the Los Angeles County Sanitation Districts (LACSD) which have 14 indirect discharging refineries. LACSD has developed a comprehensive pretreatment program, in which the refineries have had to install enhanced oil removal systems such as dissolved air flotation. Table 6.2 presents a detailed summary of the data collected from these 14 facilities.
Data was also obtained from three other indirect discharging refineries and is summarized in Table 6.3. The facilities--La Gloria Oil and Gas Company, Tyler, Texas; Derby Refinery, Wichita, Kansas; and Clark Oil, Blue Island, Illinois--were selected to represent refinery discharges to smaller sewer systems that do not have as comprehensive a pretreatment program as LACSD.

40
Table 6.1 Summary Comparison of Locations and Capacities for Indirect
Dischargers Between 1976 and 1991
Name
Location
1976
Capacity
(1000
bbl/day)
1991
Capacity
(1000
bbl/day) Flint Chemical Co.
San Antonio, TX
1.0
1.9
Mid-America Refining Co., Inc.
Chanute, KS
3.0
-
Lunday Thagard Oil Co.
South Gate, CA
3.2
7.0
Eddy Refining Co.
Houston, TX
3.250
-
Chevron U.S.A., Inc.
Richmond Beach, WA
5.0
-
Northland Oil & Refining Co.
West Dickinson, ND
5.25
-
CRA, Inc.
Scottsbluff, NE
5.38
-
Lakeside Refining Co.
Kalamazoo, MI
5.92
5.6
Crystal Refining Co.
Carson City, MI
6.0
4.0
Edgington Oil Co., Inc.
Long Beach, CA
10.0
41.6
Sigmor Refinery Co.
Three Rivers, TX
10.0
53.0
Western Refining Co.
Woods Cross, UT
10.0
-
MacMillan Ring-Free Oil Co.
Long Beach, CA
12.2
-
Beacon Oil Co.
Hanford, CA
12.4
-
Saber Refining Co.
Corpus Christi, TX
13.0
-
Chevron U.S.A. Inc.
Portland, OR
14.0
16.0
U.S.A. Petrochem Corp.
Ventura, CA
15.2
-
Golden Eagle Refining Co., Inc.
Carson, CA
16.0
-
Amoco Oil Co.
Baltimore, MD
17.0
-
Ashland Petroleum Co.
Findlay, OH
20.0
-
Fletcher Oil & Refining Co.
Carson, CA
20.0
29.657
Winston Refining Co.
Fort Worth, TX
20.0
-

41
Table 6.1 Summary Comparison of Locations and Capacities for Indirect
Dischargers Between 1976 and 1991
Name
Location
1976
Capacity
(1000
bbl/day)
1991
Capacity
(1000
bbl/day)
Continental Oil Co. Wrenshall, MN 24.0 - Ashland Petroleum Co.
Louisville, KY
25.0
-
Husky Oil Co. of Delaware
North Salt Lake, UT
25.0
-
LaGloria Oil & Gas Co.
Tyler, TX
29.3
49.5
Derby Refining Co.
Wichita, KS
29.9
29.925
Pride Refining, Inc.
Abiline, TX
36.5
45.5
Amoco Oil Co.
Salt Lake City, UT
40.4
40.0
Delta Refining Co.
Memphis, TN
43.9
-
Mobil Oil Corp.
Buffalo, NY
44.0
-
Powerine Oil Co.
Santa Fe Springs, CA
44.1
46.5
Rock Island Refining Corp.
Indianapolis, IN
44.5
50.0
Quintana-Howell Joint Venture
Corpus Christi, TX
46.0
-
Douglas Oil Co.
Paramount, CA
48.0
42.7
Gulf Oil Co., U.S.A.
Santa Fe Springs, CA
53.8
44.0
Ashland Petroleum Co.
Tonawanda, NY
63.0
-
Marathon Oil Co.
Detroit, MI
66.0
70.0
Clark Oil and Refining Corp.
Blue Island, IL
70.0
66.5
Texaco Inc.
Wilmington, CA
80.0
95.0
Shell Oil Co.
Carson, CA
93.0
133.3
Crown Central Petroleum Corp.
Pasadena, TX
100.0
-
Union Oil Co. of California
Wilmington, CA
111.0
108.0
Mobil Oil Corp.
Torrance, CA
131.1
123.0
Totals 1,476.3 1,102.7

42
Table 6.2 Summary of Discharge Data for Major Refineries
Discharging to Los Angeles County Sanitation Districts (LACSD) January 1, 1990 through February 9, 1993
Analyte
Maxim
um
Minim
um
Average
pH
10.08
6.50
7.89
Suspended Solids (mg/l)
222.37
11.42
62.45 Ammonia Nitrogen (mg/l)
99.97
4.09
29.73
Total Cyanide (mg/l)
0.74
0.05
0.12 Soluble Sulfide (mg/l)
1.99
0.05
0.15
Thiosulfate (mg/l)
61.19
0.80
9.59 Sulfate (mg/l)
984.19
888.64
935.57
Sulfite (mg/l)
2.20
0.50
0.62 Mercaptans (mg/l)
2.25
0.10
0.65
Phenols (mg/l)
66.06
2.73
22.77 Total COD (mg/l)
1613.05
159.05
632.96
Oil & Grease (mg/l)
272.20
4.12
51.14 Non-polar Oil & Grease (mg/l)
53.75
27.40
40.59
Benzene (µg/l) 5523.89
87.71
1419.90
Toluene (µg/l) 7400.56
97.30
1783.86
Ethyl Benzene (µg/l)
572.64
42.73
167.82 o-xylene (µg/l)
1357.78
47.94
340.39
p-xylene (µg/l) 1366.25
674.37
1066.53
m+p xylene (µg/l) 2385.88
79.69
630.60
Chloroform (µg/l)
800.00
800.00
800.00 Naphthalene (µg/l)
143.60
143.60
143.60
2,4 Dimethyl phenol (µg/l)
359.50
359.50
359.50 Chrysene (µg/l)
10.50
10.50
10.50
Fluorene (µg/l)
6.50
6.50
6.50 Phenanthrene (µg/l)
15.00
15.00
15.00
2-Chlorophenol (µg/l)
22.00
22.00
22.00 2,4,6-Trichlorophenol (µg/l)
54.00
54.00
54.00
Acenaphthene (µg/l)
2.00
2.00
2.00 Pyrene (µg/l)
1.00
1.00
1.00
Total Chromium (mg/)
0.16
0.03
0.04 Lead (mg/l)
0.48
0.11
0.36
Zinc (mg/l)
2.00
0.19
0.42 Note: In calculating averages, one-half of the detection limit was used when "Less than" values were reported.

43
Table 6.3 Summary of Discharge Data for Major Refineries
Discharging to Local POTWs
Analyte
LaGloria Oil
and Gas Co.
Derby
Refining
Clark
Oil
Average Suspended Solids
(mg/l) Maximum Minimum Mean
720.00 40.00
126.61
248.00 1.00
25.68
484.00 20.50 76.14
Ammonia
Nitrogen (mg/l) Maximum Minimum Mean
38.00 0.60 9.72
32.6 10.6
21.35
85.30 0.90
18.38
51.96 4.03
16.48
Total Cyanide
(mg/l) Maximum Minimum Mean
0.19 0.01 0.04
0.12 0.09 0.10
0.15 0.05 0.07
Phenols (mg/l) Maximum Minimum Mean
3.50 <0.02
0.45
190.00 11.70 62.05
96.75 <5.86 31.25
Total COD (mg/l) Maximum Minimum Mean
2597.00 82.00
328.31
1196.22 244.00 557.46
1896.61 163.00 442.88
Oil & Grease
(mg/l) Maximum Minimum Mean
47.00 1.05 8.07
326.00 7.80
78.60
95.00 2.00
36.16
156.00 3.61
40.94
Total Chromium
(mg/l) Maximum Minimum Mean
1.36 0.36 0.86
2.18 1.01 1.62
1.77 0.68 1.24

44
Table 6.3 Summary of Discharge Data for Major Refineries
Discharging to Local POTWs
Analyte
LaGloria Oil
and Gas Co.
Derby
Refining
Clark
Oil
Average
Lead (mg/l) Maximum Minimum Mean
<0.10 <0.10 <0.10
0.10 0.06 0.08
<0.10 <0.08 <0.09
Zinc (mg/l) Maximum Minimum Mean
0.99 0.13 0.58
0.99 0.13 0.58
Sulfide Maximum Minimum Mean
12.00 <0.50
1.43
13.10 0.10 3.35
12.55 <0.30
2.39 BOD Maximum Minimum Mean
246.00 21.50 99.08
343.00 16.25
165.08 Total VOC's Maximum Minimum Mean
8.72 1.46 4.98
8.72 1.46 4.98
Total Dissolved
Solids Maximum Minimum Mean
2160.00 130.00
1121.61
2160.00 130.00
1121.61
pH
9.60 5.90 7.54
9.20 8.20 8.90
9.80 8.00 8.77
9.53 7.36 8.40
A summary is contained in Table 6.4 comparing effluent values for seven selected pollutants for which the data is shown in Tables 6.2 and 6.3. This comparison of the data indicates that the LACSD refineries are doing slightly better in the removal of oil (oil and grease) and total suspended solids.

45
Table 6.4 Data Comparison: Indirect
Discharging Refineries
Pollutant
Average Data (mg/l)
LACSD
Other
Refineries Oil & Grease
37.5
40.94
Suspended Solids
62.45
76.14
Benzene
0.83
Toluene
1.00
Phenols
21.64
31.25
Lead
0.36
0.09
Zinc
0.35
0.58
6.2 Dioxins in Catalytic Reformer Wastewaters
Polychlorinated dibenzo-p-dioxins and polychlorinated dibenzofurans (CDDs and CDFs, respectively) are closely related families of highly toxic and persistent organic chemicals which are formed as unwanted by-products in some commercially significant chemical reactions, during high temperature decomposition and combustion of certain chlorinated organic chemicals, and through other reactions involving chlorine and organic materials. CDDs and CDFs constitute a family of over 200 related chemical compounds with varying chemical, physical, and toxicological properties. The congener that appears to be the most toxic and has generally raised the greatest health concerns is 2,3,7,8-tetrachlorodibenzo-p-dioxin, abbreviated as 2378-TCDD.
Unfortunately, CDDs and CDFs are among the most persistent as well as the most toxic pollutants. Certain congeners, including 2378-TCDD, are highly bioaccumulative and lipophilic. The U.S. Centers for Disease Control has estimated the half life of 2378-TCDD in the environment to be about 12 years.
46
In 1988, CDDs and CDFs were found in internal waste streams at refineries in Canada. Further studies at refineries in the United States and Canada located the source of the CDDs and CDFs to be the regeneration of catalyst for the catalytic reforming operations. In particular the source was identified as the caustic and rinse wastewaters from certain types of regeneration processes.
One such study was conducted by the EPA Engineering and Analysis Division. The
objective of this study was to verify the analytical method for measuring CDD’s and CDF’s in refinery wastewater matrices, and to screen and characterize the wastewaters from the catalytic reforming catalyst regeneration processes for formulation of CDD’s and CDF’s. This report is included as Appendix G to this Preliminary Data Summary.
Catalytic reformers can be categorized by the type of catalyst regeneration system employed. The three major types of regeneration are:
1. Semi-Regenerative. Characterized by the shutdown of the entire reforming unit at specified intervals for in situ regeneration of the catalyst. Regenerations are generally limited to one or two per year.
2. Cyclic. Characterized by continual regeneration of the catalyst in situ in one of several reactors that is isolated from the naptha feed during regeneration. The remaining reactors continue reforming naphtha while regeneration of the catalyst occurs in the isolated reactor. There may be several regeneration cycles each year since one of the reactors is usually being operated in a regeneration mode.
3. Continuous. A portion of the catalyst is continually removed from the reformer, regenerated in a separate reactor, and returned to the reformer.
In all cases, the purpose of catalyst regeneration is to remove accumulated coke from the
catalyst under controlled combustion conditions and to replenish the catalyst with chlorine which is necessary for catalytic reactions to occur. Chlorine may be added in the form of chlorine gas, hydrochloric acid, or any of a number of chlorinated compounds including carbon tetrachloride, trichloromethane, dichloropropane, and dichlorethane. Reactions conditions of temperature, pressure and presence of free chlorine radicals and CDD and CDF precursors (various unchlorinated polycyclic compounds) are such that the potential exists for the formation of CDD’s and CDF’s during the catalyst regeneration cycle.
The off-gases from the regeneration processes contain combustion products, hydrochloric acid, and water vapor. Depending upon design considerations (materials of construction, etc.) off-gases may be scrubbed with a caustic or water solution, or vented directly to the atmosphere. Caustic scrubbing is more common at semi-regenerative reformers and generally not practiced at refineries with cyclic reformers.

47
6.2.1 Waste Characterization
As a result of these discoveries, refineries in both Canada and the U.S. have conducted waste characterization studies of their catalytic reformer regeneration wastes and their refinery final effluents in order to identify the presence of CDD’s and CDF’s.
Tables 6.5 and 6.6 present data resulting from sample and analysis from two Canadian refineries.

48
Table 6.5 Shell Canada Products Limited, Sarnia Refinery
Range of Dioxins/Furans in Internal Shell Wastewaters all figures in parts per billion
Sample
New
Caustic
Spent
Caustic
Scrubber
Water
Biological
Sludge
Combined
Effluent
2,3,7,8,8-4 CDD
ND**
0.0046 - 0.0054
ND
ND
ND
4CDD (Total)
ND
0.350 - 5.900*
0.0052 - 0.012
9.9 - 15
ND
5CDD
ND
0.400 - 8.200*
0.00076 - 0.002
9.0 - 17
ND
6CDD
ND
0.530 - 5.300*
0.00076 - 0.0012
17.0 - 23
ND
7CDD
ND
0.290 - l.500*
0.00091 - 0.0014
8.7 - 12
ND
8CDD
ND
0.230 - 1.300*
0.00052 - 0.00071
7.0 - 8.4
ND
Total Dioxins ***
1.810 - 22.200
0.00815 - 0.01731
51.6 - 75.4
4CDF
ND
0.380 - 6.1*
0.0051 - 0.010
8.2 - 10.0
ND
5CDF
ND
0.680 - 8.9*
0.0016 - 0.0038
12.0 - 16.0
ND
6CDF
ND
1.200 - 5.6*
0.0031 - 0.0057
24.0 - 31.0
ND
7CDF
ND
1.400 - 4.2*
0.0049 - 0.0084
28.0 - 40.0
0.00034 - 0.00022
8CDF
ND
0.760 - 2.5*
0.00071 - 0.0008
20.0 - 28.0
ND
Total Furans ***
4.420 - 27.3
0.01541 - 0.0287
92.2 - 125
* July samples by Shell; others are November Samples taken by Ontario MOE; all November samples were done in duplicate ** Non-detectable *** Totals may not add because highest and lowest concentrations for individual types of dioxins and furans did not occur in same samples.

49
Table 6.6 Esso Petroleum Canada, Sarnia Refinery
Powerformer Regeneration Study Dioxin and Furan Concentrations, December 16, 1988
(parts per trillion)
PCDF/PCDD
Isomer Group
Scrubber Water
BIOX Inlet
BIOX Outlet
1st 24
hours
2nd 24
hours
1st 24
hours
2nd 24
hours
1st 24
Hours
2nd 24
Hours
2378-TCDD
< 0.0005
< 0.012
4-TCDD
0.11
0.111
< 0.002
< 0.009
< 0.003
< 0.008
5-PCDD
0.030
0.072
< 0.005
< 0.005
< 0.008
< 0.004
6-HCDD
0.015
0.027
< 0.004
< 0.007
< 0.007
< 0.004
7-HCDF
0.042
0.041
< 0.04
< 0.02
< 0.01
< 0.01
8-OCDF
0.037
0.063
< 0.04
< 0.06
< 0.03
< 0.03
Total Dioxins
0.243
0.308
0.000
0.000
0.000
0.000
4-TCDF
0.32
0.48
< 0.002
0.051
< 0.002
< 0.002
5-PCDF
0.14
0.17
< 0.003
0.029
< 0.008
< 0.004
6-HCDF
0.071
0.11
< 0.02
< 0.007
< 0.006
< 0.002
7-HCDF
0.026
0.077
< 0.01
< 0.008
< 0.007
< 0.004
8-OCDF
0.071
0.21
< 0.02
< 0.03
< 0.02
< 0.02
Total Furans
0.628
1.038
0.000
0.080
0.000
0.000
2378-TCDD Toxic Equivalent
0.243
0.345
0.000
0.040
0.000
0.000
Notes 4-TCDD includes 2378-TCDD Totals and toxic equivalents do not include values below MDL. Assume less than detectable means zero.
CDD and CDF information was also collected as part of the six refinery visits conducted as part of this study. Table 6.7 presents a summary of catalytic reformer usage in the six refineries visited, and the availability of CDD/CDF analytical data. Table 6.8 through Table 6.10 present CDD/CDF analytical data obtained from three of the refineries from which information was obtained. In all cases, 2378-TCDD and 2378-TCDF levels in the refinery effluents were non-detectable.

50
Table 6.7 Catalytic Reforming Data: Six Site Visits
Refinery
Catalytic
Reforming
Semi-
Regeneration
Sample Data
Available
Chevron Richmond, CA
yes
yes
yes
Shell Martinez, CA
yes
no
N/A
Unocal Rodeo, CA
yes
yes
yes
Tosco Martinez, CA
yes
yes
yes
Phillips Borger, TX
yes
yes
no
Chevron Philadelphia, PA
yes
yes
no
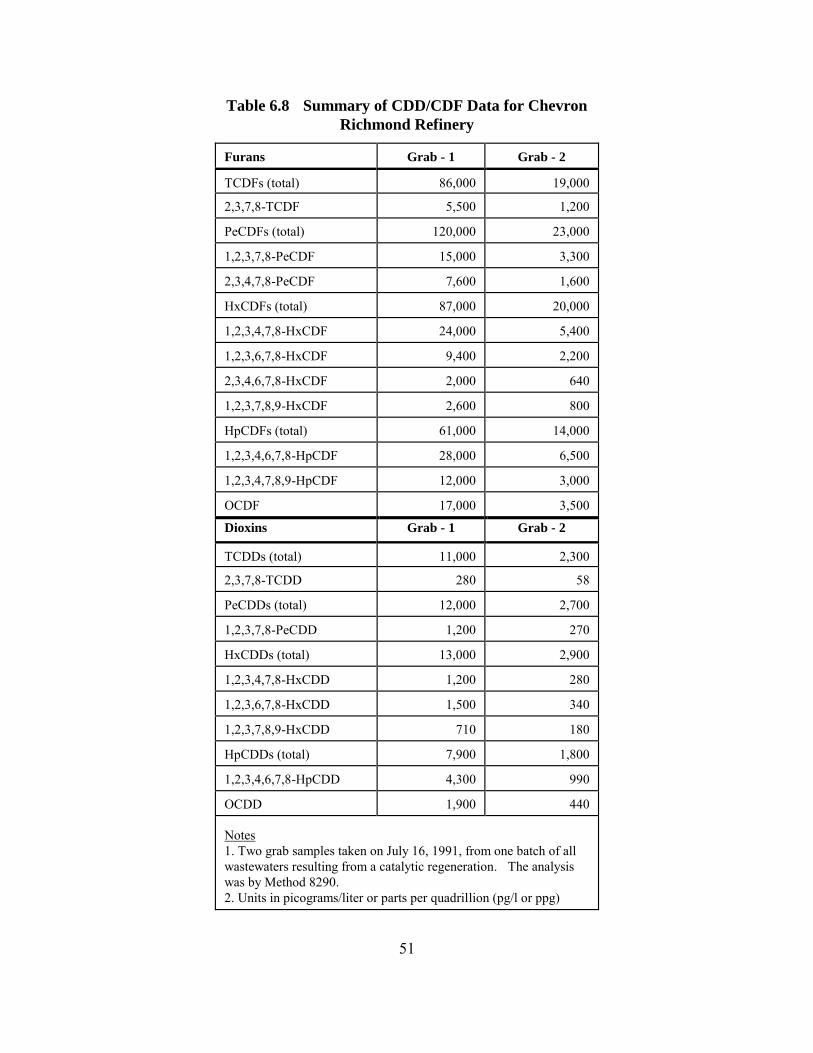
51
Table 6.8 Summary of CDD/CDF Data for Chevron
Richmond Refinery
Furans
Grab - 1
Grab - 2
TCDFs (total)
86,000
19,000
2,3,7,8-TCDF
5,500
1,200
PeCDFs (total)
120,000
23,000
1,2,3,7,8-PeCDF
15,000
3,300
2,3,4,7,8-PeCDF
7,600
1,600
HxCDFs (total)
87,000
20,000
1,2,3,4,7,8-HxCDF
24,000
5,400
1,2,3,6,7,8-HxCDF
9,400
2,200
2,3,4,6,7,8-HxCDF
2,000
640
1,2,3,7,8,9-HxCDF
2,600
800
HpCDFs (total)
61,000
14,000
1,2,3,4,6,7,8-HpCDF
28,000
6,500
1,2,3,4,7,8,9-HpCDF
12,000
3,000
OCDF
17,000
3,500
Dioxins Grab - 1 Grab - 2
TCDDs (total)
11,000
2,300
2,3,7,8-TCDD
280
58
PeCDDs (total)
12,000
2,700
1,2,3,7,8-PeCDD
1,200
270
HxCDDs (total)
13,000
2,900
1,2,3,4,7,8-HxCDD
1,200
280
1,2,3,6,7,8-HxCDD
1,500
340
1,2,3,7,8,9-HxCDD
710
180
HpCDDs (total)
7,900
1,800
1,2,3,4,6,7,8-HpCDD
4,300
990
OCDD
1,900
440
Notes 1. Two grab samples taken on July 16, 1991, from one batch of all wastewaters resulting from a catalytic regeneration. The analysis was by Method 8290. 2. Units in picograms/liter or parts per quadrillion (pg/l or ppg)

52
Table 6.9 Summary of CDD/CDF Data for Tosco Martinez Refinery
Furans
#2
Ref Prim. Burn
#2
Ref Mkup H20
#2
Ref Mkup H20
#3
Ref Regen
#3
Ref clean cond.
E-00
1 Back- grnd
E-00
1 Post
E-001 Post
Reana
TCDFs (total)
170
2.00
ND
750
0.081
ND
0.023
ND
2,3,7,8-TCDF
3.60
0.580
ND
7.0
ND
ND
0.013
ND
PeCDFs (total)
270
2.40
ND
1100 0.100
ND
ND
ND
1,2,3,7,8-PeCDF
13.0 0.120
ND
75.0
ND
ND
ND
ND
2,3,4,7,8-PeCDF
43.0 0.250
ND
180
ND
ND
ND
ND
HxCDFs (total)
450
3.40
ND
2300 0.140
ND
ND
ND
1,2,3,4,7,8-HxCDF
30.0 0.290
ND
227
ND
ND
ND
ND
1,2,3,6,7,8-HxCDF
37.0 0.270
ND
225
ND
ND
ND
ND
1,2,3,7,8,9-HxCDF
54.0 0.130
ND
300
ND
ND
ND
ND
2,3,4,6,7,8-HxCDF
21.0 0.290
ND
29.0
ND
ND
ND
ND
HpCDFs (total) 240.0
1.50
ND
1800
0.068
ND
ND
ND
1,2,3,4,6,7,8-HpCDF
98.0
0.750
ND
1100
ND
ND
ND
ND
1,2,3,4,7,8,9-HpCDF
32.0
0.150
ND
1100
ND
ND
ND
ND
OCDF
59.0 0.280
ND
500
ND
ND
ND
ND
Dioxins TCDDs (total)
6.50
0.100
ND
3.00
ND
ND
ND
ND
2,3,7,8-TCDD
ND
ND
ND
ND
ND
ND
ND
ND PeCDDs (total)
9.60
0.350
ND
ND
ND
ND
ND
ND
1,2,3,7,8-PeCDD
ND 0.020
ND
ND
ND
ND
ND
ND
HxCDDs (total)
18.0 0.460
ND
270
ND
ND
ND
ND
1,2,3,4,7,8-HxCDD
9.80
0.021
ND
7.60
ND
ND
ND
ND
1,2,3,6,7,8-HxCDD
2.50
0.042
ND
29.0
ND
ND
ND
ND
1,2,3,7,8,9-HxCDD
1.90
0.026
ND
32.0
ND
ND
ND
ND
HpCDDs (total)
3.80
0.330
ND
230
ND
ND
ND
ND
1,2,3,4,6,7,8-HpCDD
12.90
0.170
ND
110
ND
ND
ND
ND
OCDD
6.90
0.170
ND
130
ND
ND
ND
1.20
All results in picograms/milliliter (parts per trillion)

53
Table 6.10 Summary of CDD/CDF Data for Unocal
Rodeo Refinery
Test Parameters
Refinery # 231
Refinery #
244 9/16/90
2/23/91
6/27/91
Furans TCDFs (total)
1200
2300
2900
2,3,7,8-TCDF
230
61
160 PeCDFs (total)
1500
2800
270
1,2,3,7,8-PeCDF
170
160
36
2,3,4,7,8-PeCDF
240
260
38
HxCDFs (total)
3100
2000
48
1,2,3,7,8,9-HxCDF
830
190
11
2,3,4,6,7,8-HxCDF
430
290
11
2,3,4,6,7,8-HxCDF
390
190
5.4
1,2,3,7,8,9-HxCDF
340
330
9.3
HpCDFs (total)
2600
1600
58
1,2,3,4,6,7,8-HpCDF
2100
790
35
1,2,3,4,7,8,9-HpCDF
1300
260
13
OCDF
5300
440
17
Dioxins TCDDs (total)
550
600
65
2,3,7,8-TCDD
47
14
5.3 PeCDDs (total)
500
1500
22
1,2,3,7,8-PeCDD
120
130
3.9
HxCDDs (total)
1700
1100
15
1,2,3,4,7,8-HxCDD
150
120
ND (1.9)
1,2,3,6,7,8-HxCDD
250
200
ND (3.1)
1,2,3,7,8,9-HxCDD
370
190
ND (2.4)
HpCDDs (total)
2600
1700
14
1,2,3,4,6,7,8-HpCDD
1700
950
8.3
OCDD
3300
890
21
Note: Results in picograms/liter (ppq) for samples of regeneration wastewater

54
6.2.2 Available Treatment Technologies
The discovery of the presence of CDD/CDF’s in refinery wastewaters only occurred in the last three to five years. As a result, there have been limited studies of this problem, and only limited data on available technologies. The following sections present a summary of currently available control information. Flow Reduction
There is a very large range in water use found during regeneration of the catalyst from refinery to refinery. As a result, there may be opportunities to minimize the volumes of scrubber waters used at certain facilities. Modifications to off-gas cooling an scrubbing systems may be possible.
As can be seen by the waste characterization data presented earlier, there is a wide range in concentrations found. This may be caused by various process techniques used at each facility. Investigation into the causes of these variations in pollutant concentrations would be needed in order to determine whether there are in-process techniques that can reduce the quantities of CDD/CDF’s generated. Pretreatment
Since available data from Ontario and U.S. refineries indicate the more toxic CDD’s and CDF’s are found only in wastewaters from catalytic reforming (regeneration) operations, the most effective means to achieve minimum mass discharge of these compounds is to isolate an treat the low volume catalytic reforming regeneration process wastewaters prior to mixing with other refinery process or cooling waters, or stormwater. Accordingly, the regeneration process wastewaters should be collected and isolated in each refinery in appropriately sized equalization or holding tanks prior to treatment. The principal purposes of the holding or equalization tanks are to provide for temporary storage of reforming regeneration wastewaters and to provide for low volume constant feeds, thus allowing for design of downstream treatment systems at low hydraulic loading rates.
Based upon investigations by Shell Canada Products Limited, catalytic reforming regeneration wastewaters are characterized by relatively low concentrations of very fine suspended particulates. CDD’s and CDF’s are most often associated with particulate matter in wastewater matrices. Hence, relatively simple technologies such as conventional gravity settling or mixed media filtration that are incapable of fine particulate removal would not be effective for removal of CDD’s and CDF’s from catalytic reforming wastewaters.
The more advanced adsorption and membrane technologies require fairly clean feed streams in terms of TSS to prevent fouling and plugging. Although it appears that untreated catalytic reforming regeneration wastewaters do not contain TSS at levels likely to cause operating

55
problems in downstream units, consideration of pretreatment by filtration is recommended. Also, depending upon the reforming operation and the type of regeneration system and gas scrubbing system, the untreated wastewaters may be highly alkaline and unsuitable for direct feed to downstream treatment units. In these cases, neutralization with acid may be necessary.
Granular Activated Carbon
Adsorption on granular activated carbon offers several advantages over membrane technologies for removal of CDD’s and CDF’s from catalytic reforming wastewater. The technology is suitable for treatment of relatively large volumes of wastewaters contaminated with adsorbable organic contaminants at low levels. Aside from spent carbon, there are no by-product sludges or concentrated aqueous streams requiring further processing or treatment for ultimate disposal. Multiple carbon units can be used in parallel or series to ensure maximum removal. Finally, since catalytic reformer wastewater streams are relatively low in organic content, the life of the carbon beds should be relatively long, on the order of a few years as opposed to weeks or months.
Two Canadian refineries have installed temporary activated carbon treatment facilities and have applied for Certificates of Approval for permanent wastewater treatment facilities. Treatability and performance data from these systems are summarized in Tables 6.11 and 6.12. These data indicate consistently high removal rates for CDD’s and CDF’s (> 95 percent). Suncor recently reported consistent removal from current operations to non-detectable levels in the low parts per quadrillion range (ppq). Shell reported more than 96 percent removal during recent testing. All Ontario refineries have reported consistently no detection of the more toxic CDD and CDF congeners in treated refinery process wastewater effluents.
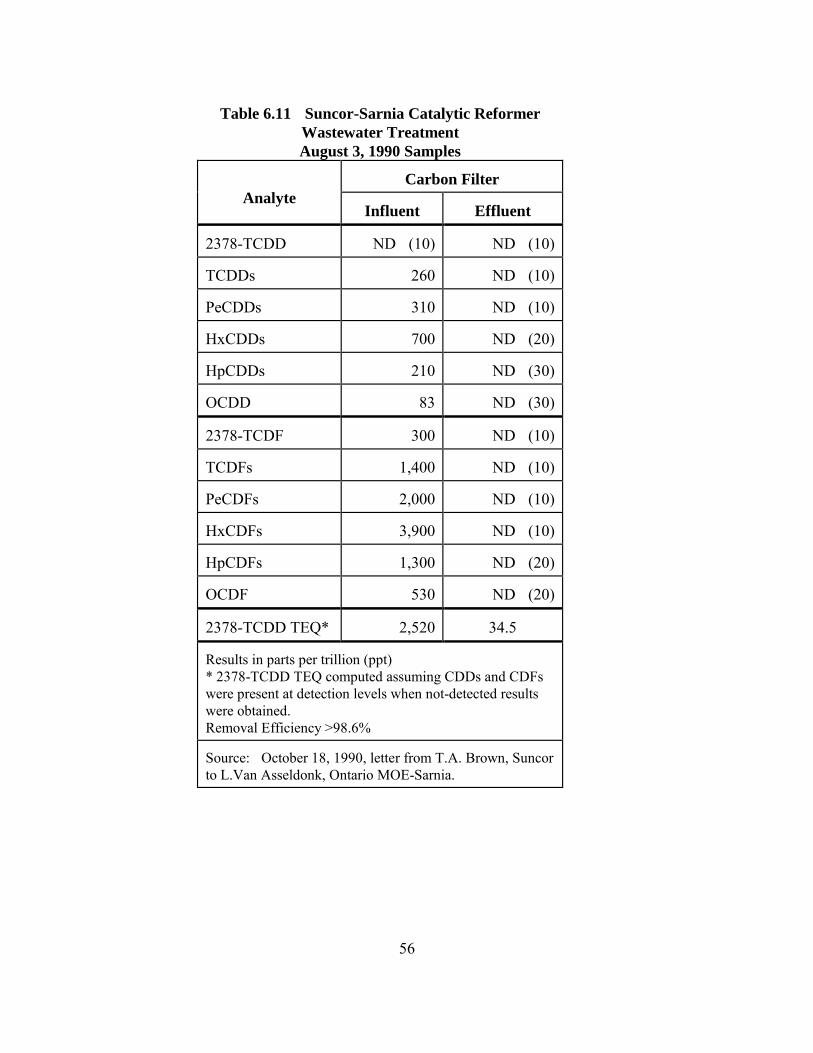
56
Table 6.11 Suncor-Sarnia Catalytic Reformer
Wastewater Treatment
August 3, 1990 Samples
Analyte
Carbon Filter
Influent
Effluent
2378-TCDD
ND (10)
ND (10)
TCDDs
260
ND (10)
PeCDDs
310
ND (10)
HxCDDs
700
ND (20)
HpCDDs
210
ND (30)
OCDD
83
ND (30)
2378-TCDF
300
ND (10)
TCDFs
1,400
ND (10)
PeCDFs
2,000
ND (10)
HxCDFs
3,900
ND (10)
HpCDFs
1,300
ND (20)
OCDF
530
ND (20)
2378-TCDD TEQ*
2,520
34.5
Results in parts per trillion (ppt) * 2378-TCDD TEQ computed assuming CDDs and CDFs were present at detection levels when not-detected results were obtained. Removal Efficiency >98.6% Source: October 18, 1990, letter from T.A. Brown, Suncor to L.Van Asseldonk, Ontario MOE-Sarnia.

57
Table 6.12 Shell Canada-Sarnia, Catalytic Reformer
Wastewater Treatment
Spent Caustic, May 9, 1991
Analyte Carbon Filter
Influent Effluent 2378-TCDD
< 5.5
0.21
TCDDs
95
5.9 12378-PeCDD
15
0.3
PeCDDs
120
7.3 123478-HxCDD
8.5
0.35
123678-HxCDD
25
0.8 123789-HxCDD
< 5.8
0.84
HxCDDs
140
8 1234678-HpCDD
86
3.9
HpCDDs
140
7.2 OCDD
90
4.7
2378-TCDF
54
0.43 TCDFs
210
8.5
12378-PeCDF
13
1.6 23478-PeCDF
27
1.3
PeCDFs
350
16 123478-HxCDF
220
9.2
123678-HxCDF
120
3.5 234678-HxCDF
47
1.8
123799-HxCDF
27
< 0.057 HxCDFs
580
28
1234678-HpCDF
400
18 1234789-HpCDF
69
3.2
HpCDF
590
29 OCDF
260
15
2378-TCDD TEQ
431
4.54 Results in parts per trillion (ppt) Removal Efficiency 98.9% Source: June 26, 1991, letter from D. Atwell, Shell Canada to A. Peterson, Ontario MOE-Sarnia.

58
7. Evaluation of Pollutant Discharges And Environmental Issues
The purpose of this section is to present a preliminary assessment of the pollutant loadings and potential water quality impacts of discharges from petroleum refining facilities to surface waters and publicly-owned treatment works (POTWs). Using readily available data and information sources on refinery wastewater volume and constituents, annual loadings and average concentration are estimated. In addition, potential aquatic life and human health impacts are summarized based on a review of documented environmental impacts and a review of the physical-chemical properties and toxicity of pollutants associated with wastewater discharges from the petroleum refining industry. The following sections of this report describe the methodology and results (including data sources and assumptions/limitations) used in the identification of documented environmental impacts, the identification and quantification of pollutant releases, and the evaluation of the fate and toxicity of released pollutants. Additional details on specific information addressed in this section are presented in the Appendices. 7.1 Identification And Quantification of Pollutant Releases
Petroleum refining wastewater constituents are identified using two EPA data bases: the Permit Compliance System (PCS) and the Toxic Release Inventory (TRI). The identified constituents are listed on Table 7.1. Annual loadings are obtained from both PCS and TRI data for a variety of parameters including conventional, priority, and non-conventional pollutants. TRI encompasses direct and indirect discharges, whereas PCS covers direct discharges only. Average pollutant concentrations are also retrieved from PCS for analysis. A brief description of each data base, the methodology to identify and quantify releases, add the assumptions and limitations of the analyses are described below.
Table 7.1 Refinery Wastewater Constituents
Constituent CAS Number
Number of
1992 PCS
Parameters
Number of
1991 TRI
Parameters
Number of 1992
TRI Parameters
1,1,1-Trichloroethane 71556 0 1 1
1,1,2-Trichloroethane 79005 0 1 1
1,2-Dibromoethane 106934 0 1 1
1,2-Dichlorobenzene 95501 1 0 0
1,2-Dichloroethane 107062 0 1 1
1,2,4-Trimethylbenzene 95636 0 1 1
1,3-Butadiene 106990 0 1 1
1,4-Dichlorobenzene 106467 1 0 0
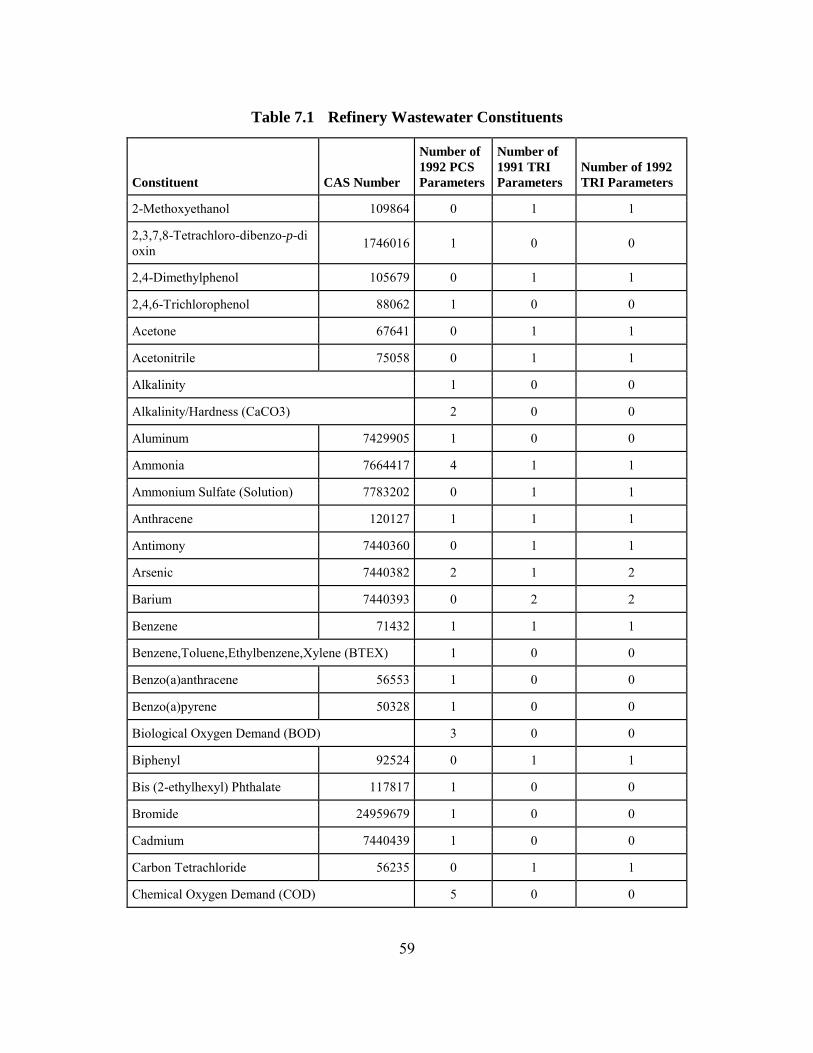
59
Table 7.1 Refinery Wastewater Constituents
Constituent CAS Number
Number of
1992 PCS
Parameters
Number of
1991 TRI
Parameters
Number of 1992
TRI Parameters
2-Methoxyethanol 109864 0 1 1
2,3,7,8-Tetrachloro-dibenzo-p-dioxin 1746016 1 0 0
2,4-Dimethylphenol 105679 0 1 1
2,4,6-Trichlorophenol 88062 1 0 0
Acetone 67641 0 1 1
Acetonitrile 75058 0 1 1
Alkalinity 1 0 0
Alkalinity/Hardness (CaCO3) 2 0 0
Aluminum 7429905 1 0 0
Ammonia 7664417 4 1 1
Ammonium Sulfate (Solution) 7783202 0 1 1
Anthracene 120127 1 1 1
Antimony 7440360 0 1 1
Arsenic 7440382 2 1 2
Barium 7440393 0 2 2
Benzene 71432 1 1 1
Benzene,Toluene,Ethylbenzene,Xylene (BTEX) 1 0 0
Benzo(a)anthracene 56553 1 0 0
Benzo(a)pyrene 50328 1 0 0
Biological Oxygen Demand (BOD) 3 0 0
Biphenyl 92524 0 1 1
Bis (2-ethylhexyl) Phthalate 117817 1 0 0
Bromide 24959679 1 0 0
Cadmium 7440439 1 0 0
Carbon Tetrachloride 56235 0 1 1
Chemical Oxygen Demand (COD) 5 0 0

60
Table 7.1 Refinery Wastewater Constituents
Constituent CAS Number
Number of
1992 PCS
Parameters
Number of
1991 TRI
Parameters
Number of 1992
TRI Parameters
Chloride 16887006 1 0 0
Chlorine 7782505 1 1 1
Chlorine Dioxide 10049044 0 1 1
Chloroform 67663 1 0 1
Chromium 7440473 1 2 2
Chromium, Hexavalent 18540299 1 0 0
Chromium, Trivalent 16065831 1 0 0
Chrysene 218019 1 0 0
Cobalt 7440484 1 2 1
Copper 7440508 1 2 2
Cresol (Mixed Isomers) 1319773 0 1 1
Cumene 98828 0 1 1
Cyanide 57125 3 0 1
Cyclohexane 110827 0 1 1
Diethanolamine 111422 0 1 1
Dissolved Oxygen (DO) 1 0 0
Ethylbenzene 100414 1 1 1
Ethylene 74851 0 1 1
Ethylene Glycol 107211 0 1 1
Fluoride 16984488 1 0 0
Formaldehyde 50000 0 1 1
Glycol Ethers 0 1 1
Hexachlorobenzene 118741 1 0 0
Hydrocarbons 3 0 0
Hydrogen Cyanide 74908 0 1 1
Hydrogen Fluoride 7664393 0 1 0
Iron 7439896 3 0 0
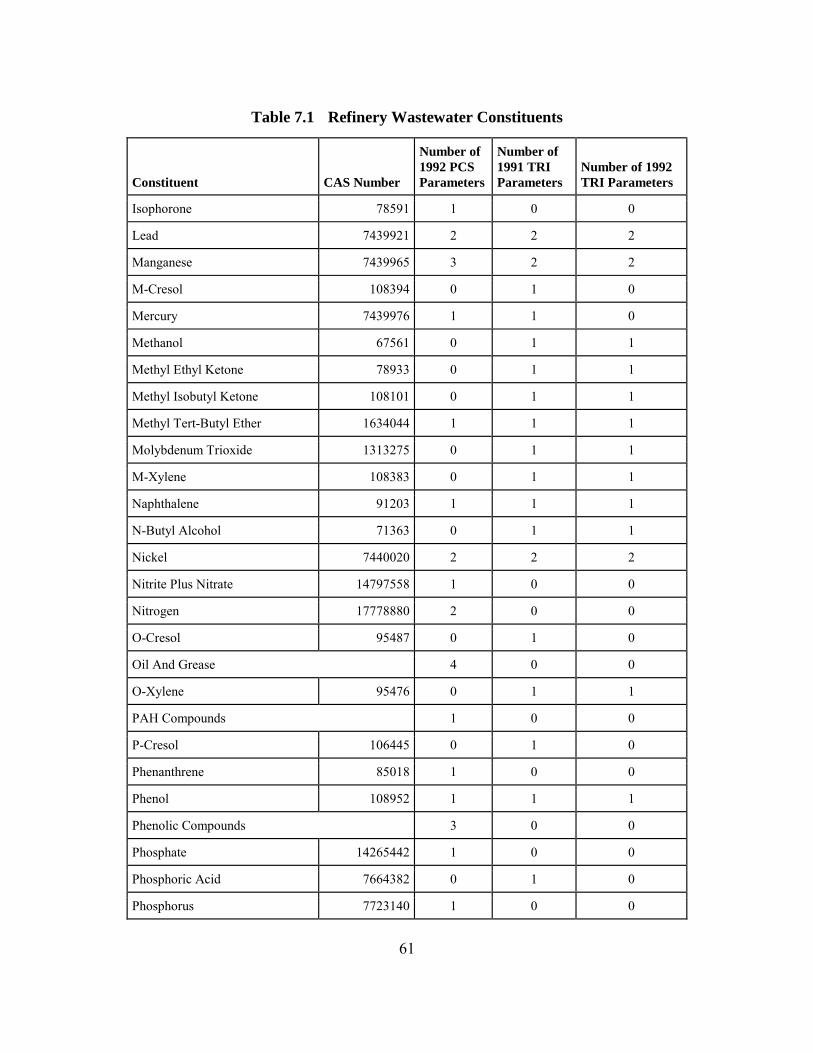
61
Table 7.1 Refinery Wastewater Constituents
Constituent CAS Number
Number of
1992 PCS
Parameters
Number of
1991 TRI
Parameters
Number of 1992
TRI Parameters
Isophorone 78591 1 0 0
Lead 7439921 2 2 2
Manganese 7439965 3 2 2
M-Cresol 108394 0 1 0
Mercury 7439976 1 1 0
Methanol 67561 0 1 1
Methyl Ethyl Ketone 78933 0 1 1
Methyl Isobutyl Ketone 108101 0 1 1
Methyl Tert-Butyl Ether 1634044 1 1 1
Molybdenum Trioxide 1313275 0 1 1
M-Xylene 108383 0 1 1
Naphthalene 91203 1 1 1
N-Butyl Alcohol 71363 0 1 1
Nickel 7440020 2 2 2
Nitrite Plus Nitrate 14797558 1 0 0
Nitrogen 17778880 2 0 0
O-Cresol 95487 0 1 0
Oil And Grease 4 0 0
O-Xylene 95476 0 1 1
PAH Compounds 1 0 0
P-Cresol 106445 0 1 0
Phenanthrene 85018 1 0 0
Phenol 108952 1 1 1
Phenolic Compounds 3 0 0
Phosphate 14265442 1 0 0
Phosphoric Acid 7664382 0 1 0
Phosphorus 7723140 1 0 0

62
Table 7.1 Refinery Wastewater Constituents
Constituent CAS Number
Number of
1992 PCS
Parameters
Number of
1991 TRI
Parameters
Number of 1992
TRI Parameters
Polychlorinated Biphenyls (PCBs)
1336363 1 0 0
Polyram 9006422 1 0 0
Propylene 115071 0 1 1
P-Xylene 106423 0 1 1
Residual Oxidants 1 0 0
Selenium 7782492 2 2 1
Silver 7440224 1 1 1
Sodium Chloride (Salt) 7647145 1 0 0
Styrene 100425 0 1 1
Sulfate 14808798 1 0 0
Sulfide 18496258 2 0 0
Sulfite 14265433 1 0 0
Sulfuric Acid 7664939 0 1 1
Surfactants (MBAS) 1 0 0
Tetrachlorodibenzofuran, 2,3,7,8- 51207319
Tetrachloroethylene 127184 1 0 0
Thallium 7440280 0 1 0
Toluene 108883 1 1 1
Total Dissolved Solids (TDS) 2 0 0
Total Organic Carbon (TOC) 1 0 0
Total Oxygen Demand (TOD) 1 0 0
Total Suspended Solids (TSS) 1 0 0
Total Toxic Organics (TTO) 1 0 0
Trichloroethylene 79016 1 0 0
Trichlorophenol 25167822 1 0 0
Vanadium 7440622 1 1 0
Xylene 1330207 1 1 1

63
Table 7.1 Refinery Wastewater Constituents
Constituent CAS Number
Number of
1992 PCS
Parameters
Number of
1991 TRI
Parameters
Number of 1992
TRI Parameters
Zinc 7440666 2 2 2
7.1.1 Permit Compliance System
EPA’s Office of Wastewater Management (OWM) oversees the NPDES program on a national level. EPA has authorized 39 States and the Virgin Islands to administer the NPDES program. EPA regional offices administer the program in non-delegated States. More than 65,000 active NPDES permits have been issued to facilities throughout the nation. PCS has extensive records on approximately 7,000 permits which are classified as “major”. Facilities are classified as “major” based on consideration of many factors, including effluent design flow, physical and chemical characteristics of the wastestream, and location of discharge. Each permit record in PCS may contain information that:
• Identifies and describes the facility to which the permit has been granted (including a primary Standard Industrial Classification (SIC) code);
• Specifies the pollutant discharge limits for that facility; • Records the actual amounts of pollutants measured in the facility’s wastewater
discharges; and • Tracks the facility’s history of compliance with construction, pollutant limits, and
reporting requirements. Major facilities must report compliance with NPDES permit limits, usually on a monthly
basis, via Discharge Monitoring Reports (DMRs). DMRs provide detailed information on measured concentrations, including those that are in violation of established limits for the permit. DMR data entered into PCS include the type of violation (if any), concentration and quantity values, and monitoring period. The PCS data base is revised and updated twice weekly and, therefore, data retrieved at a specific time are subject to subsequent alteration. In addition, because of data entry delays, a complete set of data for a particular time period may not exist until a year or more afterwards.
Among the permits listed in PCS are specific discharge limits or monitoring requirements for over 200 individual chemicals.
64
7.1.2 Estimation of Annual Pollutant Loads from PCS
It is important to recognize that, unlike TRI, PCS is a permit tracking system, rather than a repository of pollutant release amounts. However, an optional report in PCS called “Effluent Data Statistics” (EDS) can process PCS data to produce annual loading values. EDS uses the following hierarchy to derive a loading for each measured parameter: (1) reported loading value in PCS (i.e., mass-based permit limit); and (2) loading estimate based on discharge flow and concentration measurement. Depending on the monitoring requirements imposed by the permit, flows and concentrations may be reported in many different ways. Measurements from PCS are selected in the following order of preference: (1) average concentration; (2) maximum concentration; and (3) minimum concentration. Estimated loadings are produced for records with valid concentrations (as defined by PCS-EDS) and corresponding flow data assuming 30 operating days per month for each facility. Loadings are estimated using the following general equation:
Load = Flow * Conc * Conversion Factors Where:
Load = Specific pollutant load from a facility per unit time; Flow = Facility effluent flow per unit time; Conc = Concentration of a pollutant; and
Conversion Factors = Appropriate factors to convert reported units to standard units.
The Engineering and Analysis Division identified 138 permitted direct dischargers as petroleum refineries potentially subject to effluent guidelines regulations. For these facilities, EDS processed loading data for the calendar year 1992 were retrieved at the discharge pipe level for each PCS parameter addressed in the permit with sufficient quantity or concentration/ discharge flow information. The loads for each parameter were summed across discharge pipes to yield the total facility load. Concentration measurements recorded as below a detection limit were treated in two ways: (1) for a low end estimated loading data set, values below detection were set equal to zero; and (2) for a high end estimated loading data set, values below detection were set equal to one-half the recorded detection limit. Parameters loadings based on concentration measurements always below detection at a given discharge pipe were set equal to zero for both data sets. The low end and high end data sets are presented in Table 7.2 for all petroleum refining parameters. Multiple parameters sometimes exist for the same pollutant. For example, zinc is represented by parameters for “total recoverable zinc” and “total zinc” as (Zn).

65
Table 7.2 1992 Annual Loading Data from PCS
Sorted by Parameter Name
Parameter
Number
Parameter Name
Number
of
Facilities
Annual Load
Low-End
(lbs/yr)
Annual Load
High-End
(lbs/yr)
Selected for
Production-
Weighting
34536
1,2-dichlorobenzene
1
0.00
0.00
34571 1,4-dichlorobenzene
1
0.00
0.00
34675 2,3,7,8-tetrachloro-dibenzo-p-dioxin
1
0.00
0.00
34621 2,4,6-trichloro-phenol
1
0.00
0.00
415 Alkalinity, Phenol- Phthaline Method
2
50,709.60
50,709.60
410 Alkalinity, Total (as CaCO3)
1
327,630.01
327,630.01
1105 Aluminum, Total (as Al)
5
3,625.64
3,869.49
●
619 Ammonia, unionized
1
4.38
4.38
34220 Anthracene
1
0.00
0.00
1002 Arsenic, Total (as As)
9
2,512.36
2,524.06 ●
978 Arsenic, Total Recoverable
1
562.30
562.30
34030 Benzene
6
67.52
67.88
●
30383 Benzene, Ethylbenzenetoluene, Xylene Combn
1
0.00
0.00
34526 Benzo(A)Anthracene
1
0.00
0.00
34247 Benzo(A)Pyrene
1
0.00
0.00
39100 Bis (2-Ethylhexyl) Phthalate
1
14.19
14.19
●
310 BOD, 5-Day (20 Deg. C)
100
9,552,282.39
9,579,814.21
●
311 BOD, 5-Day Dissolved
1
47,619.34
47,619.34
80082 BOD, Carbonaceous 5 Day, 20 Deg.C
5
81,823.31
81,823.31
71870 Bromide (as Br)
1
4,750.17
4,750.17
●
1027 Cadmium, Total (as Cd)
7
33.09
48.17
●
680 Carbon, Tot Organic (TOC)
54
15,728,883.65
15,811,467.64 ●
81017 Chemical Oxygen Demand (COD)
8
5,157,384.29
5,157,384.29
940 Chloride (as Cl)
12
26,851,306.87
26,851,306.87 ●
50060 Chlorine, Total Residual
15
469,150.37
469,165.52
●
32106 Chloroform
3
3.76
3.76
●
1032 Chromium, Hexavalent (as Cr)
84
5,731.06
6,246.07
●
1034 Chromium, Total (as Cr)
93
21,081.95
21,666.80
●
1033 Chromium, Trivalent (as Cr)
3
159.30
181.90
34320 Chrysene
1
0.00
0.00
1037 Cobalt, Total (as Co)
5
10.25
40.35
●
1042 Copper, Total (as Cu)
17
4,017.84
4,180.82
●

66
Table 7.2 1992 Annual Loading Data from PCS
Sorted by Parameter Name
Parameter
Number
Parameter Name
Number
of
Facilities
Annual Load
Low-End
(lbs/yr)
Annual Load
High-End
(lbs/yr)
Selected for
Production-
Weighting
81208
Cyanide, Free (not amenable to chlorination)
1
78.13
109.16
720 Cyanide, Total (as Cn)
9
2,353.27
2,384.00 ●
722 Cyanide, Free (amen. to chlorin.)
4
521.70
521.70
34371 Ethylbenzene
2
224.96
1,237.05
●
56
Flow Rate
3
31,776.87
31,776.87
50050 Flow, in conduit or thru treatment plant
108
1,583,221.78
1,583,221.78
951 Fluoride, Total (as F)
5
208,305.59
208,305.59
●
900 Hardness, Total (as CaCO3)
1
1,632,518.41
1,632,518.41
39700 Hexachlorobenzene
1
0.05
0.05
●
39942 Hydrocarbons, Aromatic
2
10.55
10.55
46116 Hydrocarbons, Total Gas Chromat.
1
12,293.02
12,293.02
551 Hydrocarbons, in H2O, IR, CC14 Ext. Chromat.
3
13,509.68
13,536.22
●
980 Iron, Total Recoverable
1
2,377.94
2,377.94
1046 Iron, Dissolved (as Fe)
1
34.78
49.05
1045 Iron, Total (as Fe)
1
15.89
15.89
●
34408 Isophorone
1
0.00
0.00
1114 Lead, Total Recoverable
1
67.80
140.47
1051 Lead, Total (as Pb)
12
1,266.47
2,688.44
●
1056 Manganese, Dissolved (as Mn)
1
4,998.97
4,998.97
1055 Manganese, Total (as Mn)
1
483.75
483.75
●
11123 Manganese, Total Recoverable
1
5,097.37
5,097.37
71900 Mercury, Total (as Hg)
10
827.28
832.39
●
22417 Methyl Tert-Butyl Ether
2
1,334.15
1,334.15
●
34696 Naphthalene
1
0.00
0.00
1074 Nickel, Total Recoverable
1
143.87
178.51
1067 Nickel, Total (as Ni)
7
2,021.08
2,140.30
●
630 Nitrite Plus Nitrate Total
1
12,701.94
12,701.94
610 Nitrogen, Ammonia, Total (as N)
102
3,015,792.35
3,031,910.08
●
71845 Nitrogen, Ammonia, Total (as NH4)
1
19,448.10
19,448.10
612 Nitrogen, Ammonia, Tot. Unionized (as N)
2
4,136.28
4,136.28
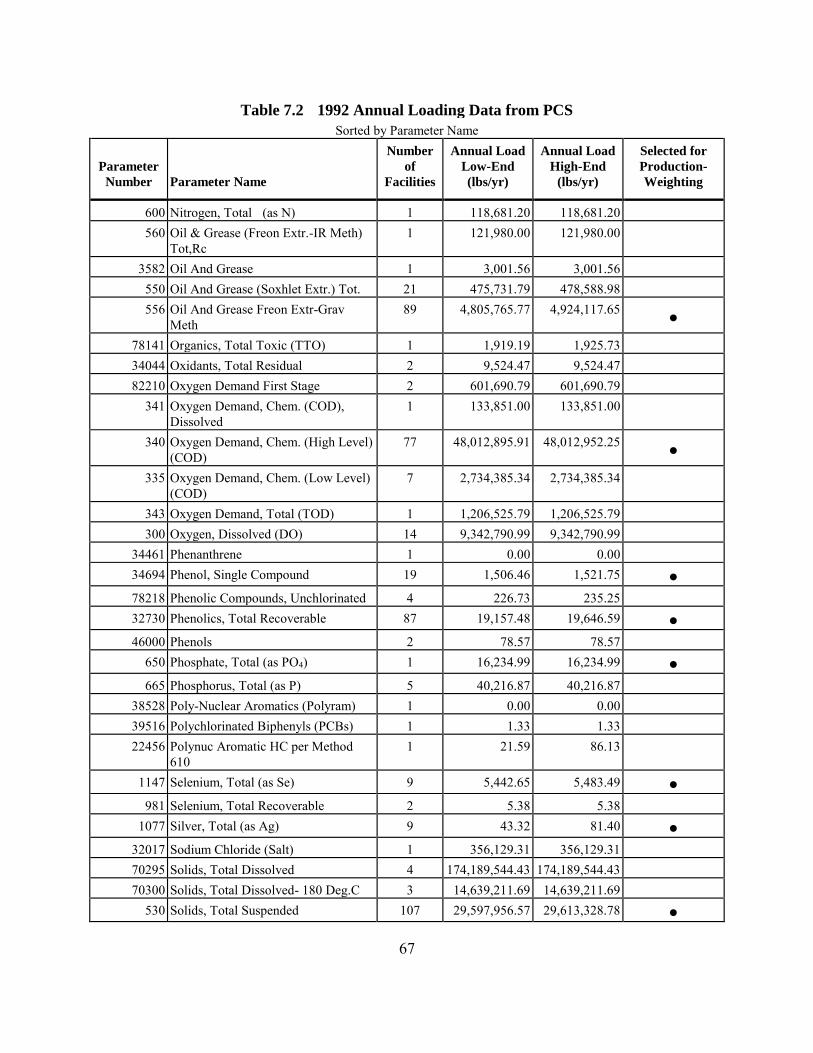
67
Table 7.2 1992 Annual Loading Data from PCS
Sorted by Parameter Name
Parameter
Number
Parameter Name
Number
of
Facilities
Annual Load
Low-End
(lbs/yr)
Annual Load
High-End
(lbs/yr)
Selected for
Production-
Weighting
600
Nitrogen, Total (as N)
1
118,681.20
118,681.20
560 Oil & Grease (Freon Extr.-IR Meth) Tot,Rc
1
121,980.00
121,980.00
3582 Oil And Grease
1
3,001.56
3,001.56
550 Oil And Grease (Soxhlet Extr.) Tot.
21
475,731.79
478,588.98
556 Oil And Grease Freon Extr-Grav Meth
89
4,805,765.77
4,924,117.65
●
78141 Organics, Total Toxic (TTO)
1
1,919.19
1,925.73
34044 Oxidants, Total Residual
2
9,524.47
9,524.47
82210 Oxygen Demand First Stage
2
601,690.79
601,690.79
341 Oxygen Demand, Chem. (COD), Dissolved
1
133,851.00
133,851.00
340 Oxygen Demand, Chem. (High Level) (COD)
77
48,012,895.91
48,012,952.25
●
335 Oxygen Demand, Chem. (Low Level) (COD)
7
2,734,385.34
2,734,385.34
343 Oxygen Demand, Total (TOD)
1
1,206,525.79
1,206,525.79
300 Oxygen, Dissolved (DO)
14
9,342,790.99
9,342,790.99
34461 Phenanthrene
1
0.00
0.00
34694 Phenol, Single Compound
19
1,506.46
1,521.75
●
78218 Phenolic Compounds, Unchlorinated
4
226.73
235.25
32730 Phenolics, Total Recoverable
87
19,157.48
19,646.59
●
46000 Phenols
2
78.57
78.57
650 Phosphate, Total (as PO4)
1
16,234.99
16,234.99
●
665 Phosphorus, Total (as P)
5
40,216.87
40,216.87
38528 Poly-Nuclear Aromatics (Polyram)
1
0.00
0.00
39516 Polychlorinated Biphenyls (PCBs)
1
1.33
1.33
22456 Polynuc Aromatic HC per Method 610
1
21.59
86.13
1147 Selenium, Total (as Se)
9
5,442.65
5,483.49
●
981 Selenium, Total Recoverable
2
5.38
5.38
1077 Silver, Total (as Ag)
9
43.32
81.40
●
32017 Sodium Chloride (Salt)
1
356,129.31
356,129.31
70295 Solids, Total Dissolved
4
174,189,544.43
174,189,544.43
70300 Solids, Total Dissolved- 180 Deg.C
3
14,639,211.69
14,639,211.69
530 Solids, Total Suspended
107
29,597,956.57
29,613,328.78
●

68
Table 7.2 1992 Annual Loading Data from PCS
Sorted by Parameter Name
Parameter
Number
Parameter Name
Number
of
Facilities
Annual Load
Low-End
(lbs/yr)
Annual Load
High-End
(lbs/yr)
Selected for
Production-
Weighting
81395
Storm Water Flow
3
835.87
835.87
945 Sulfate, Total (as SO4)
6
1,951,597.35
1,951,597.35
81621 Sulfide, Total
5
6,329.89
6,415.89
745 Sulfide, Total (as S)
93
27,861.12
30,592.20
●
741 Sulfite (as S)
1
221.70
226.35
38260 Surfactants (MBAS)
2
828.92
828.92
34475 Tetrachloroethylene
1
0.00
0.00
17 Thermal Discharge, million BTUs per day
1
1,344,075.39
1,344,075.39
34010 Toluene
3
1,093.01
2,022.41
●
39180 Trichloroethylene
1
0.00
0.00
1087 Vanadium, Total (as V)
5
27,379.00
27,680.95
●
81551 Xylene
1
0.89
0.89
●
1094 Zinc, Total Recoverable
3
1,416.01
1,416.01
1092 Zinc, Total (as Zn)
19
13,841.55
14,078.59
●
To support EPA’s industry selection process for future effluent guidelines development, further refinement of the EDS loading data was conducted as follows:
• Exclude conventional and classical parameter loads (e.g., TSS, BOD, Oil and Grease, COD) that represent groups of individual chemicals;
• Exclude relatively non-toxic anion and cation parameter loads (e.g., phosphorus, phosphate, chloride, sulfate, sulfite nitrogen, nitrite, sodium chloride, and sodium);
• Exclude nonconventional parameter loads that represent groups of individual chemicals (e.g., total recoverable phenolics);
• Include the parameter with the maximum loading reported if multiple parameters are reported for the same chemical at the same discharge pipe;
• Sum chemical parameter loads across all discharge pipes to calculate a facility pollutant load; and
• Include only reported loadings, representing the high-end estimated data, and not extrapolated national projections.
A listing of pollutant loadings used in the industry selection is presented in Appendix H.

69
Many of the parameters listed on Table 7.2 are measured at only a portion of the petroleum refineries. Therefore, the loading values represent a sample of all petroleum refining wastewater discharges. Based on the assumption that the constituents listed on Table 7.2 are present in the effluent of all refineries, the loading data for several parameters were extrapolated to a national level for two sets of facilities: (1) facilities in California, and (2) facilities not in California. Total loads for California facilities were estimated separately because these facilities employ significantly different practices with respect to water conservation and treatment systems (i.e., activated carbon). To assist in verifying the presence of wastewater constituents in petroleum refining effluent, EPA undertook a limited review of Form 2C NPDES Applications, which require a chemical analysis of current or proposed discharges. This review, summarized in Appendix F, indicates the presence of 37 individual wastewater constituents, 20 of which are among the constituents selected for production weighting. Five of the chemicals reported as above detection on at least one Form 2C are represented by less than five facilities in the 1992 PCS loadings data set. The extrapolation procedure is based on the ratio of petroleum production level at the facilities measuring a given parameter to the overall industry production level. Production levels (in barrels per day) were obtained from data presented for 138 direct dischargers (13 in California) in the Oil and Gas Journal (Thrash, 1991). The set of 138 facilities, listed on Table 7.3 with production data, is assumed to represent all direct dischargers. The total production level for direct dischargers in California is 1,619,950 barrels per day; the total production level for direct dischargers not in California is 12,376,556 barrels per day. In general, parameters representing individual chemicals, and parameters representing conventional pollutants or pollutant groups that have a large sample size, are selected for inclusion in the production weighted data set. These parameters are identified in Table 7.2. The general equation for production weighted extrapolation is given as:
Where: TOTLOAD = Total extrapolated load
SMPLOAD = Sample load based on facilities reporting the parameter in PCS
TOTPROD = Total production level SMPPROD = Sample production level
TOTLOAD = SMPLOAD *
TOTPROD
SMPPROD

70
Table 7.3 Crude Production for 138 Direct Discharging
Petroleum Refineries
Sorted by State and Company Name
NPDES
Permit No.
Company
City
State
Crude
Production
(bbl/day) AK0000841
Tesoro Alaska Petroleum Co
Kenai
AK
72,000
AL0000574 Gamxx Energy, Inc., Theodore
Mobile County
AL
26,500
AL0000973 Hunt Refining Company
Tuscaloosa
AL
33,500
AL0055859 LL&E Petroleum Marketing Inc
Saraland
AL
80,000
AR0000663 Berry Petroleum Corp-Stephens
Stephens
AR
5,700
AR0000591 Cross Oil-Smackover
Smackover
AR
6,770
AR0000647 Lion Oil Company
El Dorado
AR
48,000
CA0000680 ARCO
Carson
CA
223,000
CA0005134 Chevron U.S.A. Products Co.
Richmond
CA
205,000
CA0000337 Chevron U.S.A., Inc.
El Segundo
CA
254,000
CA0005550 Exxon Co., USA
Benicia
CA
128,000
CA0005096 Pacific Refining Co.
Hercules
CA
52,250
CA0057177 Powerine Oil Co.
Santa Fe Springs
CA
46,500
CA0005789 Shell Oil Co.
Martinez
CA
140,100
CA0003778 Texaco Refining/Marketing Inc.
Wilmington
CA
95,000
CA0055387 Torrance Refinery
Torrance
CA
123,000
CA0004961 Tosco Refining Co.
Martinez
CA
132,000
CA0005053 Union Oil Co. Of Ca.
Rodeo
CA
56,550
CA0000809 Unocal
Carson
CA
108,000
CA0000051 Unocal Corporation
Arroyo Grande
CA
56,550
CO0001210 Colorado Refining Company
Commerce City
CO
28,000
CO0001147 Conoco, Inc.
Commerce City
CO
48,000
CO0000078 Landmark Petroleum, Inc.
Fruita
CO
15,200
DE0000256 Star Enterprises
Delaware City
DE
140,000
GA0001902 Young Refining Corp
Douglasville
GA
7,500
HI0000329 Chevron U.S.A., Inc.
Honolulu
HI
52,800
IL0001244 Clark Oil-Wood River
Hartford
IL
57,000
IL0004219 Indian Refining-Lawrenceville
Lawrenceville
IL
54,000
IL0004073 Marathon Oil-Robinson
Robinson
IL
170,000
IL0002861 Mobil Oil-Joliet Ref
Joliet
IL
180,000
IL0000205 Shell Oil Co.-Wood River
Roxana
IL
274,000
IL0001589 Uno-Ven Company-Lemont
Lemont
IL
147,000
IN0000108 American Oil Company (Amoco)
Whiting
IN
350,000
IN0002470 Countrymark Cooperative, Inc.
Mount Vernon
IN
20,600
IN0001244 Laketon Refining Corporation
Laketon
IN
8,300

71
Table 7.3 Crude Production for 138 Direct Discharging
Petroleum Refineries
Sorted by State and Company Name
NPDES
Permit No.
Company
City
State
Crude
Production
(bbl/day) IN0002364
Marathon Petroleum Co., Ird
Indianapolis
IN
50,000
KS0000205 Coastal Ref. & Marketing
Butler County
KS
30,400
KS0000248 Farmland-Coffeyville Refinery
Coffeyville
KS
59,600
KS0050997 Farmland-Phillipsburg Refinery
Phillipsburg
KS
26,400
KS0000761 Texaco Refining & Marketing Inc
El Dorado
KS
80,000
KS0000434 Total Petroleum, Inc
Arkansas City
KS
56,000
KY0000388 Ashland Petroleum Co
Ashland
KY
213,400
KY0094579 Somerset Refinery Inc
Somerset
KY
5,500
LA0032417 Atlas Processing Co-Shreveport
Shreveport
LA
46,200
LA0003115 BP Oil Company
Belle Chasse
LA
218,500
LA0052370 Calcasieu Refining Co.
Lake Charles
LA
13,500
LA0046612 Calumet Refining Co.
Princeton
LA
4,376
LA0006963 Canal Refining-Church Point
Church Point
LA
9,865
LA0005941 Citgo Petroleum Corp.
Lake Charles
LA
320,000
LA0003026 Conoco Inc-Lake Charles Refine
Westlake
LA
159,500
LA0005584 Exxon Co USA-Baton Rouge
Baton Rouge
LA
421,000
LA0005312 Kerr-Mcgee Corp-Cotton Valley
Cotton Valley
LA
7,800
LA0045683 Marathon Oil Co
Garyville
LA
225,000
LA0004260 Mobil Oil Corp-Chalmette
Chalmette
LA
160,000
LA0003646 Murphy Oil USA Inc
Meraux
LA
97,000
LA0051942 Phibro Energy USA, Inc-Krotz
Krotz Springs
LA
56,700
LA0054216 Phibro Energy USA, Inc-St.Rose
St Rose
LA
28,300
LA0039390 Placid Refining Co-Port Allen
Port Allen
LA
48,000
LA0003522 Shell Oil Co-Norco
Norco
LA
215,000
LA0006041 Star Enterprise
Convent
LA
225,000
MI0003778 Lakeside Refining Co
Kalamazoo
MI
5,600
MI0001066 Total Petroleum Inc
Alma
MI
45,600
MN0000256
Ashland Oil Inc
Saint Paul Park
MN
67,100
MN0000418
Koch Refining Co-Rosemount
Rosemount
MN
218,500
MS0002984
Amerada Hess Corp Purvis
Purvis
MS
30,000
MS0001481 Chevron USA
Pascagoula
MS
295,000
MS0034711 Ergon Refining Incorporated
Vicksburg
MS
16,800
MS0001686 Southland Oil Company
Sandersville
MS
11,000

72
Table 7.3 Crude Production for 138 Direct Discharging
Petroleum Refineries
Sorted by State and Company Name
NPDES
Permit No.
Company
City
State
Crude
Production
(bbl/day) MS0001678
Southland Oil Lumberton
Lumberton
MS
5,800
MT0000264 Cenex-Laurel Refinery
Laurel
MT
40,400
MT0000256 Conoco Inc
Billings
MT
24,750
MT0029742 Conoco, Inc
Billings
MT
24,750
MT0000477 Exxon Co USA (Billings Refin.)
Billings
MT
42,000
MT0000434 Montana Refining Co-Blackeagle
Black Eagle
MT
7,000
ND0000248 Amoco Oil Company
Mandan
ND
58,000
NJ0001511 Bayway Refining Company
Linden
NJ
13,000
NJ0000221 Chevron USA Inc
Perth Amboy
NJ
80,000
NJ0005401 Coastal Eagle Point Oil Co
West Deptford
NJ
109,520
NJ0005029 Paulsboro Refinery
Paulsboro
NJ
100,000
NJ0028878 Port Reading Refining Fac
Port Reading
NJ
50,000
NY0028592 Cibro Petroleum Products, Inc
Albany
NY
39,900
OH0005657 Ashland Oil, Inc.
Canton
OH
66,000
OH0002461 BP Oil Company
Toledo
OH
120,650
OH0002623 BP Oil Company
Lima
OH
142,500
OH0002763 Sun Refining & Marketing Co
Toledo
OH
125,000
OK0000256 Conoco Inc.-Ponca City Refiner
Ponca City
OK
140,000
OK0000825 Kerr-Mcgee Corp-Garvin
Wynnewood
OK
43,000
OK0001309 Sinclair Oil Corporation
Tulsa
OK
50,000
OK0000876 Sun Refining & Marketing Compa
Tulsa
OK
85,000
OK0001295
Total Petroleum
Ardmore
OK
68,000
PA0012637 BP Oil Inc.
Marcus Hook
PA
171,000
PA0011533 Chevron U.S.A. Products, Co.
Philadelphia
PA
175,000
PA0002551 Pennzoil United Inc Rouseville
Rouseville,
PA
15,700
PA0011096 Sun Refining & Marketing, Inc
Philadelphia
PA
130,000
PA0005304 United Refining Co-Warren
Warren
PA
64,600
PA0002674 Witco Chem Corp
Bradford
PA
10,000
PR0000370 Caribbean Gulf Refining Corp
Bayamon
PR
38,000
PR0000400 Puerto Rico Sun Oil Co.
Yabucoa
PR
85,000
TN0059226 Mapco Petroleum,Inc
Shelby County (Mbo)
TN
75,000
TX0002984
Amoco Texas Refining Company
Texas City
TX
433,000
TX0004847 Chevron USA Inc
TX
66,000

73
Table 7.3 Crude Production for 138 Direct Discharging
Petroleum Refineries
Sorted by State and Company Name
NPDES
Permit No.
Company
City
State
Crude
Production
(bbl/day) TX0005991
Chevron USA Inc Port Arthur
Port Arthur
TX
315,300
TX0006211 Citgo Refining & Chemicals Inc
Corpus Christi
TX
132,500
TX0066591 Coastal Refinig & Marketing, I
Corpus Christi
TX
45,125
TX0006904 Coastal Refining & Marketing,
Corpus Christi
TX
45,125
TX0004626 Crown Central Petr-Houston
Pasadena
TX
100,000
TX0088331 Diamond Shamrock Refining & Ma
Three Rivers
TX
53,000
TX0006271
Exxon Corp-Houston
Baytown
TX
396,000
TX0104515 Fina Oil & Chem-Big Spr
Big Spring
TX
55,000
TX0004201 Fina Oil & Chem-Port A
Jefferson County
TX
110,000
TX0084778 Howell Hydrocarbons & Chem. In
Houston
TX
1,900
TX0006289
Koch Refining Co
Corpus Christi
TX
125,000
TX0001449 La Gloria Oil & Gas Co-Tyler
Tyler
TX
49,500
TX0003247 Lyondell Petrochemical Co.
Houston
TX
265,000
TX0003697 Marathon Oil Company
Texas City
TX
70,000
TX0004227 Mobil Chem-Beaumont
Jefferson County
TX
275,000
TX0002976 Phibro Energy USA, Inc-Houston
Houston
TX
67,000
TX0006009 Phibro Energy USA, Inc-Tx City
Texas City
TX
123,500
TX0009148 Phillips 66 Co-Hutchins
Borger
TX
105,000
TX0007536 Phillips 66 Co-Sweeny Refinery
Sweeny
TX
175,000
TX0004871 Shell Oil Co-Deer Park
Harris County
TX
215,900
TX0006599 Southwestern Refining-Corpus C
Corpus Christi
TX
104,000
TX0005835 Star Enterprise-Port Arthur
Port Arthur
TX
250,000
TX0063355 Valero Refining Co.-Corpus Chr
Corpus Christi
TX
27,000
UT0000175 Chevron U.S.A., Inc
Salt Lake City
UT
45,000
UT0000507 Phillips 66 Company
West Bountiful
UT
25,000
VA0003018 American Oil Yorktown
Yorktown
VA
53,000
VI0000019 Hess Oil Virgin Islands Corp
St. Croix
VI
545,000
WA0022900
ARCO Petroleum Products Co
Ferndale
WA
167,000
WA0002984
BP Oil Company
Ferndale
WA
90,250
WA0000761
Shell Oil Co
WA
89,300
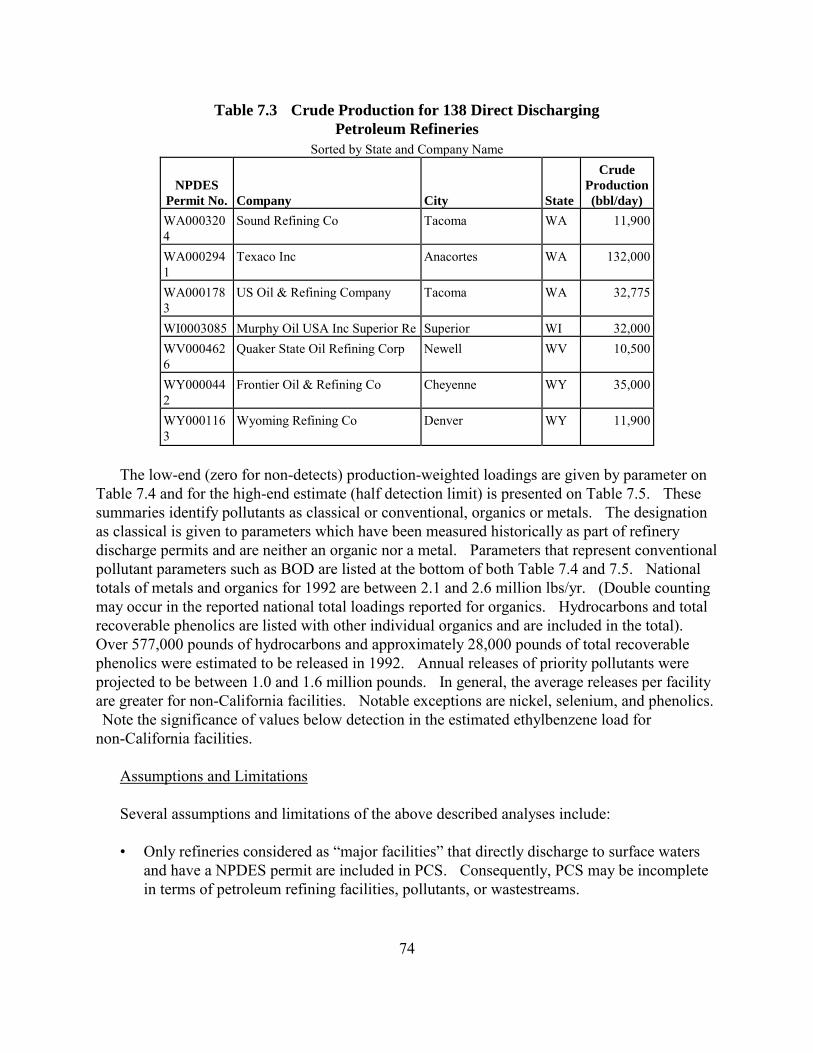
74
Table 7.3 Crude Production for 138 Direct Discharging
Petroleum Refineries
Sorted by State and Company Name
NPDES
Permit No.
Company
City
State
Crude
Production
(bbl/day) WA0003204
Sound Refining Co
Tacoma
WA
11,900
WA0002941
Texaco Inc
Anacortes
WA
132,000
WA0001783
US Oil & Refining Company
Tacoma
WA
32,775
WI0003085
Murphy Oil USA Inc Superior Re
Superior
WI
32,000
WV0004626
Quaker State Oil Refining Corp
Newell
WV
10,500
WY0000442
Frontier Oil & Refining Co
Cheyenne
WY
35,000
WY0001163
Wyoming Refining Co
Denver
WY
11,900
The low-end (zero for non-detects) production-weighted loadings are given by parameter on
Table 7.4 and for the high-end estimate (half detection limit) is presented on Table 7.5. These summaries identify pollutants as classical or conventional, organics or metals. The designation as classical is given to parameters which have been measured historically as part of refinery discharge permits and are neither an organic nor a metal. Parameters that represent conventional pollutant parameters such as BOD are listed at the bottom of both Table 7.4 and 7.5. National totals of metals and organics for 1992 are between 2.1 and 2.6 million lbs/yr. (Double counting may occur in the reported national total loadings reported for organics. Hydrocarbons and total recoverable phenolics are listed with other individual organics and are included in the total). Over 577,000 pounds of hydrocarbons and approximately 28,000 pounds of total recoverable phenolics were estimated to be released in 1992. Annual releases of priority pollutants were projected to be between 1.0 and 1.6 million pounds. In general, the average releases per facility are greater for non-California facilities. Notable exceptions are nickel, selenium, and phenolics. Note the significance of values below detection in the estimated ethylbenzene load for non-California facilities.
Assumptions and Limitations
Several assumptions and limitations of the above described analyses include:
• Only refineries considered as “major facilities” that directly discharge to surface waters
and have a NPDES permit are included in PCS. Consequently, PCS may be incomplete in terms of petroleum refining facilities, pollutants, or wastestreams.

75
• Facilities are not required by their NPDES permit to report on all chemicals actually discharged. A facility is only required to report on a particular chemical if it is specified in the permit conditions.
• Although EDS converts all values to standard units, there are an undetermined number of unit code/measurement value mismatches in PCS, as well as invalid discharge flow records and analytical test results, that cannot be readily identified after EDS processing.
• National production-weighted load estimates assume that all petroleum refineries in a particular grouping discharge similar waste streams. The fewer the data points in a parameter sample set, the greater the uncertainty that the parameter loading rate is representative of refinery discharge in general.
Table 7.4 Comparison of California and Non-California PCS Loads
after Production Weighting (Low-End Estimate)
Parameter Name
Poll.
Type
*
Non-Calif. Loads
California Loads
Total
Load
(lb/yr)
Priority
Pollutants
(lb/yr)
Total
(lb/yr)
Average
(lb/fac/yr)
Total
(lb/yr)
Average
(lb/fac/yr)
Bromide (as Br)
C
1,187,691
9,502
1,187,691
Chloride (as Cl)
C
146,706,014
1,173,648
107,420,130
8,263,087
254,126,144
Chlorine, Total Residual
C
3,717,957
29,744
39,083
3,006
3,757,040
Cyanide, Total (as CN)
C
10,050
80
5,488
422
15,538
15,538
Fluoride, Total (as F)
C
6,911,812
55,294
6,911,812
Nitrogen, Ammonia, Total (as N)
C
3,552,591
28,421
178,232
13,710
3,730,823
Phosphate, Total (as PO4)
C
1,148,190
9,186
1,148,190
Sulfide, Total (as S)
C
35,723
286
1,738
134
37,461
Subtotal
163,270,028
1,306,160
107,644,672
8,280,359
270,914,700
15,538
Aluminum, Total (as Al)
M
11,368
91
14,736
1,134
26,104
Arsenic, Total (as As)
M
78,851
631
764
59
79,615
79,615 Cadmium, Total (as Cd)
M
780
6
19
1
799
799
Chromium, Hexavalent (as Cr)
M
7,433
59
89
7
7,522
7,522
Chromium, Total (as Cr)
M
24,450
196
3,088
238
27,537
27,537
Cobalt, Total (as Co)
M
33
3
33
Copper, Total (as Cu)
M
27,787
222
625
48
28,412
28,412
Iron, Total (as Fe)
M
2,459
20
2,459
Lead, Total (as Pb)
M
13,840
111
117
9
13,957
13,957
Manganese, Total (as Mn)
M
70,437
563
70,437
Mercury, Total (as Hg)
M
14,600
117
9
1
14,609
14,609
Nickel, Total (as Ni)
M
11,298
90
3,975
306
15,274
15,274 Selenium, Total (as Se)
M
7,758
62
11,691
899
19,449
19,449
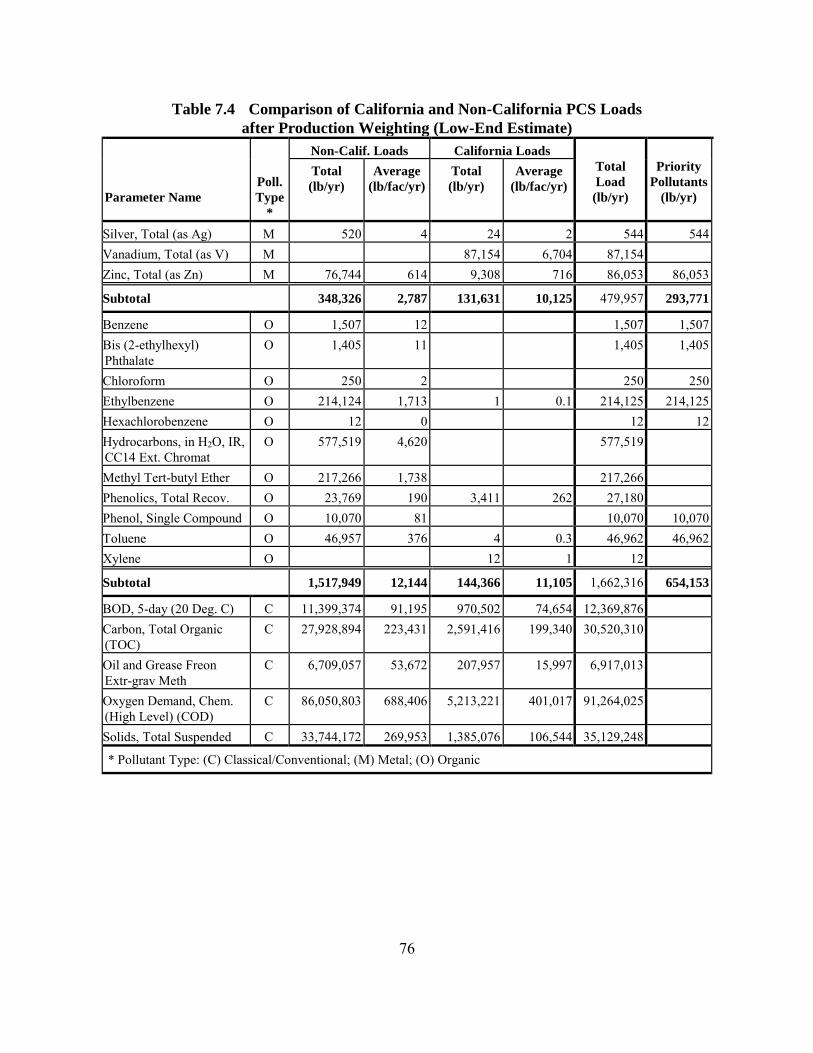
76
Table 7.4 Comparison of California and Non-California PCS Loads
after Production Weighting (Low-End Estimate)
Parameter Name
Poll.
Type
*
Non-Calif. Loads
California Loads
Total
Load
(lb/yr)
Priority
Pollutants
(lb/yr)
Total
(lb/yr)
Average
(lb/fac/yr)
Total
(lb/yr)
Average
(lb/fac/yr)
Silver, Total (as Ag)
M
520
4
24
2
544
544
Vanadium, Total (as V)
M
87,154
6,704
87,154
Zinc, Total (as Zn)
M
76,744
614
9,308
716
86,053
86,053
Subtotal
348,326
2,787
131,631
10,125
479,957
293,771
Benzene
O
1,507
12
1,507
1,507 Bis (2-ethylhexyl) Phthalate
O
1,405
11
1,405
1,405
Chloroform
O
250
2
250
250 Ethylbenzene
O
214,124
1,713
1
0.1
214,125
214,125
Hexachlorobenzene
O
12
0
12
12 Hydrocarbons, in H2O, IR, CC14 Ext. Chromat
O
577,519
4,620
577,519
Methyl Tert-butyl Ether
O
217,266
1,738
217,266
Phenolics, Total Recov.
O
23,769
190
3,411
262
27,180
Phenol, Single Compound
O
10,070
81
10,070
10,070 Toluene
O
46,957
376
4
0.3
46,962
46,962
Xylene
O
12
1
12
Subtotal
1,517,949
12,144
144,366
11,105
1,662,316
654,153
BOD, 5-day (20 Deg. C)
C
11,399,374
91,195
970,502
74,654
12,369,876
Carbon, Total Organic (TOC)
C
27,928,894
223,431
2,591,416
199,340
30,520,310
Oil and Grease Freon Extr-grav Meth
C
6,709,057
53,672
207,957
15,997
6,917,013
Oxygen Demand, Chem. (High Level) (COD)
C
86,050,803
688,406
5,213,221
401,017
91,264,025
Solids, Total Suspended
C
33,744,172
269,953
1,385,076
106,544
35,129,248
* Pollutant Type: (C) Classical/Conventional; (M) Metal; (O) Organic

77
Table 7.5 Comparison of California and Non-California PCS Loads
after Production Weighting (High-End Estimate)
Parameter Name
Poll.
Type
*
Non-Calif.Loads
California Loads
Total
Load
(lb/yr)
Priority
Pollutants
(lb/yr)
Total
(lb/yr)
Average
(lb/fac/yr)
Total
(lb/yr)
Average
(lb/fac/yr)
Bromide (as Br)
C
1,187,691
9,502
1,187,691
Chloride (as Cl)
C
146,706,014
1,173,648
107,420,130
8,263,087
254,126,144
Chlorine, Total Residual
C
3,717,957
29,744
39,220
3,017
3,757,177
Cyanide, Total (as CN)
C
10,050
80
5,586
430
15,636
15,636
Fluoride, Total (as F)
C
6,911,812
55,294
6,911,812
Nitrogen, Ammonia, Total (as N)
C
3,561,088
28,489
197,629
15,202
3,758,717
Phosphate, Total (as PO4)
C
1,148,190
9,186
1,148,190
Sulfide, Total (as S)
C
38,317
307
3,930
302
42,247
Subtotal
163,281,118
1,306,249
107,666,496
8,282,038
270,947,615
15,636
Aluminum, Total (as Al)
M
11,368
91
15,773
1,213
27,141
Arsenic, Total (as As)
M
78,851
631
790
61
79,642
79,642 Cadmium, Total (as Cd)
M
788
6
55
4
843
843
Chromium, Hexavalent (as Cr)
M
7,896
63
556
43
8,452
8,452
Chromium, Total (as Cr)
M
25,107
201
3,209
247
28,316
28,316
Cobalt, Total (as Co)
M
128
10
128
Copper, Total (as Cu)
M
27,910
223
957
74
28,867
28,867
Iron, Total (as Fe)
M
2,459
20
2,459
Lead, Total (as Pb)
M
28,882
231
360
28
29,243
29,243
Manganese, Total (as Mn)
M
70,437
563
70,437
Mercury, Total (as Hg)
M
14,679
117
11
1
14,690
14,690
Nickel, Total (as Ni)
M
11,298
90
4,246
327
15,544
15,544 Selenium, Total (as Se)
M
7,758
62
11,784
906
19,542
19,542
Silver, Total (as Ag)
M
685
5
87
7
772
772 Vanadium, Total (as V)
M
88,115
6,778
88,115
Zinc, Total (as Zn)
M
76,755
614
9,810
755
86,565
86,565
Subtotal
364,874
2,919
135,882
10,452
500,755
312,475
Benzene
O
1,515
12
1,515
1,515 Bis (2-ethylhexyl) Phthalate
O
1,405
11
1,405
1,405
Chloroform
O
250
2
250
250 Ethylbenzene
O
1,177,682
9,421
1
0
1,177,682
1,177,682

78
Table 7.5 Comparison of California and Non-California PCS Loads
after Production Weighting (High-End Estimate)
Parameter Name
Poll.
Type
*
Non-Calif.Loads
California Loads
Total
Load
(lb/yr)
Priority
Pollutants
(lb/yr)
Hexachlorobenzene
O
12
0
12
12 Hydrocarbons, in H2O, IR, CC14 Ext. Chromat
O
578,654
4,629
578,654
Methyl Tert-butyl Ether
O
217,266
1,738
217,266
Phenolics, Total Recov.
O
24,308
194
3,577
275
27,885
Phenol, Single Compound
O
10,172
81
10,172
10,172 Toluene
O
86,898
695
4
0
86,902
86,902
Xylene
O
12
1
12
Subtotal
2,098,161
16,785
3,593
276
2,101,755
1,277,938
BOD, 5-day (20 Deg. C)
C
11,402,040
91,216
1,017,120
78,240
12,419,160
Carbon, Tot Organic (TOC)
C
28,081,112
224,649
2,591,416
199,340
30,672,527
Oil and Grease Freon Extr-grav Meth
C
6,863,165
54,905
223,355
17,181
7,086,520
Oxygen Demand, Chem. (High Level) (COD)
C
86,050,909
688,407
5,213,221
401,017
91,264,131
Solids, Total Suspended
C
33,746,916
269,975
1,402,484
107,883
35,149,400
* Pollutant Type: (C) Classical/Conventional; (M) Metal; (O) Organic
7.1.3 Analysis of Average Measured Pollutant Concentrations from PCS In addition to EDS-generated loadings, measured average concentration values from monthly monitoring data were retrieved separately from PCS for 1992. Theres data set may include data not participating in the loadings analysis because of lack of corresponding discharge flow data. Conversely, parameters with large predicted loads may not have corresponding high concentrations because the load estimate may be a direct measurement (mass based limit) or may be based on a minimum or maximum concentration. Also, because the concentration data set is based on single measured values (rather than a formula as with the loadings data set) limited QA/QC procedures can be employed. For the concentration data, the range of measured values at the pollutant/discharge pipe level and at the overall pollutant level (i.e., for all discharge pipes) were examined. If either range exceeded three orders of magnitude, the concentration data at the discharge pipe level were checked for potential unit code/measurement value mismatches. In eight cases, obvious unit code errors were corrected; in an additional 13 cases, there were not enough data points to clearly identify a unit code error, yet the values were so extreme that they were considered highly questionable and were excluded from subsequent analysis. As with the loadings analysis, two sets of data were prepared: (1) a low-end estimate based on assigning zero to measurements below detection, and (2) a high-end estimate based on assuming half the

79
detection limit. Measurements always below detection for a particular parameter at a particular discharge pipe were set equal to zero for both data sets. Comparisons of average concentrations at California and non-California facilities at the low-end and high-end for the 20 parameters with data available for both groups are presented on Tables 7.6 and 7.7. Most parameters are measured at higher concentrations outside of California. Some parameters, such as cadmium, mercury, and arsenic are significantly higher on the average at non-California facilities. A few parameters, including selenium and cyanide, are significantly higher at California facilities. Additional tables summarizing concentration data by parameter for California, non-California, and all facilities combined are presented in Appendix B. These tables include all of the 74 parameters with measured average concentration data available, and also present the range and standard deviation. For comparison, Table 7.8 presents the average concentrations for 27 pollutants reported in the petroleum refining development document (US EPA, 1982a). These data reflect sampling done at current/BPT treatment levels prior to implementation of the 1982 BAT regulations (US EPA, 1982b). As with the PCS data, these data are limited by the frequency of detection. In general, the high-end PCS concentration averages for all facilities are on-line with or slightly lower than the levels reported in the 1982 development document. Exceptions to this are arsenic at both California and non-California facilities, mercury and cadmium at non-California facilities, and selenium at California facilities. In the case of arsenic and mercury, the 1982 document reports high variability in the data that may reflect low confidence. In addition, the PCS parameters are measuring total mercury, total arsenic, and total cadmium. Much of this may include metal bound in compounds and complexes that may not be included in the 1982 measures. It is interesting to note that the high-end "total recoverable selenium" average concentration for non-California facilities (see Appendix B) matches the 1982 average almost exactly, whereas the high-end "total selenium" average concentration for California facilities is much higher.

80
Table 7.6 Comparison of California and Non-California PCS Concentration Data
(Low-End Estimate)
(Parameters Available for Both Groups, all concentrations in µg/L)
Parameter
California
Non-California
Number
of
Facilities
Number
of
Observ.
Number of
Non-
Detects
Measured
Average
Number of
Facilities
Number
of
Observ.
Number of
Non-
Detects
Measured
Average
Arsenic, Total (as As)
3
25
11
3.60
2
24
0
408.42
BOD, 5-day (20 Deg. C)
6
58
20
6,281.03
25
241
2
14,264.70
Cadmium, Total (as Cd)
3
25
24
0.02
2
8
1
34.79
Carbon, Tot. Organic (TOC)
4
65
1
9,177.54
15
366
17
10,219.05
Chromium, Hexavalent (as Cr)
5
84
72
0.41
21
189
65
2.92
Chromium, Total (as Cr)
6
63
42
2.06
22
192
59
13.53
Copper, Total (as Cu)
4
36
9
9.53
4
44
6
11.39
Cyanide, Total (as Cn)
3
31
12
54.77
2
24
7
23.42
Lead, Total (as Pb)
3
32
29
3.44
1
8
0
8.38
Mercury, Total (as Hg)
3
25
23
0.03
2
16
0
8.75
Nickel, Total (as Ni)
4
39
9
11.38
2
13
1
29.69
Nitrogen, Ammonia Total (as N)
5
43
3
3,110.70
26
234
6
5,140.18
Oil and Grease Freon Extr-grav Meth
7
76
24
2,626.84
31
464
43
3,451.35
Oxygen Demand, Chem. (High Level) (COD)
5
45
0
72,844.44
17
165
0
126,609.21
Phenolics, Total Recoverable
6
89
31
18.62
25
231
21
45.76
Selenium, Total (as Se)
4
40
1
155.50
1
3
1
3.90
Silver, Total (as Ag)
3
25
24
0.02
1
3
1
2.10
Solids, Total Suspended
7
69
12
13,872.46
33
457
17
23,981.16
Sulfide, Total (as S)
5
45
44
1.11
20
175
23
55.48
Zinc, Total (as Zn)
5
50
8
165.50
4
50
1
136.36

81
Table 7.7 Comparison of California and Non-California PCS Concentration Data
(High-End Estimate)
(Sorted by Parameter Name for Parameters Available for Both Groups, All concentrations in µg/L)
Parameter
California
Non-California
Number
of
Facilities
Number
of
Observ.
Number
of
Non-detects
Measured
Average
Number
of
Facilities
Number
of
Observ.
Number
of
Non-detects
Measured
Average
Arsenic, Total (as As)
3
25
11
4.46
2
24
0
408.42
BOD, 5-day (20 Deg. C)
6
58
20
7,462.07
25
241
2
14,273.00
Cadmium, Total (as Cd)
3
25
24
0.02
2
8
1
37.91
Carbon, Tot. Organic (TOC)
4
65
1
9,189.85
15
366
17
10,244.59
Chromium, Hexavalent (as Cr)
5
84
72
4.24
21
189
65
3.88
Chromium, Total (as Cr)
6
63
42
3.10
22
192
59
17.19
Copper, Total (as Cu)
4
36
9
10.45
4
44
6
11.93
Cyanide, Total (as Cn)
3
31
12
54.77
2
24
7
25.67
Lead, Total (as Pb)
3
32
29
5.13
1
8
0
8.38
Mercury, Total (as Hg)
3
25
23
0.09
2
16
0
8.75
Nickel, Total (as Ni)
4
39
9
12.22
2
13
1
29.69
Nitrogen, Ammonia Total (as N)
5
43
3
3,110.70
26
234
6
5,149.82
Oil and Grease Freon Extr-grav Meth
7
76
24
2,705.79
31
464
43
3,533.83
Oxygen Demand, Chem. (High Level) (COD)
5
45
0
72,844.44
17
165
0
126,609.21
Phenolics, Total Recoverable
6
89
31
21.47
25
231
21
46.79
Selenium, Total (as Se)
4
40
1
155.50
1
3
1
4.23
Silver, Total (as Ag)
3
25
24
0.02
1
3
1
5.43
Solids, Total Suspended
7
69
12
13,944.93
33
457
17
24,261.24
Sulfide, Total (as S)
5
45
44
8.44
20
175
23
62.65
Zinc, Total (as Zn)
5
50
8
170.77
4
50
1
136.86
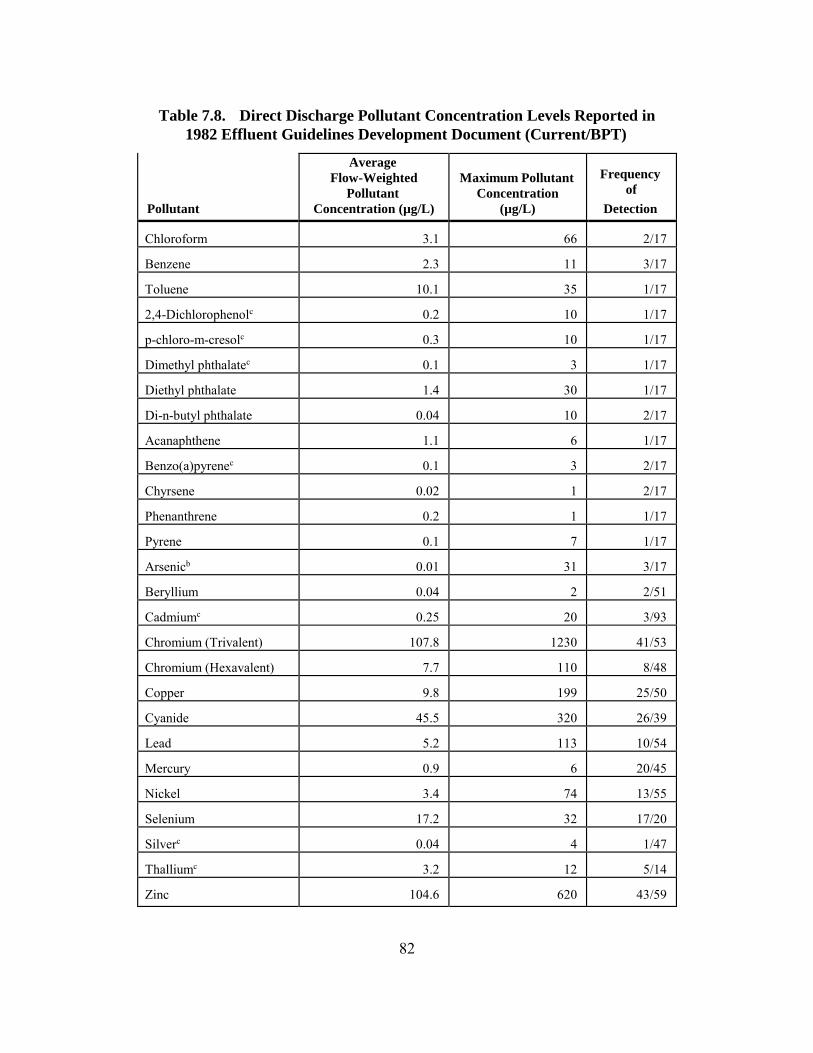
82
Table 7.8. Direct Discharge Pollutant Concentration Levels Reported in
1982 Effluent Guidelines Development Document (Current/BPT)
Pollutant
Average
Flow-Weighted
Pollutant
Concentration (µg/L)
Maximum Pollutant
Concentration
(µg/L)
Frequency
of
Detection
Chloroform
3.1
66
2/17
Benzene
2.3
11
3/17
Toluene
10.1
35
1/17
2,4-Dichlorophenolc
0.2
10
1/17
p-chloro-m-cresolc
0.3
10
1/17
Dimethyl phthalatec
0.1
3
1/17
Diethyl phthalate
1.4
30
1/17
Di-n-butyl phthalate
0.04
10
2/17
Acanaphthene
1.1
6
1/17
Benzo(a)pyrenec
0.1
3
2/17
Chyrsene
0.02
1
2/17
Phenanthrene
0.2
1
1/17
Pyrene
0.1
7
1/17
Arsenicb
0.01
31
3/17
Beryllium
0.04
2
2/51
Cadmiumc
0.25
20
3/93
Chromium (Trivalent)
107.8
1230
41/53
Chromium (Hexavalent)
7.7
110
8/48
Copper
9.8
199
25/50
Cyanide
45.5
320
26/39
Lead
5.2
113
10/54
Mercury
0.9
6
20/45
Nickel
3.4
74
13/55
Selenium
17.2
32
17/20
Silverc
0.04
4
1/47
Thalliumc
3.2
12
5/14
Zinc
104.6
620
43/59

83
Notes a. All 129 priority pollutants were analyzed during the sampling of the Current/BPT wastestream. Thirteen organic pollutants and fourteen inorganic pollutants were detected. The Current/BPT concentrations were calculated by flow-weighting the data available for the seventeen direct dischargers sampled. b. Low values were not included, and were assumed to be not quantifiable. High values were not included because laboratory contamination was suspected; therefore, data were assumed to be invalid. c. The Current/BPT pollutant concentration is greater than that in the Pretreated Raw wastestream because of the variability of the data during sampling.
7.1.4 Toxic Release Inventory In October 1986, Congress enacted the Emergency Planning and Community Right-to-know Act (EPCRA), as Title III of the Superfund Amendments and Reauthorization Act (SARA). Section 313 of EPCRA requires manufacturing facilities to report their annual use and releases of more than 300 toxic chemicals to State and local Emergency Planning Commissions, and to the EPA’s Toxic Release Inventory (TRI). Facilities are required to report releases and offsite transfers of EPCRA Section 313 chemicals to TRI, if they meet all of the following criteria:
They conduct manufacturing operations in SIC codes 20 through 39. They have ten or more full-time employees or the equivalent. They manufacture or process the EPCRA Section 313 chemical in an amount greater than
25,000 pounds/year. They otherwise use the EPCRA Section 313 chemical in an amount greater than 10,000
pounds/year. EPCRA requires reporting of five types of onsite releases: (1) fugitive air emissions; (2) stack air emissions; (3) surface water discharges; (4) underground injections; and (5) land disposal. EPCRA also requires reporting of two types of offsite waste transfers containing listed chemicals; (1) transfers to POTWs; and (2) transfers to other treatment or disposal facilities. In addition, EPCRA specifies that EPA must compile these release reports into an annual inventory of releases and transfers and make this inventory available to the public. EPA stores reported release data in the Toxics Release Inventory System (TRIS) which is maintained by EPA's Office of Pollution Prevention and Toxics (OPPT). 7.1.5 Reported Annual Pollutant Loads from TRI Two hundred five (205) petroleum refining facilities, identified by primary SIC code 2911, reported data to TRI in 1991; some facilities may not have been required to report because they did not meet employment or chemical use thresholds during 1991. Releases and transfers from

84
the 205 facilities, located in 37 states, total 738.8 million pounds. The highest releases are from ten states: California, Indiana, Louisiana, Mississippi, New Jersey, Ohio, Pennsylvania, Texas, Utah, and Washington (Figure 7.1). The top two reporting states are Indiana and Pennsylvania with 201.8 and 110.9 million pounds, respectively. The largest releases and transfers are to offsite locations other than POTWs (e.g. to recycling, energy recovery or treatment and disposal) (85 percent), air (10 percent) and underground injections (3 percent). Releases to surface waters, transfers to POTWs, and land disposal each represent less than 1 percent. The chemical with the highest reported amount of releases or transfers is sulfuric acid (a byproduct of processing), accounting for 84 percent of the total chemicals released or transferred. However, because refineries are required to neutralize their wastes prior to discharge, the sulfate would not be in an acidic form and would be present as a more benign the salt of inorganic cations in the wastewater. A total of 119 chemicals and compounds are identified, 65 of which are released to either surface waters or POTWs.

85
Figure 7.1 Geographic Distribution of 1991 TRI Chemical Releases and Transfers

86
Forty-four priority pollutants discharged by petroleum refining facilities are reported to TRI in 1991. Releases and transfers from these facilities total 33.5 million pounds. The largest releases and transfers are to air (70 percent), offsite locations other than POTWs (15 percent), POTWs (8 percent), underground injections (5 percent), and land (2 percent). Releases to surface waters are less than 1 percent. The priority pollutant with the highest reported amount of releases or transfers is toluene (44 percent). Seventy-seven (77) percent of the releases are from three priority pollutants (toluene, benzene, and phenol). Releases and transfers to POTWs and surface waters are identified from 112 direct dischargers, 32 indirect dischargers, and 15 that discharge to both surface water and POTWs. National totals for 1991 are 4.33 million lbs/yr, or 34,100 lbs/yr/facility to surface waters, and 6.94 million lbs/yr, or 148,000 lbs/yr/facility to POTWs. A table presenting TRI surface water releases and POTW transfers by pollutant is presented in Appendix C. Annual loads of priority pollutants are 207,000 lbs/yr, or 1,600 lbs/yr/facility to surface waters, and 2.52 million lbs/yr, or 53,200 lbs/yr/facility to POTWs. Transfers to POTWs (92 percent of all releases) far exceed releases to surface waters. Figure 7.2 depicts the priority pollutants with the highest reported amount of surface water releases or POTW transfers. Three priority pollutants (phenol, toluene, benzene) account for 91 percent of the total releases and transfers. The vast majority of this load (over 90 percent) would likely biodegrade or volatilize during typical secondary wastewater treatment. Assumptions and Limitations Several assumptions and limitations of this analysis include:
Only facilities reporting releases of Section 313 chemicals, and meeting threshold requirements, are required to report in TRI. Consequently, TRI may be incomplete in terms of petroleum refining facilities, pollutants, or wastestreams.
Facilities in TRI with releases under 1,000 pounds for any one chemical may submit a range of the release/transfer amount for that chemical. For this study, OPPT standards are followed by using 5 pounds for loads of 0 to 10 pounds; 250 pounds for loads of 10 to 499; and 750 pounds for loads of 500 to 999.
Data reported by industrial facilities are determined by a variety of methods. Therefore, the accuracy, precision, and comparability of TRI data are unknown.
Data are based only on facilities identified by primary SIC code 2911. Because many facilities engage in numerous industrial activities, this may exclude some releases generated from petroleum refining and include some releases not attributable to refining activities.
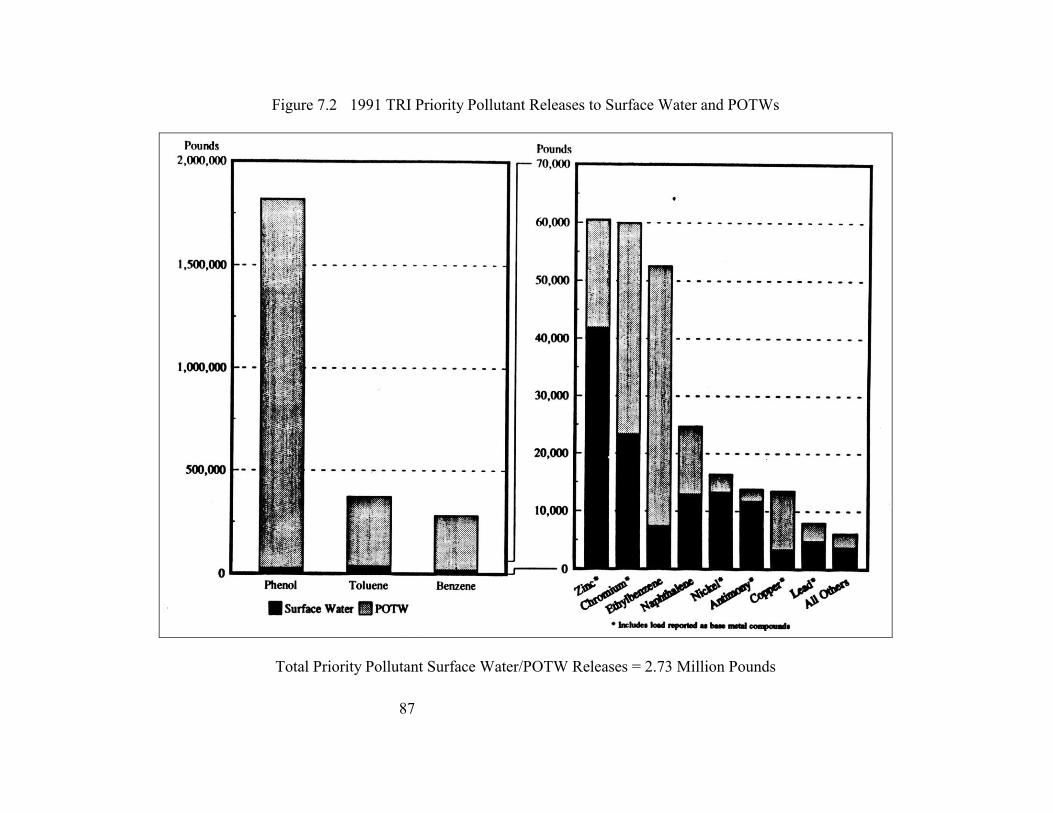
87
Figure 7.2 1991 TRI Priority Pollutant Releases to Surface Water and POTWs
Total Priority Pollutant Surface Water/POTW Releases = 2.73 Million Pounds
88
7.2 Fate and Toxicity Evaluation of Released Pollutants The environmental fate and toxicity of pollutant releases are evaluated by: (1) compiling physical-chemical and toxicity data, and POTW inhibition and sludge contamination values for identified pollutants; (2) categorizing the pollutants based on their potential toxicity and environmental fate; (3) weighting loads from PCS and TRI according to toxicity and bioaccumulation potential; and (4) evaluating whole effluent toxicity test data. 7.2.1 Compilation of Physical-Chemical and Toxicity Data and Information to Evaluate
Indirect Discharges Physical-chemical properties and toxicity data, both measured and estimated, are compiled for toxic pollutants currently being discharged by petroleum refining facilities according to available sources. These data are compiled from Standards and Applied Science Division's (SASD) Toxics Data Base (TDB) which contains aquatic toxicity, human health, physical-chemical properties, and other information for over 1,600 toxic chemicals. The chemical specific data needed to conduct the fate and toxicity evaluation for this study include:
Aquatic life criteria or toxic effect data for native aquatic species; Human health reference doses (RfD); Human health cancer potency slope factors; EPA maximum contaminant levels (MCLs) for drinking water protection; Henry's Law constants, vapor pressure and solubility values; Soil/sediment adsorption coefficients (Koc); Octanol-water partition coefficients (Kow); Bioconcentration factors (BCF) for native aquatic species; and Aqueous aerobic biodegradation rate constants.
Sources for the TDB include EPA ambient water quality criteria documents and updates, EPA's Assessment Tools for the Evaluation of Risk (ASTER) and the associated Aquatic Information Retrieval System (AQUIRE) and Environmental Research Laboratory-Duluth fathead minnow data base, EPA's Integrated Risk Information System (IRIS), the Registry of Toxic Effects of Chemical Substances (RTECS) data base, the Superfund Chemical Data Matrix (SCDM), Syracuse Research Corporation's CHEMFATE and BIODEG data bases, EPA and other government reports, scientific literature, and other primary and secondary data sources. To ensure that the examination is as comprehensive as possible, alternative measures are taken to compile data for chemicals for which physical-chemical property and/or toxicity data do not exist. Therefore, where necessary, values are estimated using quantitative structure-activity relationship (QSAR) models, or for some physical-chemical properties, utilizing published linear regression correlation equations, if available. Information needed to evaluate adverse effects on POTW operations and sewage sludge quality includes inhibition values, sludge partitioning factors, and sludge contamination levels.
89
The lower values for POTW removal rate indicate less removal at the POTW, and therefore a higher portion of the pollutant reaches the receiving water. Inhibition values are the concentration of influent to the POTW likely to interfere with treatment. Sludge partitioning factors represent the proportion of a constituent load that will be found in primary or secondary sewage sludge. EPA recently established sludge criteria for lead, chromium and zinc, which restrict certain applications of sludge above criteria values. Inhibition values and sludge partitioning factors are obtained from the Domestic Sewage Study (US EPA, 1986), Guidance
Manual for Preventing Interference at POTWs (US EPA, 1987), and CERCLA Site Discharges to
POTWs guidance (US EPA, 1990). Data to determine allowable sludge contamination levels are obtained from the Agency’s final rule on “Standards for the Use or Disposal of Sewage Sludge” (US EPA, 1993). Pollutant limits established for the final use or disposal of sewage sludge via application to agricultural and non-agricultural land are reported. Information is compiled and summarized from the TDB for pollutants regulated in the discharge from 14 petroleum refining facilities located in Los Angeles County, California, which discharge their wastewaters to POTWs (Table 7.9). Removal rates for these 25 pollutants vary from a low of 0.52 (52 percent) for 2,4,6-trichlorophenol to a high of 0.98 (98 percent) for both toluene and acenaphthene. The inhibition concentrations for these pollutants are generally high, with the exception of lead and chromium. The sludge partitioning factors indicate that lead, chromium, zinc and cyanide will remain in sludge. Sludge with contaminant levels that exceed EPA criteria for less expensive disposal by land application must be disposed of through higher cost alternatives, such as incineration.
Table 7.9. POTW Information for Selected Indirect Discharges
(Sorted by CAS Number)
CAS
Number
Pollutant Name
POTW
Removal
Inhibition
Value
(µg/l)
Partition
Factor
Sludge Criteria
Value (mg/kg)
57125 Cyanide
0.704
5,000
1
67663 Trichloromethane
0.676
500,000
0.015
71432 Benzene
0.941
125,000
0.019
74931 Methanethiol*
0.77
0.1
83329 Acenaphthene
0.983
500,000
85018 Phenanthrene
0.949
500,000
86737 Fluorene
0.698
500,000
88062 Trichlorophenol, 2,4,6-
0.516
50,000
0.079
91203 Naphthalene
0.947
500,000
0.275
95476 Xylene, o-
0.951
5,000
0.149
95578 Chlorophenol, 2-
0.65
5,000
0.079
100414 Ethylbenzene
0.938
200,000
0.06
105679 Dimethylphenol, 2,4-
0.85
40,000
0.079
106423 Xylene, p-
5,000
0.149

90
Table 7.9. POTW Information for Selected Indirect Discharges
(Sorted by CAS Number)
108383 Xylene, m-
0.654
5,000
0.149
108883 Toluene
0.976
200,000
0.278
108952 Phenol
0.967
200,000
0.146
129000 Pyrene
0.95
500,000
218019 Chrysene
0.97
500,000
7439921 Lead
0.918
100
1
300
7440473 Chromium
0.754
1,000
1
1200
7440666 Zinc
0.78
5,000
1
2800
7664417 Ammonia
0.6319
480,000
14808798 Sulfate
18496258 Sulfide
25,000
Note: * = Representative of Mercaptans Assumptions and Limitations Several assumptions and limitations of this compilation include:
Data are used from readily available electronic data bases; other primary and secondary sources are not searched.
Many of the data are estimated and therefore have a high degree of associated uncertainty. For some chemicals, neither measured nor estimated data are available for key
categorization parameters. As a result, this study is an incomplete assessment of potential fate and toxicity of petroleum refining discharge.
7.2.2 Categorization of Pollutants Human and ecological exposure and risk from toxic chemical releases is primarily a function of toxic potency, inter-media partitioning, and chemical persistence. These factors are dependant on chemical-specific properties relating to pharmocokinetic effects on living organisms, physical state, hydrophobicity/lipophilicity, and reactivity; as well as the mechanism and media of release and site-specific environmental conditions. The potential fate and toxicity of pollutants associated with petroleum refining, based on chemical-specific data, are examined in this portion of the study. The objective of this generalized evaluation of fate and toxicity potential is to place chemicals into qualitative groups based on their potential environmental fate and impact. These categorization groups are based on techniques derived for:
Acute aquatic toxicity (highly, moderately, or slightly toxic);

91
Volatility from water (highly, moderately, slightly, or non volatile); Adsorption to soil/sediment (highly, moderately, slightly, or non adsorptive); Bioaccumulation potential (high, moderate, slight, or no significant potential); and Biodegradation potential (fast, moderately fast, slow, or resistant).
The primary advantage of the categorization methods is that the results allow the user to identify the potential impact/threat of a chemical. The methods effectively group chemicals based on their potential to harm the environment. Using key parameters, these categorization methods identify the relative aquatic toxicity and bioaccumulation fate for each chemical constituent (with sufficient data) of petroleum refining discharges. In addition, the potential to partition to various media (air, sediment/sludge, or water) and persist in the environment is identified for each organic constituent. The acute aquatic toxicity, volatility from water, soil/sediment adsorption, and bioconcentration categorization methods have been reviewed by EPA staff (Offices of Water; Health and Environmental Assessment; and the former Office of Toxic Substances), as well as by Dr. Warren J. Lyman, principal author of Handbook of
Chemical Property Estimation Methods (Lyman et al, 1982). The biodegradation categorization method is based on Handbook of Environmental Degradation Rates (Howard et al, 1991). These methods are used for screening purposes only, and do not take the place of detailed pollutant assessments that analyze all fate and transport mechanisms. This evaluation also identifies chemicals which (1) are known, probable, or possible human carcinogens; (2) are systemic human health toxicants; and (3) have EPA human health drinking water standards. The results of this analysis can provide a qualitative indication of potential risk posed by the release of these chemicals. Actual risk depends on the magnitude, frequency, and duration of pollutant loading; site-specific environmental conditions; proximity and number of human and ecological receptors; and relevant exposure pathways. The categorization schemes and ranges of parameter values defining the categories are presented in Appendix D. The categorization assessment addresses the 96 individual pollutants identified from PCS data and TRI releases to surface water and POTW transfers. Inorganic constituents include heavy metals, halogens and other anionic species. The organic constituents encompass a broad class of aliphatic and aromatic alkanes, alcohols, acids, ketones, and ethers. Also represented are several polynuclear aromatic hydrocarbons (PAHs), polychlorinated biphenyls (PCBs), and 2378-TCDD. Aquatic toxicity data are available for most pollutants, with the exception of inorganic acids and anionic species. Discharges of these chemicals may cause indirect adverse ecological effects by altering receiving water chemistry. However, these potential effects are not addressed in this study. Fate and transport data (i.e., volatility from water, adsorption to soil/sediment, and biodegradation potential) are available for most organic pollutants and some inorganic pollutants (e.g., Henry's Law constant for mercury in its methylated form), therefore, the fate assessment is applicable primarily to organic pollutants. Bioconcentration factors are available for over half of the inorganic pollutants and all but two organic pollutants.

92
A summary of the categorization results is presented on Tables 7.10 and 7.11. Approximately one quarter of the pollutants exhibit high or moderate acute toxicity to aquatic life (Table 7.10). Pollutants notable for their aquatic toxicity include CDD/CDF, mercury, anthracene, cadmium, silver, and hexachlorobenzene (HCB). The most potent carcinogens include CDD/CDF, hexavalent chromium, arsenic, 1,3-butadiene, and HCB. Antimony, cadmium, and mercury are highly potent systemic toxicants. In total, 29 of the pollutants are potential carcinogens, 56 are recognized by EPA as human systemic toxicants, and 45 have EPA-assigned concentration limits for drinking water protection (Table 7.11).
Table 7.10 Number of Pollutants by Categorization Group
(96 pollutants evaluated) Environmental Effects
and
Projected Fate High Moderate
Slight or
Slow
Not
Significant No Data
Acute Aquatic Toxicity 18 7 57 14 Volatility from Water 25 17 12 4 38 Adsorption to Solids 11 2 43 6 34 Bioaccumulation Potential 10 18 26 22 20
Biodegradation Potential
12 21 12 15 36
Table 7.11 Number of Pollutants with Health Effect Designations
(96 pollutants evaluated) Health Effect Designation Number of Pollutants
Carcinogenic Effectsa 29 Human Systemic Effectsb 56 Drinking Water Valuesc 45 a. Chemicals with EPA classification as a human carcinogen (A), probable human carcinogen (B1, B2), or possible human carcinogen (C). Dioxins/furans with a TEF are also considered to be carcinogens. b. Chemicals for which EPA has established a verified or provisional chronic reference dose (RfD). c. Chemicals for which EPA has established a concentration limit or goal under the Safe Drinking Water Act (SDWA).
About three-quarters of the organic pollutants have a high to moderate potential to volatilize. Most of the likely volatile chemicals are only slightly toxic to aquatic life. Notable exceptions are HCB and mercury. Only 14 percent of the pollutants with data are highly or moderately adsorptive to soil/sediment. However, most of the highly adsorptive chemicals are also highly or moderately toxic to aquatic life. These include PAH compounds, phthalates, TCDD/TCDF,

93
HCB, and mercury. One third of the pollutants with data have high to moderate bioaccumulation potential, which is strongly correlated with soil/sediment adsorption. TCDD/TCDF, HCB, mercury, and phenanthrene have the greatest potential to bioaccumulate. Approximately half of the pollutants are expected to biodegrade fast or moderately fast in oxygenated water. However, several highly to moderately toxic pollutants are resistant to biodegradation or only slowly biodegrade. These chemicals include HCB, pyrene, TCDD/TCDF, anthracene, and phenanthrene. Combining toxicity and fate information can assist in identifying chemicals that have the greatest potential to cause adverse impacts upon release. In the categorization methods, chronic aquatic toxicity indicates the potential to reduce the viability of aquatic species populations and adversely affect ecosystem stability downstream of a discharge. Aqueous aerobic biodegradation half-life is used as a measure of persistence in the environment. Chemicals that can cause chronic toxic effects in small amounts and persist for a long period of time are likely to pose the greatest ecological threat. Figure 7.3 depicts a scatter plot of biodegradation half-life data versus chronic aquatic toxicity levels. The gridlines show the categorization groups, with high toxicity associated with low chronic aquatic toxicity levels and high persistence associated with long half-lives. The names of chemicals falling in the moderate or high toxicity and the resistant or slow biodegradation ranges (shaded region) are provided. Based on high-end production-weighted 1992 PCS data, approximately 16 thousand pounds/year of total cyanide and 12 pounds/year of hexachlorobenzene are released to surface water. Based on 1991 TRI, 570 pounds of anthracene and hydrogen cyanide are released to surface water annually.

94
Figure 7.3. Ecological Impact Potential
Shading indicates pollutants in high/moderate toxicity and resistant/slow degradation ranges
95
An additional 13 inorganic pollutants that may or may not have long-term bioavailability, have high or moderate chronic toxicity. The high-end production-weighted 1992 PCS load of 9 inorganic chemicals (aluminum, chlorine, selenium, lead, copper, mercury, chromium hexavalent, silver, and cadmium) is 3.9 million pounds/year. According to 1991 TRI data, 45,000 pounds/year of inorganic chemicals (chlorine, antimony compounds, lead and compounds, copper and compounds, cobalt and compounds, silver compounds, selenium and compounds, and mercury) are released to surface water. Of particular note is selenium. Selenium is shown to cause mortality, deformities, lack of embryonic development, and severe reproductive impacts in a range of species (Harris 1991), including plants, amphibians, fish (Hermanutz et al., 1992; Marcogliese et al., 1992), and aquatic birds (Hoffman et al., 1988; Ohlendorf et al., 1986; Ohlendorf, et al., 1987; Ohlendorf et al., 1989; US EPA, 1989). Cancer slope factor, reference dose, and mammalian LD50 are used in the categorization methods to indicate potential to cause adverse health effects on exposed human populations. A primary human exposure route for chemicals released to surface water is the consumption of contaminated fish. In the categorization methods, bioconcentration factor indicates the degree to which a chemical may accumulate in fish tissue. Chemicals that accumulate in edible fish tissue and may cause adverse health effects in small amounts are likely to pose the greatest threat to human health. Figure 7.4 depicts a scatter plot of bioconcentration factors versus "critical doses" for human health toxicity. Critical human health doses are derived by converting cancer slope factors and LD50 values to an equivalent reference dose unit (mg/kg-day) based on the categorization methods. The names of chemicals falling into the high or moderate ranges for both parameters (shaded region) are provided. According to production-weighted 1992 PCS data, as much as 16,000 pounds/year of these chemicals are released to surface water.

96
Figure 7.4. Human Health Impact Potential
Shading indicates pollutants in high/moderate toxicity and bioaccumulation potential ranges

97
Assumptions and Limitations Assumptions and limitations of this analysis include:
Placement into groups is based on arbitrary order of magnitude delineations for several categorization schemes. Combined with data uncertainty, this may lead to an overstatement or understatement of the characteristics of a chemical.
Receiving waterbody characteristics, pollutant loading amounts, exposed populations, and potential exposure routes explicitly are not considered.
Bioavailability of inorganic pollutants is not assessed. Ionic specification, dissolved-solid phase equilibrium, and attachment to clay particles or organic matter are largely functions of waterbody characteristics.
Human health toxicity assessment is based on an ingestion exposure route, and may not accurately reflect the hazard posed by inhalation or dermal contact.
Biodegradation potential may not be a good indicator of persistence for organic chemicals that rapidly photooxidize or hydrolyze, since these degradation mechanisms are not considered.
Available aquatic toxicity and bioconcentration test data may not represent the most sensitive species.
Data derived from laboratory tests may not accurately reflect conditions in the field. 7.2.3 Toxic Weighting Factor Analysis EPA's Office of Water uses toxic weighting factors (TWFs) analysis to compare the relative toxicity of industrial effluent discharges. Toxic weighting factors are derived using the same methodology employed for other effluent guidelines (US EPA, 1992a), but are based on updated toxicity information. Originally, TWFs were used to calculate copper based pound-equivalents, and were derived from chronic aquatic life criteria (or toxic effect levels) and human health criteria (or toxic effect levels) established for the consumption of fish. For carcinogenic substances, the human health risk level was set at 10-5, i.e. protective to a level allowing 1 in 100,000 excess cancer cases over background. These toxicity levels were related to a benchmark value, or toxicity level associated with a single pollutant. Copper, a toxic metal pollutant commonly detected and removed from industrial effluent, was selected as the benchmark pollutant (i.e., the basis to which others are compared). EPA had used copper previously in TWF calculation for the cost-effectiveness analysis of effluent guidelines. While the water quality criterion for copper has been revised (to 12.0 µg/L), the TWF method used the former criterion (5.6 µg/L) to facilitate comparisons with cost-effectiveness values calculated for other regulations. The criterion for copper was reported in the Ambient Water Quality Criteria for Copper (US EPA, 1980).
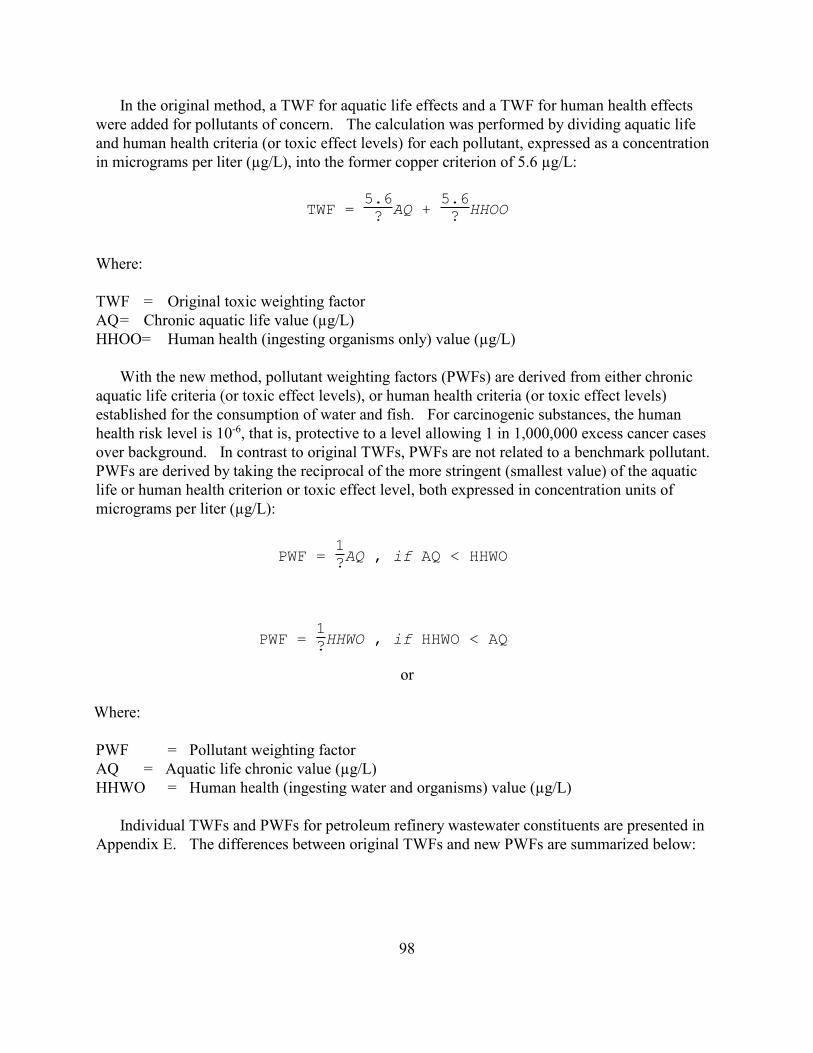
98
In the original method, a TWF for aquatic life effects and a TWF for human health effects were added for pollutants of concern. The calculation was performed by dividing aquatic life and human health criteria (or toxic effect levels) for each pollutant, expressed as a concentration in micrograms per liter (µg/L), into the former copper criterion of 5.6 µg/L:
Where: TWF = Original toxic weighting factor AQ = Chronic aquatic life value (µg/L) HHOO= Human health (ingesting organisms only) value (µg/L) With the new method, pollutant weighting factors (PWFs) are derived from either chronic aquatic life criteria (or toxic effect levels), or human health criteria (or toxic effect levels) established for the consumption of water and fish. For carcinogenic substances, the human health risk level is 10-6, that is, protective to a level allowing 1 in 1,000,000 excess cancer cases over background. In contrast to original TWFs, PWFs are not related to a benchmark pollutant. PWFs are derived by taking the reciprocal of the more stringent (smallest value) of the aquatic life or human health criterion or toxic effect level, both expressed in concentration units of micrograms per liter (µg/L):
or Where: PWF = Pollutant weighting factor AQ = Aquatic life chronic value (µg/L) HHWO = Human health (ingesting water and organisms) value (µg/L) Individual TWFs and PWFs for petroleum refinery wastewater constituents are presented in Appendix E. The differences between original TWFs and new PWFs are summarized below:
TWF = 5.6
?AQ +
5.6
?HHOO
PWF = 1
?AQ , if AQ < HHWO
PWF = 1
?HHWO , if HHWO < AQ

99
Feature
TWF
PWF
Benchmark Value (numerator)
5.6 (former freshwater chronic criterion for copper)
1
Carcinogenic Risk Level
10-5 (1 in 100,000 excess cancer cases)
10-6 (1 in 1,000,000 excess cancer cases)
Human Health Exposure
Fish consumption only
Drinking water and fish consumption
Aquatic Life Effects vs. Human Health Effects
TWFs are added
More stringent PWF is used
Application to PCS and TRI Load Estimates TWFs are applied to the PCS and TRI load estimates given in Section 7.1. Toxic-weighted loads provide a measure for comparison between industries. Based on TWFs, approximately 75 percent of the high-end PCS production-weighted load is categorized as being a priority pollutant and a much smaller percentage is classified as carcinogenic. Based on PWFs, more than 90 percent of the PCS weighted load is from priority pollutants, and carcinogens dominate this total (Table 7.12). TRI loads to surface water show a lower proportion of priority pollutants, due to the difference in the set of pollutants reported to TRI and those that are reported to PCS. Transfers to POTWs have a higher percentage of priority pollutant TWF load (80 percent) than those to surface water (60 percent). Average TWF loads per facility to surface water and to POTWs show that indirect wastestreams have hazard potentials that are almost three times greater than direct wastestreams (1,854 vs. 728 lbs-eq/yr/fac).

100
Table 7.12 Petroleum Refining Annual Loads from PCS and TRI
All
Pollutants
Total
All
Pollutants
Average*
Priority
Pollutants
Total
Priority
Pollutants
Average*
EPA
Classified
Carcinogens
Total
EPA
Classified
Carcinogens
Average* Unweighted
lb/yr
lb/yr/fac
lb/yr
lb/yr/fac
lb/yr
lb/yr/fac
PCS Surface Water Releases (1992)
30,711,578
67,222
11,593
Extrapolated PCS Surface Water Releases (1992)
272,726,320
1,976,278
1,606,049
11,638
121,361
879
TRI Surface Water Releases (1991)
4,330,091
34,095
206,553
1,626
33,362
263
TRI POTW Transfers (1991)
6,942,533
147,713
2,522,607
53,672
282,726
6,015
Standard TWFs
lb-eq/yr
lb-eq/yr/fac
lb-eq/yr
lb-eq/yr/fac
lb-eq/yr
lb-eq/yr/fac
Extrapolated PCS Surface Water Releases (1992)
10,157,542
73,605
7,889,816
57,173
389,684
2,824
TRI Surface Water Releases (1991)
92,454
728
54,564
430
23,450
185
TRI POTW Transfers (1991)
87,123
1,854
69,821
1,486
10,490
223
Optional TWFs
lb-eq/yr
lb-eq/yr/fac
lb-eq/yr
lb-eq/yr/fac
lb-eq/yr
lb-eq/yr/fac
Extrapolated PCS Surface Water Releases (1992)
6,226,774
45,122
5,821,318
42,183
4,579,868
33,187
TRI Surface Water Releases (1991)
497,817
3,920
59,992
472
484,834
3,818
TRI POTW Transfers (1991)
242,157
5,152
233,967
4,978
228,292
4,857
* Derived by dividing individual pollutant loads (lb/yr or lb-eq/yr) by: 1. 138 (number of facilities included in the PCS extrapolation), or 2. 127 (number of facilities reporting surface water releases in TRI), or 3. 47 (number of facilities reporting POTW transfers in TRI); and summing for all pollutants. 7.2.4 Whole Effluent Toxicity Testing EPA has advocated an integrated approach to water quality-based toxics control via chemical-specific testing, bioassessment, and whole effluent toxicity testing. These methods, taken in combination, are expected to provide a comprehensive biological evaluation of a water body (US EPA, 1992b). Whole effluent toxicity (WET) refers to the evaluation of toxic effects of an effluent on living organisms, and has primarily been used for the protection of aquatic life. Whole effluent toxicity is defined as the "aggregate toxic effect of an effluent as measured directly by a toxicity test."

101
Using the whole effluent approach for the protection of aquatic life involves using acute (usually 96-hours or less in duration with lethality as the typical endpoint) and/or chronic (generally 7-day with lethality, reproduction, and growth effects as test endpoints) toxicity tests to measure the aggregate effects of the pollutant discharge. See EPA’s Technical Support Document for Water
Quality-Based Toxics Control (US EPA, 1991). The acute toxicity endpoint (ATE) values are generally reported as LC50 values, defined as the concentration at which 50 percent of the test organisms died. In addition, an exposure duration is often reported along with the lethal concentration value such as a 96-hour LC50 value. Chronic toxicity test results may be reported in terms of a number of different endpoint values. These commonly include the No Observed Effect Concentration (NOEC), Lowest Observed Effect Concentration (LOEC), or the Effect Concentration (EC). These and other chronic toxicity endpoints (CTEs) are defined by EPA in the Technical Support Document. WET tests provide an indication of the ecological impacts of pollutants on receiving waters. Tests conducted by EPA's Complex Effluent Toxicity Testing Program, the University of Kentucky, the University of North Texas, and North Carolina Division of Environmental Management showed a strong correlation between actual receiving water impact and the predicted results from whole effluent toxicity tests. As acknowledged in the EPA Technical
Support Document, the correlation has been strongest when related to maximum impact responses, or acute WET tests. EPA’s Region 6 Office typically requires that there be no statistically significant lethality in the 7-day chronic WET test at the critical effluent concentration (low flow). Effluent from 18 out of 47 petroleum refining facilities, Texas, Louisiana and Oklahoma (approximately 40 percent) failed at least one WET test for acute, chronic or sublethal effects. All but two of these facilities also showed a statistically significant lethality in their test results at least once, and 11 of these facilities (approximately 25%) showed persistent lethality (i.e., the facility also failed a re-test). California has stringent acute and chronic WET test requirements in place. These requirements typically stipulate that the median test result not reduce survival below 90 percent and the percentile test result not reduce survival below 70 percent during a 96 hour test conducted on fingerling trout, stickleback, and fathead minnows. Shallow water discharges must use 100 percent effluent, whereas deep water dischargers are typically given a 10:1 dilution. As a result of these testing requirements, many petroleum refineries now have activated carbon systems in place to achieve compliance. The State of California is currently compiling a data base of statewide WET test results, which may be available for data summarizing in the future. However, as of January 1994, all five refineries in the San Francisco Bay region with chronic WET test requirements were in compliance. Assumptions and Limitations There are several potential limitations to using WET tests as a measure of receiving water impact:

102
WET test results are assumed to be valid independent of water body type. Biological, physical and chemical factors at any site will affect the true toxic effect of a
given effluent, giving both false positives and false negatives. 7.3 Documented Impacts Tables with supporting data for the following documented environmental impacts are presented in Appendix A. In a review of over 60 literature abstracts (accessed through the DIALOG data service), EPA found that four laboratory studies reported potential environmental impacts from petroleum refinery wastewaters. Impacts include aquatic life effects such as spinal curvature, co-carcinogenic activity, behavioral pattern changes in fish, and mutagenic activity. Tests using treated refinery effluent report a 48-hour LC50 for Daphnia pulex at 76 percent effluent (a 3:1 mixture of effluent to water), and a 14-day LC50 at 6.4 percent effluent, representing a threshold value for mortality. Sublethal effects, such as reproductive failure, ranged from a 14-day EC50 at 3.1 percent effluent to a 14-day EC5 at 0.52 percent effluent. Chemical characterization studies using Daphnia magna static bioassays determine that the most toxic fraction of petroleum refinery wastewaters are steam volatiles, base-neutrals, and aromatic organics. Twenty-three petroleum refining facilities (17 percent of the 138 direct dischargers identified in the Oil and Gas Journal (Thrash, 1991)) are identified by States as point sources impairing (or contributing to impairment of) water quality and are included on their CWA Section 304(l) Short List. Pollutants of concern include 10 metals (antimony, cadmium, chromium, hexavalent chromium, trivalent chromium, copper, lead, mercury, nickel, selenium, silver, and zinc), cyanide, phenol and toxicity as reflected by whole effluent-toxicity (WET). Section 304(l) requires States to identify waterbodies impaired by the presence of toxic substances, identify point source dischargers of these toxics, and develop Individual Control Strategies (ICSs) which identified dischargers were required to implement by July 30, 1993. In accordance with the statutory provisions, states must submit to EPA three lists of water bodies, one of which is termed the "short list." The "short list" (Section 304(l)(B)) is a list of waters for which a state does not expect applicable water quality standards (numeric or narrative) to be achieved after technology-based requirements have been met, due entirely or substantially to point source discharges of Section 307(a) toxics. Three cases of sediment contamination are identified with petroleum refineries from An
Overview of Sediment Quality in the United States (EPA, 1987b). The associated contaminants are cadmium, chromium, copper, cyanide, nickel, lead, zinc, PCBs, PAHs, petroleum hydrocarbons, and oil and grease. This report presents an overview of sediment quality and qualitatively describes the nature and extent of contaminated sediments (i.e., bottom deposits in rivers, lakes, harbors, and oceans) polluted from anthropogenic sources. Information for this report is from a review of the published literature and inquiries to environmental agencies. The
103
data collection effort is not statistically designed or geographically complete; sites are chosen for inclusion based on the sources of information available. Petroleum refining ranks second among 40 industrial categories (based on TRI data) as a source of sediment contaminants in EPA’s 1995 draft report on sediment contamination (US EPA, 1995)(see Appendix I, “Analysis of TRI Data by Industrial Category”). In addition, the report ranks petroleum refining 11 out of 43 industrial categories based on 1992 PCS data (Appendix I, “Analysis of PCS Data by Industrial Category”). The rankings are based on industry loads weighted by individual chemical toxicity and fate specific to potential sediment contamination. Unitless relative hazard scores are developed for each chemical by multiplying chemical loads retrieved from PCS and TRI by a toxicity factor, based on relative potential toxicity to aquatic life or human health when present in sediment, and a fate factor, based on relevant fate and transport factors. A review of the EPA/Army Corps of Engineers draft report, Evaluation of Dredged Material
Proposed for Discharge in Waters of the United States - Testing Manual (US EPA, 1994a), reveal contaminants associated with petroleum refineries include ammonia, lead, selenium, 2,3,7,8-tetrachlorodibenzo-p-dioxin (TCDD) and 2,3,7,8-tetrachlorodibenzofuran (TCDF). This report provides a matrix of potential correlations between industrial sources and specific contaminants of sediments based on a compilation of existing information. This matrix is, however, not all inclusive and makes no accounting for current pollution control practices. See Appendix I.
104
8. Economic Profile of the Petroleum Refining Industry 8.1 U.S. Petroleum Refinery Geographic Distribution and Trends 8.1.1 Number and Distribution of Refineries Petroleum refineries in the United States are classified into five geographic groups called Petroleum Administration for Defense (PAD) Districts. All 50 states and the District of Columbia are distributed among these five districts (see Table 8.1). However, this does not imply that there are refineries in all 50 states. These districts were originally created for economic and geographic reasons as “Petroleum Administration for War (PAW)” districts, which were first established in 1942. In 1950 the nomenclature was changed to “PAD.” As of January 1, 19932 there were 187 operable refineries in the United States with a total atmospheric crude oil distillation capacity of 15,120,630 barrels per day (see Table 8.2). However, only 175 refineries were operating with an atmospheric crude oil distillation capacity of 14,776,880 barrels per day. The remaining 12 refineries were idle. During 1992, 2 new refineries were put into operation, 1 was reactivated, 15 were shut down, and 2 refineries were sold to new operators. As observed in Table 8.1, PAD District III, the Gulf Coast, is the largest in terms of number of refineries and also in capacity, with 66 operable refineries with a capacity of 6,764,450 barrels per day, which amounts to 35 percent of the number of refineries and 45 percent of the entire capacity in the United States. PAD District II, the Midwest, is the second largest in terms of capacity, producing 3,398,800 barrels per day (22.5 percent) from 38 refineries (20 percent). The second highest number of refineries is found in PAD III, the West Coast, with 45 operable refineries (24 percent). This district ranks third in production with a capacity of 2,895,800 barrels per day (19 percent). The smallest district is PAD IV, the Mountain States, with 17 operable refineries (9 percent), and a capacity of 519,375 barrels per day (3 percent).
2 While 1993 data are available and exhibit a declining trend, the 1992 data from the draft report were not updated so as to maintain comparability with the technical data on refineries and the PCS system from 1992 summarized in the rest of the final report.

105
Table 8.1 Number and Capacity of Operable Petroleum
Refineries by PAD District as of January 1, 1993
PAD District
and State
Number of Operable
Refineries
Atmospheric Crude Oil Distillation
Capacity (bbl/calendar day)
Total Operating Idle Total Operating Idle
PAD District I
21
17
4
1,542,805
1,352,955
189,850
Delaware
1
1
0
140,000
140,000
0
Georgia
2
1
0
33,540
5,540
28,000
New Jersey
6
4
2
527,500
407,500
120,000
New York
1
0
2
41,850
0
41,850
Pennsylvania
8
8
0
731,415
731,415
0
Virginia
1
1
0
53,000
53,000
0
West Virginia
2
2
0
15,500
15,500
0
PAD District II
38
36
2
3,398,200
3,364,800
33,400
Illinois
7
7
0
965,600
965,600
0
Indiana
4
4
0
474,900
474,900
0
Kansas
7
6
1
327,300
296,900
30,400
Kentucky
2
2
0
218,900
218,900
0
Michigan
3
2
1
118,600
115,600
3,000
Minnesota
2
2
0
267,100
267,100
0
North Dakota
1
1
0
58,000
58,000
0
Ohio
4
4
0
462,100
462,100
0
Oklahoma
6
6
0
396,500
396,500
0
Tennessee
1
1
0
76,000
76,000
0
Wisconsin
1
1
0
33,200
33,200
0
PAD District III
66
64
2
6,764,450
6,722,450
42,000
Alabama
3
2
1
119,500
104,500
15,000
Arkansas
3
3
0
61,700
61,700
0
Louisiana
20
20
0
2,358,900
2,358,900
0
Mississippi
6
6
0
371,800
371,800
0
New Mexico
3
3
0
94,600
94,600
0
Texas
31
30
1
3,757,950
3,730,950
27,000
PAD District IV
17
16
1
519,375
509,375
10,000
Colorado
3
2
1
95,500
85,500
10,000

106
Montana
4
4
0
139,650
139,650
0
Utah
6
6
0
154,500
154,500
0
Wyoming
4
4
0
129,725
129,725
0
PAD District V
45
42
3
2,895,800
2,827,300
68,500
Alaska
6
6
0
256,300
256,300
0
Arizona
2
1
1
14,000
10,000
4,000
California
26
24
2
1,933,900
1,869,400
64,500
Hawaii
2
2
0
146,300
146,300
0
Nevada
1
1
0
7,000
7,000
0
Oregon
1
1
0
0
0
0
Washington
7
7
0
538,300
538,300
0
U.S. Total
187
175
12
15,120,630
14,776,880
343,750
Source: U.S. DOE, Energy Information Administration
Table 8.2 Number and Capacity of Refineries in
California, Louisiana, and Texas as of January 1, 1993
Number of Refineries
Capacity
(bbl/day) California
26
1,933,900
Louisiana
20
2,358,900
Texas
31
3,757,950
Total CA, LA, TX
77
8,050,750
% of U.S. Total
41%
53%
Source: US DOE/EIA, Petroleum Supply Annual
Fifty-three percent of the nation's refining capacity is concentrated in 3 states: California, Louisiana, and Texas. These 3 states combined contain 77 refineries with a combined capacity of 8,050,750 barrels per day (see Table 8.2). The remaining 110 refineries (59 percent) are distributed among 32 other states with a combined capacity of 7,069,080 barrels per day (47 percent). As of January 1, 1993, 15 states did not have refining capacity (see Table 8.3).
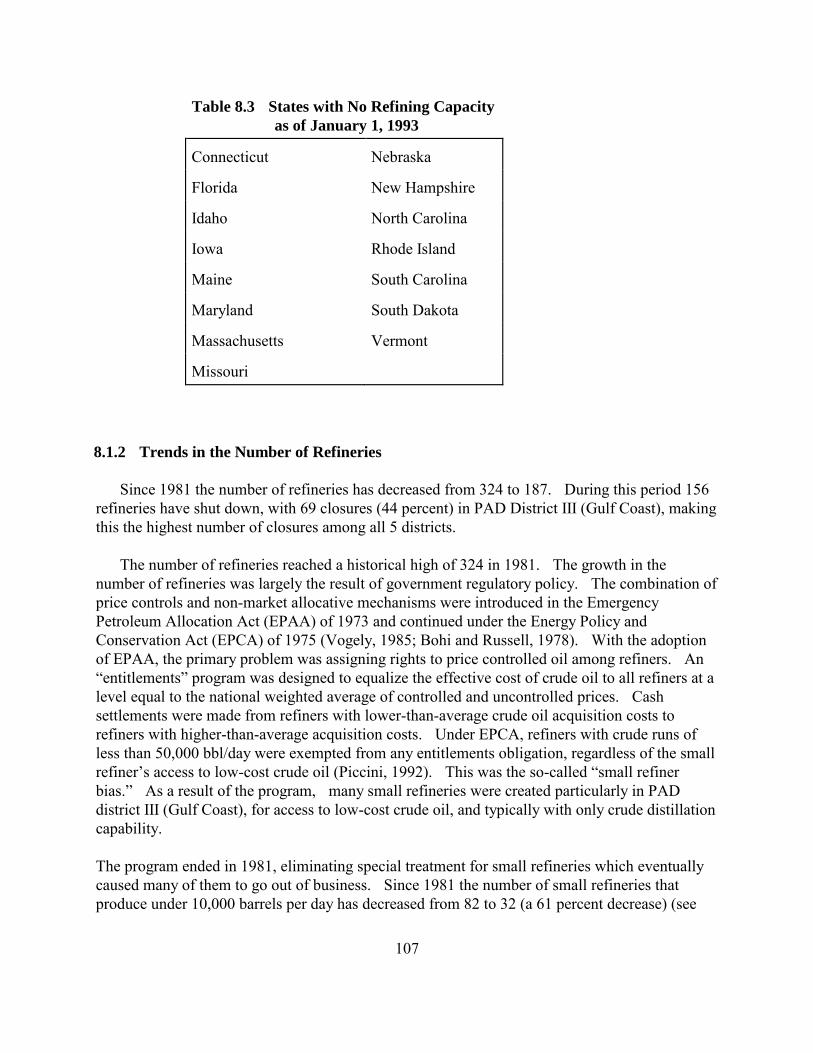
107
Table 8.3 States with No Refining Capacity
as of January 1, 1993 Connecticut
Nebraska
Florida
New Hampshire
Idaho
North Carolina
Iowa
Rhode Island
Maine
South Carolina
Maryland
South Dakota
Massachusetts
Vermont
Missouri
8.1.2 Trends in the Number of Refineries Since 1981 the number of refineries has decreased from 324 to 187. During this period 156 refineries have shut down, with 69 closures (44 percent) in PAD District III (Gulf Coast), making this the highest number of closures among all 5 districts. The number of refineries reached a historical high of 324 in 1981. The growth in the number of refineries was largely the result of government regulatory policy. The combination of price controls and non-market allocative mechanisms were introduced in the Emergency Petroleum Allocation Act (EPAA) of 1973 and continued under the Energy Policy and Conservation Act (EPCA) of 1975 (Vogely, 1985; Bohi and Russell, 1978). With the adoption of EPAA, the primary problem was assigning rights to price controlled oil among refiners. An “entitlements” program was designed to equalize the effective cost of crude oil to all refiners at a level equal to the national weighted average of controlled and uncontrolled prices. Cash settlements were made from refiners with lower-than-average crude oil acquisition costs to refiners with higher-than-average acquisition costs. Under EPCA, refiners with crude runs of less than 50,000 bbl/day were exempted from any entitlements obligation, regardless of the small refiner’s access to low-cost crude oil (Piccini, 1992). This was the so-called “small refiner bias.” As a result of the program, many small refineries were created particularly in PAD district III (Gulf Coast), for access to low-cost crude oil, and typically with only crude distillation capability. The program ended in 1981, eliminating special treatment for small refineries which eventually caused many of them to go out of business. Since 1981 the number of small refineries that produce under 10,000 barrels per day has decreased from 82 to 32 (a 61 percent decrease) (see
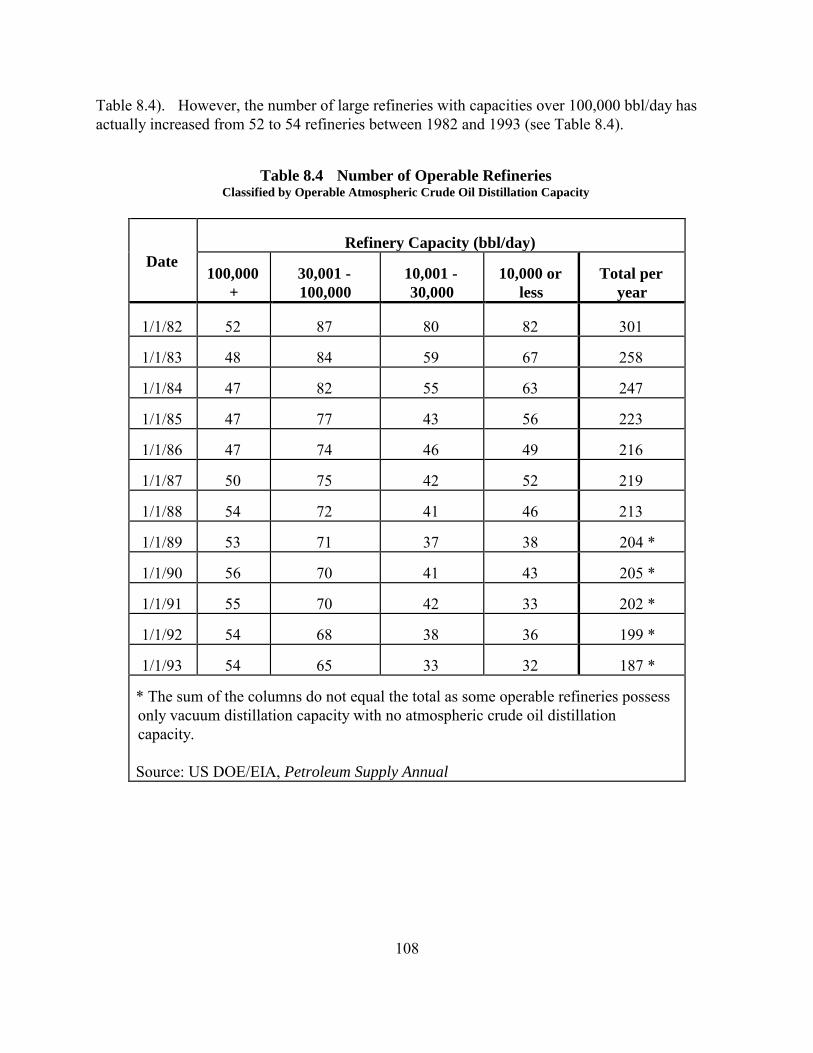
108
Table 8.4). However, the number of large refineries with capacities over 100,000 bbl/day has actually increased from 52 to 54 refineries between 1982 and 1993 (see Table 8.4).
Table 8.4 Number of Operable Refineries
Classified by Operable Atmospheric Crude Oil Distillation Capacity
Date
Refinery Capacity (bbl/day) 100,000
+
30,001 -
100,000
10,001 -
30,000
10,000 or
less
Total per
year 1/1/82
52
87
80
82
301
1/1/83
48
84
59
67
258
1/1/84
47
82
55
63
247
1/1/85
47
77
43
56
223
1/1/86
47
74
46
49
216
1/1/87
50
75
42
52
219
1/1/88
54
72
41
46
213
1/1/89
53
71
37
38
204 *
1/1/90
56
70
41
43
205 *
1/1/91
55
70
42
33
202 *
1/1/92
54
68
38
36
199 *
1/1/93
54
65
33
32
187 *
* The sum of the columns do not equal the total as some operable refineries possess only vacuum distillation capacity with no atmospheric crude oil distillation capacity. Source: US DOE/EIA, Petroleum Supply Annual

109
8.2 Economic Profile 8.2.1 The FRS Companies Financial Reporting System (FRS) companies comprise a number of the largest oil producing companies in the U.S. who report their annual performance to the Energy Information Administration (EIA). Thirty-three companies have submitted data to EIA since EIA started to collect this type of information in 1977. These companies occupy a major position in the U.S. economy. In 1991 their sales were equal to 21 percent of the $2.3 trillion in sales by Fortune magazine’s list of the 500 largest U.S. industrial corporations, and their profits and assets were each equal to 27 percent and 18 percent respectively of those of the "Fortune 500" companies. In 1991, The FRS companies accounted for 56 percent of total U.S. crude oil and natural gas liquids production, 44 percent of U.S. natural gas production, and 64 percent of the U.S. refinery capacity. The Energy Information Administration uses the financial data from the FRS companies as a surrogate for the refining industry as a whole because of the ready availability, completeness, reliability, and continuity of the data. During the 1980's, FRS refineries accounted for between 75 and 80 percent of total domestic refining capacity, although this has fallen during the early 1990's to approximately 70 percent. As can be seen in Table 8.5, the net income derived from refining and marketing operations has experienced wide fluctuations during the period from 1979 to 1992, with the only loss recorded in 1992. Although FRS companies are large integrated entities, economic factors such as increases in raw material costs have a similar effect (in this case increased costs) on both FRS and non-FRS companies. However, the financial health of FRS and non-FRS companies may be significantly different.

110
Table 8.5 Income from Refining
and Marketing Operations (FRS)
(in Millions of dollars)
Year
Net Income
1979
2,301 1980
2,518
1981
1,278 1982
1,913
1983
1,636 1984
105
1985
2,281 1986
1,641
1987
1,073 1988
5,443
1989
4,522 1990
2,184
1991
903 1992
(200)
Source: US DOE/EIA, Annual Energy Review

111
8.2.2 Refined Product Margins Refined product margins are a good indicator of overall refinery financial performance. Refined product margin is defined as the difference between the composite refiner acquisition price of crude oil and the price of refined products to resellers (i.e., wholesale prices). The composite price of refined products includes aviation gasoline, kerosene-type jet fuel, kerosene, motor gasoline, distillate fuel nos. 1, 2, and 4, and residual fuel. Price controls were in effect in late 1970's and early 1980's (ending in 1981), thus making interpretation of the margin difficult. As can be seen in Table 8.6, thereafter, margins have experienced significant volatility, reaching a peak of 22.1 cents per gallon in 1990 and a trough of 13.7 cents per gallon in 1984. The trough in 1984 can be largely attributed to weakened prices for motor gasoline. The peak in 1990 (the year of the Persian Gulf crisis) can be attributed to significant increases in prices for aviation gasoline, motor gasoline, and jet fuel.
Table 8.6 Composite Refiner Margin
Year
Margin (Cents per Gal)
1979
19.4
1980
22.4
1981
19.4
1982
19.4
1983
16.0
1984
13.7
1985
17.0
1986
15.8
1987
13.8
1988
18.7
1989
18.8
1990
22.1
1991
20.7
1992
19.8 Source: US DOE/EIA, Annual Energy Review

112
8.2.3 Refined Products Imports The level of imports of refined products has remained stable throughout the 1980's and early 1990's, as shown in Table 8.7. Imports reached a peak of 2,295,000 barrels per day in 1988 and reached a trough of 1,625,000 barrels per day in 1982. No discernible long-term trend can be observed in the period.
Table 8.7 Refined Product Import Volumes
(in thousands of barrels per day)
Year
Imports
1979
1,937
1980
1,646
1981
1,599
1982
1,625
1983
1,722
1984
2,011
1985
1,866
1986
2,045
1987
2,004
1988
2,295
1989
2,217
1990
2,123
1991
1,844
1992
1,805 Source: US DOE/EIA, Annual Energy Review

113
8.3 Impacts of Environmental Regulations As observed in Figures 8.1 and 8.2, capital and operation and maintenance (O & M) costs for pollution abatement have been increasing since 1976. Solid waste pollution abatement expenditures have increased only slightly while pollution abatement expenditures for water and air have shown significant increases, especially in 1990 and 1991.

114
Figure 8.1. Refinery Pollution Abatement Operating Expenditures
Source: Bureau of the Census. 1987 costs are estimated.

115
Figure 8.2. Refinery Pollution Abatement Capital Expenditures
Source: Bureau of the Census. 1987 costs are estimated.
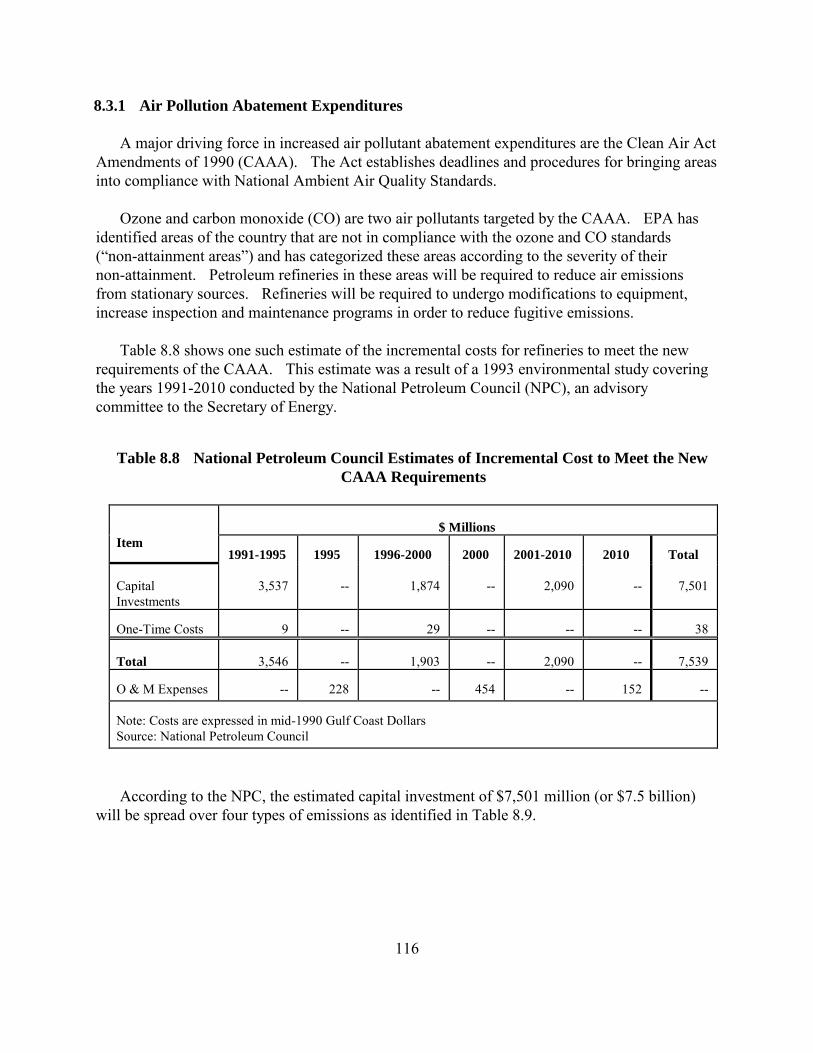
116
8.3.1 Air Pollution Abatement Expenditures A major driving force in increased air pollutant abatement expenditures are the Clean Air Act Amendments of 1990 (CAAA). The Act establishes deadlines and procedures for bringing areas into compliance with National Ambient Air Quality Standards. Ozone and carbon monoxide (CO) are two air pollutants targeted by the CAAA. EPA has identified areas of the country that are not in compliance with the ozone and CO standards (“non-attainment areas”) and has categorized these areas according to the severity of their non-attainment. Petroleum refineries in these areas will be required to reduce air emissions from stationary sources. Refineries will be required to undergo modifications to equipment, increase inspection and maintenance programs in order to reduce fugitive emissions. Table 8.8 shows one such estimate of the incremental costs for refineries to meet the new requirements of the CAAA. This estimate was a result of a 1993 environmental study covering the years 1991-2010 conducted by the National Petroleum Council (NPC), an advisory committee to the Secretary of Energy.
Table 8.8 National Petroleum Council Estimates of Incremental Cost to Meet the New
CAAA Requirements
Item
$ Millions 1991-1995
1995
1996-2000
2000
2001-2010
2010
Total
Capital Investments
3,537
--
1,874
--
2,090
--
7,501
One-Time Costs
9
--
29
--
--
--
38
Total
3,546
--
1,903
--
2,090
--
7,539 O & M Expenses
--
228
--
454
--
152
--
Note: Costs are expressed in mid-1990 Gulf Coast Dollars Source: National Petroleum Council
According to the NPC, the estimated capital investment of $7,501 million (or $7.5 billion) will be spread over four types of emissions as identified in Table 8.9.
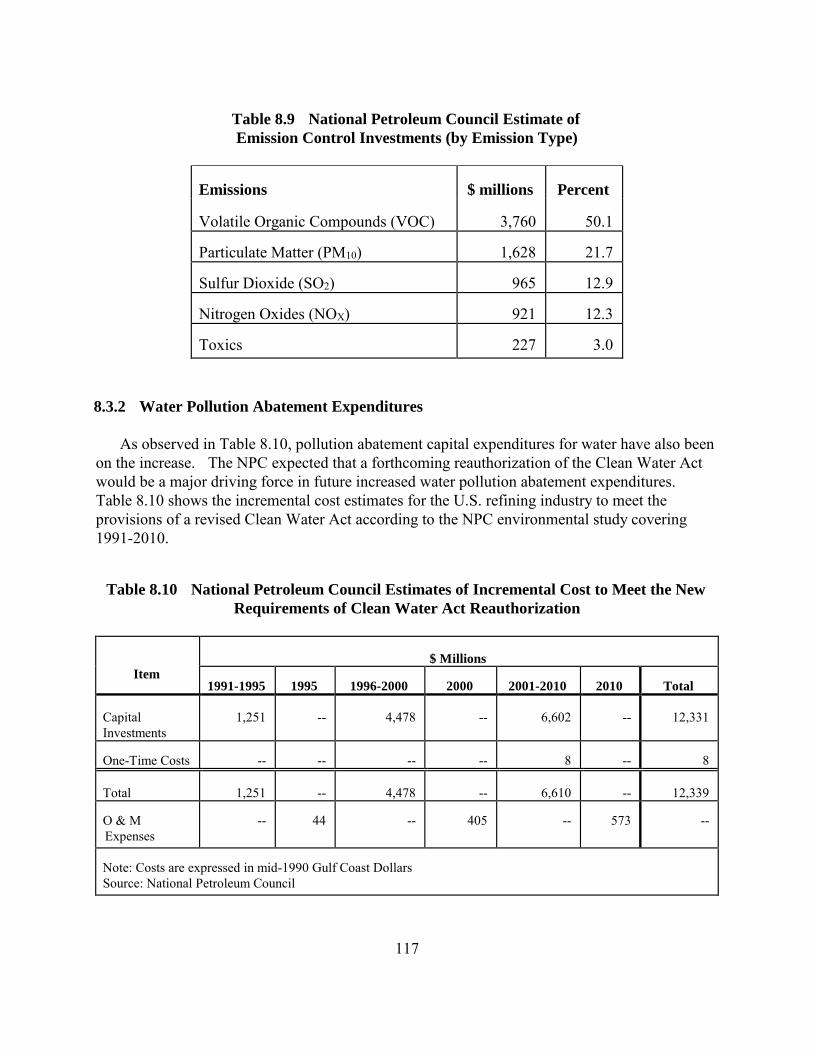
117
Table 8.9 National Petroleum Council Estimate of
Emission Control Investments (by Emission Type)
Emissions
$ millions
Percent Volatile Organic Compounds (VOC)
3,760
50.1
Particulate Matter (PM10)
1,628
21.7
Sulfur Dioxide (SO2)
965
12.9
Nitrogen Oxides (NOX)
921
12.3
Toxics
227
3.0
8.3.2 Water Pollution Abatement Expenditures As observed in Table 8.10, pollution abatement capital expenditures for water have also been on the increase. The NPC expected that a forthcoming reauthorization of the Clean Water Act would be a major driving force in future increased water pollution abatement expenditures. Table 8.10 shows the incremental cost estimates for the U.S. refining industry to meet the provisions of a revised Clean Water Act according to the NPC environmental study covering 1991-2010.
Table 8.10 National Petroleum Council Estimates of Incremental Cost to Meet the New
Requirements of Clean Water Act Reauthorization
Item
$ Millions 1991-1995
1995
1996-2000
2000
2001-2010
2010
Total
Capital Investments
1,251
--
4,478
--
6,602
--
12,331
One-Time Costs
--
--
--
--
8
--
8
Total
1,251
--
4,478
--
6,610
--
12,339
O & M Expenses
--
44
--
405
--
573
--
Note: Costs are expressed in mid-1990 Gulf Coast Dollars Source: National Petroleum Council

118
According to the NPC, these figures have been developed from existing and anticipated wastewater regulations. The assumptions used to develop these costs based on Clean Water Act reauthorization work at the time of the NPC study include the following group of requirements:
Reduction of wastewater toxicity and biomonitoring Elimination of chromium compounds from cooling towers Storm water permit requirements to exclude oil (in storm water) from tank draw offs Storm water requirements to exclude oil from sampling (in storm water) Storm water requirements to exclude exchanger cleaning wastes (from storm water) Storm water permit requirements to reduce discharge of suspended solids (in storm water) Store and treat quantity of contaminated storm water from 10-year storm
Other assumptions anticipated additional regulations applicable to water, wastewater and groundwater and include:
Anticipated requirements for process wastewater reuse Mandated application of a revised Best Available Technology (Effluent Limitations
Guidelines) Anticipated requirements to assess and remediate sediments in outfall areas Prevent ground water pollution from storage tank areas Prevent ground water pollution from underground process piping Prevent groundwater pollution from underground process sewers
The NPC estimate for capital investment over these three areas is shown in Table 8.11. Table 8.12 shows the time frame for the projected investments, estimated to total $12.3 billion.
Table 8.11 National Petroleum Council Estimate for
Water Pollution Control Investments
Item
$ Million
Percent CWA Reauthorization
1,251
10.1
Storm Water Quality
1,196
9.7
Ground Water Issues
3,549
28.8
Table 8.12 National Petroleum Council Projection
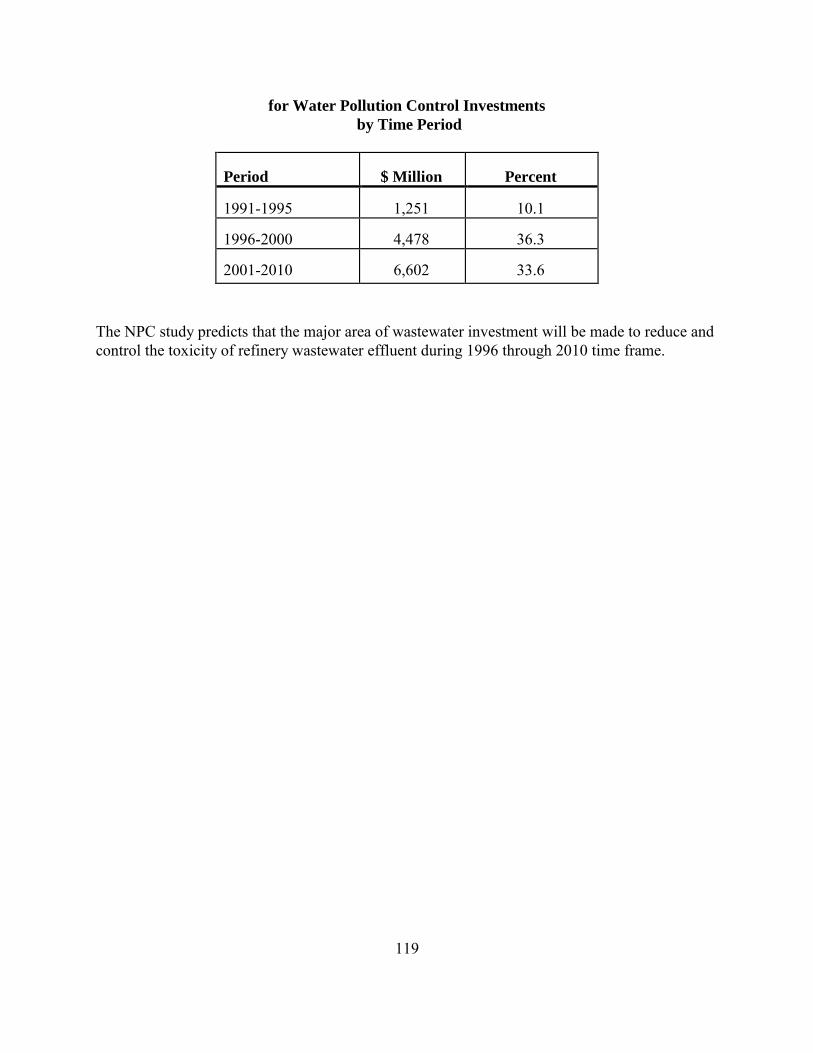
119
for Water Pollution Control Investments
by Time Period
Period
$ Million
Percent 1991-1995
1,251
10.1
1996-2000
4,478
36.3
2001-2010
6,602
33.6
The NPC study predicts that the major area of wastewater investment will be made to reduce and control the toxicity of refinery wastewater effluent during 1996 through 2010 time frame.

120
Bibliography American Petroleum Institute. 1977. Water Reuse Studies. API Publication 949, Washington, D.C., 1977. 132 pp. Bohi, D.R. and M. Russell. 1978. Limiting Oil Imports: An Economic History and Analysis. Resources for the Future, Washington, D.C. Harris, T. 1991. Death in the Marsh. Island Press, Washington, D.C., 1991. Hermanutz, R.O.; Allen, K.N.; Roush, T.H.; Hedtke, S.F. 1992. “Effects of Elevated Selenium Concentrations on Bluegills (Lepomis macrochirus) in Outdoor Experimental Streams.” Environ.-Toxicol.-Chem. Vol. 11, No. 2, pp. 217-224. Hoffman, D.J.; Ohlendorf, H.M.; Aldrich, T.W. 1988. “Selenium Teratogenesis in Natural Populations of Aquatic Birds in Central California.” Arch.-Environ.-Contam.-Toxicol., Vol. 17, No. 4, pp. 519-525. Howard, P.H.; Boethling, R.S.; Jarvis, W.F.; Meyland, W.M.; Michelenko, E.M. 1991. Handbook of Environmental Degradation Rates. Langer, B.S. 1983. “Wastewater Reuse and Recycle in Petroleum Refineries.” Chemical
Engineering Progress, May 1983, pp. 67-76. Lyman, W.J.; Reehl, W.F.; Rosenblatt, D.H. 1982. Handbook of Chemical Property
Estimation Methods: Envionmental Behavior of Organic Compounds. McGraw-Hill, New York, 1982. Marcogliese, D.J.; Esch, G.W.; Dimock, R.V., Jr. 1992. “Alterations in Zooplankton Community Structure after Selenium-Induced Replacement of a Fish Community: A Natural Whole-Lake Experiment.” Hydrobiologia, Vol. 242, No. 1, pp. 19-32. Ohlendorf, H.M.; Hoffman, D.J.; Saiki, M.K.; Aldrich, T.W. 1986. “Embryonic Mortality and Abnormalities of Aquatic Birds: Apparent Impacts of Selenium from Irrigation Drainwater.” Sci.-Total-Environ. Vol. 52, No. 1-2, pp. 49-63. Ohlendorf, H.M.; Hothem, R.L.; Aldrich, T.W.; Krynitsky, A.J. 1987. “Selenium Contamination of the Grasslands, A Major California Waterfowl Area.” Sci.-Total-Environ. Vol. 66, pp. 169-183. Ohlendorf, H.M.; Hothem, R.L.; Welsh, D. 1989. “Nest Success, Cause-Specific Nest Failure, and Hatchability of Aquatic Birds at Selenium-Contaminated Kesterson Reservoir and a Reference Site.” Condor. Vl. 91, No. 4, pp. 787-796.

121
Piccini, R.A., ed. 1992. Petroleum and Public Policy: The Post-World War II Experience. American Petroleum Institute, Washington, D.C. API Discussion Paper 071. Thrash, L.A. 1991. "Survey of Operating Refineries Worldwide.” Oil and Gas Journal, December 23, 1991. U.S. Department of Commerce, Bureau of the Census. Current Industrial Reports, Pollution
Abatement Costs and Expenditures. Various years. U.S. Department of Energy. Performance Profile of Major Energy Producers. 1991. ________. Energy Information Administration. Annual Energy Review. Various years. ________. Energy Information Administration. Petroleum Supply Annual. Various years. U.S. Environmental Protection Agency. Office of Water. 1974a. “Effluent Guidelines and Standards for the Petroleum Refining Point Source Category.” Final Rule. Code of Federal
Regulations (CFR), Title 40, Part 419; Federal Register, Vol. 39, p. 16560, May 9, 1974. ________. Office of Water. 1974b. Development Document for Effluent Limitations Guidelines
and New Source Performance Standards for Petroleum Refining. EPA-440/1-74-014a., April 1974. ________. Office of Water. 1977. “Effluent Guidelines and Standards for the Petroleum Refining Point Source Category.” Final Rule. Code of Federal Regulations (CFR), Title 40, Part 419; Federal Register, Vol. 42, p. 15684, March 23, 1977. ________. Office of Water. 1980. Ambient Water Quality Criteria for Copper. EPA/440/5-80-036, October 1980. ________. Office of Water. 1982a. Development Document for Effluent Limitations
Guidelines and Standards for the Petroleum Refining Point Source Category. EPA/440/1-82/014, October 1982. ________. Office of Water. 1982b. “Effluent Guidelines and Standards for the Petroleum Refining Point Source Category.” Final Rule. Code of Federal Regulations (CFR), Title 40, Part 419; Federal Register, Vol. 47, p. 46434, October 18, 1982. ________. Office of Water. 1986. Report to Congress on the Discharge of Hazardous Waste
to Publicly Owned Treatment Works. (“Domestic Sewage Study”) EPA/530-SW-86-004, February 1986.

122
________. Office of Water. 1987a. Guidance Manual for Preventing Interference at POTWs. EPA/833/B-87-201, September 1987. ________. Office of Water. 1987b. An Overview of Sediment Quality in the United States. EPA/905/9-88/002, June 1987. ________. Office of Research and Development. 1989. Effects of selenium on mallard duck
reproduction and immune function. Whiteley, P.L.; Yuill, T.M.; Fairbrother, A. EPA Environmental Research Laboratory, Corvallis, OR. EPA/600/3-89/078. ________. Office of Water and Office of Emergency and Remedial Response. 1990. CERCLA Site Discharges to POTWs: Guidance Manual. EPA/540/G-90/005, August 1990. ________. Office of Water. 1991. Technical Support Document for Water Quality-Based
Toxics Control. EPA/505/2-90-001, March 1991. ________. Office of Water. 1992a. Toxic Weighting Factors for Offshore Oil and Gas
Extraction Industry Pollutants. Rulemaking Record for Final Effluent Guidelines for Offshore Oil and Gas Extraction, October 15, 1992. ________. Office of Water. 1992b. Introduction To Water Quality-Based Toxics Control For
The NPDES Program. EPA/831/S-92/002. ________. Office of Water. 1993. “Standards for the Use or Disposal of Sewage Sludge.” Final Rule. Code of Federal Regulations (CFR), Title 40, Part 503; Federal Register Vol. 58, p. 9387, February 9, 1993. ________. Office of Water and U.S. Department of the Army, Corps of Engineers. 1994a. Evaluation of Dredged Material Proposed for Discharge in Waters of the United States.
Testing Manual, draft (“Inland Testing Manual”). EPA/823-B/94-002, June 1994. ________. Office of Water. 1995. National Sediment Contaminant Point Source Inventory:
Analysis of Release Data for 1992. Staff working draft, Standards and Applied Science Division, May 1995. Vogely, William, ed. 1985. Economics of the Mineral Industries. 4th Ed. AIME, New York, 1985.

123
Index
activated carbon, 17, 24, 39, 55, 69, 101 activated sludge, 3, 23 API separator, 3, 15, 21, 22 asphalt, 4, 5, 7 baffle plate separator, 3 best available technology (BAT), 1, 3, 14, 15,
27, 30, 32, 33, 34, 38, 79 biological treatment, 3, 15, 23, 24, 26, 39 boiler condensate, 18 best practicable technology (BPT), 1, 2, 3, 4, 15,
26, 27, 30, 32, 33, 34, 36, 38, 79, 82, 83 Clean Air Act, vii, 11, 35, 116 Clean Water Act, 1, 117, 118 cooling tower, 3, 15, 19, 21, 22, 118 cooling water, 3, 15, 19, 20, 21, 32, 54 cracking, 2, 4, 5, 6, 7, 10, 18 development document, 79 dioxin, 46, 59, 65, 103 dissolved air flotation (DAF), 15, 22, 39 distillation, 5, 6, 10, 16, 104, 107, 108 discharge monitoring report (DMR), 13, 63 ecological impact, 101 employment, 84 end-of-pipe treatment, 3, 15, 21, 23 equalization, 3, 21, 22, 54 exposure, 90, 91, 95, 97, 101 filters, 3, 23 flow reduction, 3, 30 Financial Reporting System (FRS) companies,
109 health effects, 95, 97 hydrotreating, 6, 7 induced air flotation (IAF), 22 impacts, 19, 21, 58, 93, 95, 102 imports, 112 indirect discharges, 58 industry trends, 13, 15 in-plant controls, 15 integrated, 100, 109 lagoons, 3
Los Angeles County, 14, 39, 42, 89 lube, 2, 4, 7 National Emissions Standards for Hazardous
Air Pollutants (NESHAP), 11 National Pollutant Discharge Elimination
System (NPDES), 13, 25, 63, 69, 70, 74, 122
neutralization, 16, 17, 19, 55 non-conventional pollutants, 58 once-through cooling, 3, 20 Ontario, 14, 28, 48, 54, 55, 56, 57 oxidation ponds, 3 Permit Compliance System (PCS), 13, 26, 28,
58, 63, 64, 65, 69, 74, 75, 77, 78, 79, 80, 81, 88, 91, 93, 95, 99, 100, 103, 104
petrochemicals, 2, 8 polishing, 3, 7, 15, 21, 23, 24, 26 pollutant loadings, 58, 69 pollutant loads, 100 precipitation, 22 pretreatment, 4, 14, 18, 39, 55 Pretreatment Standards for Existing Sources
(PSES), 1, 4, 39 process operations, 5, 15, 30 regeneration, 14, 17, 46, 47, 51, 53, 54 Resource Conservation and Recovery Act,
(RCRA) 35 risk, 90, 91, 97, 98 sediment contamination, 102, 103 solvent refining, 7 sour water strippers, 2, 15, 16, 17 steam stripping, 6, 16 subcategories, 1, 2 topping, 2 Toxic Release Inventory (TRI), 58, 64, 83, 85,
86, 87, 88, 91, 93, 95, 99, 100, 103 toxic weighting factors, 97 wastewater investment, 119 water use, 13, 18, 30, 34, 54

124
whole effluent toxicity testing (WET), 100, 101, 102