preliminary analysis of fuel tank impact · preliminary analysis of fuel tank impact ... in this...
TRANSCRIPT

Preliminary analysis of fuel tank impactSeddon, CM, Moodie, K, Thyer, AM and Moatamedi, M
http://dx.doi.org/10.1533/ijcr.2004.0277
Title Preliminary analysis of fuel tank impact
Authors Seddon, CM, Moodie, K, Thyer, AM and Moatamedi, M
Type Article
URL This version is available at: http://usir.salford.ac.uk/318/
Published Date 2004
USIR is a digital collection of the research output of the University of Salford. Where copyright permits, full text material held in the repository is made freely available online and can be read, downloaded and copied for noncommercial private study or research purposes. Please check the manuscript for any further copyright restrictions.
For more information, including our policy and submission procedure, pleasecontact the Repository Team at: [email protected].

Preliminary Analysis of Fuel Tank Impact
CM Seddon*, K Moodie**, AM Thyer** and M Moatamedi*1
*Stress Analysis Research Group, Institute for Materials Research, The University of Salford, Manchester, M5 4WT, UK ** Health and Safety Laboratory, Harpur Hill, Buxton, SK17 9JN, UK
Abstract – Following the accident involving the Air France Concorde in 2000 the effects of fluid structure interactions resulting from the impact of a fluid filled tank has become a cause for concern. The work reported here relates to the design of a series of experiments loosely based upon the Concorde incident which aimed to assess whether the probable failure mode in the Concorde accident could occur in land based vessels. Preliminary numerical analyses were undertaken for two of the nine cases that were investigated experimentally in which an empty tank was impacted by a projectile with a velocity of 14m/s and 21.9m/s Initial numerical results for the acceleration at two points on the tank surface and the deformation at the impact zone showed good agreement with test data. Future work is discussed including further numerical modelling incorporating fluid structure interactions for the analysis of the cases when the tank is partially full or completely full. INTRODUCTION The impact of structures by high energy projectiles can produce behaviour that is complex and difficult to predict. Aircraft structures display a particular vulnerability to this type of impact resulting from; uncontained engine debris following engine failure, foreign objects encountered during flight such as birds or hail, runway debris, and in the case of military aircraft, bullet fire. One particular area for concern is the impact of such high speed projectiles upon the aircraft fuel tank. The resulting transient fluid structure interactions can cause catastrophic failure of the tank leading to fuel leak, fire and consequently complete loss of the aircraft. The severity of fuel tank impact was highlighted recently during the investigation into the Air France Concorde accident in July 2000. This particular accident appears to have resulted from a fuel tank rupture caused by an impact from a piece of burst tyre. The accident investigations have suggested that the projectile did not penetrate the tank upon impact causing rupture. It was, however, suggested that the initial impact occurred between two adjacent wing ribs resulting in the fuel tank skin initially deflecting inwards and causing the adjacent panel to deflect outwards. At the same instant a strong hemispherical shock wave caused by the impact was transmitted through the fuel, its movement combining with the outwardly deflecting panel inducing stresses sufficient enough to cause localised failure of the tank. In the mid 1990’s research concerning the impact of aircraft fuel tanks was undertaken by the Federal Aviation Authority [1]. This study highlighted the poor recognition of the fuel tank failure modes in aircraft accidents for which fuel tank rupture had been identified. The subsequent investigations, however, assumed that the projectile impacts the fuel tank with sufficient kinetic energy to puncture and penetrate the tank causing hydrodynamic ram, an overpressure produced by the motion of the projectile within the fuel. In 1999 further work was undertaken by Anderson et al [2] which considered the numerical modelling of hydrodynamic ram, again assuming that the projectile fully penetrates the tank causing overpressure. Recent research undertaken specific to aircraft structures has mainly been concerned with the numerical modelling and validation of the failure of flat skin panels upon high speed impact [3-5]. It is understood that the probable failure mechanism discovered in the Concorde accident has yet to be fully confirmed both experimentally and numerically. As the problem of transient fluid structure interactions has relevance to many other industries such as rail, chemical, nuclear and offshore industries, in which there are significant risks to safety critical structures, the ability to model and predict such phenomenon is becoming increasingly important. The solutions of such problems are extremely complex and traditional analytical methods provide only a limited understanding of the nature of the behaviour. It is therefore necessary to investigate the phenomenon experimentally in order to gain a deeper understanding of the problem and to undertake numerical analyses in order to assess the predictive capabilities of numerical modelling techniques such as Finite Element Analysis. 1 Corresponding Author: [email protected] ,Tel: 0161 2954512, Fax: 0161 2955575

The work reported here concentrates upon the development of an experimental test rig and test procedures for the analysis of the impact of a fluid filled tank, loosely modelling the Concorde incident. A preliminary assessment of the modelling capabilities of LS DYNA explicit dynamics software was also performed, utilising the experimental results for comparison and validation purposes. OBJECTIVES AND METHODOLOGY The main objectives of the work were are to develop an experimental test rig and procedures loosely modelling the Concorde incident, to determine whether the possible failure mode could occur in land based storage vessels/tanks, to collect data relating to the fluid structure interactions which may have occurred during the incident and to assess the feasibility of using LS DYNA a general purpose explicit dynamics Finite Element Code for the prediction of the structural response. In total nine experiments were performed at HSL under a programme termed ‘Response Of Tanks To Variable Impact Loading Experimental Rig’ (ROTTVILER). In this preliminary study two cases in which an empty tank was impacted by a 14m/s and a 21.9m/s projectile were selected for detailed analysis. From the experimental investigation the accelerations and pressures at various positions on the tank and the deformation at the point of impact were determined. A parallel numerical study using LS DYNA explicit dynamics software was performed, in which the accelerations at two points on the tank and the deformation at the impact point were determined numerically and compared with the experiment data, therefore allowing assessment of the suitability of the software and the validity and accuracy of the numerical results prior to investigating the more complex cases containing fluids. EXPERIMENTAL FACILITY Test Facility A diagram showing the main parts of the gas gun test facility used at HSL is shown in Figure 1.
Driver section: 2.5 mBarrel: 3.5 mProjectile trap
TargetRelease mechanism, either commercial75 mm bursting disc or air operated50 mm ball valve
Figure 1- 75mm Shock Tube Arrangement
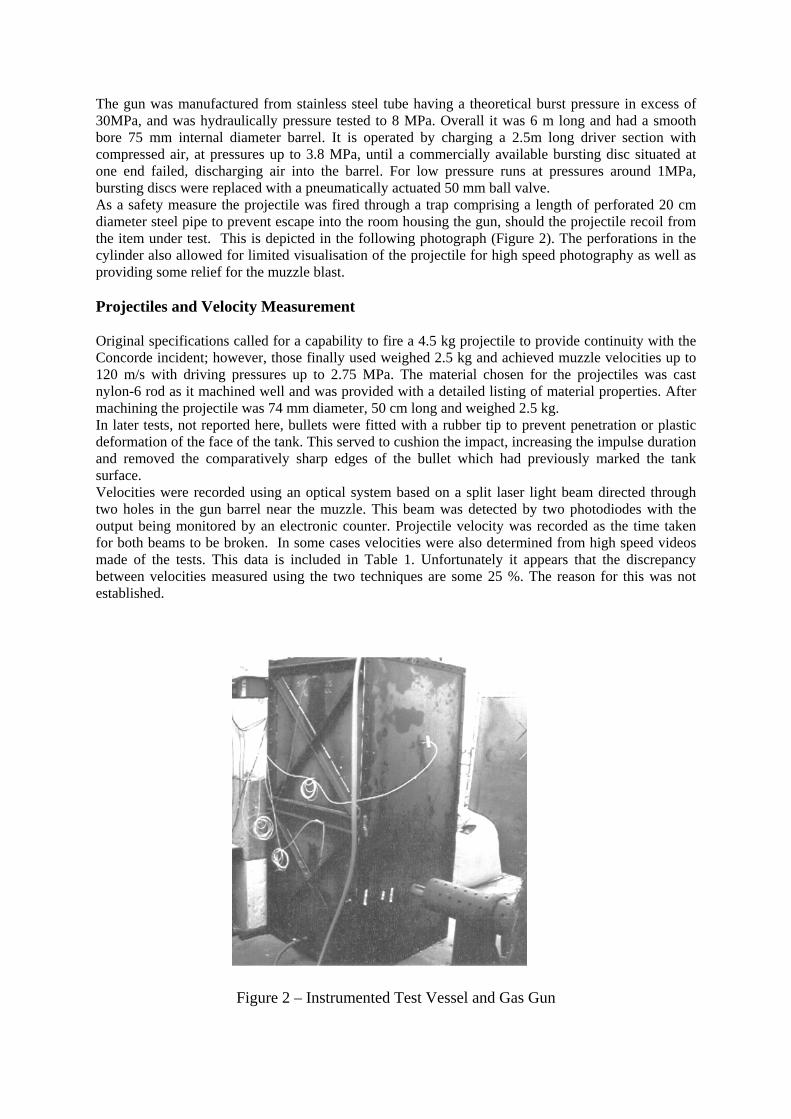
The gun was manufactured from stainless steel tube having a theoretical burst pressure in excess of 30MPa, and was hydraulically pressure tested to 8 MPa. Overall it was 6 m long and had a smooth bore 75 mm internal diameter barrel. It is operated by charging a 2.5m long driver section with compressed air, at pressures up to 3.8 MPa, until a commercially available bursting disc situated at one end failed, discharging air into the barrel. For low pressure runs at pressures around 1MPa, bursting discs were replaced with a pneumatically actuated 50 mm ball valve. As a safety measure the projectile was fired through a trap comprising a length of perforated 20 cm diameter steel pipe to prevent escape into the room housing the gun, should the projectile recoil from the item under test. This is depicted in the following photograph (Figure 2). The perforations in the cylinder also allowed for limited visualisation of the projectile for high speed photography as well as providing some relief for the muzzle blast. Projectiles and Velocity Measurement Original specifications called for a capability to fire a 4.5 kg projectile to provide continuity with the Concorde incident; however, those finally used weighed 2.5 kg and achieved muzzle velocities up to 120 m/s with driving pressures up to 2.75 MPa. The material chosen for the projectiles was cast nylon-6 rod as it machined well and was provided with a detailed listing of material properties. After machining the projectile was 74 mm diameter, 50 cm long and weighed 2.5 kg. In later tests, not reported here, bullets were fitted with a rubber tip to prevent penetration or plastic deformation of the face of the tank. This served to cushion the impact, increasing the impulse duration and removed the comparatively sharp edges of the bullet which had previously marked the tank surface. Velocities were recorded using an optical system based on a split laser light beam directed through two holes in the gun barrel near the muzzle. This beam was detected by two photodiodes with the output being monitored by an electronic counter. Projectile velocity was recorded as the time taken for both beams to be broken. In some cases velocities were also determined from high speed videos made of the tests. This data is included in Table 1. Unfortunately it appears that the discrepancy between velocities measured using the two techniques are some 25 %. The reason for this was not established.
Figure 2 – Instrumented Test Vessel and Gas Gun

Test Vessel The test vessel was designed with rigid sides and a flexible front and back to simplify later modelling. It comprised of a rectangular steel tank of internal dimensions 2x1x1m constructed from 8mm mild steel, with the sides, top and bottom being braces with a number of stiffening webs. The front and back surfaces of the tank were secured with bolts such that different materials/thicknesses could be tested. The vessel was stood vertically a short distance from the gun as shown previously in Figure 2. This close proximity to the gun ensured a planar impact on the front of the tank. The vibrations arising from the impact were measured using four Kistler piezoelectric accelerometers, two 500g range and two 1000g range. Three 0-250 bar Kistler Piezo-resistive pressure transducers were used to measure the pressures within the fluid. In early tests all three pressure transducers were screwed into one side of the tank, however, in later tests the arrangement was changed and two were suspended inside the tank in an attempt to decouple them from the extreme vibrations arising from impact as shown in Figure 3. The data was collected using a 4000 series micro-link system configured to a logging rate of 200 kHz. Data collection was triggered as the first light beam used for the velocity measurement was broken.
Figure 3 –Test Vessel Instrumentation
Acc A
Acc B Acc D
Acc C
P1
Face A (front)
Face B
Face C (rear)
P3
P2
(0, 0, 0)
x
y
z
Impact Point
Impact Point 597, 560, 0 (Face A) Accelerometer A 380, 560, 0 (Face A) Accelerometer B 560, 1440, 0 (Face A) Accelerometer C 550, 560, 1000 (Face C) Accelerometer D 550, 1440, 1000 (Face C) Pressure Transducer 1 0, 1970, 500 (Face B) Pressure Transducer 2 200, 1593, 900 (suspended inside tank) Pressure Transducer 3 910, 563, 900 (suspended inside tank)

NUMERICAL MODELLING The numerical models were developed using LS DYNA explicit dynamics software. This particular software was selected due to the use of explicit formulation within the programme, which is particularly suitable for problems with short durations such as impact or explosion. Another attractive feature of this programme is the ability to model fluid structure interactions using Arbitrary Lagrangian Eulerian (ALE) Coupling Algorithms; this feature will enable further numerical evaluation including cases in which the tank is partially full or completely full of fluid. In this preliminary study the tank was empty of fluid and was impacted by projectiles with velocities of 14m/s and 21.9m/s. Tank Model The complete tank structure was modelled in LS DYNA using 25,000 four noded shell elements (Figure 4). The size of the mesh was determined by performing a convergence study. The walls of the tank were assigned the correct thickness, with the sides, base and top modelled with a wall thickness of 8mm and the front panel, which was the impacted surface, and the rear panel modelled with a wall thickness of 3mm. The tank structure was assigned a Kinematic/Isotropic Elastic/Plastic Material Model with the properties of mild steel. The projectile rod was modelled using a combination of hexagonal/ wedge shaped solid elements, approximately 1080 in total, which were assigned a rigid material model with the properties of nylon. The base of the tank was constrained in all degrees of freedom replicating the experiment in which the tank was fixed to the floor. The projectile was modelled initially touching the tank surface at the instant of impact and was assigned an initial velocity of 14m/s in the first case and 21.9m/s in the second. A surface to surface contact interface was created between the impacting surface of the projectile and the corresponding elements in the impacted zone on the tank surface. The analysis was run for 0.24 seconds with a time step size of 5µSec which corresponded to the data capture time and the 200kHz sampling rate of the data logger used in the experiment.
Figure 4 – Finite Element Model of Tank and Projectile

Time (sec) Time (sec)
RESULTS Tank Deformation The experimental results for the deformation of the tank at the point of impact from the nine impact velocities can be seen in table 1.
Plate Thickness
(mm)
Impact Velocity (m/s) Test
Number Front Back
Water Level (cm) Photocell
High Speed Video
Bullet Mass (g)
Deformation (mm)
ROTT 07 3 6 empty 34.5 - 2485.3 Some Deformation Depth Not Recorded
ROTT 08 3 6 empty 38.6 - 2485.32 Some Deformation Depth Not Recorded
ROTT 09 3 6 empty 39.5 - 2485.3 Some Deformation Depth Not Recorded
ROTT 10 3 3 9 (ullage)
14.0 - 2471.4 No Deformation
ROTT 11 3 3 9 (ullage)
21.9 - 2471.4 4-6
ROTT 12 3 3 70 16.4 - 2471.4 2-3 ROTT 13 3 3 9 19.0 24.1 2471.4 7 ROTT 14 3 3 9 19.7 25.0 2471.4 1-2 ROTT 15 3 3 Full 11.9 23.7 2471.4 No Deformation ROTT 16 3 3 full 19.7 24.5 2471.4 3
Table 1- Experimental results for tank deformation
The numerical deformation at the point of impact for tests ROTT 10 and ROTT 11 are shown in Figure 5 below.
Figure 5 – Numerical Displacement Time History at the Point of Impact for Test ROTT 10 (14m/s impact) and ROTT 11 (21.9 m/s impact)
ROTT 1 0 - 14m/s ROTT 11- 21.9m/s
Dis
plac
emen
t (m
)
Dis
plac
emen
t (m
)
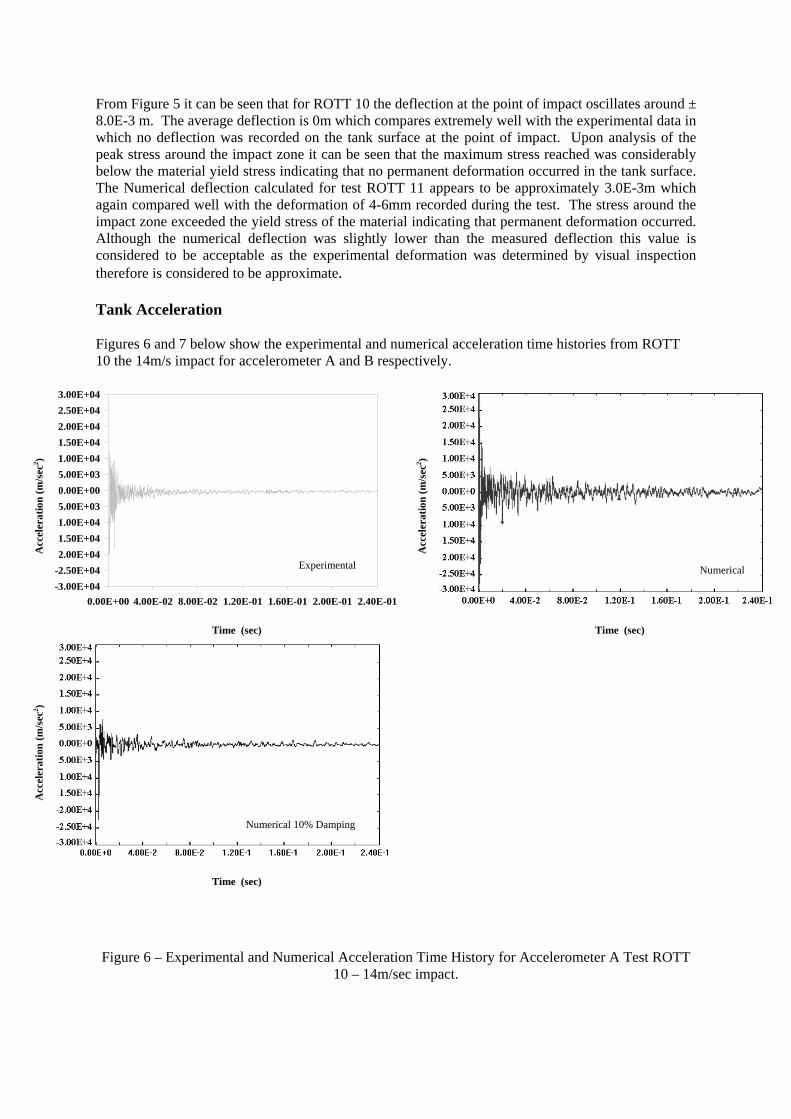
From Figure 5 it can be seen that for ROTT 10 the deflection at the point of impact oscillates around ± 8.0E-3 m. The average deflection is 0m which compares extremely well with the experimental data in which no deflection was recorded on the tank surface at the point of impact. Upon analysis of the peak stress around the impact zone it can be seen that the maximum stress reached was considerably below the material yield stress indicating that no permanent deformation occurred in the tank surface. The Numerical deflection calculated for test ROTT 11 appears to be approximately 3.0E-3m which again compared well with the deformation of 4-6mm recorded during the test. The stress around the impact zone exceeded the yield stress of the material indicating that permanent deformation occurred. Although the numerical deflection was slightly lower than the measured deflection this value is considered to be acceptable as the experimental deformation was determined by visual inspection therefore is considered to be approximate. Tank Acceleration Figures 6 and 7 below show the experimental and numerical acceleration time histories from ROTT 10 the 14m/s impact for accelerometer A and B respectively. Figure 6 – Experimental and Numerical Acceleration Time History for Accelerometer A Test ROTT
10 – 14m/sec impact.
-3.00E+04-2.50E+04-2.00E+04-1.50E+04-1.00E+04-5.00E+030.00E+005.00E+031.00E+041.50E+042.00E+042.50E+043.00E+04
0.00E+00 4.00E-02 8.00E-02 1.20E-01 1.60E-01 2.00E-01 2.40E-01
Acc
eler
atio
n (m
/sec
2 )
Time (sec)
Acc
eler
atio
n (m
/sec
2 ) A
ccel
erat
ion
(m/s
ec2 )
Time (sec)
Time (sec)
Experimental Numerical
Numerical 10% Damping

Figure 7 – Experimental and Numerical Acceleration Time History for Accelerometer B Test ROTT
10 – 14m/sec impact.
Figures 6 and 7 demonstrate that there was good agreement between the experimental and numerical results for the acceleration time histories of the tank at Accelerometer A and B. In both cases the numerical model slightly over predicts the peak acceleration and the results are quite noisy, displaying more oscillatory behaviour. When 10% damping is introduced into the numerical model the peak accelerations are reduced and the overall decay is less oscillatory and more representative of the experimental results. It can be seen in Figure 7 that the experimental results are capped at ±500g during the first few milli-seconds. It is clear that a larger range accelerometer is needed in this position in order to capture the peak acceleration accurately. However, after approximately 2.0E-2 seconds the acceleration falls below 500g and the experimental and numerical data, in particular the model with damping, show excellent agreement. Figures 8 and 9 below show the experimental and numerical acceleration time histories from ROTT 11 the 21.9m/s impact for accelerometer A and B respectively.
-9.00E+03-8.00E+03-7.00E+03-6.00E+03-5.00E+03-4.00E+03-3.00E+03-2.00E+03-1.00E+030.00E+001.00E+032.00E+033.00E+034.00E+035.00E+036.00E+037.00E+038.00E+03
0.00E+00 4.00E-02 8.00E-02 1.20E-01 1.60E-01 2.00E-01 2.40E-01
Acc
eler
atio
n (m
/sec
2 )
Acc
eler
atio
n (m
/sec
2 )
Time (sec)
Time (sec)
Acc
eler
atio
n (m
/sec
2 )
Experimental Numerical
Numerical 10% Damping

Figure 8 – Experimental and Numerical Acceleration Time History for Accelerometer A Test ROTT
11 – 21.9 m/sec impact Again the experimental and numerical results shown in Figure 8 and 9 show excellent agreement, particularly with the models that included damping. Again Figure 9 indicates that accelerometer B was of too small a range to capture the peak accelerations during the impact with the measured data cut off at ±500g. However, after the first 2.0E-2 seconds there is good agreement between the damped solution and the measured data, however, the numerical solution could possibly be made more accurate by increasing the damping applied in the model.
Experimental -4.00E+04
-3.50E+04
-3.00E+04
-2.50E+04
-2.00E+04
-1.50E+04
-1.00E+04
-5.00E+03
0.00E+00
5.00E+03
1.00E+04
1.50E+04
2.00E+04
2.50E+04
0.00E+00 4.00E-02 8.00E-02 1.20E-01 1.60E-01 2.00E-01 2.40E-01
Acc
eler
atio
n (m
/sec
2 )
Acc
eler
atio
n (m
/sec
2 )
Acc
eler
atio
n (m
/sec
2 )
Time (sec)
Time (sec) Time (sec)
Experimental Numerical
Numerical 10% Damping
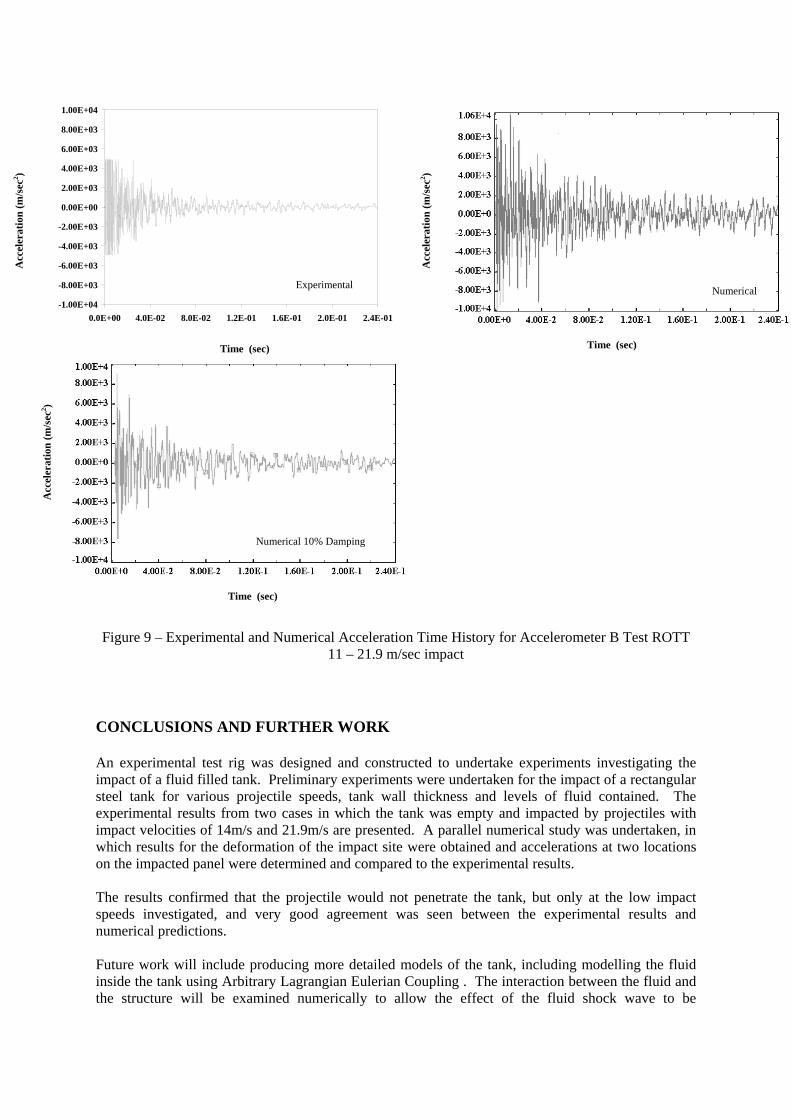
Numerical Figure 9 – Experimental and Numerical Acceleration Time History for Accelerometer B Test ROTT
11 – 21.9 m/sec impact CONCLUSIONS AND FURTHER WORK An experimental test rig was designed and constructed to undertake experiments investigating the impact of a fluid filled tank. Preliminary experiments were undertaken for the impact of a rectangular steel tank for various projectile speeds, tank wall thickness and levels of fluid contained. The experimental results from two cases in which the tank was empty and impacted by projectiles with impact velocities of 14m/s and 21.9m/s are presented. A parallel numerical study was undertaken, in which results for the deformation of the impact site were obtained and accelerations at two locations on the impacted panel were determined and compared to the experimental results. The results confirmed that the projectile would not penetrate the tank, but only at the low impact speeds investigated, and very good agreement was seen between the experimental results and numerical predictions. Future work will include producing more detailed models of the tank, including modelling the fluid inside the tank using Arbitrary Lagrangian Eulerian Coupling . The interaction between the fluid and the structure will be examined numerically to allow the effect of the fluid shock wave to be
-1.00E+04
-8.00E+03
-6.00E+03
-4.00E+03
-2.00E+03
0.00E+00
2.00E+03
4.00E+03
6.00E+03
8.00E+03
1.00E+04
0.0E+00 4.0E-02 8.0E-02 1.2E-01 1.6E-01 2.0E-01 2.4E-01
Time (sec)
Time (sec)
Time (sec)
Acc
eler
atio
n (m
/sec
2 )
Acc
eler
atio
n (m
/sec
2 )
Acc
eler
atio
n (m
/sec
2 )
Experimental
Numerical 10% Damping
Numerical

investigated. As the Concorde fuel tank was constructed from Aluminium rather than mild steel the effects of the material properties will be investigated to confirm that the fluid structure interaction was the cause of the failure of the Concorde fuel tank. REFERENCES 1NA Moussa, MD Whade, DE Groznam et al ‘The potential for Fuel Tank Fire and Hydrodynamic Ram from Uncontained Aircraft Engine Debris’, DOT/FAA/AR-96/9, US Department of Transportation Federal Aviation Authority, January 1997 2 CE Anderson, TR Sharron, JD Walker et al, ‘Simulation and analysis of a 23mm HEI Projectile Hydrodynamic Ram Experiment’ International Journal of Impact Engineering’, 1999, 22 981-997 3 N F Knight, N Jaunky, R E Lawson, et al, ‘Penetration Simulation for Uncontained Engine Debris Impact on Fuselage like Panels Using LS-DYNA’, Finite Elements in Analysis and Design, 2000, 36. 99-133 4 D R Ambur, N Jaunky, R E Lawson, et al., ‘Numerical Simulations for High Energy Impact of Thin Plates’, International Journal of Impact Engineering, 2001, 25 683-702 5 B J MacDonald, ‘A Computational and Experimental Analysis of High Energy Impact to Sheet Metal Aircraft Structures’, Journal of Materials Processing Technology, 2002, 124 92-98