preliminary analysis of benefits from 5 million battery ...€¦ · of 5 million passenger electric...
TRANSCRIPT

Preliminary Analysis of Benefits From 5 Million Battery-Electric Passenger Vehicles in California
California Energy Commission
December 2017 | CEC-999-2017-008
Prepared for: Commissioner David Hochschild
Prepared by: Isaac Sevier, Ignacio Mendez, Eesha Khare, and Ken Rider

California Energy Commission
Isaac Sevier
Ignacio Mendez
Eesha Khare
Ken Rider
Primary Authors
Prepared for: Commissioner David Hochschild
Emilio Camacho
Ken Rider
Project Managers
DISCLAIMER
This report was prepared by the Office of Commissioner David Hochschild. The views and recommendations contained in this document are not official policy of the Energy Commission until the report is adopted.

i
ABSTRACT
The transformation of the electricity sector toward renewable sources of energy in concert with
fuel switching toward electricity in the transportation sector will provide numerous benefits to
California. This report examines the relationship between 5 million battery-electric passenger
vehicles, a robust charging infrastructure, and a renewable energy grid. Five million vehicles
make up 20 percent of the 25 million automobiles registered with the California Department of
Motor Vehicles (DMV). The clean energy from renewable generation bolsters the electric-powered
vehicles to significantly reduce emissions, while the charge profiles of the vehicles may allow
integration of significant amounts of additional renewable generation. This relationship could be
crucial to achieving the clean energy future envisioned for California.
The 5 million vehicle number characterizes an uptake of battery-electric vehicles that is feasible
and substantial. However, the analysis is of a defined scenario and is not intended to represent
any official forecast. This report is a measure of the benefits to California, as well as a qualitative
description of other social and economic benefits. These estimated benefits are a preliminary view
of what can be gained by pursuing a future with a significant number of battery-electric vehicles.
Keywords: Electric vehicle, battery electric vehicle, EV, renewable energy, renewable
integration, grid integration, fuel switching, vehicle-to-grid, V2G, vehicle-to-building, V2B,
greenhouse gas reduction, decarbonization, electric vehicle benefits
Please use the following citation for this report:
Sevier, Isaac, Ignacio Mendez, Eesha Khare, and Ken Rider. 2017. Preliminary Analysis of
Benefits From 5 Million Battery Electric Passenger Vehicles in California.
California Energy Commission. Publication Number: CEC-999-2017-008.

ii

iii
TABLE OF CONTENTS Page
Executive Summary ....................................................................................................................... 1
CHAPTER 1: Benefits of Controlled Demand of Electric Vehicle Charging ...................................... 3
CHAPTER 2: Benefits of Vehicle-to-Grid Services ............................................................................. 9
Background ...................................................................................................................................... 9
Benefits .......................................................................................................................................... 11
CHAPTER 3: Air Emission Impacts ................................................................................................. 17
Health Benefits From Improved Air Quality ............................................................................... 20
Other Benefits ................................................................................................................................ 22
CHAPTER 4: Water Quality Impacts ................................................................................................24
CHAPTER 5: Fuel-Switching Benefits .............................................................................................. 27
California’s Economy and Oil ........................................................................................................ 27
Fossil Fuel Market Exposure Poses Risk ...................................................................................... 27
Consumer Savings Grow With Electric Vehicles ..........................................................................29
Increasing Trade Strength on Ethanol ......................................................................................... 30
CHAPTER 6: California Innovation ................................................................................................. 31
CHAPTER 7: Impacts to Disadvantaged Communities ................................................................... 33
CHAPTER 8: Impacts to Resource and Waste Stream .................................................................... 37
Recycling, Reusing, and the Impact on Waste Stream ................................................................. 37
Supply of Battery Materials ........................................................................................................... 39Cobalt ............................................................................................................................................................ 39Global Lithium.............................................................................................................................................. 44California Lithium ........................................................................................................................................ 45
CHAPTER 9: Impacts to Fuel Independence and Security ............................................................. 46
Distributed Energy Supply Is More Resilient Than Oil Supply ................................................... 46
Electric Vehicles Can Supply Energy During Emergencies .......................................................... 47
Electric Vehicles Bolster National Security Plans ......................................................................... 47
APPENDIX A: Electric Vehicle Battery Characteristics ................................................................. A-1
APPENDIX B: Charging Infrastructure Characteristics ................................................................ B-1
APPENDIX C: Vehicle Market Forecasts........................................................................................ C-1
Market Path to 5 Million Electric Vehicles by 2030 ................................................................... C-1
Historical Data Suggests Possibility to Achieve 5 Million Vehicles Ahead of 2030 ................... C-1
California’s Electric Vehicle Market Is Leading the Way ........................................................... C-3

iv
APPENDIX D: Driver and Vehicle Usage and Duty Cycle Statistics .............................................. D-1
LIST OF FIGURES Page
Figure 1: Summer Weekday Load and Electric Vehicle Charging ...................................................... 4
Figure 2: Summer Weekend Load and Electric Vehicle Charging ..................................................... 5
Figure 3: 5M EV Fleet Charge Profile Design to Avoid Spring Curtailment ...................................... 7
Figure 4: Opportunity to Increase In-State Renewable Generation ................................................. 8
Figure 5: Distribution of Vehicles by Location and Time ................................................................. 10
Figure 6: Actual Load and Wholesale Price With Estimated Baseline “Normal” Price in California
for 2016 by Hour ............................................................................................................................... 13
Figure 7: Actual Load and Wholesale Price With Modeled EV Sale Price in California for 2016 by
Hour................................................................................................................................................... 13
Figure 8: V2B and V2G Benefits by Year .......................................................................................... 15
Figure 9: Summary of EV Fleet Savings Calculations ...................................................................... 16
Figure 10: Percentage of Total GHG and Transportation Emissions (Subchart) That 5 Million EVs
Can Reduce ........................................................................................................................................ 18
Figure 11: CARB Pathway to 2030 Emission Reduction Targets ..................................................... 19
Figure 12: Noise Reduction of EV Versus Combustion Engine Vehicle as a Function of Speed ..... 23
Figure 15: Geographic Demographics of Transit Access and Household Income ........................... 35
Figure 16: Location of SB 535 Communities Relative to Air Pollution and Major Transportation
Corridors ........................................................................................................................................... 36
Figure 17: 2016 Cobalt Production (Kilotons) ................................................................................. 40
Figure 18: Cobalt Reserves (Kilotons) ............................................................................................. 40
Figure 19: Cobalt Demand From Batteries vs. DRC Cobalt Mine Output ....................................... 41
Figure 20: Cobalt Supply, Demand, and Stock.................................................................................42
Figure 21: North American Cobalt Production and Demand ........................................................... 43
Figure 22: Geographic Distribution of Global Lithium Resources ................................................. 44
Figure 23: Western U.S. Sites With Lithium Reserves ..................................................................... 45
Figure A-1: Historical and Forecasted Price per Kilowatt-Hour of Lithium-Ion Batteries,
Estimated by McKinsey and UBS. .................................................................................................. A-2

v
Figure A-2: Historical and Forecasted Cost per Kilowatt-Hour of Lithium-Ion Batteries,
Estimated by Bloomberg ................................................................................................................. A-3
Figure A-3: Historical and Forecasted Price per Kilowatt-Hour of Lithium-Ion Batteries,
Estimated by Researchers at the SEI .............................................................................................. A-4
Figure A-4: Historical and Forecasted Price per Kilowatt-Hour of the Components of Lithium-Ion
Batteries, Estimated by UBS ........................................................................................................... A-5
Figure A-5: Competitive Scenarios Based on the Price of Gallon of Oil and the Cost of Lithium-Ion
Batteries per Kilowatt-Hour, According to UBS............................................................................. A-5
Figure A-6: Correlation Between Battery Size in kWh and Driving Range in Miles ..................... A-7
Figure A-7: Forecast of Lithium-Ion Battery Cost per Kilowatt-Hour ........................................... A-8
Figure A-8: Forecast of Lithium-Ion Battery Cost, Halving Annual Cost Decrease Every Five Years
......................................................................................................................................................... A-9
Figure A-9: Adjusted Forecasted Cost of Lithium-Ion Batteries, Halving the 14 Percent Annual
Cost Decrease Every Five Years .................................................................................................... A-10
Figure A-10: Final Forecast of Cost of Lithium-Ion Batteries ....................................................... A-11
Figure B-1 Distribution of Charging Stations Across California .................................................... B-2
Figure B-2: Charging Profiles for Different Charging Scenarios ................................................... B-3
Figure C-1: Share of New Vehicle Sales by Technology Type 2009 to 2016 .................................. C-2
Figure C-2: Bloomberg New Energy Finance Forecast of Global LDV and EV Sales From 2015 to
2040 ................................................................................................................................................ C-4
LIST OF TABLES Page
Table E-1: Summary of Benefits from Achieving 5 Million Battery Electric Vehicles by 2030 ......... 2
Table 1: Distribution of Vehicle Charging by Season and Opportunity ............................................. 6
Table 2: Amount Emissions Saved Annually Over Existing Standards Using Different
Assumptions ..................................................................................................................................... 20
Table 3: Annual Emissions and Health Savings From 5 Million EVs .............................................. 22
Table 4: Vehicle-Related Pollutants Measured in Puget Sound Based on Source (Bolded pollutants
are recommended as a priority for near-term actions in State of Washington) .............................. 25
Table A-1: Commercially Available Electric Vehicles and Specifications ...................................... A-6
Table A-2: Tabulated Forecast of EV Lithium-Ion Battery Costs ................................................ A-12
Table C-1 Sales of Plug-In Hybrid and Battery-Electric Vehicles From 2009 to 2016 .................. C-3

vi

1
EXECUTIVE SUMMARY
The State of California has set an aggressive roadmap toward decarbonizing its economy. Senate
Bill 32 (Pavley, Chapter 249, Statutes of 2016) sets a goal to reduce greenhouse gas (GHG)
emissions by 40 percent of 1990 levels. In addition, California is one of two original signatories of
the “Under2 MOU,” an international agreement with other states and provinces to keep climate
change within 2 degrees Celsius. Two of the major sectors that contribute to the state’s emissions
are the electricity sector and the transportation sector, which combined made up 56.4 percent of
the state’s GHG emissions in 2015. The electricity sector is transitioning to low-carbon resources.
Decarbonization of the transportation sector can make use of this transition and realize deep
emissions reductions through vehicle electrification. The intersection between transportation and
electric generation is stronger now that mainstream, long-range, affordable battery electric
vehicles are coming to market.
As battery packs replace fuel tanks in vehicles and as renewable energy resources replace fossil
fuels on the electric grid, it is important to understand the broader effects of this transformation.
The potential benefits are particularly important for low-income households as they spend 39
percent of annual income on transportation compared to an average household expenditure of 19
percent. Further, the emission reduction potential of electric vehicles (EV) is particularly
important to disadvantaged communities as 69 percent are located in high air pollution regions.
California already has a goal to have 1.5 million electric vehicles by 2025, set forth by Governor
Edmund G. Brown Jr. in Executive Order B-16-12. This report looks at how an expanded EV fleet
of 5 million passenger electric vehicles by 2030 could not only significantly contribute to
decarbonization, but provide a host of grid, economic, and environmental benefits as well. These
benefits help define the payback on societal investment in the market transformation toward
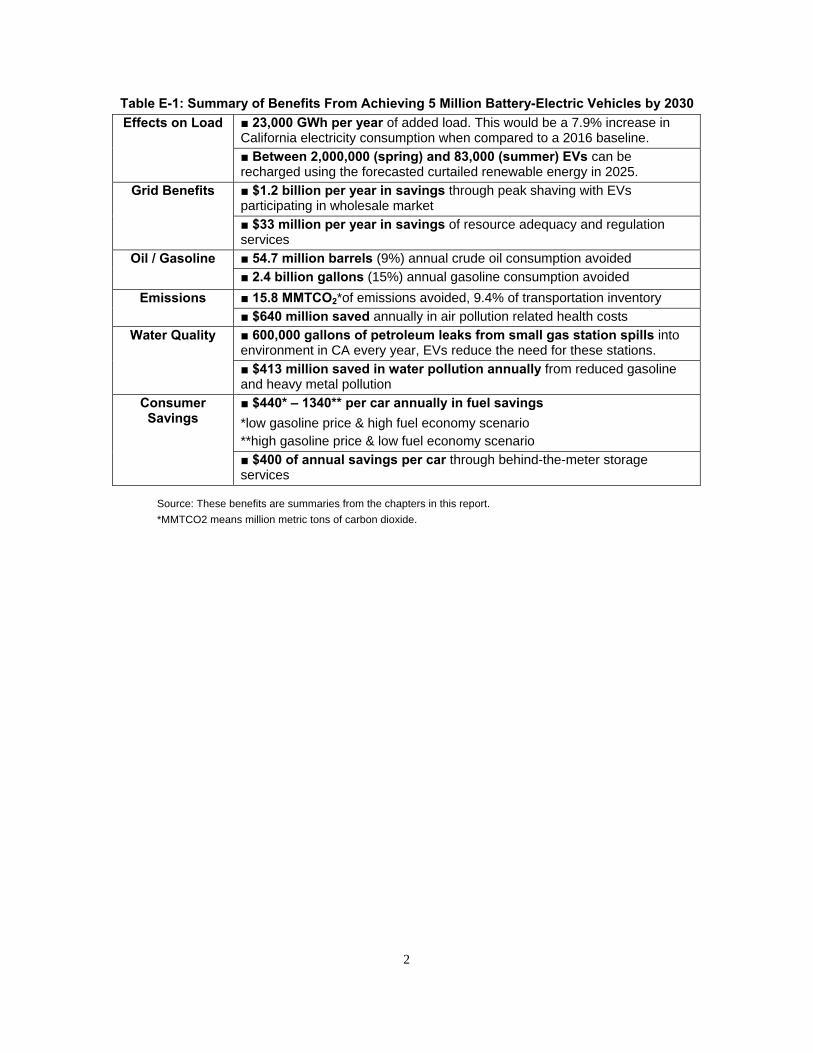
these vehicles. Key findings are summarized in Table E-1.
This report estimates benefits but also intends to illustrate the value that further research could
provide. These benefits are not meant to represent the comprehensive value of market
transformation toward EVs. Significant further benefits exist in lower vehicle maintenance and in
the energy storage sector from increased scale of battery manufacturing. While this report limits
analysis to passenger battery-electric vehicles, there is substantial potential benefit in other
battery-electric vehicles such as electric buses that are beyond this scope. The analysis is of a
specified scenario to demonstrate possible benefits, but is not intended to represent any official
forecast. The scenario analyzed includes 5 million battery-electric passenger vehicles, a robust
charging infrastructure, and an electric grid powered mostly by renewable energy. This report
seeks to illuminate a range of significant benefits, including those for disadvantaged
communities, public health, water quality, air quality, and the electric grid itself from such a
scenario.
2
Table E-1: Summary of Benefits From Achieving 5 Million Battery-Electric Vehicles by 2030
Source: These benefits are summaries from the chapters in this report.
*MMTCO2 means million metric tons of carbon dioxide.
Effects on Load ■ 23,000 GWh per year of added load. This would be a 7.9% increase in California electricity consumption when compared to a 2016 baseline.
■ Between 2,000,000 (spring) and 83,000 (summer) EVs can be recharged using the forecasted curtailed renewable energy in 2025.
Grid Benefits ■ $1.2 billion per year in savings through peak shaving with EVs participating in wholesale market
■ $33 million per year in savings of resource adequacy and regulation services
Oil / Gasoline ■ 54.7 million barrels (9%) annual crude oil consumption avoided
■ 2.4 billion gallons (15%) annual gasoline consumption avoided
Emissions ■ 15.8 MMTCO2*of emissions avoided, 9.4% of transportation inventory
■ $640 million saved annually in air pollution related health costs
Water Quality ■ 600,000 gallons of petroleum leaks from small gas station spills into environment in CA every year, EVs reduce the need for these stations.
■ $413 million saved in water pollution annually from reduced gasoline and heavy metal pollution
Consumer Savings
■ $440* – 1340** per car annually in fuel savings
*low gasoline price & high fuel economy scenario **high gasoline price & low fuel economy scenario
■ $400 of annual savings per car through behind-the-meter storage services

3
CHAPTER 1: Benefits of Controlled Demand of Electric Vehicle Charging
The California electricity grid is evolving with higher penetration of renewable energy and the
addition of new electric loads such as electric vehicles (EVs). With load flexibility growing in
value, the ability for EVs to charge at designated times adds value to California’s grid. Therefore,
this chapter assesses the benefits that controlled demand of electricity from EV charging brings to
the State by (1) altering the net load shape and (2) making use of curtailed energy.
The results presented in this chapter assume a commercially implemented smart-charging
infrastructure—one in which the grid optimizes the amount of energy that it delivers to EVs based
on the time at which they are plugged in. Although improvements could be made to the existing
infrastructure to allow this service, some of the necessities are already met by the current
charging stations. According to the California Public Utilities Commission (CPUC):
Many [plug-in electric vehicles] PEVs and certain electric vehicle charging stations are
equipped with on-board timers or remotely-controlled switches that are capable of
starting, stopping, throttling, or delaying charging. This gives drivers the ability to
schedule charging remotely. [In addition,] [Pacific Gas and Electric Company] PG&E
and [Southern California Edison] SCE are already exploring how to communicate with
PEVs via their Advanced Metering Infrastructure networks to provide demand response.1
The study also assumes that most EVs will be plugged in from 11 p.m. to 8 a.m. on weekdays, as
well as from 11 p.m. to 11 a.m. on weekends, based on the results of PG&E-BMW’s i ChargeForward report on i3 drivers’ behavior.2 Under many time-of-use rates, EV owners will be
offered incentives to charge at those times to minimize their electricity costs. The analysis
assumes that these rates will be optimized such that the time-of-use rates align with maximized
grid benefits.
With respect to curtailment and demand response, the study assumes that at most one-third of
EVs would be available to absorb curtailed electricity at a discounted price. Although the PG&E-
BMW report concluded that “8 percent of the total vehicle pool” participated in demand response
events, it identified that the small number of participants resulted from barriers to effective
participation. Among those barriers, the study identified the small availability of charging stations
1 Langton, Adam and Noel Crisostomo. Vehicle – Grid Integration: A Vision for Zero-Emission Transportation Interconnected Throughout California’s Electricity System, California Public Utilities Commission R. 13-11-XXX (October 2013), http://docs.cpuc.ca.gov/PublishedDocs/Published/G000/M080/K775/80775679.pdf. 2 Kaluza, Sebastian, David Almelda, and Paige Mullen. “BMW i ChargeForward: PG&E’s Electric Vehicle Smart Charging Pilot,” PG&E Currents (June 2017), http://www.pgecurrents.com/wp-content/uploads/2017/06/PGE-BMW-iChargeForward-Final-Report.pdf.
4
and the number of vehicles that were parked at these stations without being plugged in. For this
reason, this study assumes a more extensive and rich charging infrastructure, as outlined in
Appendix C.
Furthermore, the results presented in this chapter assume that drivers would charge an average of
15 kilowatt-hours (kWh) every day, which is enough to drive 54 miles with an assumed efficiency
of 3.6 miles per kWh. A 54-mile driving range is well above the average daily driving distance of 31 miles.3
To estimate the amount of energy potentially available for storage in the batteries of electric
vehicles, a simple model was built as described in Appendix A. The figures presented in this
chapter were calculated by using data from late 2016 and 2017, analyzing load curves for
weekends and weekdays of each season. These data, along with 2025 curtailment forecasts made
by the Union of Concerned Scientists (UCS), were used to optimize the way in which 5 million
EVs could be charged by increasing baseload generation during the aforementioned time windows, without rising above peak demand levels.4 Examples of this optimization for summer
are shown in Figures 1 and 2, where the vehicle charging profile is optimized to avoid system peak
load.
Figure 1: Summer Weekday Load and Electric Vehicle Charging
Source: Authors’ analysis. Red area represents added electric vehicle charging load above a typical summer
weekday load curve in 2016.
3 For more information on these figures, refer to Appendix B.
4 Nelson, James H. and Laura M. Wisland, Achieving 50 Percent Renewable Electricity in California: The Role of Non-Fossil Flexibility in a Cleaner Electricity Grid, Union of Concerned Scientists (August 2015), http://www.ucsusa.org/sites/default/files/attach/2015/08/Achieving-50-Percent-Renewable-Electricity-In-California.pdf.

5
Figure 2: Summer Weekend Load and Electric Vehicle Charging
Source: Authors’ analysis. Red area represents added electric vehicle charging load above a typical summer
weekend load curve in 2016.
Table 1 shows how 5 million EVs would be charged during the eight key periods analyzed in this
chapter. For each key period, Table 1 shows the number of EVs that could be charged using three
forms of energy: (1) off-peak energy, supplied from 11 p.m. to 8 a.m. on weekdays and from 11
p.m. to 11 a.m. on weekends; (2) medium-peak energy, supplied from 8 a.m. to 11 p.m. on
weekdays and from 11 a.m. to 4 p.m. on weekends; and (3) curtailed energy, using the average
amount that was forecasted for each season.

6
Table 1: Distribution of Electric Vehicle Charging by Season and Opportunity
Season EVs charged during Off-Peak time
% EVs charged
during Medium-Peak time
% EVs charged
with Curtailed Energy
% Total EVs
Summer-Weekday
4,153,092 83 763,508 15 83,400 2 5,000,000
Summer-Weekend
4,271,762 85 644,838 13 83,400 2 5,000,000
Fall-Weekday
3,655,708 73 592,759 12 751,533 15 5,000,000
Fall-Weekend
3,369,471 67 878,996 18 751,533 15 5,000,000
Winter-Weekday
3,301,965 66 963,568 19 734,467 15 5,000,000
Winter-Weekend
3,301,965 66 963,568 19 734,467 15 5,000,000
Spring-Weekday
2,343,643 47 598,224 12 2,058,133 41 5,000,000
Spring-Weekend
1,964,080 39 977,787 20 2,058,133 41 5,000,000
Average 3,295,211 66 797,906 16 906,883 18 5,000,000
Source: Authors’ analysis. Curtailed energy is not tied to a specific time, rather an excess of renewable production.
The morning valley in electricity generation is deeper during the summer; therefore, greater
numbers of EVs would be able to draw energy from the grid in summer mornings compared to
other seasons. On the other hand, given that spring entails larger amounts of curtailed energy,
more cars would be charged using curtailed electricity than in other seasons. This type of charging
would be an effective way to use curtailed electricity.
This chapter concludes that 5 million electric vehicles could consume a maximum of 23,000
gigawatt-hours (GWh) of electricity generated by renewable energy sources in
California. The way electric vehicles are charged today would particularly align with the output of
wind farms. Price signals and policy could further alter this to match the profile of other
renewable energy sources, such as solar. If so, 12,000 MW of solar would be needed to power a
fleet of 5 million vehicles, based on a 22 percent capacity factor. In this case, the charge profile
would be concentrated midday, and workplace charging would be significantly more important,
as seen in Figure 5 in Chapter 2. Vehicle charging can also be used specifically to absorb curtailed
energy. Figure 3 shows the use of otherwise-curtailed energy shown in Table 1 for spring.

7
Figure 3: 5M EV Fleet Charge Profile Design to Avoid Spring Curtailment
Source: Analysis of California Independent System Operator (California ISO) spring load and renewable
generation data
If the otherwise-curtailed energy would be sold to EVs at typical wholesale prices, $132 million per year of revenue would be added to generators based on 2016 historical prices.5 Rates
could be designed to share some of that benefit with vehicle owners to provide an incentive for
their participation and availability for midday charging.
This additional load from EV charging represents a significant opportunity for decarbonizing the
California economy if policies are put in place to ensure that the load from EVs is met by
renewable, low-carbon resources. This new load would increase California’s electricity
consumption by 7.9 percent with respect to 2016 electricity generation. The amount of GWh
was calculated by modeling each month as having 30 days, 22 of which are weekdays.
5 “CAISO Average Price,” Industry Data, LCG Consulting Data Energy Online, accessed July 2017, http://www.energyonline.com/Data/GenericData.aspx?DataId=20&CAISO___Average_Price.
0
10000
20000
30000
0 4 8 12 16 20 24
Pow
er(MW)
TimeofDay2017CurrentLoad2017Loadw/5MEVs2017RenewableGeneration2017RenewableGeneration+2025CurtailmentForecast

8
Figure 4: Opportunity to Increase In-State Renewable Generation
Source: Energy Commission’s total system power for 2016. The energy mix after EV penetration is the 2016
system power adjusted by 23,000 GWh of additional renewable energy.

9
CHAPTER 2: Benefits of Vehicle-to-Grid Services
Background Battery-electric vehicles have the potential to interact in the grid in ways beyond the respective
charging profile. Vehicle design could be implemented where the vehicle equipment provides
services to the grid, primarily through battery systems. This chapter presents the economic
benefits that 5 million EVs could bring to California through vehicle-to-grid (V2G) and vehicle-to-
building (V2B) services. In particular, it focuses on the savings to vehicle owners and utilities that
arise from a more dynamic participation of EVs in the retail and wholesale markets, as well as in
the provision of other grid support services.
The combination of two factors makes EVs desirable in the V2G and V2B markets: the storage
capacity of the vehicle batteries and the fact that at least 90 percent of them are parked at any
given time of the day. This, in turn, means that 270 million kWh of energy storage could be
connected to the grid at any given time, ready to provide services by either absorbing or releasing electricity.6 Figure 5, produced by the CPUC in its 2014 Vehicle-Grid Integration Report,7 shows
the average distribution of cars in California in terms of whether they are being driven or parked
at home, work, or other facilities.
6 This chapter carries on the assumptions made in Chapter 1 that the average EV battery size is 60 kWh.
7 Langton, Adam, and Noel Crisostomo. Vehicle-Grid Integration. 2014. California Public Utilities Commission. www.cpuc.ca.gov/WorkArea/DownloadAsset.aspx?id=7744.

10
Figure 5: Distribution of Vehicles by Location and Time
Source: CPUC Vehicle-Grid Integration report, Figure 3.
According to the Massachusetts Institute of Technology’s (MIT) Lincoln Laboratory, the
economics of the EV batteries “are enhanced if the battery state of charge (SOC) during long parked periods […] is maintained at 80% rather than [at] full charge.”8 This means that, ideally,
EVs should always have 12 kWh of battery space unused. This battery space, in turn, would be
available to store energy when the price of electricity is low (or negative) to then use it or sell it in
the event of price rises. The extent of price fluctuations is best exemplified by the two extremes of
2016: while the price of wholesale electricity went as high as $1,470/MWh on August 31, it was as low as -$180/MWh on September 25.9 The battery capacity from a single participant needed to
maximize grid benefits, as a percentage, could decrease as vehicle battery overall size increases
and with an overall larger EV fleet.
The energy transaction mechanisms can work somewhat flexibly but also depend on available
charging infrastructure and driving patterns of EV owners. The Institute for Electrical and
Electronics Engineers argues that the “optimum strategy might be to charge the battery fully,
including equalization, and then bring it down to 80% charge for most of the day – to leave room for peak shaving in to the building’s electricity grid, but also to optimize battery lifetime.”10
8 Millner, Alan, Nicholas Judson, Bobby Ren, Ellon Johnson, and William Ross. “Enhanced Plug-in Hybrid Electric Vehicles,” IEEE Conference Publications (June 2011), http://www.ieeepesboston.org/files/2011/06/IEEE-Alan_Millner_584.pdf.
9 “CAISO Average Price,” Industry Data, LCG Consulting Data Energy Online, accessed July 2017, http://www.energyonline.com/Data/GenericData.aspx?DataId=20&CAISO___Average_Price.
10 Millner, Alan, Nicholas Judson, Bobby Ren, Ellon Johnson, and William Ross. “Enhanced Plug-in Hybrid Electric Vehicles,” IEEE Conference Publications (June 2011), http://www.ieeepesboston.org/files/2011/06/IEEE-Alan_Millner_584.pdf.

11
Recently, the University of Warwick developed an algorithm that found that discharging a vehicle
battery to provide local storage could reduce degradation of lithium-ion batteries, thus improving the lifetime of usable energy and capacity in the vehicle battery.11 Well-designed participation
strategies can reduce battery cycling degradation and maximize overall benefit.
The findings of this chapter are based on the assumption that the necessary charging
infrastructure will be in place when the 5 million vehicles are deployed, making the described
bidirectional transactions technologically feasible. (See Appendix B for more detail.) Moreover,
the calculations assumed that Level 2 chargers are available in both the residential and
commercial sectors, allowing the EVs to exchange electricity at a rate of 6.6 kW in most parking
places.
Benefits V2B allows EV owners to decrease their electricity bill by buying electricity when prices are
cheaper in the retail market, storing it in the EV battery, and then dispatching it to satisfy their
own demand during expensive peak hours under a time-of-use rate. To compute V2B benefits, the
study modeled two daily load curves per season for the average household: one for weekdays and
one for weekends. This computation was done by scaling down the statewide electricity
consumption via a proportionality constant, expressed as the ratio of average daily statewide
electricity consumption over average daily household electricity consumption. Furthermore, retail
prices were determined by looking at average retail prices per hour for each season, and a cost of $0.0201/kWh was assigned to battery degradation for every energy transaction.12
Through this model, it was found that EV owners can save up to $400 per year on their
electric utility bill. Furthermore, this shift in demand from peak to off-peak hours would allow utilities to save up to $185 million dollars in wholesale transactions. 13The benefit can be
even higher when using cheaper, excess on-site renewable energy to defray retail sales and
enhance distributed energy integration. To the extent that off-peak power and inexpensive energy
coincide with renewable energy production, this improves renewable energy integration.
In terms of V2G, economic benefits were analyzed from two perspectives: (1) that of bulk storage
and peak shifting and (2) that of dynamic participation of EVs in the wholesale electricity market.
For bulk, large-scale peak shifting, the model used in this study assumes that 80 percent of the 5
million EVs are parked at all times during the day. Although this is reasonable, as Figure 5 shows
that 90 percent of cars are parked, the model then degrades this number to account for cars
parked and without connection to the grid. Moreover, it assumes that EVs can lend up to 5
11 Uddin, Kotub, Tim Jackson, Widanalage D. Widanage, Gael Chouchelamane, Paul A. Jennings, James Marco, “On the possibility of extending the lifetime of lithium-ion batteries through optimal V2G facilitated by an integrated vehicle and smart-grid system,” Energy (2017), http://www.sciencedirect.com/science/article/pii/S0360544217306825.
12 Millner, Alan, Nicholas Judson, Bobby Ren, Ellon Johnson, and William Ross. “Enhanced Plug-in Hybrid Electric Vehicles,” IEEE Conference Publications (June 2011), http://www.ieeepesboston.org/files/2011/06/IEEE-Alan_Millner_584.pdf.
13 All benefit calculations assume an efficiency factor of 90% for every energy transaction between the grid and the EVs.

12
percent of the respective storage capacity to the utilities—equivalent to around 3 kWh per car—to
store electricity generated during off-peak hours and retrieve it later during peak time. With
respect to pricing, off-peak and peak prices were determined by computing two averages per
season: one for weekends and one for weekdays. This was done from 5-minute data for 2016, published by California ISO.14
By storing around 10,000 MWh per day in the EV batteries (5-7 percent of daily peak load),
utilities could save up to $80 million by replacing higher-cost peak bulk electricity
purchases to lower-cost off-peak bulk electricity purchases in the wholesale market.
However, by dynamically participating in the wholesale market, EV owners or a grid services
aggregator could directly buy and sell electricity wholesale. The model used for this scenario
differs significantly from that used for bulk storage and peak shifting. For wholesale participation,
the model considers three prices: the wholesale market, a baseline price, and the reselling price
set by EV owners. To emulate this activity, wholesale market prices were assigned hourly and
were calculated by averaging hourly prices from California ISO’s 5-minute market data for 2016
into a single hourly price. Secondly, the baseline price was defined as the median price of
electricity for a period of 161 hours: the 80 hours preceding the one being analyzed, the hour
being analyzed, and the 80 hours following the one being analyzed. This way, the baseline price
serves as a relatively unbiased, “normal” hourly price at which EVs would buy electricity in the
wholesale market to then resell it when prices increase. To finalize the scenario, the reselling price
is defined as twice the baseline price, and it constitutes the price at which EV owners would sell
the electricity they bought at “normal” price. The lower the reselling price, the more frequently
EVs interact with the market and the more battery capacity is needed to participate. Twice the
normal price was chosen as a level that had moderate participation while providing good benefits.
The graphs below illustrate these three prices alongside the load associated with each of those
prices.
14 “CAISO Average Price,” Industry Data, LCG Consulting Data Energy Online, accessed July 2017, http://www.energyonline.com/Data/GenericData.aspx?DataId=20&CAISO___Average_Price.

13
Figure 6: Actual Load and Wholesale Price With Estimated Baseline “Normal” Price in California for 2016 by Hour
Source: Analysis of California ISO data; see footnote 12
Figure 7: Actual Load and Wholesale Price With Modeled EV Sale Price in California for 2016 by Hour
Source: Analysis of California ISO data; see Figure 12
0
5,000
10,000
15,000
20,000
25,000
30,000
35,000
40,000
45,000
50,000
‐200
‐100
0
100
200
300
400
500
600
700
800
0 720 1440 2160 2880 3600 4320 5040 5760 6480 7200 7920 8640
Pow
er(MW)
Price($/MWh)
HouroftheyearCurrentPrice Baseline LOAD
0
5,000
10,000
15,000
20,000
25,000
30,000
35,000
40,000
45,000
50,000
‐200
‐100
0
100
200
300
400
500
600
700
800
0 720 1440 2160 2880 3600 4320 5040 5760 6480 7200 7920 8640
Pow
er(MW)
Price($/MWh)
HouroftheYearCurrentPrice NewPrice LOAD

14
Three things are worth noting from the graphs above. First, the x-axis represents the hours that
have spanned since January 1 at 12:00 a.m. Then, although the reselling price is shown for all
hours, cars sell only when the market wholesale price is more than twice the baseline price, as
mentioned. The “new” reselling price never exceeds twice the “baseline” price, given that this
guarantees that the EVs would win the wholesale market bid. Finally, the model assumes that the
amount of load that is purchased and resold depends on the wholesale market price. For instance,
at times when the wholesale market price is 30 times higher than the baseline price, it is assumed
that EVs would absorb enough electricity to satisfy the all the expensive load due to the huge
difference in price and the competitiveness of the reselling price. In other words, a large price
increase is associated with a large system power deficit. As an example on the other end of the
spectrum, when the wholesale market price is only around two or three times higher than the
normal price, it is assumed that EVs would sell less than the entire amount of electricity required
to satisfy the expensive peak demand.
From this model, it was found that EVs can absorb and resell around 1.7 percent of the total year
electricity generation by storing it in the batteries. This storage accounts for around 3.9 million
MWh of energy transactions throughout the year, which take place in a period of 470 hours.
Furthermore, due to greater volatility than in bulk peak-shifting, this model assumes that only 75
percent of cars would be parked and plugged in at all times. Therefore, the amount of energy
transactions accounts for 2.21 kWh per car per hour of participation (around 4 percent of the EV
battery capacity). This, on average, accounts for a transaction of 0.12 kWh per car per day
throughout the year.
The participation of EVs in the wholesale market can provide total combined revenue of $280
million dollars per year, which translates to $70 dollars per car per year. Accounting for the
battery degradation costs, wholesale participation can provide a net profit of $50 dollars per
car per year. In terms of dollars per kilowatt-hour per year, wholesale participation profits
($1.14/kWh-year) are higher than those of V2B ($0.24/kWh-year). Moreover, the participation of
EVs in the wholesale markets would represent savings of $1.2 billion for utilities. These
savings are from the competition EVs bring to the wholesale market, capping the most expensive
prices to merely double the normal price. Therefore, the combination of these two values presents
a net combined benefit of $1.5 billion for California.
EVs could also be used as load to avoid negative wholesale prices. At $0 per MWh wholesale
price, EVs could top off the batteries in exchange for discounted electricity rates. This would
create up to $80 million per year savings in the wholesale market from avoided negative prices. In
this case, the benefit is achieved using charging profiles alone, and the ability to export energy
from the EVs battery is not necessary.
Lastly, this study analyzed the economic benefits that EVs can provide through other grid
services. In particular, it examined the savings that arise if the EVs perform voltage and frequency

15
regulation services and are available for resource adequacy.15 To compute these benefits, the
study modeled cars as being able to provide contracts of 2.75 kW-months for services.
After optimizing for the maximum benefit, it was found that if 22 percent of parked EVs provide
ancillary services worth up to $5.3 million per year to utilities. Similarly, if 66 percent of
parked EVs can provide resource adequacy services, utilities could save up to $28.3 million
per year, which would otherwise go to contracting power plants. Combined, this represents a
net combined benefit of $33.6 million per year for utilities and Californians.
Overall, the two major benefits drawn from EVs are the combined savings of V2B and the peak
shaving of EVs participating in the wholesale market. Figure 8 represents the progression of these
benefits as EVs penetrate the transportation sector in California.
Figure 8: V2B and V2G Benefits by Year
Source: V2G and V2B benefits from Chapter 2 for 5 million cars, scaled to different levels of EV penetration
15 Resource adequacy is a grid requirement for reliability. A certain amount of extra capacity is maintained on the grid to handle contingencies such as the sudden loss of power from another power plant.
‐
1,000,000.00
2,000,000.00
3,000,000.00
4,000,000.00
5,000,000.00
6,000,000.00
‐
500,000,000.00
1,000,000,000.00
1,500,000,000.00
2,000,000,000.00
2,500,000,000.00
EVs
U$S
Year
V2G:PeakShavingBenefits V2B:NetOwnerSavings EVPenetration

16
Figure 9: Summary of EV Fleet Savings Calculations
Source: Visual representation of the math to reach benefit numbers in this report

17
CHAPTER 3: Air Emission Impacts
EVs produce zero direct emissions through tailpipes, which contribute to smog and health problems. EVs also reduce marginal well-to-wheel emissions,16 which include electric utility and
manufacturing emissions. Despite strong efforts to reduce air pollution, California still contains 7 of the 10 most polluted metropolitan areas and 11 of the worst 25 in the country.17 California also
has the second largest energy-related carbon dioxide emissions in the country,18 and
transportation accounts for 39 percent of these GHG emissions in the State.19 Electrification of
transportation can reduce California’s emissions impact. EVs also significantly reduce air
pollution burdens. This section presents and quantifies air quality benefits, including lifetime
GHG emissions, human health, smog, haze, as well as other benefits to noise pollution and the
urban island heat effect.
Greenhouse Gas Emissions Avoided Five million EVs would release 20.8 million metric tons (MMT) of carbon dioxide equivalent
(CO2e) less each year than present-day conventional vehicles with 24.3 miles per gallon (MPG)
fuel economy according to figures from the U.S. Department of Energy (DOE) Alternative Fuels Data Center.20 This calculation factors in well-to-wheel emissions and the current California grid
composition. Figure 10 shows that 20.8 million metric tons of CO2 amounts to 5 percent of total
GHG emissions and 12 percent of the total transportation emissions in California.
16 Well-to-wheel emissions include all emissions related to fuel production, processing, distribution, and use.
17 Billings, Paul G., Janice E. Nolen, et al. State of the Air 2017, American Lung Association (April 2017): 6, http://www.lung.org/assets/documents/healthy-air/state-of-the-air/state-of-the-air-2017.pdf.
18 Independent Statistics & Analysis, Energy-Related Carbon Dioxide Emissions at the State Level, 2000-2014, U.S. Energy Information Administration (January 2017), https://www.eia.gov/environment/emissions/state/analysis/pdf/stateanalysis.pdf.
19 California Air Resources Board, “Greenhouse Gas Emissions Inventory – Graphs," California Environmental Protection Agency (June 2017), https://www.arb.ca.gov/cc/inventory/data/graph/graph.htm.
20 Energy Efficiency & Renewable Energy Alternative Fuels Data Center, “Emissions From Hybrid and Plug-In Electric Vehicles,” U.S. Department of Energy (2017), https://www.afdc.energy.gov/vehicles/electric_emissions.php. See “all electric.”

18
Figure 10: Percentage of Total GHG and Transportation Emissions (Subchart) That 5 Million EVs Can Reduce
Source: California Air Resources Board (some color alteration) 21
The impacts of 5 million electric vehicles as described in this report align well with the targets set
by the California Air Resources Board and SB 32. Its 2017 Scoping Plan Update proposes to
achieve 40 percent greenhouse gas reductions in 2030 compared to 1990 levels through a suite of policy proposals that include a pathway for 4.2 million ZEVs.22, 23 In Figure 11 below, the
emissions reductions achieved by 5 million EVs (red) are projected into the total transportation
emissions reductions (darker red) proposed by the CARB’s scoping plan to achieve the 2030
target (teal).
21 20.8 million metric tons CO2e superimposed onto data from "California's Greenhouse Gas Emission Inventory." 2017. https://www.arb.ca.gov/cc/inventory/data/data.htm.
22 California Air Resources Board. The 2017 Climate Change Scoping Plan Update: The Proposed Strategy for Achieving California’s 2030 Greenhouse Gas Target.” California Environmental Protection Agency (January 2017), https://www.arb.ca.gov/cc/scopingplan/2030sp_pp_final.pdf.
23 CARB’s target of ZEV includes additional types of vehicles other than battery-electric vehicles discussed in this report and includes plug-in hybrid and fuel cell electric vehicles.

19
Figure 11: CARB Pathway to 2030 Emission Reduction Targets
Source: Modified figure I-5 from CARB Scoping Plan Update, which projects total emissions reductions to achieve
the 2030 target, the fraction of these reductions required by the transportation sector (based on Figure II–2 in the
scoping plan) and the reductions achieved by 5 million EVs. Figure assumes that annual GHG emissions remain
constant as a baseline.
Emissions savings due to a clean grid can be even larger, upward of 24 million metric tons of CO2
equivalents, as demonstrated by the State of Washington.24 While the initial pollution produced
in manufacturing an EV may be 15 percent higher than a gasoline conventional vehicle, EVs can
recover these higher manufacturing emissions within 4,900 miles of driving and reduce overall emissions by 51 percent over the life of the car.25
Even with increasingly stringent standards for combustion vehicle efficiency, EVs still present significant emissions benefits over traditional combustion engines. The annual direct26 vehicle
emissions savings of 5 million EVs is 9.8 million metric tons of CO2 over a baseline that includes
future impacts of Corporate Average Fuel Economy (CAFE standards, assuming 11,327 miles are driven annually per car27 and 8.6 kilograms (kg) CO2 are emitted per gallon of E10 gasoline.28, 29
24 Ibid. Washington’s electricity mix: 68 percent hydroelectric, 10 percent natural gas, 8.5 percent nuclear. Sourced July 20, 2017.
25 Nealer, Rachael, David Reichmuth, and Don Anair. 2015. Cleaner Cars From Cradle To Grave. Union of Concerned Scientists.
26 These are direct emissions and do not include well-to-wheel emissions.
27 "Alternative Fuels Data Center: Hybrid And Plug-In Electric Vehicle Emissions Data Sources And Assumptions." 2017. Alternative Fuels Data Center. https://www.afdc.energy.gov/vehicles/electric_emissions_sources.html.
28 E10 gasoline is a fuel that contains a blend of 10 percent ethanol and 90 percent gasoline.

20
In other words, EVs achieve a 78 percent reduction in CO2 emissions from existing combustion
engine light-duty vehicles (LDVs), whereas CAFE standards would achieve only a 30 percent reduction. About 7.7 million metric tons of direct CO2 emissions are projected to be saved over
existing CARB Low-Emission Vehicle (LEV III) standards30 for vehicles in 2025 and beyond.
These values are summarized in Table 2.
Table 2: Amount Emissions Saved Annually Over Existing Standards Using Different Assumptions
Savings Over Emissions Amount Saved Annually
Unit
2015 combustion vehicles using a CA grid
Well-to-wheel 20.8 million Metric tons CO2 equivalent
2015 combustion vehicles using a cleaner grid (WA)
Well-to-wheel 24 million Metric tons CO2 equivalent
2016 CAFÉ standards Direct 9.8 million Metric tons CO2 2025 CARB LEV III standard
Direct 7.7 million Metric tons CO2
Source: Summary of CO2e reduction figures from this chapter.
Health Benefits From Improved Air Quality Road transportation is a large contributor to particulate matter (PM) and ozone-related health impacts, which include premature death, hospitalizations, lung health, and asthma attacks.31
Together, these contribute to economic damages in the form of medical expenses and lost productivity due to illness.32 EVs present significant health benefits over conventional vehicles
due to improvements in air quality. Unlike conventional vehicles that operate through
combustion, EVs operate through electric motors and do not emit criteria pollutants (for example,
nitrogen oxides, combustion particulate matter, carbon monoxide, and formaldehyde) from a
tailpipe. Further, emissions from electric utilities used to charge EVs are relatively small and will
continue decreasing with increased renewable integration.
Understanding the specific contribution of EVs to air quality health benefits is complex and
requires detailed air quality modeling that includes geographic distribution of particles and air
29 Independent Statistics & Analysis, Energy-Related Carbon Dioxide Emissions at the State Level, 2000-2014, U.S. Energy Information Administration (January 2017), https://www.eia.gov/environment/emissions/state/analysis/pdf/stateanalysis.pdf.
30 California Air Resources Board. 2012. Final Regulation Order "LEV III" Amendments. See CCR Title 13, Section 1961.2
31 Holmes-Gen, Bonnie and Will Barrett. Clean Air Future: Health and Climate Benefits of Zero Emission Vehicles. American Lung Association (October 2016), http://www.lung.org/local-content/california/documents/2016zeroemissions.pdf.
32 Landrigan, Philip J. “Air Pollution and Health.” The Lancet, 2. No. 1 (November 2016), http://dx.doi.org/10.1016/S2468-2667(16)30023-8.

21
patterns, among other criteria. Because of these challenges, this report presents a simplified
estimate of the health benefits from reduced air pollution emissions in Table 3. The amount in
metric tons of direct emissions saved by 5 million EVs is compared to CARB’s LEV III LEV 160 fuel economy standards.33 For particulate matter 2.5 microns or smaller (PM2.5), oxides of
nitrogen (NOx), and volatile organic compounds (VOCs), the health monetization values and
premature mortality estimates are derived from an American Lung Association study, which assumes uniform exposure without applying geographic or population density.34 The health
monetization evaluation includes hospitalizations, emergency room visits, lost work days, and
respiratory symptoms. Annual deaths avoided by carbon monoxide (CO) direct emissions savings are calculated based on a method by Dedoussi et. al,35 and the corresponding premature
mortality valuation ($8.9 million per premature death) is assigned from the economic valuations in EPA Clean Air Act analysis.36
33 CARB. The California Low-Emission Vehicle Regulations Model Years 2015-2025.
34 Holmes-Gen, Bonnie and Will Barrett. Clean Air Future: Health and Climate Benefits of Zero-Emission Vehicles, American Lung Association (October 2016), http://www.lung.org/local-content/california/documents/2016zeroemissions.pdf.
35 Dedoussi, Irene C. Air Pollution and Early Deaths in the United States: Attribution of PM2.5 Exposure to Emissions Species, Time, Location, and Sector. Massachusetts Institute of Technology Laboratory for Aviation and the Environment (May 2014), http://lae.mit.edu/uploads/LAE_report_series/2014/LAE-2014-003-T.pdf.
36 Office of Air and Radiation. The Benefits and Costs of the Clean Air Act from 1990 to 2020., U.S. Environmental Protection Agency (April 2011): 111, https://www.epa.gov/sites/production/files/2015-07/documents/fullreport_rev_a.pdf.

22
Table 3: Annual Emissions and Health Savings From 5 Million EVs
Pollutant Metric Tons Saved
Over LEV160
$ Health
Monetization Saved
Cases of Premature
Mortality Avoided
CO 248,304 $ 6,939,103 0.77967456
PM2.5* 591 $ 480,579,386 40.26072
NOx 9459 $ 152,349,875 13.24288
VOC 236 $ 606,808 0.0567552
*CARB specifies standards for PM, but PM 2.5 is the main constituent of combustion PM 10.37
The total health valuation saved by implementing 5 million EVs over LEV160 standards is $640
million annually.
These emissions reductions also translate into smog and haze reduction and increased visibility.
Motor vehicles are the primary source of smog (a combination of smoke, particulates, ozone, hydrocarbons, NOx, and other chemically reactive compounds38) and haze (composed of
particulate matter39) in California.
Looking forward, if EV penetration is raised to 65 percent of the passenger fleet in 2050, the American Lung Association reports $13.5 billion savings in health and GHG benefits.40
Other Benefits In addition to the GHG and air quality emissions data presented above, EVs help reduce noise pollution in urban settings and cool cities affected by the “urban heat island”41 effect. EVs have an
electric motor that is relatively quieter than conventional vehicle engines. They are particularly
quieter at the low–speeds frequently seen in urban driving where engine propulsion noise dominates road/tire noise (Figure 12).42 However, the benefits due to quieter electric engines
37 Chico, Tom and James Koizumi. Final –Methodology to Calculate Particulate Matter (PM) 2.5 and PM 2.5 Significant Thresholds, South Coast Air Quality Management District (October 2006).
38 "ARB GLOSSARY." 2017. https://www.arb.ca.gov/html/gloss.htm.
39 "Health And Environmental Effects Of Particulate Matter (PM) | US EPA". 2017. U.S. EPA. https://www.epa.gov/pm-pollution/health-and-environmental-effects-particulate-matter-pm.
40 Idem. Clean Air Future: Health and Climate Benefits of Zero Emission Vehicles.
41 The urban heat island effect describes the localized increase in temperature within urban centers in contrast to surrounding rural areas caused by human activity.
42 Marbjerg, Gerd. 2013. Noise From Electric Vehicles - xA Literature Survey. COMPETT.

23
may be diminished due to new federal regulations requiring vehicles to make noise when traveling under 19 mph.43
Figure 12: Noise Reduction of EV Versus Combustion Engine Vehicle as a Function of
Speed
Source: Marbjerg, Gerd. 2013. Noise From Electric Vehicles - A Literature Survey. COMPETT.
In addition, electric cars may have the potential to reduce the “urban island heat effect,” in which
cities are often hotter than surrounding rural areas and consequently increase energy consumption, elevate emissions, and impair water quality.44 This effect is especially prevalent in
Los Angeles,45 and EVs have been included in the city’s climate plan to address the urban island
effect.46 EVs emit only 19.8 percent of the heat that conventional vehicles emit over the same
mileage.47 An initial case study with Beijing found that a switch to electric cars would reduce
Beijing’s summer urban heat island intensity by 1.7 degrees Fahrenheit, reduce the amount of
carbon dioxide emissions by 10,686 tons, and lower electricity consumed by air conditioners by 14.44 million kWh.48 However, the potential for EVs to cool cities has not been fully
characterized.
43 "NHTSA Sets ‘Quiet Car’ Safety Standard To Protect Pedestrians." 2017. U.S. Department Of Transportation. https://www.transportation.gov/briefing-room/nhtsa2716.
44 U.S. EPA. (2017). Heat Island Impacts | U.S. EPA. [online] Available at https://www.epa.gov/heat-islands/heat-island-impacts [Accessed 10 Aug. 2017].
45 Urban Heat Island Interactive Maps | CalEPA. [online] Available at http://calepa.ca.gov/climate/urban-heat-island-index-for-california/urban-heat-island-interactive-maps/ [Accessed 10 Aug. 2017].
46 Los Angeles Regional Collaborative for Climate Action and Sustainability (2016). A Greater LA Climate Action Framework. Los Angeles.
47 Li, C., Cao, Y., Zhang, M., Wang, J., Liu, J., Shi, H. and Geng, Y. (2015). “Hidden Benefits of Electric Vehicles for Addressing Climate Change.” Scientific Reports, 5(1).
48 Ibid.

24
CHAPTER 4: Water Quality Impacts
Leaks, spills, and emissions from vehicles pollute waterways and drinking water supplies and
negatively affect the environment. Forty-six percent of all vehicles in the United States leak
hazardous fluids, including oil, transmission, brake fluid, and antifreeze, resulting in oil spots and rainbow sheens on roads and parking lots.49 These fluids do not easily dissolve in water and
contain heavy metals that are toxic to humans and wildlife. Used oil, such as motor oil, is a
significant pollutant in stormwater runoff, with an estimated 6.1 million gallons of oil flowing
through California waterways on an average runoff year.50 These leaking pollutants are
particularly potent when combined with the increase in impervious (for example, paved) surfaces,
which increase the likelihood of flooding and carrying pollutants away from streets and parking lots and worsen water quality.51
A study by the Washington State Department of Ecology evaluated the amount of toxic chemicals entering Puget Sound based on source and method of entry.52 The pollutants due to vehicles are
presented in Table 4. These chemicals have hazardous consequences for aquatic life and human
health. Because they do not degrade quickly, they can affect fishing and tourism industries and
water supply. The effects of these pollutants, while directly measured in Puget Sound, can be
generalized to California waterways as well.
49 Litman, Todd. 2011. Transportation Cost and Benefit Analysis: Techniques, Estimates and Implications Second Edition. Victoria Transport Policy Institute.
50 California Environmental Protection Agency. 2006. Characterization of Used Oil in Stormwater Runoff in California. https://oehha.ca.gov/media/downloads/water/report/oilinrunoff0906.pdf
51 "Impervious Surface Analysis." 2009. Office Of Environmental Health Hazards Assessment. https://oehha.ca.gov/ecotoxicology/report/impervious-surface-analysis.
52 Department of Ecology, State of Washington. 2011. Control Of Toxic Chemicals: Assessment Of Selected Toxic Chemicals in the Puget Sound Basin, 2007-2011. Olympia.

25
Table 4: Vehicle-Related Pollutants Measured in Puget Sound Based on Source (Bolded pollutants are recommended as a priority for near-term actions in State of Washington)
Pollutant Quantity Unit/Year Source
Cadmium 0.01 Tons Brake pad wear
Copper 37 Tons Brake pad wear
Lead 2.6 Tons Brake pad wear
Mercury 0.0003 Tons Gasoline and diesel combustion
Polyaromatic
Hydocarbons
29,200
11,000
2,300
1,200
Kg Light-duty gasoline and diesel vehicle
emissions
Petroleum spills
Petroleum refineries
Gas station
PCDD/F 0.116
0.015
Grams Toxic
Equivalents
Light duty gasoline and diesel vehicle emissions
Petroleum refineries
Petroleum 6,100
1,900
960
228
Tons Motor oil drips + leaks
Minor gas spills from fueling equipment
and non-road equipment
Improper disposal of used oil
Large petroleum spills
Zinc 7.9
7.1
Tons Motor oil leaks and improper disposal
Brake pad wear
Source: State of Washington, Department of Ecology.
EVs have the potential to address the hazards caused by gasoline and vehicle-related pollutants.
EVs do not require the regular oil changes that combustion vehicles do. Among the listed pollutants, petroleum, which causes air and water pollution harmful to the environment53 and
health,54 can greatly be impacted by replacing the oil infrastructure with an electric one. Aside
from major oil spills, 600,000 gallons of petroleum leak into the environment per year through
53 Environmental Impact of the Petroleum Industry. 2003. Ebook. Hazardous Substance Research Centers/South & Southwest Outreach Program. https://cfpub.epa.gov/ncer_abstracts/index.cfm/fuseaction/display.files/fileID/14522.
54 "Oil Spill Pollution ." 2017. Environmentalpollutioncenters.Org. https://www.environmentalpollutioncenters.org/oil-spill/.

26
small spills at gas stations in California.55 Further, 3,905 underground storage tanks in California
are leaking, and the large backlog on cleanup results in the average age of contaminated sites of 20 years.56 These leaks have affected 334 wells, of which 56 have been treated and 156 remained
active but untreated.57 These spills and leaks constitute a significant health impact because
groundwater supplies 30 to 46 percent of California’s total water supply.58 The oxygenate additive
MTBE was not studied in this report because it was banned by California at the end of 2003.
Quantifying the costs of vehicle-related water pollution is challenging because impacts are diffuse.
A 2015 Victoria Transport Policy Institute survey report estimates that the runoff, oil spill, and
road salting water pollution costs 1.4¢ per average vehicle mile and 0.7¢ per electric vehicle mile.59 Assuming 11,824 annual miles are driven per vehicle in California, 5 million electric
vehicles can save $413 million in vehicle water pollution costs each year compared to average
combustion vehicles.
55 Hilpert, Markus, and Patrick N. Breysse. 2014. "Infiltration and Evaporation of Small Hydrocarbon Spills at Gas Stations." Journal of Contaminant Hydrology 170: 39-52. doi:10.1016/j.jconhyd.2014.08.004.
56 California Environmental Protection Agency State Water Resources Control Board. 2017. Agency Status Report First Half of California Fiscal Year 2016/2017.
57 Ibid.
58 "Groundwater Information Center." Water.Ca.Gov. http://www.water.ca.gov/groundwater/gwinfo/index.cfm.
59 Litman, Todd. 2011. Transportation Cost and Benefit Analysis: Techniques, Estimates and Implications Second Edition. Victoria Transport Policy Institute.

27
CHAPTER 5: Fuel Switching Benefits
California’s Economy and Oil Transportation plays a critical part in the California economy, and switching from gasoline-
powered cars to electric vehicles will increase the economy’s resilience because of fuel
diversification while reducing emissions. In 2016, 335 billion miles were traveled in California by a fleet of more than 25 million personal vehicles, and miles are projected to continue to grow.60
Today, most vehicles rely on diesel or gasoline for fuel, which are both refined from crude oil.
Fossil fuel combustion for transportation is responsible for 39 percent of the state’s greenhouse
gas emissions and heavily impacts air quality in the State, as discussed in Chapter 3. Shifting a
fraction of gasoline-based vehicles to using renewable electricity will have significant impact
throughout the fuel supply chain and help create a healthier California.
The California economy relies on oil and associated products as a source of energy. The
Legislative Analyst’s Office estimates that the California economic output behaves much like the
national economy in the presence of lower oil prices, possibly growing by 0.1 percent to 0.2 percent for every drop in prices of $10, as observed in 2014.61 The move to electric vehicles will
decouple the health of the state’s economy from the volatility of oil prices. California operates at
the limit of its production capacity for gasoline, and small changes in the supply of crude oil or in
the production of gasoline have a record of creating immediate price volatility for consumers,
which is felt throughout the economy.
Fuel diversification reduces the exposure to oil price volatility and creates surplus capacity in the
supply chain, which will only continue to strengthen California’s economy. Electricity is a cleaner
fuel than gasoline and will continue to get cleaner, which, in turn, means that investment today in
clean energy vehicles will create larger dividends as time goes on.
Fossil Fuel Market Exposure Poses Risk California is not alone in trending toward an increasingly diverse transportation sector, as
discussed in Chapter 6. The change in oil demand in California will occur alongside other
reductions globally if other decarbonization policies are successful. This change has the potential
to increase market volatility in the short term as the fossil fuel industry attempts to adapt to
changing market conditions. A recent study shows that a glut of 2 million barrels per day (b/d) in the oil market caused an imbalance that shifted the price downward dramatically.62 California’s
60 California Transportation Quick Facts, Caltrans.
61 Kerstein, Seth, and Justin Garosi. “Effects of Lower Oil Prices on Economy,” Legislative Analyst’s Office (January 2015), http://www.lao.ca.gov/LAOEconTax/Article/Detail/46.
62 Unconventional Risks: The Growing Uncertainty of Oil Investments. 2016. As You Sow. http://www.asyousow.org/ays_report/unconventional-risks-the-growing-uncertainty-of-oil-investments/.

28
exposure to these market conditions can be reduced by decreasing the prominence of oil as an
energy source.
The state’s demand for gasoline threatens to outpace the ability to supply all the feedstocks
required. Without the ability to import fuel easily from elsewhere, California has looked to oil
imports to meet the demand for refined products. In 2016 California relied on foreign imports for
54 percent of its oil consumption and imported more than 328 million barrels of crude oil
annually, largely from Saudi Arabia (34 percent), Ecuador (23 percent), and Colombia (14
percent). Switching to electricity as a fuel for 5 million vehicles could reduce crude oil demand by
as much as 54.7 million barrels per year (17 percent). At a price of $50 per barrel and oil sources
similar to those seen in 2016, this amounts to a $2.74 billion reduction in spending on
foreign oil.
California is part of a larger gasoline market that includes Nevada, Oregon, Washington, Arizona,
Hawaii, and Alaska. Due to the region’s geographic distance from other crude oil and refined
product sources, small disruptions in the crude oil or fuels supply chains can cause sharp
increases in the gasoline spot market in the six states. California has the largest refining capacity
in the market and exports to Nevada and Arizona. Therefore, changes to California’s fuel demand
will have regional impacts. As electricity displaces gasoline in a fleet of 5 million EVs, California
would reduce the amount of gasoline used per day by 2.4 billion gallons per year (15 percent).
In 2016, refiners in California produced around 45 million gallons per day of gasoline but still did not meet all the demands of drivers in the state.63 There are multiple dynamics that lead to this
problem, including the physical disconnection of the Northern and Southern California markets.
Although Northern California often produces a surplus of gasoline that could be used in-state, it
still falls about 2 million gallons per day short of being able to supply Southern California, and
gasoline shipments between the two require cumbersome transport by marine barge. This leaves
the southern region importing from other states in the regional market and from the global fuels
market.
The overall reduction in gasoline demand could allow California to end imports of gasoline from
the global market and shift the State to having a surplus capacity of 3.5 million gallons per day.
Other states in the regional market import around 1.5 million gallons per day of gasoline from
other parts of the United States or the global market, according to the U.S. Energy Information Agency (EIA) analysis.64 California could supply some of that demand while increasing supply
reliability through a net surplus of 2 million gallons per day.
63 Fuels Watch Report for 2016. California Energy Commission. http://www.energy.ca.gov/almanac/petroleum_data/fuels_watch/.
64 Ibid.

29
Consumer Savings Grow With Electric Vehicles Fuel economy standards are a critical measure that help Californians save money by reducing the
fuel required to deliver the same transportation benefits. As discussed above, gasoline prices are
subject to factors that cause high uncertainty about prices, including global oil prices and
constrained fuels supply. In contrast, electricity is domestically produced and has established
regulation to protect ratepayers. Offering incentives to Californians to switch to electric vehicles
will save additional money as a complementary policy to increased fuel economy standards, while
creating additional economic and environmental benefits.
The average American purchases about 470 gallons of fuel each year if his or her car has a fuel economy of 24 miles per gallon.65 In 2016, the CAFE standard for new passenger vehicles will
require a 10-miles-per-gallon increase in efficiency, saving more than $400 a year per vehicle at $3 per gallon gas prices.66 Moreover, switching to higher fuel economy cars would remove 2,600
lbs. of carbon dioxide out of the atmosphere per vehicle each year.67
However, buying a vehicle that meets the fuel economy standards leaves 70 percent of the fuel
and emissions savings on the table compared to an EV. Replacing an average American fossil-
fueled vehicle with an EV eliminates the direct tailpipe emissions and dramatically reduces the
fuel cost to consumers. For example, an average gasoline vehicle consumes $1,422 of fuel each
year. An EV replacement would consume just $552 of electricity, producing $870 in fuel savings each year.68 Fuel savings alone represent a $5 billion savings to California consumers when 5
million EVs are on the road.
California utility companies provide specific rates for EV owners, creating an even larger potential
savings for consumers who take advantage of these rates. The average rate for electricity in
California is 17.4 cents per kWh. Each large, investor-owned utility company in the State has a
time-of-use rate for EVs that adjusts the rate used for the home charger depending on the time of
day. This flexibility accounts for the times that electricity is being produced cheaply by renewables
on the California grid, as the authors elaborate in Chapter 1. For example, PG&E customers could
see their fuel savings increase from $858 to $1,031 annually if they took advantage of the off-peak
scheduled pricing for EVs at the yearly average of 12.3 cents per kWh.
65 “Light-Duty Vehicles, Short Wheelbase Mileage, Annual.” U.S. Energy Information Agency. https://www.eia.gov/opendata/qb.php?category=711246&sdid=TOTAL.PCMIRUS.A.
66 “CAFE and GHG Fact Sheet”. National Highway Traffic Safety Administration. https://www.nhtsa.gov/staticfiles/rulemaking/pdf/cafe/CAFE-GHG_Fact_Sheet.pdf.
67 “How Much Carbon Dioxide Is Produced From Burning Gasoline and Diesel Fuel?” Energy Information Agency. https://www.eia.gov/tools/faqs/faq.php?id=307&t=11
68 Using average California residential rates of 17.4 cents per kilowatt hour. “Average retail price of electricity in California.” Energy Information Agency. https://www.eia.gov/opendata/qb.php?sdid=ELEC.PRICE.CA-RES.A

30
Increasing Trade Strength on Ethanol Every gallon of gasoline in California is 10 percent ethanol, and that proportion is scheduled to
increase to meet the state’s emissions targets. Ethanol use in fuel has become standard
nationwide, and other countries have adopted ethanol as a lower-carbon blending agent to meet
octane requirements. This has led to the United States becoming the largest producer of ethanol
and the largest exporter of ethanol in the world.
The adoption of 5 million EVs in California will reduce overall ethanol demand in the United
States and create additional capacity for exporting to other countries. The total demand for
ethanol in California reached 1.52 billion gallons in 2016, and the State produced just 218 million gallons.69,70 The annual reduction in ethanol from a fleet of 5 million EVs will be nearly 237
million gallons71 per year, freeing up 23 percent more capacity for national export should ethanol
producers choose to maintain current production levels from 2016.
Extrapolating further, the reduction of demand for ethanol in the United States due to electric
vehicles could have a variety of outcomes. In a scenario where the increased ethanol export is
infeasible or uneconomic, it can be supposed that the price of ethanol then drops due to demand
changes and slows the production of ethanol to meet the new price curve. In a separate scenario
where the United States expands its export ethanol, it could be that the surplus bolsters the
world’s fuel supply with a cheap source of octane.
Changes to ethanol or oil supply don’t occur in a vacuum, however, but instead have correlated
price impacts. The use of ethanol in fuel to meet carbon emission standards has also contributed
to slowing the consumption of oil. It is understood that decreasing oil prices leads to lower
gasoline prices, which in turn leads to lower ethanol prices. Today’s forecasts for oil take into
account that there are significant oil resources ready to drill that would easily rise to meet any
upward shifts in demand, effectively dampening price increases. In addition, the United States
regularly realizes increased efficiency in corn production. The overall effect of EVs on ethanol, oil,
and gasoline prices are difficult to predict as it depends on market conditions.
69 Ethanol Use in California. California Energy Commission. http://www.energy.ca.gov/almanac/transportation_data/ethanol.html.
70 Fueling a High Octane Future. Renewable Fuels Association. Accessed July 24, 2016. https://www.ethanolrfa.org/wp-content/uploads/2016/02/Ethanol-Industry-Outlook-2016.pdf.
71 Ten percent of the reduction in gasoline volume shown on page 27 of this report.

31
CHAPTER 6: California Innovation
The Zero Emission Vehicle (ZEV) Action Plan72 has provided excellent vision and leadership for
California, but there is more potential to lead the world in the future of personal transportation
with higher targets based on the industry today. In 2012, when Governor Brown issued the
executive order to create the ZEV Action Plan, there were fewer than 30,000 ZEVs on the road in
California. Setting a target of 1.5 million was ambitious, and the associated planning and stability
were needed to encourage this new, cutting-edge industry to grow. At the end of 2017, there will
be more than 400,000 ZEVs in California. If current growth rates continue, California could
reach its 1.5 million target by as early as 2021, four years ahead of the current timeline.
California is home to several world-class research facilities that contribute to its status as a leader
on electric vehicles and mobility research. Combined with California’s ambitious climate targets,
its status has contributed to an environment that produces real results in transportation innovation and is responsible for more than 10,000 manufacturing jobs.73 There are several
transportation research centers throughout the State, including the METRANS Transportation
Center in Los Angeles; the University of California Institutes of Transportation Studies, with
members from across six UC campuses; and the Stanford Center for Automotive Research.
Thirteen automakers and major suppliers have research and innovation labs in Silicon Valley,
including Toyota, Daimler, and SAIC, China’s largest automaker. Increasingly major technology
companies such as Lyft, Uber, Google, and Apple are getting involved with vehicle development.
Policy leadership to promote investment in the market is crucial to keep California’s automotive
industry and related research, manufacturing, and development jobs competitive in the global
marketplace.
The global momentum on EVs has prompted other countries to set new targets that surpass
California’s existing targets, and this has begun to shift innovation centers accordingly. Last year,
China registered more new ZEVs than have been registered in all of California to date. China’s
2025 target for EV sales is 7 million new vehicles, equivalent to the total U.S. new car sales in 2016.74 In terms of market share, Norway leads the world in ZEV market share at 29 percent,
whereas the United States and China are still at about 1-2 percent.75 In addition, the Netherlands
72 2016 ZEV Action Plan. 2016. Office of Governor Edmund G. Brown Jr. https://www.gov.ca.gov/docs/2016_ZEV_Action_Plan.pdf.
73 Bureau of Labor Statistics, Table of “Employment in Selected States,” Automotive Industry: Employment, Earnings, and Hours, U.S. Department of Labor, https://www.bls.gov/iag/tgs/iagauto.htm.
74 “China Targets 35 Million Vehicle Sales by 2025, NEVs to Make Up One-Fifth,” Reuters, April 25, 2017, http://www.reuters.com/article/us-china-autos-electric-idUSKBN17R086.
75 Cazzola, Pierpaolo and Marine Gorner, Global EV Outlook 2017, International Energy Agency (2017), https://www.iea.org/publications/freepublications/publication/GlobalEVOutlook2017.pdf.

32
and Norway have committed to ending sale of combustion engine vehicles by 2025. India and
Germany follow in 2030, and France and the United Kingdom have committed to the same by
2040. With regard to global automakers, in June 2017 Volvo was the first to announce it will sell
only vehicles with electric motors by 2019. Global partnerships among BMW, Daimler,
Volkswagen, and Chinese manufacturers to produce EVs have been announced, responding to the rapidly expanding Chinese market demand for this new technology.76
California has the unique resources to maintain a global leadership role in the electric vehicle
space due to its status as a technology innovation capital and rich natural resources. Nevada,
Wyoming, and California possess large, undeveloped volumes of lithium, one of the key
components in battery manufacturing. The United States is estimated to have 5.5 million tons of
lithium reserves, with as much as 14 percent estimated to be recoverable in the Salton Sea in
Southern California. Alongside the engine technology transformation is the issue of vehicle
automation. Automakers have relied on Silicon Valley’s expertise to drive research in this area,
and many project that automation could become mainstream on a parallel timeline to vehicle
electrification. Combining this software-driven technology with the battery manufacturing
capacity emerging in the United States and California’s port access, California can play an integral
part in meeting global smart EV demand going forward.
76 Madrigal, Alexis C. “All the Promises Automakers Have Made About the Future of Cars,” The Atlantic, July 7, 2017, https://www.theatlantic.com/technology/archive/2017/07/all-the-promises-automakers-have-made-about-the-future-of-cars/532806/.

33
CHAPTER 7: Impacts to Disadvantaged Communities
Significant market transformation of EVs will affect disadvantaged communities. In this report,
disadvantaged communities are defined by the California Environmental Protection Agency
(CalEPA) using the criteria of Senate Bill 535 (De León, Chapter 830 , Statutes of 2012) and based on a combination of pollution and population indicators in the CalEnviroScreen mapping tool.77
CalEPA identifies the top 25 percent scoring areas (census tracts) in California as disadvantaged
communities. These communities often lack access to safe and reliable public transportation or
require a long commute to work. Further, they spend a larger portion of their income on
transportation and face a larger air pollution burden. Clean vehicles offer several benefits to these
communities but need to be strategically implemented to avoid negative consequences.
The barriers to transportation for low-income communities are larger than can be fully captured
in this report, and needs for different disadvantaged communities can vary widely. Senate Bill 350
(De León, Chapter 547, Statutes of 2015) requires the further investigation of low-income
customer barriers to zero-emission and near-zero emission vehicles. These barriers, along with
recommendations, are being studied by the CARB in consultation of the Energy Commission and will be released in a final report at the end of 2017.78
Need for Improved Transit Mechanisms The average household spends 19 percent of its annual income on transportation, whereas lower-income families spend 39 percent.79 Further, low-income families often drive among the highest-
polluting and least-efficient vehicles with 23.9 MPG compared to the 27 MPG vehicles of their high-income counterparts.80
Despite increased travel expenditures, shared transportation is not a viable option for several disadvantaged communities because of access, reliability, and transit behavior.81 Even as transit
opportunities are developed, housing costs tend to increase in transit neighborhoods, thereby displacing low-income households.82 The geography of poverty is changing,83 and because
77 California Environmental Protection Agency. 2017. Designation Of Disadvantaged Communities Pursuant to Senate Bill 535 (De León). Sacramento.
78 California Air Resources Board. 2017. Draft Guidance Document: Low-Income Barriers Study, Part B: Overcoming Barriers to Clean Transportation Access for Low-Income Residents. Sacramento.
79 California Department of Transportation. 2006. California Transportation Plan 2025. Sacramento.
80 Mineta Transportation Institute. 2015. Household Income and Vehicle Fuel Economy in California. San Jose.
81 California Air Resources Board. 2017. Draft Guidance Document: Low-Income Barriers Study, Part B: Overcoming Barriers to Clean Transportation Access for Low-Income Residents. Sacramento.
82 Chapple, Karen. 2017. Developing a New Methodology for Analyzing Potential Displacement; ARB Agreement No. 13-310. University of California Berkeley and Los Angeles. https://www.arb.ca.gov/research/apr/past/13-310.pdf.

34
gentrification pushes disadvantaged communities out of workplace hubs, they often have to commute farther to jobs, especially in metropolitan areas.84 Rural and small communities
categorized as disadvantaged also face significant access issues because of their geographic
spread. Unlike in more densely populated regions of the Bay Area or Los Angeles, the primary method of transportation for San Joaquin Valley residents is personal vehicles.85 Ride-sharing
services also do not present a viable option because of longer wait times, more frequent cancellations for people of color,86 and lack of shared vehicle drivers, access to technology, or
prohibitively expensive costs.87 Further, individuals in poverty often have unique transit behavior
patterns to get to work and take three times as many trips as their higher-income counterparts.88
83 Federal Highway Administration: National Household Travel Survey 2009. 2014. FHWA NHTS BRIEF: Mobility Challenges For Households In Poverty.
84 Ibid.
85 San Joaquin Valley Air Pollution Control District. 2014. San Joaquin Valley Plug-In Electric Vehicle Readiness Plan.
86 Cohen, Stuart, and Sahar Shirazi. 2017. Can We Advance Social Equity With Shared, Autonomous and Electric Vehicles?. UC Davis Institute of Transportation Studies.
87 Huron, a rural city with high air pollution, was highlighted in CARB’s Barriers report and relies on costly informal ride sharing.
88 Federal Highway Administration: National Household Travel Survey 2009. 2014. FHWA NHTS BRIEF: Mobility Challenges For Households In Poverty.

35
Figure 15: Geographic Demographics of Transit Access and Household Income
(a) Housing + Transportation index89
map of transit access scores, which evaluates fixed route public
transportation connectivity, access to land area and jobs, frequency of service, and median household income in
California. A low transit score indicates lack of access.
(b) Compares transit access, a holistic public transit access score defined by the H&T, with median household
income. According to the map, communities in rural areas or with lower income backgrounds have among the
lowest transit access scores. This data indicates the continuing fit of personal vehicular travel to disadvantaged
communities’ transit. Therefore, enabling access to clean personal vehicles would not only meet the transit needs
of this population but also offer them significant health benefits presented in the next section.
Health Effects of EV Adoption Transportation electrification offers significant health benefits to disadvantaged communities
specifically. Vehicle emissions are large contributors to air and ozone pollution, as discussed in
Chapter 3. Further, disadvantaged communities often live near major transit corridors (Figure
16a). Figures 16b-e illustrate the disproportionately large air pollution health burden
disadvantaged communities face compared to nondisadvantaged communities. Compared to 18
percent and 23 percent of non-SB 535 communities in the highest air pollution and ozone
pollution percentiles respectively, 69 percent and 36 percent of SB 535 communities are in these
high pollution levels, indicating an uneven pollution burden. Improving vehicle emissions
through EVs would enable several pollution-burdened communities to live and breathe in less
polluted areas. Further, because the definition of SB 535 factors in pollution burden, improving
89 "The H+T Affordability Index". 2015. http://htaindex.cnt.org/.
(a) Transit Access Score (b) Median Household Income

36
air quality in these communities would potentially enable them to no longer be classified as
disadvantaged or at least have several improvements in quality of life.
Figure 16: Location of SB 535 Communities Relative to Air Pollution and Major Transportation Corridors
The map overlays primary transit corridors in California (red lines) with SB 535 communities (red shading). The
term “air pollution” in this chart specifically refers high levels of PM 2.5.
Source: Left -California Energy Commission, Right –Author analysis.
Expanding Access of EVs Enabling access to EVs is a key step in making the transition to clean electrification equitable and
decreasing the disproportionate health burdens disadvantaged communities face. Some of the
benefits mentioned here apply more broadly to megacommuters as a whole.
Additional mechanisms to drive equitable access to EVs are needed. A report on the secondary EV
market suggests that a secondary EV market may displace less efficient combustion vehicles and encourage greater EV adoption in low-income households.90 In addition, in CARB’s Enhanced
Fleet Modernization Program, 14.5 percent of the total vehicles replaced were EVs,91 and in the
Clean Vehicle Rebate Program, 55.3 percent, or 7,325, of the rebates issued for disadvantaged communities were for EVs.92 Participation in these programs indicates that low-income
customers also hope to be involved the clean transportation transition.
90 Tal, Gil, Michael Nicholas, and Thomas Turrentine. 2017. First Look At The Plug-In Vehicle Secondary Market. Davis: UC Davis Institute of Transportation Studies.
91 California Air Resources Board. 2017. "Enhanced Fleet Modernization Program | California Air Resources Board." Arb.Ca.Gov. https://www.arb.ca.gov/msprog/aqip/efmp/efmp.htm.
92 "CVRP Rebate Statistics". 2017. Clean Vehicle Rebate Project. https://cleanvehiclerebate.org/eng/rebate-statistics.

37
CHAPTER 8: Impacts to Resource and Waste Stream
This chapter analyzes the impact that 5 million BEVs would have on the resource stream of the
key materials used in vehicle batteries. Moreover, it examines the recycling potential of these
batteries to minimize the effect on the materials waste stream.
Recycling, Reusing, and the Impact on Waste Stream As outlined in a study by Arthur D. Little on the toxicity of EVs, replacing lithium-ion batteries
without recycling processes might increase manufacturing emissions and make EVs more toxic to human beings than the internal combustion engine (ICE) counterparts.93 However, if effective
recycling is mandated by the State to reduce wasteful supply practices, EVs could result in the
GHG emission reduction and health benefits outlined in Chapters 3, 4, and 7. Moreover, recycling
present benefits for manufacturers, who could get lower prices for their raw materials in the face
of supply fluctuations and price volatility.
According to the Union of Concerned Scientist’s (UCS) report Cleaner Cars From Cradle to
Grave, there is a market gap in California for businesses that focus on energy recycling, presenting opportunities for investments in California’s economy.94 There are only two major
companies that provide lithium-ion battery recycling services: Umicore (Belgium) and Retriev
Technologies (United States and Canada).
UCS concluded that if recycling would be mandated in State, energy consumption from battery manufacturing could be reduced by 10 percent to 17 percent.95 Furthermore, it states that
switching from the use of virgin to recycled materials would result in a net decrease of 15 percent to 20 percent in greenhouse gas emissions.96 Moreover, a study performed by the Argonne
National Laboratory concluded that the using any of the three main battery recycling methods results in significant oxides of sulfur (SOx) emission reductions: pyrometallurgical,
hydrometallurgical, and direct recycling result in almost 70 percent, 88 percent, and 92 percent reductions in SOx emissions, respectively.97
93 Brennan, John, and Timothy Barder, Battery Electric Vehicles vs. Internal Combustion Engine Vehicles. 2016. Arthur D. Little. http://www.adlittle.us/uploads/tx_extthoughtleadership/ADL_BEVs_vs_ICEVs_FINAL_November_292016.pdf.
94 Nealer, Rachael, David Reichmuth, and Don Anair. Cleaner Cars from Cradle to Grave. November 2015. Union of Concerned Scientist. http://www.ucsusa.org/sites/default/files/attach/2015/11/Cleaner-Cars-from-Cradle-to-Grave-full-report.pdf .
95 Ibid (Appendix C).
96 Ibid.
97 Gaines, Linda, and Jennifer Dunn. “Lithium-Ion Battery Production and Recycling Materials Issues.” June 2015. Argonne National Laboratory. https://energy.gov/sites/prod/files/2015/06/f23/es229_gaines_2015_o.pdf.

38
Apart from recycling, reusing the batteries from EVs could present opportunities for utilities in
terms of energy storage. According to the UCS report, “The lithium-ion battery at the end of the vehicle application is assumed to have 75% of its original capacity to store energy.”98 Therefore,
reused EV batteries could provide storage for intermittent renewable generation, and this “second
life for BEV batteries on the grid […] could offset fossil fuel–related global warming emissions by displacing coal- or natural gas– based electricity generation.”99
Adapting a global EV penetration model from the Minerals journal to California, it was found that
nearly 300,000 vehicles manufactured after 2016 would have reached the end of life by 2030.
Assuming that these vehicles have 60 kWh batteries and that the batteries have 75 percent of the
original storage capacity when the cars retire, the retired fleet would be equivalent to a 13,000
MWh energy storage resource for California.
According to the Journal of Industrial Engineering and Management, lithium-ion batteries
present better opportunities in remanufacturing and repurposing than in recycling. The findings
indicate that remanufacturing (or refurbishing) saves roughly 40 percent in costs over a new
battery, which could make EVs even more affordable. Furthermore, researchers found that
repurposing is economically feasible if the “research and development costs are less than $82.65 per kWh.”100
Finally, research indicates that, given the increased costs associated with recycling, making
component separation easier by having manufacturers label battery components “by means of bar
codes, RFID chips, or delegated paint color or type (for example, visible under black light)” could improve the process.101 Furthermore, the authors of an article published in the Sustainable
Materials and Technologies journal suggest incorporating “incentives for good recycling practices, and penalties for bad ones.”102 In their opinion, the goal of the policy and legislation
should be to ensure that batteries are designed with sustainability in mind, having industry standards that allow them to be reused and recycled to produce high-quality products.103
98 Idem Cleaner Cars from Cradle to Grave. page 20.
99 Ibid.
100 Foster, Meaghan, Paul Isley, Charles Standridge, and Mehedi Hasan,. “Feasibility Assessment of Remanufacturing, Repurposing, and Recycling of End of Vehicle Application Lithium-Ion Batteries.” September 2013. Journal of Industrial Engineering and Management. Page 699. http://www.jiem.org/index.php/jiem/article/view/939/608.
101 Gaines, Linda. The Future of Automotive Lithium-Ion Battery Recycling: Charting a Sustainable Course. October 2014. Argonne National Laboratory. http://ac.els-cdn.com/S2214993714000037/1-s2.0-S2214993714000037-main.pdf?_tid=5df3fae4-77d7-11e7-bef7-00000aab0f6b&acdnat=1501715435_657e7c4e52a7e8fd1d598b55f6e35043
102 Ibid.
103 Idem.

39
Supply of Battery Materials
Cobalt
Rather than lithium, cobalt appears to be the weak link in the supply chain for battery
manufacturing. While only a third of lithium production is destined to battery manufacturing, around half of cobalt production is destined to the battery sector.104 Although this is more the
case for the lithium cobalt oxide (LCO) batteries used in portable electronics—for which cobalt
accounts for more than half the battery weight—it is also the case for the lithium nickel cobalt
aluminum oxide (NCA) batteries used in Tesla’s Model S, which are 80 percent nickel and 15 percent cobalt.105,106 In general, EV batteries require around 15-20 kg of cobalt each, and even
Tesla’s Chief Technology Officer JB Straubel claims to be more worried about cobalt than lithium, given the rarity of the former.107,108
Furthermore, according to an article published in Benchmark Minerals, 75 percent of batteries will contain some form of cobalt by 2020.109
There are two major problems with the dependency on cobalt for battery manufacturing. The first
is that most of the cobalt used in lithium-ion batteries is sourced from “poorly regulated and heavily polluted mines in [the Democratic Republic of] Congo (DRC).” 110 According to Macquarie
Research, these mines rely on child labor and present geopolitical risks associated with an upcoming transfer of presidential power, “a process which has not gone smoothly over history.”111
104 “Commodities Comment: The 2017 Battery Metal Story Might Well Be Cobalt.” February 2017. Macquarie Research. http://www.metalicity.com.au/sites/metalicity.com.au/files/files/MacquarieCommoditiesComment%20Feb%202017.pdf.
105 Lambert, Fred. “Breakdown of Raw Materials in Tesla’s Batteries and Possible Bottlenecks.” November 2016. Electrek. https://electrek.co/2016/11/01/breakdown-raw-materials-tesla-batteries-possible-bottleneck/
106 “Battery Raw Materials.” March 2015. Benchmark Minerals. Page 58. http://benchmarkminerals.com/benchmark-issue-1.pdf.
107 Lambert, Fred. “How to Invest in the Resource Boom That Tesla Gigafactory and Electric Vehicles Are Creating.” February 2017. Electrek. https://electrek.co/2017/02/21/how-to-invest-resource-tesla-gigafactory-battery-electric-vehicles/
108 Stinger, David. “Race Is on to Mine Metal Powering Electric Vehicles.” June 2017. Bloomberg. https://www.bloomberg.com/news/articles/2017-06-08/cobalt-upstarts-eye-glencore-s-turf-for-244-billion-ev-spoils
109 Desjardins, Jeff. “The Future of Battery Technology.” February 2017. Nevada Energy Metals, eCobalt, Great Lakes Graphite. http://www.visualcapitalist.com/future-battery-technology/
110 Idem Battery Electric Vehicles vs. Internal Combustion Engine Vehicles
111 Ibid.

40
Figure 17: 2016 Cobalt Production (Kilotons)
Source: ”Mineral Commodity Summaries,” January 2017, U.S. Geological Survey.
https://minerals.usgs.gov/minerals/pubs/commodity/cobalt/mcs-2017-cobal.pdf
Thus, the challenge is to extract reserves from less volatile places than the DRC. Currently, the
situation is not optimistic. According to the United States Geological Survey (USGS), while 4
percent of the world’s cobalt supply is produced in the United States and Canada, just half a
million units of Tesla’s Model 3 would be equivalent to 7,800 tons of cobalt (out of 124,000 worldwide), equivalent to 6 percent of the annual cobalt mining output worldwide.112 However,
given that battery manufacturers will most likely feel uncomfortable relying on such a volatile
supplier, it is likely that either cobalt extraction and refining markets will grow in more stable
countries (like Australia or Canada) or EV manufacturers will switch to other lithium-ion battery technologies, such as lithium manganese oxide, LMO).113
Figure 18: Cobalt Reserves (Kilotons)
Source: ”Mineral Commodity Summaries,” January 2017, U.S. Geological Survey.
https://minerals.usgs.gov/minerals/pubs/commodity/cobalt/mcs-2017-cobal.pdf
112 Idem. 113 Idem.

41
The second problem with cobalt is that the associated “demand growth is expected to outpace [its] supply growth […], setting the stage for persistent material shortages and far higher prices.”114
According to the Cobalt Development Institute, this stems from the fact that, while 94 percent of
the global cobalt supply comes as a by-product of nickel and copper extractions, only 6 percent of
the supply comes from mines that can directly increase production in the face of growing demand.115 Moreover, as noted by Macquarie Research, while cobalt demand has been steadily
increasing, the supply from DRC mines has remained stagnant.
Figure 19: Cobalt Demand From Batteries vs. DRC Cobalt Mine Output
Source: ICSG, Macquarie Research. Figures are for refined cobalt market.
http://www.metalicity.com.au/sites/metalicity.com.au/files/files/MacquarieCommoditiesComment%20Feb%202017.
If the current trend continues, the market for refined cobalt might experience a growing deficit in
the near future. According to Macquarie Research, political volatility in the DRC coupled with a
rising demand for EVs in China and the United States will lead to a four-year-long cobalt shortage.116 This shortage, in turn, could impact EV prices by increasing the lithium-ion battery
costs. Figure 20 illustrates the current outlook of the cobalt market.
114 Peterson, John. “Cobalt: The Weak Link in Tesla’s Supply Chain.” Seeking Alpha. April 2017. https://seekingalpha.com/article/4061069-cobalt-weak-link-teslas-supply-chain.
115 Peterson, John. “Tesla’s Evolving Cobalt Nightmare.” November 2016. https://seekingalpha.com/article/4027400-teslas-evolving-cobalt-nightmare.
116 West, Carl. “Carmaker’s Electric Dreams Depend on Supplies of Rare Minerals.” July 2017. The Guardian. https://www.theguardian.com/environment/2017/jul/29/electric-cars-battery-manufacturing-cobalt-mining.
Cobalt Demand from Batteries Cobalt Mine Output in the DRC
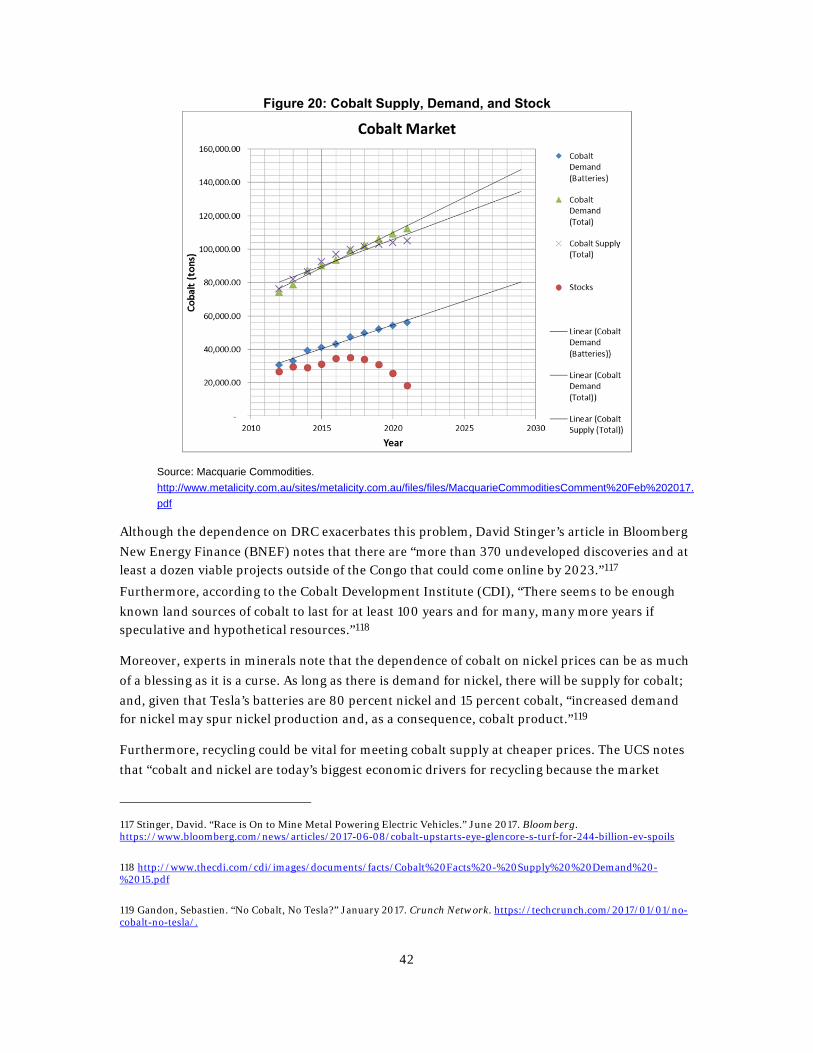
42
Figure 20: Cobalt Supply, Demand, and Stock
Source: Macquarie Commodities.
http://www.metalicity.com.au/sites/metalicity.com.au/files/files/MacquarieCommoditiesComment%20Feb%202017.
Although the dependence on DRC exacerbates this problem, David Stinger’s article in Bloomberg
New Energy Finance (BNEF) notes that there are “more than 370 undeveloped discoveries and at least a dozen viable projects outside of the Congo that could come online by 2023.”117
Furthermore, according to the Cobalt Development Institute (CDI), “There seems to be enough
known land sources of cobalt to last for at least 100 years and for many, many more years if speculative and hypothetical resources.”118
Moreover, experts in minerals note that the dependence of cobalt on nickel prices can be as much
of a blessing as it is a curse. As long as there is demand for nickel, there will be supply for cobalt;
and, given that Tesla’s batteries are 80 percent nickel and 15 percent cobalt, “increased demand for nickel may spur nickel production and, as a consequence, cobalt product.”119
Furthermore, recycling could be vital for meeting cobalt supply at cheaper prices. The UCS notes
that “cobalt and nickel are today’s biggest economic drivers for recycling because the market
117 Stinger, David. “Race is On to Mine Metal Powering Electric Vehicles.” June 2017. Bloomberg. https://www.bloomberg.com/news/articles/2017-06-08/cobalt-upstarts-eye-glencore-s-turf-for-244-billion-ev-spoils
118 http://www.thecdi.com/cdi/images/documents/facts/Cobalt%20Facts%20-%20Supply%20%20Demand%20-%2015.pdf
119 Gandon, Sebastien. “No Cobalt, No Tesla?” January 2017. Crunch Network. https://techcrunch.com/2017/01/01/no-cobalt-no-tesla/.

43
prices of these metals are relatively high; recycling them not only reduces cost but decreases the amounts of virgin materials extract.”120 Furthermore, according to the CDI, cobalt is fully
recyclable given that, for most of the related applications, the metal is used but not consumed.121
If anything, all these challenges highlight the importance of having effective legislation and
regulatory frameworks that track batteries through all stages of production, ensuring that EVs can
deliver net positive results both in California and the world. Certainly, the cobalt challenge
presents great opportunity for North American markets to invest in cobalt extraction, refining,
and recycling.
Canada and the United States combined hold 291 kilotons of cobalt in reserves. If the authors
assume that EVs have NCA batteries with 15 kg of cobalt, on average, then the penetration of 5
million EVs will result in a cumulative demand of 72,000 tons of cobalt through the next 10 years.
On average, the EV penetration would require around 7.2 kilotons of cobalt production per year
for the next 10 years. When considered next to the current regional output of 8 kilotons per year,
this allows the opportunity to grow the market by 90 percent.
Figure 21: North American Cobalt Production and Demand
Source: Authors’ analysis of cobalt demand for 5 million EVs.
While cobalt could be a limitation in battery manufacturing, the DOE recently awarded research
and development grants as part of its “Battery500” initiative, to investigate new novel materials
and production methods for cathodes. These include composite materials using graphene, sulfur, carbon, and iron.122 If this research is successful in increasing energy density and reducing cost,
innovation can alleviate materials constraints and further reduce barriers to electrification.
120 Idem (page 20).
121 Idem “No Cobalt, No Tesla?” 122 U.S. Department of Energy FY 2017 Vehicle Technologies Program-Wide Funding Opportunity Announcement Selections. https://energy.gov/sites/prod/files/2017/07/f35/FY17_DE-FOA-0001629_VTO_Program_Wide.pdf.

44
Global Lithium
Lithium supply presents less of a challenge when compared to cobalt. According to UCS, although
there were early signs that lithium demand would exceed supply, more recent studies “have
quantified that supply and concluded there is enough lithium for large increases in BEV manufacturing.”123 Not only are the global lithium reserves enough to support the predicted
growth in the BEV market, current predictions estimate that the increase in lithium supply will drive down costs and alleviate the “tension associated with the current scramble for lithium.”124
Figure 22: Geographic Distribution of Global Lithium Resources
Source: http://www.albany.edu/gp/files/Narins_2017_EXIS_The_battery_business.pdf.
123 http://www.ucsusa.org/sites/default/files/attach/2015/11/Cleaner-Cars-from-Cradle-to-Grave-full-report.pdf (Page 20).
124 http://www.albany.edu/gp/files/Narins_2017_EXIS_The_battery_business.pdf (Page 325).

45
California Lithium
Just like with global supply, there are enough lithium reserves in California—let alone in the
American West—to sustain the growth of EVs to 5 million by 2025.
Figure 23: Western U.S. Sites With Lithium Reserves
Source: Idem
To compute the results for this section, this study adapted a global EV penetration model used in
Minerals’ “Lithium Resource and Productions: Critical Assessment and Global Projections” to
California. In turn, the model predicts that to reach 5 million EVs in California, demand for
lithium will be, on average, 43 kilotons for the next 10 years. Per year, this represents an average
of 4.3 kilotons of lithium demand. This number takes into account EVs that are already on the
road, as well as those that will need to be replaced.
This level of demand is low enough that California can meet it using in-state supply. According to
a study performed by the Idaho National Laboratory, California possesses 20 kilotons of yearly
recoverable lithium. In the Salton Sea alone, there are around 800 kilotons of lithium reserves
and 19 kilotons that are recoverable per year. Even if only 30 percent of that yearly extraction
would go to battery manufacturing—as is the case in the global lithium market—California still
has enough reserves to sustain the 43-kiloton increase in demand for the next 10 years.
Furthermore, the amount of lithium that would be extracted solely for EVs represents a market
value of $1.5 billion and a resource depletion of only 5.4 percent.
46
CHAPTER 9: Impacts to Fuel Independence and Security
Distributed Energy Supply Is More Resilient Than Oil Supply Much of California’s energy history has been shaped by the reaction to the 1973 OPEC oil
embargo, the ensuing emphasis on nuclear fuel, and the shift in the power sector away from coal
to natural gas and renewables. Given the current demand for gasoline, which is the largest
remaining sector in California that relies on foreign oil imports, electrification of vehicle fleets
presents a direct opportunity to take advantage of domestically sourced fuel in the form of
renewable electricity. (The fuel system for vehicles was briefly covered in the context of well-to-
wheel supply chains in Chapter 5.) This diversification will reduce the state’s exposure to volatile
oil prices that are outside the state’s control and have the added benefit of being available locally.
The distributed generation of electricity, which increasingly has a larger share of renewable
energy in California, creates supply security. Take the current model for producing gasoline for
cars: Oil is produced in very few locations around the world or in the State, which is then shipped
to a small number of refineries, located mostly on the coast, then distributed via pipeline and
trucks to retail gas stations throughout the State. In stark contrast, EVs can be powered directly
from solar panels that can be constructed nearly anywhere, completely eliminating the supply
points that affect millions of drivers when they are interrupted. As of 2016, nearly 19 GW of
distributed energy resources have been installed in California, powering 4.89 million homes.
California can take advantage of this distributed supply and avoid industrial failures like the one
that occurred in 2015 when an explosion at the ExxonMobil refinery in Southern California shut
down production there, pushing California gas prices to nearly 80 cents higher than the national
average.
The capabilities of EVs to store and discharge energy can also reduce threats to the state’s natural
gas supply. In May 2017, 800 MW of electricity was needed to ensure the smooth functioning of
the California grid. This otherwise rare event – the first in a decade – was caused by a shortage of
natural gas supply due to the disaster at Aliso Canyon, a natural gas storage facility shutdown by
significant leakage. Without that gas supply, a Southern California gas-fired power plant was not fully operational, and imports from other plants could not meet the gap in demand.125 Just
122,000 EVs could have served that demand at 7-9 p.m., a time when many people are at home
and off the road.
125 Mullin, Robert. “CAISO Recounts Tense Hours Leading to May 3 Emergency.” May 2016. RTO Insider. https://www.rtoinsider.com/caiso-stage-1-emergency-43153/.

47
Electric Vehicles Can Supply Energy During Emergencies The benefits of vehicle-to-grid (V2G) services were explored in Chapter 2, discussing the everyday
use of connected EVs for the grid. In addition, California is at high risk for low-probability events
that may cause substantial disruption to the state’s economy and put millions of lives at risk.
Investment in electric vehicles alongside investment in next-generation inverter technology will
create unprecedented resiliency of the state’s energy system in the event of large-scale disasters.
Today, small weather events can down trees, causing neighborhood and sometimes citywide
power outages. Storage, in the form of electric vehicles, paired with distributed energy resources,
allows more Californians to access electricity during these grid outages. After the 2011 earthquake
and tsunami in Japan, EV owners were able to use their car batteries to power critical electronic devices.126 With full use of the battery that is possible with advanced bidirectional inverters, a 60
kWh battery in a vehicle could power an American home for up to two days without being
recharged from a solar panel. With a typical home solar system on the roof, the battery could be
used to fully power the home for at least three days before needing to reduce home energy consumption to be self-sufficient.127 Auto manufacturers Nissan, Mitsubishi, Toyota, Hyundai,
and the PSA Groupe have implemented V2G technology in various models already, and research
in this area continues to develop more reliable and economical solutions for V2G integration at a
consumer level.
Electric Vehicles Bolster National Security Plans A major variable in national security is oil supply and price volatility, as mentioned earlier in this
report. The U.S. government has placed an emphasis on reducing its exposure to these volatilities
through several measures. The U.S. Department of Energy operates the Clean Cities initiative to
help reduce the reliance of cities on petroleum products, and 12 cities, including Bakersfield, San
Luis Obispo, Long Beach, Oakland, Sacramento, San Francisco, San Jose, and Los Angeles,
participate in this program. The U.S. Department of Defense (DOD) has carried out pilot tests to determine the efficacy of using EVs as grid backup at four locations across the United States.128 In
California, one of those locations was the Los Angeles Air Force Base, which replaced its entire
nontactical fleet with EVs to provide frequency regulation services to the California ISO energy market and to reduce demand charges.129
126 http://www.nytimes.com/2011/05/08/automobiles/08JAPAN.html.
127 Analysis using 29.6 kWh/d of home energy consumption (EIA) and 17.2 kWh/d of generation from a 4 kW system in Palo Alto, California, according to NREL’s PV Watts tool.
128 Ingram, Antony. “Electric Cars Used as Emergency Power: DoD Begins Tests.” January 2013. Green Car Reports. http://www.greencarreports.com/news/1081901_electric-cars-used-as-emergency-power-dod-begins-tests.
129 “Electric Vehicles and Emergency Response.” June 2016. Initiative for Resiliency in Energy Through Vehicles NASEO Study. http://naseo.org/data/sites/1/documents/publications/iREV%20EV%20Case%20Study.pdf.

48
In addition to the backup grid services that EVs provide, the effect of EVs on the overall oil and
refining supply chain deserves additional research. In previous sections, it was proposed that the
reduction of demand for gasoline would affect the fuels market. The potential reduction of
demand for gasoline could imply an opportunity for the use of California refinery capacity to
produce distillates needed for military use. Additional access to supply of these distillates
provides defense systems access to less expensive fuels, the cost of which make up a significant portion of the risk to military budgets.130
130 Alexander, David. “Amidst Drop in Oil Prices, U.S. Navy Deploys ‘Great Green Fleet.’” January 2016. Reuters. http://in.reuters.com/article/usa-defense-greenfleet-idINKCN0UY0AO.

A-1
APPENDIX A: Electric Vehicle Battery Characteristics
Appendix A examines the characteristics of lithium-ion batteries used and predicted to be used in
electric vehicles (EVs). More specifically, a cost forecast model is created that considers the range
and storage capacity of batteries in the EV market.
The U.S. Department of Energy (DOE) has a target of $125/kWh for electric batteries by 2022.
This appendix evaluates this target and other information to evaluate different battery cost
scenarios. To determine the price per kilowatt-hour of the lithium-ion batteries used in EVs, this
appendix examines forecasts of experts, researchers, and consulting firms.
McKinsey predicts that the price of lithium-ion batteries will be $200/kWh in 2020, $160/kWh in 2025, and below $100/kWh by 2030.131 Similarly, UBS expects the price to go down to
$200/kWh by 2020 and $100/kWh by 2025.132 In Figure A-1, the authors show the historical and
forecasted prices per kilowatt hour of lithium-ion batteries as estimated by these two firms.
131 D’Aprile, Paolo, John Newman, and Dickon Pinner. “The New Economics of Energy Storage.” August 2016. McKinsey & Company. http://www.mckinsey.com/business-functions/sustainability-and-resource-productivity/our-insights/the-new-economics-of-energy-storage.
132 “Will Solar, Batteries, and Electric Cars Re-shape the Electricity System?” August 2014. UBS. http://www.qualenergia.it/sites/default/files/articolo-doc/ues45625.pdf.

A-2
Figure A-1: Historical and Forecasted Price per Kilowatt-Hour of Lithium-Ion Batteries, Estimated by McKinsey and UBS.
Source: McKinsey and UBS predictions represented graphically.
Moreover, Bloomberg’s forecast agrees with what is predicted by McKinsey and UBS. Figure A-2
shows Bloomberg’s estimates and forecast for the price per kilowatt-hour of lithium-ion batteries.
R²=0.8618
R²=0.9842
0
200
400
600
800
1000
1200
2005 2010 2015 2020 2025 2030 2035
Price($/kWh)
Year
McKinsey
UBS

A-3
Figure A-2: Historical and Forecasted Cost per Kilowatt-Hour of Lithium-Ion Batteries, Estimated by Bloomberg
Source: Bloomberg. “Here’s How Electric Cars Will Cause the Next Oil Crisis.”
https://www.bloomberg.com/features/2016-ev-oil-crisis/
Within the realm of research, the work of Dr. Björn Nykvist and Dr. Måns Nilsson at the
Stockholm Environmental Institute (SEI) gathers data from industry, market leaders, and
scientific journals to give a comprehensive forecast of the trend in battery prices, as seen in Figure
A-3.

A-4
Figure A-3: Historical and Forecasted Price per Kilowatt-Hour of Lithium-Ion Batteries, Estimated by Researchers at the SEI
Source: “Rapidly Falling Costs of Battery Pack for Electric Vehicles.” Nature Climate Change. 133
From Figure A-3, it is evident that the estimates and predictions made by market leaders do not
tend to agree with those made by consulting firms. For instance, Tesla argues that prices for its lithium ion batteries are at $190/kWh, and it expects this price to drop to $100/kWh by 2020.134
Trends in component cost of their components are the key to better understanding the trends in
cost of lithium-ion batteries. Figure A-4, produced by UBS, characterizes these trends.
133 Nykvist, B. and M. Nilsson. “Rapidly Falling Costs of Battery Packs for Electric Vehicles.” March 2015. Nature Climate Change. DOI: 10.1038/NCLIMATE2564.
134 Lambert, Fred. “Electric Vehicle Battery Cost Dropped 80% in 6 Years Down to $227/kWh – Tesla Claims to Be Below $190/kWh.” January 2017. Electrek. https://electrek.co/2017/01/30/electric-vehicle-battery-cost-dropped-80-6-years-227kwh-tesla-190kwh/.
Pri
c
e ($/k
Wh
)
Year

A-5
Figure A-4: Historical and Forecasted Price per Kilowatt-Hour of the Components of Lithium-Ion Batteries, Estimated by UBS
Source: UBS
Forecasting the cost of lithium-ion batteries is important to determine the extent to which EVs
can penetrate the automobile market. The cost of lithium-ion batteries alone, however, does not
suffice to determine the success of EVs in the market. Figure A-5, produced by UBS, shows the
frontiers and conditions that would benefit different vehicles, taking into account not only the
cost per kilowatt-hour of lithium-ion batteries, but the price of a gallon of oil. It also conveys the
importance of the price of batteries in determining the market penetration of EVs. A cross
indicates the market situation as of 6/29, considering Tesla’s nearly $200/kWh lithium-ion
battery cost and taking around $2.5/gallon as the price for oil.
Figure A-5: Competitive Scenarios Based on the Price of Gallon of Oil and the Cost of Lithium-Ion Batteries per Kilowatt-Hour, According to UBS
Source: UBS, http://www.qualenergia.it/sites/default/files/articolo-doc/ues45625.pdf. Page 17
The storage capacity of the batteries used in EVs is important to market transformation as well,
determining vehicle range. The specifications of the electric vehicles that are available in the

A-6
market are characterized in Figure A-6, using data collected by the Journal of the Electrochemical
Society in 2017.
Table A-1: Commercially Available Electric Vehicles and Specifications Manufacturer Model Battery Size
(kWh) Battery
Chemistry Battery Supplier
Vehicle Range (mi)
Tesla S 60-100 C/NCA Panasonic/Tesla 208-315 Tesla X 60-100 C/NCA Panasonic/Tesla 208-315 BMW I3 22 ,33 C/NMC Samsung/Bosch 80, 114 Nissan Leaf 24 ,30 C/LMO
(C/NMC) AESC and LG
Chem. 84, 107
Volkswagen e-Golf 24, 35.8 C/NMC Panasonic (Sanyo div.)
83, 124
Chevrolet Spark 19 C/LFP A123 82 Fiat 500e 24 C/NMC Samsung/Bosch 87 Kia Soul EV 17 C/NMC SK Innovation 90
Smart Fortwo EV 17.6 C/NMC LG Chem. 68 Ford Focus EV 35.5 C/NMC LG Chem. 100
Mercedes B-Class Electric
28 C/NCA (C/NMC)
Panasonic/Tesla and SK
Innovation
85
Mitsubishi I 16 LTO/LMO Toshiba 62 Honda Fit EV 20 LTO/LMO Toshiba 82 Toyota RAV4 EV 41.8 C/NCA Panasonic/Tesla 113
Source: “The Development and Future of Lithium Ion Batteries.” Table II. Electrochemical Society
http://jes.ecsdl.org/content/164/1/A5019/T2.expansion.html
The data from Table A-1 are plotted in Figure A-6. The correlation between the storage size of
lithium-ion batteries and the associated driving range in miles is, as expected, very strong. The
required battery size for a desired range is, therefore, easily determinable from this linear
correlation and can be configured to match consumers’ driving range preferences.

A-7
Figure A-6: Correlation Between Battery Size in kWh and Driving Range in Miles
Source: Plotted data from Table A-1
By combining the forecasted cost per kWh of a battery, the relationship between size and range,
and consumer preferences, the cost of future electric vehicles can be estimated. This study
estimates the total EV cost by assuming that the cost of the lithium-ion battery accounts for less than a quarter of the cost of the EV, as explained by JB Straubel of Tesla. 135
The battery cost curve of this report is based on the historical data estimated by McKinsey. These
data are then combined with the trend in decreasing costs presented in the SEI research, which
estimates that the cost of lithium-ion batteries has been decreasing at a rate of 14 ± 6 percent annually.136 Thus, using the McKinsey values from 2010 to 2016, Figure A-7 presents three
possible annual cost decrease scenarios: 8 percent, 14 percent, and 20 percent.
135 Bullis, Kevin. “How Tesla Is Driving Electric Car Innovation.” August 2013. MIT Technology Review. https://www.technologyreview.com/s/516961/how-tesla-is-driving-electric-car-innovation/.
136 Nykvist, Bjorn, and Mans Nilsson. “Rapidly Falling Costs of Battery Packs for Electric Vehicles.” March 2015. Nature Climate Change. https://www.nature.com/nclimate/journal/v5/n4/pdf/nclimate2564.pdf.
y=3.0014x+12.362R²=0.9726
0
50
100
150
200
250
300
350
0 20 40 60 80 100 120
DrivingRange(miles)
BatterySize(kWh)

A-8
Figure A-7: Forecast of Lithium-Ion Battery Cost per Kilowatt-Hour
Source: Analysis of three price decay rates.
The 20 percent annual decrease rate scenario generates a highly optimistic, if not unrealistic, cost
of $10/kWh by 2030. On the other hand, the 8 percent annual decrease rate scenario is highly
conservative, given that Tesla claims that its battery prices will already be below $100/kWh by
2020. Therefore, the battery vehicle benefit report uses what appears to be a realistic scenario
with a 14 percent annual decrease rate. However, this scenario also predicts highly optimistic
costs for 2030, mainly because it assumes that the annual decreasing rate is constant. For this
reason, adjustments were made by halving the annual rate of decrease every five years, as seen in
Figure A-8.
y=2E+162e‐0.182x
1
10
100
1000
10000
2005 2010 2015 2020 2025 2030 2035
Price,$/kWh
Year
8%
14%
20%

A-9
Figure A-8: Forecast of Lithium-Ion Battery Cost, Halving Annual Cost Decrease Every Five Years
Source: Figure A-7 with adjustments to show diminishing cost reductions over time.
Once again, the 14 percent initial annual decrease rate scenario seems more realistic than the 8
percent and 20 percent scenarios. However, as previously discussed, lower costs are expected by
2020 than what is shown in Figure A-8. To understand this, it is important to consider that
consulting firms and energy agencies have historically overestimated battery costs in their
forecasts. For instance, in 2012, the U.S. Energy Information Administration (EIA) predicted a
cost of around $750/kWh (2010 U.S.) by 2014 for lithium-ion batteries; in 2013, the same agency projected the 2014 cost to be around $550/kWh (2010 U.S.).137 That is, the EIA decreased its
137 The Economics of Grid Defection. February 2014. Rocky Mountain Institute. https://www.rmi.org/wp-
content/uploads/2017/04/RMIGridDefectionFull_2014-05-1-1.pdf.
y=7E+124e‐0.14x
1
10
100
1000
2005 2010 2015 2020 2025 2030 2035
Price,$/kWh
Year
8%
14%
20%

A-10
estimate by 26.6 percent in just a year.138 Furthermore, if one considers the cost of a lithium-ion
battery in 2014 as estimated by UBS, the figure would be even lower: $360/kWh. In turn, this
means that the 2012 and 2013 figures overestimated the cost by 52 percent and 35 percent,
respectively.
If this trend of overestimation is accounted for when it comes to lithium-ion battery costs, a more
realistic cost curve can be used for analysis. This report focuses on the 14 percent initial annual
decrease rate where the rate is halved every five years to account for the fact that lithium-ion
technology would be approaching diminishing advancement with maturity. Finally, the forecasted
values are decreased by 15 percent to account for the historical errors in cost overestimation and
presented as the primary scenario evaluated in the report and shown as Figure A-9.
Figure A-9: Adjusted Forecasted Cost of Lithium-Ion Batteries, Halving the 14 Percent Annual Cost Decrease Every Five Years
Source: Author analysis and adjustments to Figure A.8
To produce yearly estimates of cost, a best-fit curve is created using the four predicted price
points in Figure A-9 (years 2016, 2020, 2025, and 2030).The results, and final battery cost curve
model are shown in Figure A-10.
138 Annual Energy Outlook 2012 With Projections to 2035. June 2012. U.S. Energy Information Administration. https://www.eia.gov/outlooks/aeo/pdf/0383(2012).pdf.
y=1.756412E+134e‐1.504641E‐01x
1
10
100
1000
2005 2010 2015 2020 2025 2030 2035
Price,$/kWh
Year

A-11
Figure A-10: Final Forecast of Cost of Lithium-Ion Batteries
Source: Table A-2
Using the resulting equation, the authors estimated the following cost per battery for the years
2018 onward and tabulated them in Table A-2.
y=3.955910E+80e‐8.946107E‐02x
1
10
100
1000
2014 2016 2018 2020 2022 2024 2026 2028 2030 2032
Price,$/kWh
Year

A-12
Table A-2: Tabulated Forecast of EV Lithium-Ion Battery Costs
Year Cost ($/kWh) 2016 186.51 2017 170.55 2018 155.96 2019 142.61 2020 130.41 2021 119.25 2022 109.04 2023 99.71 2024 91.18 2025 83.38 2026 76.24 2027 69.72 2028 63.75 2029 58.29 2030 53.31
Source: Author analysis
As a final remark, although lithium-ion batteries are assumed to remain the dominant battery
technology in the future, emerging technologies might decrease the cost of EV batteries even
further if commercially implemented. Two promising battery technologies that are not yet
commercially available are lithium-sulfur and lithium-air batteries. The main advantage of
lithium-air batteries lies in the high specific energy, which can result in lower costs due to lighter
batteries—and lighter EVs—that have the same storage capacity and driving range. Concerning
lithium-sulfur batteries, these have a much higher energy density than the lithium-ion
counterpart, which means they can result in smaller batteries, more overall storage capacity,
lower costs, and larger driving ranges.

B-1
APPENDIX B: Charging Infrastructure Characteristics
Appendix B discusses forecast predictions for the battery charging infrastructure required to
support an increase in electric vehicles. This forecast focuses on the penetration and types of
chargers in the EV market based on different EV use scenarios. These parameters specifically
guide the authors’ calculations of the power output and geographic distribution of charging
infrastructure with the goal of understanding vehicle-to-grid contributions and load shifting.
Current electrical vehicle supply equipment (EVSE) include the specifications for the power
output of charging, denoted as Level 1, 2, or 3, based on the vehicle and electrical infrastructure
capabilities. Level 1 is 110V and 1 kW, Level 2 is 120V and 3.3 kW or 6.6 kW depending on
onboard charger of the vehicle, and Level 3 is a direct current fast charger (DCFC) with 60 kW.
Vehicle charging locations are broken into residential, workplace, and public charging.
Current Infrastructure
Currently, 85 percent of all EV charging takes place at home after the work day.139,140 The most
common type of residential charging infrastructure is a Level 1 wall socket charger, and publicly
available charger is a Level 2. Of the 13,000 publicly available outlets, 84 percent are Level 2, and 12 percent are Level 3.141 The publicly available charging stations are geographically distributed
primarily in coastal cities, as shown in Figure B-1; however, Energy Commission investments
have targeted increased deployments, particularly of DC fast chargers, along major corridors to
provide interconnectivity throughout California.
139 Karner, Donald, Thomas Gareston, and Jim Francfort. EV Charging Infrastructure Roadmap. August 2016. Idaho National Laboratory. https://avt.inl.gov/sites/default/files/pdf/evse/EVChargingInfrastructureRoadmapPlanning.pdf.
140 Francfort, Jim, Brion Bennett, Richard Carlson, Thomas Garretson, Lauralee Gourley, Donald Karner, Mindy Kirkpatrick, Patti McGuire, Don Scoffield, Matthew Shirk, Shawn Salisbury, Stephen Schey, John Smart, Sera White, and Jeffrey Wishart. Plug-In Electric Vehicle and Infrastructure Analysis. September 2015. Idaho National Laboratory. https://avt.inl.gov/sites/default/files/pdf/arra/ARRAPEVnInfrastructureFinalReportHqltySept2015.pdf.
141 U.S. Department of Energy’s Alternative Fuel Data Center (AFDC) https://www.afdc.energy.gov/fuels/electricity_locations.html.

B-2
Figure B-1 Distribution of Charging Stations Across California
Individual triangles represent publicly available charging stations across California.
Source: DOE Alternative Fuels Data Center
Charging Infrastructure Projections for 5 Million EVs Projections of the future of EV charging infrastructure are widely varying and rely heavily on
constantly changing assumptions. For example, to meet California’s goal to deploy 1.5 million
zero-emission vehicles by 2025, the Energy Commission estimates a need for a network
consisting of around 500,000 electric vehicle chargers at or near apartments, workplaces, and
public locations. This Level 2 and DC fast charging equipment will likely cost on the order of $2 billion.142 The Energy Commission developed a model to quantify how these chargers could be
distributed across the state’s 58 counties, according to driver needs and expected improvements in battery range and charging speed.143 As a result, this report presents a summary of conclusions
drawn from several charging infrastructure forecasts before presenting calculations of the amount
of energy the infrastructure can deliver.
Forecasts that assume consumer behavior similar to that of early adopters today emphasize first
transitioning to rapid EV adoption with workplace charging and then investing in strategically placed intraurban Level 3 chargers.144 A report by NREL outlines several scenarios of residential
and workplace charging at different hours with different charging levels in Figure B-2. A
combination of these charging profiles will be required to achieve the load-shifting and vehicle-to-
grid benefits discussed in Chapter 2.
142 This estimate excludes chargers needed for the single family residential segment.
143 California Energy Commission forthcoming Fuels and Transportation Division analysis.
144 Idem EV Charging Infrastructure Roadmap.

B-3
Figure B-2: Charging Profiles for Different Charging Scenarios
Charging profiles based on level and location of charging. Timed charging is restricted charging from 5 – 10 p.m.
and opportunity charging has no restrictions [NREL 2016]145
Calculations for the total power output by several charging infrastructure follow these key
assumptions:
Public and workplace charging: 274 chargers needed/1,000 EVs146, 147
Residential charging: Each EV has a corresponding residential charger.
DCFC charging: 0.469 chargers needed/1,000 EVs.148
All level 2 chargers have a 6.6 kW power capacity.149
The following cases were developed in this study:
Case 0: Current EV charging infrastructure capabilities. Assumes all EVs have access to
L1 residential charging and that 30 percent of L2 public charging is 3.3 kW.
Case 1: Level 1 workplace and residential charging is ubiquitous.150
145 Melaina, Marc, Brian Bush, Joshua Eichman, Eric Wood, Dana Stright, Venkat Krishnan, David Keyser, Trieu Mai, and Joyce McLaren. National Economic Assessment of Plug-In Electric Vehicles Volume I. December 2016. National Renewable Energy Laboratory. https://www.afdc.energy.gov/uploads/publication/value_assessment_pev_v1.pdf.
146 Cal ETC Assessment. The California Statewide Plug‐In Electric Vehicle Infrastructure Assessments.
147 Idem National Economic Assessment of Plug-In Electric Vehicles Volume I.
148 Ibid.
149 Current trends in EV development indicate that 3.3 kW onboard charging is being phased out in favor of higher power capabilities.
150 “Benefits of Electric Vehicles: A National Perspective.” 2011. U.S. Department of Energy. https://www.solardecathlon.gov/past/2011/pdfs/2011_consumer_electric_vehicles.pdf.

B-4
Case 2: Level 2 residential charging for all EVs. No Level 2 public chargers.
Case 3: Level 2 workplace and residential.
Case Number Total Power Output (MW)
0 293.8
1 6515.7
2 33140.7
3 42215.7
Because the battery charging duration is a function of the battery size, distance travelled, geography, and driving habits,151 an average battery size, based on calculations from Appendix A
(60 kWh), is assumed for charging time estimates.
151 Kettles, Doug. Electric Vehicle Charging Technology Analysis and Standards. February 2015. Electric Vehicle Transportation Center for U.S. Department of Transportation. Pg. 7.

C-1
APPENDIX C: Vehicle Market Forecasts
Market Path to 5 Million Electric Vehicles by 2030 Forecasting the future is inherently difficult due to a lack of perfect foresight. However, many
industry analysts have attempted to build their own market forecasts for electric vehicles, drawing
upon a multitude of data about consumer adoption rates, technology preferences and availability,
and charging infrastructure. These forecasts are proprietary and lack sufficient transparency for
replication.
To quantify the impact of 5 million electric vehicles throughout this report, a uniform set of
assumptions was used. For greenhouse gas emissions, health impacts related to those emissions,
and upstream impacts to fuel switching, the deterministic forecast used incorporates the best-
available information about several variables. These include the emissions intensity of E10
gasoline, a projection of electricity grid emissions intensity, average miles driven per vehicle
annually, and an exponential growth rate of 23.3 percent that reaches 5 million vehicles by 2030.
It is not assumed that this is the only pathway to 5 million vehicles but is used to model a possible
pathway. The associated benefits are then described under an assumption that electric vehicles
replace vehicles that comply with 2016 CAFE standards rather than the 2016 fleet average fuel
efficiency.
With additional time and resources, a more comprehensive forecast might incorporate several
growth rate scenarios. Because net benefits for these vehicles depend on the rate of deployment,
this probabilistic approach would refine the estimates presented herein and provide a better
understanding of the impact of timing on deployment. However, additional research undertaken
to compile this study suggests that the deterministic output included here is conservative based
on current information.
Historical Data Suggests Possibility to Achieve 5 Million Vehicles Ahead of 2030 The remainder of this appendix describes a forecast that uses a small data set and simple
assumptions to predict future growth in the plug-in hybrid electric vehicle (PHEV) and battery-
electric vehicle (BEV) markets, which estimates that 5 million vehicles could be sold in California
as early as 2027 should current growth rates continue. This section will outline the data sources
uses, the assumptions made in the analysis, and the results of this simplified forecast.
Data on California vehicle sales are tracked by the California New Car Dealers Association
(CNCDA) and output in quarterly reports called the California Auto Outlook. The sale of new
electric vehicles (NEVs) is broken down into three vehicle types: hybrid electric vehicles (HEV),
PHEV, and BEV. These data are reported quarterly and reported on in yearly figures from 2009 to
2016. In addition to the raw sales figures, the CNCDA also estimates the share each type of vehicle

C-2
has in the overall market. The share data area used to estimate a cumulative total of all NEVs sold
since availability on the market.
The seven-year historical data serve as the basis for projected growth rates going forward. In
addition, a few assumptions are made about technology. First, it is assumed that technology for
PHEV and BEV do not change dramatically before 2025. Lithium-ion batteries will continue to be
the dominant technology choice for manufacturers due to the technology maturity and ongoing
investment in scaling up production. Second, it is assumed that BEVs are seen by consumers as a
substitute for HEVs and PHEVs once they achieve full cost parity. Data about the share of various
hybrid and electric vehicle sales can be examined for trends in buying patterns, as noted in Figure
C-1. The trends indicate that as the share for plug-in hybrid and battery electric vehicles grows,
the share for hybrid vehicles will decrease, suggesting a substitution effect.
Figure C-1: Share of New Vehicle Sales by Technology Type 2009 to 2016
Source: CNCDA

C-3
Table C-1: Sales of Plug-In Hybrid and Battery-Electric Vehicles From 2009 to 2016
Technology 2009 2010 2011 2012 2013 2014 2015 2016
Hybrid 61,292 64,211 58,543 94,073 116,912 115,544 118,562 97,341
Plug in
hybrid 0 97 1,682 14,701 20,633 29,949 27,740 34,818
Battery 772 300 5,302 6,197 21,912 29,536 34,477 40,347
Total 772 1,169 8,153 29,051 71,596 131,081 193,298 268,463
Source: CNCDA
With the assumption that PHEV and BEV technology will be a substitute for hybrid vehicles, the
forecast uses an overall growth rate for the entire NEV category using the combined sales of all
three vehicle types: HEV, PHEV, and BEV. The exponential growth rate for all NEV from 2009 to
2016 is 14.6 percent. Similar analysis shows that PHEVs alone have an exponential growth rate of
98 percent, and BEVs have a growth rate of 56 percent. Like traditional hybrid vehicles, the plug-
in hybrid vehicles are assumed to be pushed out of the market due to cost-competitiveness from
BEV products. The forecast thus assumes that growth rates for each category continue until BEVs
comprise 100 percent of all NEV sales. This forecast makes considerable assumptions about the
technology capacity for BEV to adequately address consumer concerns about range and the
required access to charging infrastructure. Given the current portfolio of electric vehicles as
outlined in Appendix A, this seems reasonable.
These estimates are do not include potential impacts from converging technologies in the
automotive sector like autonomous driving technology, changes to existing federal and state
incentive structures, the ongoing evolution of vehicle policy mandated by countries like India and
China with large global market shares, and the unknown changes in other technology pricing.
Appendix A explains the report’s assumptions for the cost per kilowatt-hour of lithium-ion
technology. With the assumptions outlined here, it is possible to construct an estimate that
projects that by 2025, more than 3.7 million PHEVs and BEVs will be on the road in California,
with 90 percent of those vehicles being BEV. By 2030, this projection estimates that an additional
5 million BEVs will be sold, reaching a total of 10.6 million combined HEVs, PHEVs, and BHEVs
vehicles on the road.
California’s Electric Vehicle Market Is Leading the Way The California market for new energy vehicles is one of the most developed in the world. This
unique position adds a layer of complexity in forecasting future market growth, so the analysis for
the forecast herein uses reputable sources against which to gauge the overall trend in the
prediction being made. In the Annual Energy Outlook for 2017, the U.S. Energy Information
Administration (EIA) projects that adoption of BEV, PHEV, and fuel cell vehicles (FCV) increases
to 9 percent of total sales for light-duty vehicles by 2025. In 2016, the share of new light-duty
vehicle sales achieved by NEV in California was 8.3 percent. This conclusion indicates that
California as a market is much more developed for new energy vehicles than world forecasts.
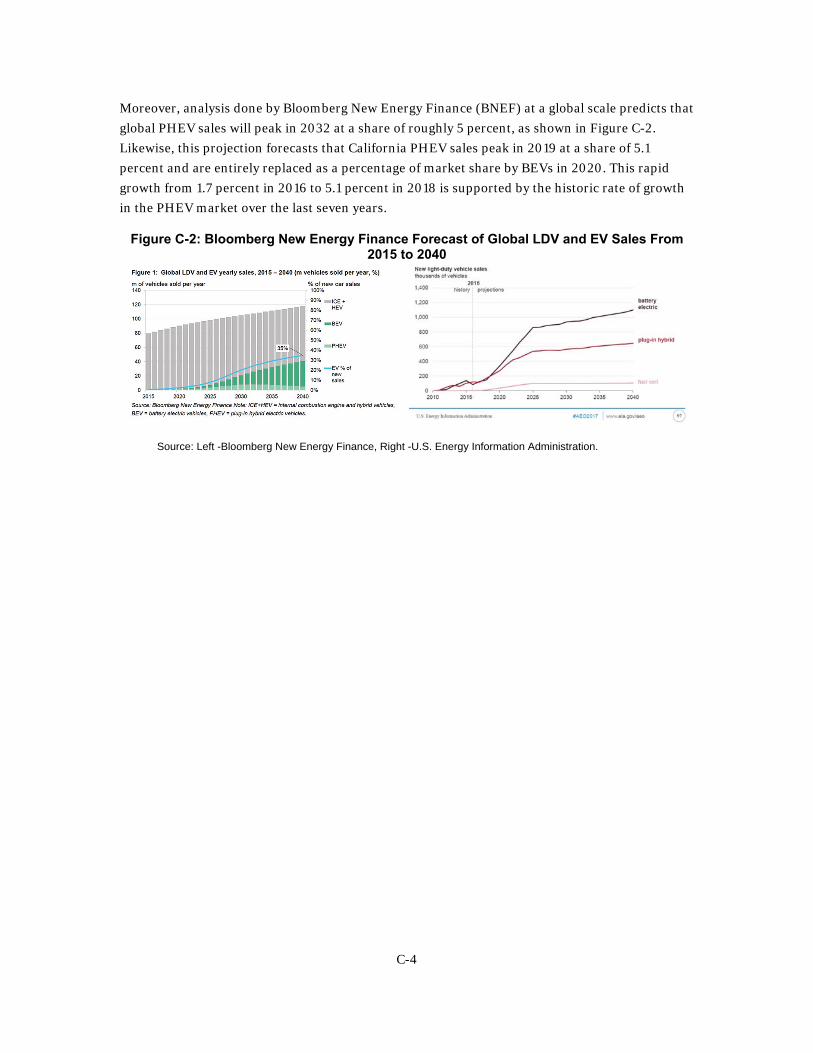
C-4
Moreover, analysis done by Bloomberg New Energy Finance (BNEF) at a global scale predicts that
global PHEV sales will peak in 2032 at a share of roughly 5 percent, as shown in Figure C-2.
Likewise, this projection forecasts that California PHEV sales peak in 2019 at a share of 5.1
percent and are entirely replaced as a percentage of market share by BEVs in 2020. This rapid
growth from 1.7 percent in 2016 to 5.1 percent in 2018 is supported by the historic rate of growth
in the PHEV market over the last seven years.
Figure C-2: Bloomberg New Energy Finance Forecast of Global LDV and EV Sales From 2015 to 2040
Source: Left -Bloomberg New Energy Finance, Right -U.S. Energy Information Administration.

D-1
APPENDIX D: Driver and Vehicle Usage and Duty-Cycle Statistics
The environmental, fuel-switching, and consumer savings benefits are quantified using the U.S.
Energy Information Agency’s data set on Motor Vehicle Mileage. The nationwide mileage average for light-duty, short wheelbase vehicles was 11,327 miles.152 This average annual distance traveled
can reasonably be used to estimate the effect of 5 million vehicles. While some individual vehicles
will drive more, and some less, the average mileage is representative over the large quantity of
vehicles analyzed in this report.
Other sources were reviewed to attempt building a more detailed model of vehicle usage as the
underlying assumptions affect emissions estimates, charging patterns, and other outcomes
described in this study. For example, pattern variations in charging behavior would affect
emissions estimates due to the variation in the generation mix on an hourly basis. However, the
literature review concluded insufficient data exist for this report to make more definitive
assumptions about when cars are in use, but this is an area of emerging research.
The two useful pieces of information for creating more in-depth models would be trip distance
and time of day the trip begins and ends. The U.S. Census Bureau publishes state-level statistics
about transportation, focusing primarily on commuters’ physical flows and the average travel
time to work, neither of which provides much information about actual distance. Similarly, the 2012 California Household Travel Survey153 goes a step further to report the average number of
trips taken in a household per day, the average length of time traveling in each trip, and the
average trip distance. However, the distribution data are not provided, and using these averages
together produces an estimate of 18,804 miles traveled per person annually, more than 66
percent higher than the EIA national statistic. The annual average distance traveled per vehicle
serves as a conservative input to estimate the impact of all vehicles in the authors’ model.
152 U.S. Energy Information Administration data for light-duty vehicles, short wheelbase, annual mileage for 2015. https://www.eia.gov/opendata/qb.php?category=711246&sdid=TOTAL.PCMIRUS.A.
153 2010-2012 California Household Travel Survey Final Report. 2013. California Department of Transportation. http://www.dot.ca.gov/hq/tpp/offices/omsp/statewide_travel_analysis/Files/CHTS_Final_Report_June_2013.pdf.