prefix-based advertising and searching...
TRANSCRIPT

PREFIX-BASED ADVERTISING AND SEARCHING
SCHEMES FOR DISTRIBUTED SERVICE DISCOVERY
IN LARGE-SCALE P2P NETWORKS
TEOH EE NA
Master of Computer Science
Faculty of Information and Communication Technology UNIVERSITI TUNKU ABDUL RAHMAN
DECEMBER 2014

PREFIX-BASED ADVERTISING AND SEARCHING SCHEMES
FOR DISTRIBUTED SERVICE DISCOVERY IN LARGE-SCALE P2P
NETWORKS
By
TEOH EE NA
A dissertation submitted to the Faculty of Information and Communication
Technology,
Universiti Tunku Abdul Rahman,
in partial fulfillment of the requirements for the degree of
Master of Computer Science
December 2014

ii
ABSTRACT
Service discovery is one of the most critical features in resource sharing
over a large-scale network to ensure every service available in the network can
be delivered when requested. Traditional approaches may employ a server to
index a pool of resources so that users are able to query the server for the
available resources. However, these approaches are not scalable and could risk
the network performance by introducing single point failure. To resolve these
issues, different algorithms have been proposed for distributed service
discovery based on peer-to-peer architecture. However, they either adopt a
brute-force method that floods a query over the network to search for a
requested service, or are unable to provide locality awareness in which service
providers in the close proximity should have better chance to be located than
those that are far.
In this dissertation, a novel approach based on Pastry, a structured peer-
to-peer system is introduced to address the aforementioned issues by using
prefix-based advertising and searching for distributed service discovery. With
the approach, two algorithms are further proposed. Simulation results
demonstrate that the proposed algorithms are able to reduce the query traffic
generated in a network with yet achieving high service discovery rate.
Moreover, the algorithms are also able to support locality awareness with low
routing complexity when compared with other approaches.

iii
ACKNOWLEDGEMENT
I am deeply grateful to my main supervisor, Dr. Liew Soung Yue for his
endless guidance and support that has helped me to finish this dissertation and
completing my research. I would also like to express my gratitude to my co-
supervisor, Dr. Lau Phooi Yee who has been a delightful person to work with.
Being a postgraduate student in Kampar has been a pleasant experience as
I get to be friends with lecturers in UTAR. The experiences they have shared
with me are priceless. Special thanks to Dr. Alex Ooi Boon Yaik who has
encouraged me to pursue postgraduate studies, and Mr. Wong Chee Siang who
is so kind to lend me his thesis.
I would also like to thank both Dr. Amril Nurman Mohd Nazir and Ms.
Yazsrina Mohammad Yassin from Mimos Berhad who have been cooperating
with us in this research. Their guidance and advices have been a great help in
completing this research.
Finally, I would like to thank my parents, Mr. Teoh Seng Guan and
Madam Chew Poh Soon for always encouraging me to pursue my studies and
have never given me any pressure in my studies. Their advices are always the
best and practical when making life decisions. Great parents like them are the
best gift that has been given to me. I also want to thank my sister and brothers,
Li Na, Ji Mi, and To Mi for playing with me and buying me stuffs.

iv
APPROVAL SHEET
This dissertation entitled “PREFIX-BASED ADVERTISING AND
SEARCHING SCHEMES FOR DISTRIBUTED SERVICE DISCOVERY
IN LARGE-SCALE P2P NETWORKS” was prepared by TEOH EE NA
and submitted as partial fulfillment of the requirements for the degree of
Master of Computer Science at Universiti Tunku Abdul Rahman.
Approved by:
___________________________
(Dr. Liew Soung Yue) Date:…………………..
Main Supervisor
Department of Computer and Communication Technology
Faculty of Information and Communication Technology
Universiti Tunku Abdul Rahman
___________________________
(Dr. Lau Phooi Yee) Date:…………………..
Co-supervisor
Department of Computer and Communication Technology
Faculty of Information and Communication Technology
Universiti Tunku Abdul Rahman

v
SUBMISSION SHEET
FACULTY OF INFORMATION AND COMMUNICATION TECHNOLOGY
UNIVERSITI TUNKU ABDUL RAHMAN
Date: __________________
SUBMISSION OF DISSERTATION
It is hereby certified that Teoh Ee Na (ID No: 12ACM06064 ) has completed dissertation
entitled “PREFIX-BASED ADVERTISING AND SEARCHING SCHEMES FOR
DISTRIBUTED SERVICE DISCOVERY IN LARGE-SCALE P2P NETWORKS” under
the supervision of Dr. Liew Soung Yue (Supervisor) from the Department of Computer and
Communication Technology, Faculty of Information and Communication Technology, and
Dr. Lau Phooi Yee (Co-Supervisor) from the Department of Computer and Communication
Technology, Faculty of Information and Communication Technology.
I understand that University will upload softcopy of my dissertation in pdf format into
UTAR Institutional Repository, which may be made accessible to UTAR community and
public.
Yours truly,
____________________
(TEOH EE NA)
*Delete whichever not applicable

vi
DECLARATION
I hereby declare that the dissertation is based on my original work except for
quotations and citations which have been duly acknowledged. I also declare
that it has not been previously or concurrently submitted for any other degree
at UTAR or other institutions.
_____________________
(TEOH EE NA)
Date ______________________

vii
LIST OF TABLES
Table Page
4.1 Latency range between nodes 47
5.1 Comparison of discovery success rate between prefix-based
scheme (PASS) and cumulative prefix-based scheme (CPASS)
on Pastry network
69
5.2 Comparison of average traffic generated per query between
distributed service discovery scheme and cumulative prefix-
based scheme on Pastry network
70
5.3 Chord finger table example for Chord with node identifier of 5,
with M = 8
72
5.4 Service discovery success rate of CPASS on Pastry and Chord 77
5.5 Service discovery success rate of PASS on Pastry 77
5.6 Locality failure success rate of CPASS on Pastry and Chord 78
5.7 Locality failure rate of PASS on Pastry 78
6.1 Service discovery success rate in a network of 6000 nodes 88
6.2 Average service discovery traffic generated in a network of
6000 nodes
89
6.3 Average latency generated from service consumer to directory
node in a network of 6000 nodes
89
6.4 Average latency generated from service consumer to service
provider in a network of 6000 nodes
90

viii
LIST OF FIGURES
Figure
Page
3.1 Success rate for RBFS simulation
22
3.2 Average traffic generated per query
23
3.3 Success rate for modified random BFS with k = 10
24
3.4 Average traffic per query generated in modified random BFS
in network of 6000 nodes with k = 10
25
3.5 Success rate for distributed service discovery using structured
P2P system
29
3.6 Average traffic generated in distributed service discovery
using structured P2P
30
3.7 Average number of directory nodes per service type
31
3.8 Locality search failure of service discovery using structured
P2P
32
4.1 Service advertisement and service discovery
34
4.2 Example of routing table state for Pastry node with nodeId =
3302, B = 4, and n = 4 digits
37
4.3 Service advertisement example where B = 4, n = 8 bits (4
digits), and m = 4 bits (2 digits)
40
4.4 Service discovery example where B = 4, n = 8 bits (4 digits),
and m = 4 bits (2 digits)
42
4.5 Impact of small m
43
4.6 Impact of large m
44
4.7 Success rate in identifying a directory node
45
4.8 Probability that a directory node contains the required list of
service providers
46
4.9 Service discovery success rate
46
4.10 Simulation-I result 48

ix
4.11 Simulation-I: Average latency of prefix-based service
discovery
49
4.12 Simulation-I: Locality search failure of prefix-based service
discovery
50
4.13 Simulation-I result with 0.1% of service providers
52
4.14 Average latency for 0.1% of service provider simulation-I
52
4.15 Simulation-I: Service discovery success rate when m = 3 and
N = 6000
53
4.16 Simulation-I: Locality failure rate when m = 3 and N = 6000
53
4.17 Simulation-II results
54
4.18 Simulation-II: Average latency of prefix-based service
discovery
55
4.19 Simulation-II: Locality search failure of prefix-based service
discovery
55
4.20 Simulation-II with 0.1% of service providers
56
4.21 Simulation-II: Average latency for 0.1% of service provider
57
4.22 Simulation-II: Service discovery success rate when m = 1 and
N = 6000
57
4.23 Simulation-II: Locality failure rate when m = 1 and N = 6000
58
5.1 Cumulative prefix-based service advertisement
61
5.2 Cumulative prefix-based service discovery
64
5.3 Service discovery success rate in cumulative prefix-based
scheme on Pastry network
68
5.4 Service discovery success rate in network size of 6000 nodes
on Pastry network
68
5.5 Average traffic generated in service discovery of cumulative
prefix-based scheme on Pastry network
69
5.6 Locality search failure of prefix-based cumulative prefix-
based scheme on Pastry network
70
5.7 Average latency of cumulative prefix-based scheme on Pastry 71

x
network
5.8 Service discovery success rate of CPASS on Chord network
74
5.9 Service discovery success rate in network size of 6000 nodes
on Chord network
74
5.10 Traffic generated in service discovery of CPASS on Chord
network
75
5.11 Locality search failure of cumulative prefix-based scheme on
Chord network
76
5.12 Average latency of cumulative prefix-based scheme on Chord
network
76
6.1 Service discovery success rate for resiliency test in a Pastry
network
80
6.2 Success rate in a network that consist of 6000 nodes after
10% of the nodes departed
81
6.3 Traffic generated in a network that consist of 6000 nodes
after 10% of the nodes departed
81
6.4 Locality failure in a network that consist of 6000 nodes after
10% of the nodes departed
82
6.5 Average latency in a network that consist of 6000 nodes after
10% of the nodes departed
83
6.6 Example of routing table repairing process 85
6.7 Service discovery success rate after routing table repairing
procedure
86
6.8 Success rate in a network that consist of 6000 nodes after
routing table repairing process
86
6.9 Traffic generated in a network that consist of 6000 nodes
after routing table repairing process
87
6.10 Locality search failure in a network that consist of 6000
nodes after routing table repairing process
87
6.11 Average latency in a network that consist of 6000 nodes after
routing table repairing process
88

xi
LIST OF ABBREVIATIONS
P2P Peer-to-peer
DN Directory node
SC Service consumer
SP Service provider
TTL Time to live
BFS Breadth first search
PASS Prefix-based advertising and searching
scheme
CPASS Cumulative prefix-based advertising and
searching scheme

xii
TABLE OF CONTENTS
Page
ABSTRACT ii
ACKNOWLEDGEMENT iii
APPROVAL SHEET iv
SUBMISSION SHEET v
DECLARATION vi
LIST OF TABLES vii
LIST OF FIGURES viii
LIST OF ABBREVIATIONS xi
CHAPTER
1.0 INTRODUCTION 1
1.1 Background Information 1
1.2 Problem Statement 2
1.3 Motivation 3
1.4 Objectives 5
1.5 Research Contributions 5
1.6 Organisation of dissertation 6
2.0 LITERATURE REVIEW 8
2.1 Basic concepts 8
2.2 Unstructured P2P 8
2.3 Structured P2P 14
2.4 Discussion 19
3.0 DISTRIBUTED SERVICE DISCOVERY SCHEMES IN
P2P NETWORKS
20
3.1 Introduction 20
3.1.1 Breadth first search (BFS) 20
3.1.2 Modified random BFS 23
3.1.3 Observation and discussion 25
3.2 Distributed service discovery in structured P2P
network
27

xiii
4.0 PREFIX-BASED ADVERTISING AND SEARCHING
SCHEME FOR DISTRIBUTED SERVICE
DISCOVERY IN STRUCTURED P2P NETWORKS
33
4.1 Introduction 33
4.2 Service advertisement and service discovery 38
4.2.1 Service advertisement 38
4.2.2 Service discovery 40
4.3 The selection of m 42
4.3.1 Smaller m 43
4.3.2 Larger m 43
4.4 Performance measure 44
4.5 The prefix-based advertising and searching scheme
simulations
46
4.5.1 Simulation-I results and discussion 47
4.5.2 Simulation-I with only 0.1% of service
providers
51
4.5.3 Simulation-II results and discussion 53
4.5.4 Simulation-II with only 0.1% of service
providers
55
5.0 CUMULATIVE PREFIX-BASEDADVERTISING AND
SEARCHINGFOR DISTRIBUTED SERVICE
DISCOVERY IN STRUCTURED P2P NETWORKS
59
5.1 Introduction 59
5.1.1 Service advertisement 59
5.1.2 Service discovery 63
5.2 Simulation results and discussion 66
5.2.1 Simulation on Pastry network 67
5.2.2 Simulation on Chord network 71
6.0 THE RESILIENCY OF CUMULATIVE PREFIX-
BASEDADVERTISING AND SEARCHING SCHEME
79

xiv
6.1 The resiliency simulation 79
6.2 Repairing the Pastry routing table 83
6.3 Discussion 88
7.0 CONCLUSION 91
REFERENCES 94

1
CHAPTER 1
INTRODUCTION
1.1 Background Information
Distributed service discovery has become a future trend due to the advent
of sophisticated applications that require high computing power and
communication between users. Over the Internet, sources of data can come
from different part of the world due to the overwhelming number of networks
and normally the data collected need extensive processing in order to produce
useful information or specific services for users. In the past, such tasks were
normally carried out in servers associated with expensive hardware. Quite
many computers are nowadays equipped with server-grade computing
capability as the cost of computing devices are getting lower and affordable,
thus they can render their services to other users. As these computers could be
located anywhere over a wide geographical area, or even over the world, hence
there is a need for an efficient service discovery system that enables such tasks
to be processed by using distributed resources available over the Internet.
Conventional service discovery approaches for resource sharing require
centralised registries. The registries are usually managed by a dedicated server
designed to hold information about the resources available in the network
including the types and locations of the resources. However, centrally
controlled servers usually come with such issues as traffic congestion at the
servers and the risk of single-point failure. One of the solutions to resolve the

2
issues is to replicate the servers (Bowman, et al., 1994). For example, the name
servers that translate domain names into IP addresses where each domain name
must have at least two name servers and the second server will be used as a
backup server in case the first server is down (Christensson, n.d.). However,
having multiple servers in the domain name system (DNS) requires
synchronization between the servers and additional expensive hardware to
achieve good performance. Furthermore, with the tremendous growth of new
and much more complicated applications, it is difficult for such an approach to
handle a huge number of new queries which are for a wide variety of services.
Thus, the future trend in service discovery requires distributed servers that
offer users with alternatives to ensure the issues that come with centralised
servers will not occur. In order to have a distributed service discovery approach,
many researchers have started to integrate peer-to-peer (P2P) system with
service discovery (Awan, et al., 2004; Guo, et al., 2006; Zhou, et al., 2011).
The reason is three-fold. First, all peers in a P2P network is cooperative and
plays equal roles. Secondly, each peer could host different resources and share
the resources with other peers in the network. Thirdly, they can also serve as
query servers, which host part of the network information, for each other.
Using P2P systems in service discovery can fully utilize the computers in
the network that possess various computational capabilities, and largely reduce
the dedicated resources required. Another advantage of using P2P network is
that it offers better scalability and robustness compared with centralised
registries.

3
1.2 Problem Statement
There are several issues that need to be addressed in using P2P system as
an approach for service discovery in a large scale network. First, there should
be a systematic routing procedure for service advertisement and discovery by
peers in the network. This is to ensure that any peers are able to find and use
the services in the network.
Second, the peers should be enabled, where it is possible, to find and use
the resources in their close proximity in order to reduce the processing delay
and the traffic of sending jobs over long distance in the network. Hence,
locality awareness is important in service discovery.
Third, P2P system is commonly and intensively used for file sharing. The
searching performance for file sharing can be improved by duplicating and
storing the files in different peers thus making it easier for users to find the
files they need. However, resources or services such as storage, computational
power and peripherals cannot be duplicated from one peer to another. Hence,
the performance in searching may greatly degrade causing high traffic and low
success rate.
1.3 Motivation
There are only a few of distributed service systems available currently.
One famous example is grid computing. In grid computing, each computer’s
resources such as compute power, memory and storage can be shared among
each other in the network. However, a control node or dedicated server must be
put in place to administrate the pool of resource in the network (Strickland,

4
n.d.), which may suffers from the issue of single-point failure. A popular
example is the SETI@home project by Cobb, et al. (2002).
Another example is Domain Name System (DNS), a distributed database
implemented in a hierarchy of name servers. A DNS client sends a query to a
DNS server in order to resolve hostnames to IP addresses. Initially, local name
servers are queried first and if the local name servers are unable to resolve the
query, the query will be sent to dozens of root servers. The bottleneck and
single point of failure issues are prevented when a network of name server
exists (Young, 2013). However, a query may take a long time to resolve as the
query must follow each level of the hierarchy and repeat the request on each
level if the local name server does not have the information required.
One of the main issues that need to be resolved in distributed service
discovery on P2P network is, without a centralised server, the service of a peer
may not be discovered by another peer who needs it. Generally, when a peer
has services or resources to share with other peers, it has to advertise its
capabilities at a server. Otherwise, the peers who are in need of services will
have to resolve it with a brute force method by flooding the network.
In order to achieve a completely distributed service discovery, an
approach is to have all peers in the network to be a part of the service discovery
system. In this way, all peers in the network are able to not only share
resources but also cooperate among each other for service queries. Besides, the
hardware and software capabilities of each machine connected to the network
can be fully utilised.

5
Since there is no centralised server to control the resources in the network,
each node is responsible to control their own resources, resulting in better load
distribution. Besides, nodes leaving the network may have little effect in
resource sharing as there may be other nodes in the network that can provide
the same service. Furthermore, service discovery using P2P is more scalable
when compared with centralised service discovery.
1.4 Objectives
The following are the objectives of this research:
1. To investigate the existing approaches in distributed service
discovery that can be integrated with peer-to-peer systems in order
to demonstrate the efficiency of those approaches.
2. To design efficient approaches for distributed service discovery
that is able to provide:
a. Low complexity in routing
b. Locality awareness in routing
c. High success discovery rate
3. To analyse and compare performance, efficiency of the existing
approaches with the proposed solution.
1.5 Research Contributions
The major contributions of this research are as follows:
(1) The proposed approaches introduce a prefix-based method to define
“directory node”, and uses the directory nodes as a platform for service
providers to advertise their capabilities and to allow other nodes to find
these service providers. As the directory nodes are chosen based on the

6
prefix of the node identifier, this enables any node in the network to
become a directory node hence, the service discovery is more
distributed and scalable.
(2) Based on the directory node scenario, two distributed service discovery
schemes are proposed in this dissertation, namely Prefix-based
Advertising and Searching Scheme (PASS) and Cumulative Prefix-
based Advertising and Searching Scheme (CPASS). In particular,
CPASS is a novel approach and a patent has been filed for the scheme.
(3) Simulations are conducted in order to measure the performance of
PASS and CPASS compared with the existing approaches. Through
these experiments, PASS and CPASS are shown to have superior
performance based on the simulation results. That is, both PASS and
CPASS are able to:
a. Maintain locality and deterministic routing with log order
complexity using Pastry as the underlying P2P system
b. Achieve good success rate without generating high volume of
traffic in the network
1.6 Organisation of dissertation
The remainder of this dissertation is organised as follows. In Chapter 2,
thorough literature review is presented in order to justify the research design.
In Chapter 3, the discussion on unstructured and structured P2P for distributed
service discovery is presented. Simulation results are also shown to verify our
argument regarding the shortcoming of unstructured P2P service discovery
approaches. In Chapter 4, the proposed scheme, PASS is described and
simulation results of PASS are also shown. In Chapter 5, PASS is improved

7
and CPASS is introduced and the simulation results of CPASS are discussed as
well. The resiliency of CPASS is tested and the simulation results are shown in
Chapter 6. Finally, Chapter 7 is the concluding chapter and future work is also
described here.

8
CHAPTER 2
LITERATURE REVIEW
2.1 Basic concepts
In general, P2P systems can be categorized into unstructured and
structured P2P. Structured P2P networks maintain a logical structure among all
the peer nodes at the P2P layer (Lua, et al., 2005). As such, they require certain
proactive coordination among nodes prior to nodes being able to forward
messages. Compared to unstructured P2P, however, structured P2P provide
more efficient routing when a node needs to forward its updates or queries to
the corresponding nodes which host the resources. In this project, a structured
P2P network, namely Pastry (Rowston & Druschel, 2001), is employed as the
underlying network architecture to support the distributed service discovery
schemes that we propose. Although our work can also be extended to other
structured P2P approaches, Pastry shows its superiority in providing locality
awareness. In the following subsections, existing P2P systems and some
distributed service discovery approaches are reviewed and discussed in order to
justify our design.
2.2 Unstructured P2P
Searching in unstructured P2P system is simple and straightforward as
there is no rule that define neighbours’ nodes or where files should be stored
(Li & Wu, 2005). Hence, many researchers proposed using unstructured P2P to
solve the bottleneck and scalability issues in resource sharing because

9
unstructured P2P system requires less maintenance and there is no special
network structure as nodes join and leave as they wish. However, there are
several issues with unstructured P2P networks. Firstly, the searching strategy in
unstructured P2P involves blind search or informed search, i.e., nodes in the
P2P network have no information about other peers whereas nodes in informed
search keep some data location information. Secondly, when searching for
certain resources in a network, unstructured P2P uses message flooding by
broadcasting messages to all directly connected peers in the network. When
there exist too many requests, in unstructured P2P, the number of messages in
the network would be too many and this could cause traffic congestion.
Besides, unstructured P2P systems are usually for file sharing application.
Popular files will have better availability and stability because more peers are
sharing them (P2PNews, 2012). However, this could become a problem when
peers are sharing information about one popular resource provider as this could
cause the popular resource provider to become more popular, causing
unbalanced load distribution among providers who can offer the same resource.
One of the examples of distributed service discovery on unstructured P2P
network was proposed by Awan, et al., (2004). The author proposed a
distributed architecture for sharing processor cycles in an unstructured P2P
network. One of the assumptions made in the proposed approach is that a job,
can be broken down into a few independent subtasks and these subtasks can be
grouped into batches. The consumer will submit each batch job to a neighbour
node chosen randomly by performing a random walk. In order to protect the
resiliency of the proposed method, a replication factor, r is attached with each
batch job to enable a batch job to be processed by r different nodes. The author

10
argued that redundancy in such an approach is important to account for node
failures and validate the reported results. However, this approach could result
in decreased productivity and wasted resource. Besides, since the approach
only focuses on sharing processor cycles, selecting peer nodes for job
submission using random walk may be appropriate but this may become a
problem in successfully finding peer nodes if the required resource is anything
other than processor cycles.
Tie, et al. (2006) proposed a Peer-Tree approach that consists of two
layers which are the peer layer and the tree layer. Similar service types are
grouped into a tree and the root of the tree is named as a super peer. The peer
layer consists of only super peers and uses unstructured P2P as the routing
protocol for searching. The approach is able to minimize the number of nodes
in the peer layer by grouping peers who can provide similar services into a tree,
hence may result in less traffic in routing. However, single-point failure may
occur if the super peer for a requested service leaves the network. Besides,
there may be overhead in searching as there are two layers that need to be
searched sequentially, i.e. searching in peer layer and then searching in tree
layer. This approach may work well in a small-scaled network however, in a
large-scale network with many different types of services that cannot be
grouped into a tree will require high traffic and higher depth to achieve a good
success rate.
ASAP (Gu, et al., 2007) is a search algorithm for unstructured P2P
network that uses Bloom filters across the network enabling nodes to search for
services without sending anything other than confirmation messages.
Advertisement will be sent by new nodes as they join the network or when any

11
node in the network requests them. Nodes in the network can also choose to
only save information on topics that they are interested in. With the help of
Bloom filters enables traffic to be reduced during the searching phase.
However, a service consumer still has to expand its search radius according to
the maximum time-to-live if its nearest neighbours do not have the
advertisement requested. Besides, some nodes could keep so many
advertisements locally and may not even use it. On the other hand, publishing
advertisement is only done one time as new node join causing newer consumer
nodes the need to request for advertisement by the means of flooding.
Clustella, an approach proposed by Stefan and Roger (2007) attempts to
improve the efficiency of flooding by decomposing the network into different
clusters. Each cluster has its own beacon that enables peers in the network to
identify other clusters. A peer is elected to become a beacon if there is no
existing beacon in the peer’s cluster. The beacon is used to ensure the routing
table entries of a peer are far from each other but are near to the peer itself.
Hence, when routing for a certain key in the network, a message can be
forwarded quickly to peers that are far from the local peer. However, a
message could be forwarded back and forth to the same cluster which may not
be reliable. Besides, Clustella has a system that enables a packet to continue to
be routed to its destination even after its time-to-live (TTL) is reached by
enabling the packet to be piggybacked on another packet. Although this
approach can help to extend the flood coverage without increasing network
traffic but the size of the packets that have to piggyback another packet will
also increase. A big packet that has to be passed and broadcasted may need to

12
be fragmented into smaller packets which could result in increase in network
traffic and reduce throughput.
Search+ is a distributed service discovery scheme by Skjegstad & Johnson,
(2009) that uses unstructured P2P for routing. The overall architecture is
simply an enhanced version of ASAP. However, instead of broadcasting
advertisements to the network like ASAP, new nodes in Search+ are given the
option to only subscribe to advertisements they are interested in as they join the
network. This will establish subscriptions of advertisements that it is interested
in and the new nodes will be informed as new advertisements of their topic of
interest comes in. This method is very effective in reducing bandwidth and
traffic generated in service searching but flooding is still unavoidable when the
node changes its topic of interest. Maintenance process is provided in Search+
where queries will be sent to the network, requesting advertisements from
neighbouring nodes but this method is still similar to blind search.
As searching in unstructured P2P systems are usually blind, Anusuya, et al
(2010) proposed using an enhanced guided search protocol to model user’s
common interest pattern by using a probability-theoretic framework that is able
to guide the searching in service discovery. However, this approach requires a
lot of global information about past events and intensive computing power to
calculate the probabilities in order to have an accurate guidance for the peers
during service discovery. On the other hand, the author also discussed another
approach to improve the searching in unstructured P2P systems through the
peers’ routing tables. In the event of successful service discovery where a
requested service provider has been identified, the sending peer and the peers
that the message passed through will update their routing tables to include the

13
identified service provider including the information about the service it can
provide. Although this approach can help to guide future discovery that
eventually may be able to reduce overall traffic generated in a network, this
advantage may become an issue for service provisioning because popular
service providers tend to be discovered easily and become more popular, and
vice versa for less popular services. This will result in an inefficient and
unbalanced service load distribution among those peer nodes which provide
those similar service.
Zhou, et al. (2011) proposed each peer in the network using kd-tree to
establish a data space for indexing the service descriptions. Then, all nodes will
use one-hop replication to share the service indexes with their neighbour nodes.
Eventually, when the service indexes in a node reach a threshold, it can
promote itself to become super peer. The normal routing protocol is to
broadcast the query message to all neighbours of the requesting peer, but the
existence of super peer works as a shortcut. If any super peer exists in the
network, the query message will be forwarded to that super peer. The
experimental results from this approach shows that the number of traffic could
be reduced to half when compared to other unstructured approaches. However,
the message flooding of using unstructured P2P still would not be totally
prevented as the simulation results provided by the author shows that each
discovery query requires on average 3625.554 messages, which is still very
high compared to structured P2P approach.
Another author (Saleem, et al., 2011) proposed the idea of using
autonomous systems (AS) to clusterize the P2P network, and Application
Oriented Networking (AON) for inter-AS routing. Although the proposed

14
framework can help to reduce the number of broadcast messages and to
improve the scalability of the system even by using unstructured P2P system, it
requires a rather complex maintenance scheme for the AON routers as the
routers will need to learn the service-classification specific routing. Besides, if
a router along the routing path is not AON-enabled, message flooding would
not be avoidable for inter-AS service discovery.
2.3 Structured P2P
2.3.1 Overview
Structured P2P systems, or sometimes referred to as Distributed Hash
Tables (DHTs), are scalable network infrastructure that supports large-scale
distributed systems. Structured P2P systems provide deterministic query search
because the neighbourhood links are better defined.
There are many existing structured P2P algorithms available that can be
integrated in distributed service discovery. For example, Plaxton, Chord,
Tapestry, Pastry, Kademlia, and CAN (Lua, et al., 2005).
Generally, the performance of P2P depends on the size of each node’s
routing table where the information about the network is stored. Clearly, a node
cannot store all details of all other nodes for the algorithm to be scalable. From
the literature review conducted on distributed service discovery using
structured P2P, many approaches have chosen to use Chord and Pastry.
Chord, a structured P2P algorithm by Stoica, et al., (2001) arranges its
identifier space in a circular fashion. Each node uses its own finger table that
contains nodes spaced exponentially around the identifier circle. The routing in
Chord works by forwarding the query to the node closest to the key. If no such

15
node exists, the query will be forwarded to the node preceding it in the finger
table. Chord has a stabilization process that validates the joining and leaving of
Chord network to ensure the finger table of each node is well maintained.
On the other hand, Pastry, proposed by Druschel and Rowstron (2001)
generates its node identifier randomly as new node joins a network resulting in
a uniformly distributed identifier space in the network. The entries in routing
tables are chosen based on their locality and are sorted based on their
identifiers. The routing in Pastry works by forwarding the query to the node
that is numerically closest to the key. Each Pastry node also maintains a
neighbourhood set that enables each node to repair their own routing tables
when departed node is found.
In conclusion, both Pastry and Chord are fault tolerant and able to achieve
logarithmic routing complexity. However, Pastry is better in providing locality
awareness in routing when compared with Chord.
2.3.2 Existing service discovery approaches
The following describes various approaches using structured P2P in
service discovery.
An approach by Castro, et al. (2002) applied Pastry to implement a design
that uses universal P2P overlay for service discovery and for service binding in
structured P2P overlay networks. The core proposal here is to group service
providers according to the services offered in a sub overlay, and for each of
these services, a small list of contact node can be obtained from the universal
overlay that enables a node the join the specific service overlay. The strength
of this solution is that it allows service consumers to find the specific service

16
overlay more easily, including joining that overlay in order to get the services.
However, the cost of maintenance of contact nodes list would be very high
because it would requires frequent updates among peers in order to avoid
service unreachable due to contact node failure. As each node may offer more
than one type of service resulting in several sub-overlay identities, this would
complicate the maintenance process.
CompuP2P, proposed by Gupta and Somani (2004) is a scheme that uses
structured P2P, specifically Chord (Stoica, et al., 2001) for computing resource
discovery and trading. The seller (or service provider) hashes its available
compute power (i.e., CPU cycles) as a key, and uses the key to determine and
locate the market owner. On the other hand, the buyer (or service consumer)
can use the same hash function to find the market owner, where a seller can
trade the compute resource with a buyer. However, the service provided in this
scheme is only limited to the compute resource and a buyer therefore ought to
know the required compute power being the key in order to identify the
corresponding market owner. Besides, if a buyer only knows the minimum
requirement, or needs a range of compute powers rather than just a specific one,
it may need to perform lookup many times in order to find market owners for
different specifications, which results in a higher complexity of the approach.
Guo, et al. (2006) introduced DINPeer to identify most powerful nodes,
known as the Data-In-Network Nodes (DIN Nodes) and form an inner ring that
consist of only DIN Nodes. Multiple DIN Nodes are used to replace a single
registry to avoid the single-point failure issue. This approach enables every
node in the network to find their nearest DIN Node and join the Steiner tree
that each DIN Node maintains. In searching, a requesting node will search

17
from the tree that it is in first. However, if the local area does not have the
service that it needs, the query is forwarded to the inner ring that requires each
DIN Node in the inner ring to send multicast messages to their children node
that may cause high routing traffic in the network. Besides, the issue of single-
point failure will still exist if some of the DIN Nodes leave the network. When
a DIN Node dies, no new DIN Node is elected. Instead, the author proposed
that the children nodes of the failed DIN Node to find other alive DIN Nodes
and join their trees. The existing DIN Nodes would be too occupied because
service request query that cannot be found in the local area will have to pass
through them.
Aneka-Federation proposed by Ranjan (2007) is the first attempt that
integrates P2P with cloud based on P2P infrastructure. It provides a
decentralised and distributed system which combines enterprise Clouds,
overlay networking, and structured P2P techniques to create a scalable wide-
area networking of compute nodes for high-throughput computing. The Aneka-
Federation integrates numerous small scale Aneka Enterprise Cloud services
and nodes that are distributed over multiple control and enterprise domains as
parts of a single coordinated resource leasing abstraction. The service
discovery and update here are performed by using spatial indices to handle
multidimensional queries where the indices are formed by hashing multiple
attributes. However, multidimensional query requires users to provide values
for all pre-defined attributes, which may not be flexible. Besides, service query
may not return any result if the query is too specific at one value where the
network may return only a potential service provider to the consumer. If the
service query can range from a minimum to a higher requirement, this will

18
increase the complexity of the implementation. Another issue is that the
locality may not be well preserved while performing P2P lookup routing
because of the way how the indices are mapped.
Chord4S proposed by Qiang, et al. (2008) is a structured P2P based
decentralised service discovery that is the closest to this research. It uses Chord
to utilize the data distribution and lookup capabilities to discover and distribute
services in a decentralised manner. Chord4S improves data availability by
distributing service descriptions of functionally equivalent services to different
successor nodes that are organized into a virtual segment in the Chord circle.
Although using service descriptions to be embedded into the node’s identifiers
may promote efficiency in searching for a particular service provider, locality
may be a challenge where the service consumers may need to be routed to a
service provider located far away when there is a nearer one geographically.
Caron, et al. (2011) proposed using Distributed Lexicographic Placement
Table (DLPT) prefix tree for service discovery. The DLPT tree grows
dynamically as services are declared where each black node in the tree is
labelled by the service name and stores a list of the service providers providing
that service. In order to reveal the prefix tree pattern, white nodes are used and
are labelled by the greatest common prefix of their children labels. This
approach is convenient and easy in searching because each service request
query can be routed up to the root of the prefix tree and then down to the
service requested, hence supporting range queries. However, any root in the
tree that leaves the tree may cause broken parent-children paths hence resulting
in searching failure. Each node that built the tree must be in stable state and
should not leave the network to avoid this issue.

19
2.4 Discussion
In this chapter, a brief discussion about the differences between
unstructured and structured P2P as well as the distributed service discovery
approaches on these two P2P systems are conducted. The service discovery
approaches of using unstructured P2P has lower complexity in maintaining the
network but high complexity in routing thus not fit for a large scale network.
On the other hand, the service discovery approaches on structured P2P
discussed have systematic way of mapping the services to peers, enabling
service consumers to find the service providers more easily. However, the
approaches discussed emphasized more on the discovery success rate.
Although the routing complexity is low when using structured P2P, some of
the approaches that uses tree for service mapping are still in the risk of single-
point failure. Besides that, the approaches that do not use tree may have
locality issues in searching.
In the next chapter, the discussion on using unstructured and structured
P2P for distributed service discovery will be conducted. Besides, simulation
results will also be shown in order to measure the performance of the discussed
approaches.

20
CHAPTER 3
DISTRIBUTED SERVICE DISCOVERY SCHEMES IN P2P
NETWORKS
3.1 Introduction
This chapter verifies our arguments regarding the shortcoming of
unstructured P2P service discovery approaches by providing some theoretical
discussions as well as simulation results as performance evaluation. The focus
of this chapter proceeds to discuss about the usage of structured P2P for service
discovery. A simulation using structured P2P for service discovery is also
carried out to demonstrate its superiority in terms of achieving satisfactory
success rate with less traffic generated.
3.1.1 Breadth first search (BFS)
There are many different searching techniques in unstructured P2P.
However, most of them employed brute-force search for discovery such as
breath first search (Li & Wu, 2005). The breadth first search (BFS) approach is
simple, where a request query is forwarded to every neighbour of the sending
peer. Then each of these neighbours that receive the request query will check if
they have the file or service requested and return the result back to the sending
peer. If none of these neighbours has the file or service requested, each of these
neighbours will forward the request query to its neighbours as well, until the
file or service requested is found.

21
This search method requires a mechanism in each query to stop routing at
a conditional time by using time-to-live (TTL). The TTL can also be
represented as the maximum depth, D that limits the maximum number of
overlay hops of each query message. If the maximum depth is reached during
searching and the file or service requested is yet to be found, then the request
query will be considered as a failure.
The searching in BFS can be used as the routing protocol in service
discovery as the maintenance cost is low and the structure of routing is simple
to implement. Besides, as brute force search is used where each peer may
receive the service request query, the service discovery success rate may be
very high as well.
In order to measure the performance of service discovery in an
unstructured P2P network using BFS, simulations are carried out in networks
that consist of number of nodes from 1,000 to 10,000 nodes, with increment
1000 nodes. The neighbours of each node are randomly generated in the
neighbourhood set and each neighbourhood set could contain 30 entries to 40
entries. During the searching phase, the sending peer will broadcast the query
to all nodes inside its neighbourhood set.
The following are the settings used in the simulation:
1. Each node in the network has a unique node identifier (nodeId).
2. Each service type in the network has a unique service identifier
(serviceId)
3. The total number of service type in the network is 500 and each
node can provide two to three different service types.

22
4. The total number of request queries generated in the network is
100,000 and each querying node is randomly selected to send the
request query message.
Figure 3.1 shows the simulation result of the BFS scheme. As shown in
the figure, the success rate of the BFS can reach almost 100% when the
network size is 4,000 nodes and above, especially when the depth of searching
is 3. As the depth is increased, the search range will keep expanding until it
covers all the nodes in the network. Hence, BFS approach can guarantee
successful search if the depth or TTL is large enough.
Figure 3.1 Success rate for BFS simulation
The BFS scheme shows that it can produce great results in searching
however, the downside of this scheme is that the volume of traffic produced is
very high. As shown in Figure 3.2, the average traffic (or messages) generated
per query can reach as high as above 40000 messages for a network that
consists of only 3000 nodes at D = 3. This is also a general drawback of most
message flooding searching schemes.
0
20
40
60
80
100
0 2000 4000 6000 8000 10000
Su
cces
s ra
te (
%)
Network size
Depth = 1
Depth = 2
Depth = 3

23
Figure 3.2 Average traffic generated per query
In conclusion, the flooding approach can result in too much traffic
generated in the network although high success rate can be achieved. This
condition will cause congestion in message routing as the network will be filled
with high volume of traffic.
3.1.2 Modified random BFS
In order to address the flooding issue in the BFS scheme, one of the
alternatives proposed is the modified random BFS (Li & Wu, 2005). In this
approach, the querying node will send query requests to a subset of its
neighbour. These neighbours are randomly chosen by the querying node. Each
of the neighbour nodes will process the query and forwards the query to a
randomly chosen subset of their neighbours until the stopping condition is met.
A simulation is carried out in order to compare the performance of the
modified random BFS approach with the BFS approach. Instead of forwarding
the request to all neighbours, the simulation is set to randomly select k number
of neighbours to forward the request message. The simulation results show that
0
10000
20000
30000
40000
50000
60000
70000
80000
1 2 3
Av
era
ge
tra
ffic
/ q
uer
y
Depth
N = 3000 nodes
N = 6000 nodes
N = 9000 nodes

24
the amount of traffic generated by each query is significantly reduced but the
overall success rate in searching is not that promising.
Figure 3.3 and Figure 3.4 show the simulation results of the modified
random BFS where each peer forwards the request query to 10 randomly
selected neighbours. As shown, modified random BFS can reach high success
rate when D = 3. However, the searching complexity of this approach is O(𝑘𝐷)
where 𝐷 represents depth of searching or TTL and 𝑘 represents the number of
neighbours each node is connected to send a query to. Hence, the average
messages generated per query is more than 1000 messages for this depth
when 𝑘 = 10. Although the message generated in modified random BFS is
significantly reduced when compared to BFS approach, the total messages
flooding in the network is still too high.
Figure 3.3 Success rate for modified random BFS with k = 10
0
20
40
60
80
100
0 2000 4000 6000 8000 10000
Su
cces
s ra
te (
%)
Network size
Depth = 1
Depth = 2
Depth = 3

25
Figure 3.4 Average traffic per query generated in modified random BFS
in network of 6000 nodes with k = 10
3.1.3 Observation and discussion
Observing the simulation results, the use of brute-force in searching will
flood the network causing too much traffic generated although more traffic can
produce higher discovery rate. Despite that, even if the size of each message
generated in the network is so small that it may seem to have little effect on the
traffic flowing in the network, the traffic will still be highly congested if all
nodes in the network broadcast service discovery request query.
One of the reasons why searching in unstructured P2P generates high
traffic is because only the querying node is active in searching for the files or
services in need. The file or service providers would remain passive in the
network and waiting for query requests causing high number of traffic
generated.
In order to reduce the traffic generated of searching in unstructured P2P,
many researchers proposed different replication techniques for file sharing
(Sabu & Chandra, 2010). However, it should be noted that only files can be
replicated and stored in different nodes. Resources such as compute power,
0
200
400
600
800
1000
0 1 2 3Av
era
ge
tra
ffic
/ q
uer
y
Depth

26
storage, and bandwidth cannot be duplicated because such resources come
from physical peripherals.
Although resources cannot be duplicated, the information about resources
can be duplicated and shared among nodes to help with the searching. Hence,
we proposed a solution in which a new term, named the directory node is
introduced in our research work. A directory node can act as a platform for the
service providers to advertise their capabilities. Besides, a directory node is
also a platform for service consumer to find the services they need.
It should be noted that any nodes in the network can become a directory
node if those nodes are given information about a particular resource. This is
because all peers in a P2P network are cooperative and equal. Hence, any node
can assume three roles in the proposed scheme:
1. Service providers:
Nodes that can provide the service.
2. Service consumer:
Nodes that need the service.
3. Directory node:
Nodes that serve as a platform for service providers to
advertise their capabilities and for services consumer to
find the information about the service providers who can
provide the requested services.
However, even with directory nodes, the flooding approach in
unstructured P2P is still unavoidable. For instance, when a service provider has
services to offer, it still has to flood the network and advertise to every

27
neighbour node so that the nodes that received the service advertisement
request can become the directory node for the service. The service consumer
will have to go through the same process as well in service discovery to find
any directory nodes. The amount of messages generated from each service
discovery query will still be high and may cause traffic congestion in a P2P
network.
3.2 Distributed service discovery in structured P2P network
As discussed earlier in this chapter regarding using unstructured P2P for
service discovery, the flooding approach used in unstructured P2P results in
high volume of traffic in the network. Hence, structured P2P is proposed to
reduce the traffic generated from the result of flooding in unstructured P2P.
The reason that structured P2P is chosen in the proposed scheme is
because the routing protocol in structured P2P is systematic and well defined.
In structured P2P, each data key is mapped to a peer hence enabling discovery
of data by using only the key, avoiding the need to flood the network. There
are many types of structured P2P systems such as Chord, Pastry, Tapestry,
CAN (Content Addressable Network), and Kademlia (Lua, et al., 2005), each
with its own routing protocol.
One of the aims of this project is to enable both service provider and
service consumer to take part in the distributed service discovery. By allowing
service providers to advertise their capabilities to directory nodes may improve
the service discovery success rate without generating high volume of traffic
during service discovery.

28
The idea of service advertisement and service discovery here was
discussed earlier by Hautakorpi, et al. (2012). In this approach, service
providers perform service advertisement by randomly selecting directory nodes
to advertise their capabilities. Here, the number of directory nodes is
determined based on the probability that requires some global information. The
approach in discussion chose Chord proposed by Stoica, et al. (2001) to be
used as the routing protocol.
On the other hand, the author proposed using brute force for service
discovery. Here, the service consumer divides the Chord overlay into M
locations’ sector head and forwards the service discovery request to each of
sector heads. Each of these sector heads then randomly forward the request to
another node until TTL runs out.
A simulation is carried out in this research work to test the efficiency of
using directory nodes using the approach by Hautakorpi, et al. (2012). As there
is no global information to determine how many directory nodes for each
service should be planted in the simulator, the simulator will be set to randomly
select 10 neighbours of the service provider to become the directory node for
the service type.
The following is the settings used in the simulation:
1. Each node has a unique node identifier (nodeId) generated
randomly
2. Each service type has a unique service identifier (serviceId)
generated randomly.

29
3. There are 10 regions in the network and each node will be
randomly assigned with one region.
4. The total number of service type in the network is 500 and each
node can provide two to three different service types.
5. The total number of service request query generated in the network
is 100,000 and each querying node is randomly selected to send the
request query message.
Figure 3.5 shows the success rate of simulating the distributed service
discovery using Chord. Notice that the success rate when D = 1 has increased
from less than 5% to above 50% when compared with the unstructured
approach at section 3.1.2. Furthermore, the performance in terms of success
rate has improved in all depths when compared with service discovery using
unstructured P2P in section 3.1.1 and section 3.1.2.
Figure 3.5 Success rate for distributed service discovery using structured
P2P system
40
50
60
70
80
90
100
0 2000 4000 6000 8000 10000
Su
cces
s ra
te (
%)
Network size
Depth = 1
Depth = 2
Depth = 3

30
Figure 3.6 Average traffic generated in distributed service discovery
using structured P2P
The reason is both service provider and service consumer are active in the
distributed service discovery approach using structured P2P. Note that the
service providers only choose 10 random nodes from their own neighbourhood
to become directory nodes for each service they can provide. However, as the
number of nodes in the network is increased, the number of directory nodes
will also increase as shown in Figure 3.7. The reason is, each service type will
be advertised to 10 different directory nodes according to the service providers’
routing list. The service providers have more choice of directory nodes to
choose from, preventing overlapping in advertisement requests to the same
directory node.
0
500
1000
1500
2000
2500
3000
3500
4000
1 2 3
Av
era
ge
mes
sag
e/q
uer
y
Depth
N = 3000 nodes
N = 6000 nodes
N = 9000 nodes

31
Figure 3.7 Average number of directory nodes per service type
On the other hand, there are exactly 10 regions in the simulated network
and each node in the network is randomly labelled with a region of their own.
In service discovery, it is better to have a service provider that is near the
service consumer to make sure the connection delay and the traffic generated
are at minimum for both service provider and service consumer to
communicate with each other.
A case is considered as the failure of locality search if it obeys either of
the following conditions:
1. Service consumer is unable to find a service provider in its region
when both service provider and service consumer are in the same
region
2. Service consumer is unable to find directory node that hosts the
type of service it needs when both service provider and service
consumer are in the same region
0
100
200
300
400
500
600
0 2000 4000 6000 8000 10000A
ver
ag
e D
N /
Ser
vic
eTy
pe
Network size

32
The locality search failure percentage in service discovery is also focused
in this simulation and the result is shown in Figure 3.8.
Figure 3.8 Locality search failure of service discovery using structured
P2P
Although the success rate of using directory node for service discovery
shows improvement when compared with approaches without directory nodes,
as shown in Figure 3.8, the locality failure is mostly above 80% for all depths.
Due to the structure of Chord’s finger table that does not emphasize on locality
awareness, when brute force searching is applied on such finger (i.e., routing)
table caused most of the service consumers fail to locate service provider that
is in their proximity and this happens frequently when the network size is
increased. Hence, a better and systematic service searching approach is needed
in order to find suitable and nearer service providers for the service consumers.
40
50
60
70
80
90
100
0 2000 4000 6000 8000 10000
Lo
cali
ty f
ail
ure
(%
)
Network size
Depth = 1
Depth = 2
Depth = 3

33
CHAPTER 4
PREFIX-BASEDADVERTISING AND SEARCHING SCHEME FOR
DISTRIBUTED SERVICE DISCOVERY IN STRUCTURED P2P
NETWORKS
4.1 Introduction
In this chapter, prefix-based searching for service discovery and service
advertisement (PASS) is proposed to improve the overall discovery
performance. That is, in the proposed solution, the prefix of an identifier is
used as a key for identifying directory nodes and for routing on the underlying
P2P network. Directory nodes should not be randomly selected like the
approach discussed in section 3.2 because it would require the brute force
search for them to be identified, which in turn would create the flood of query
traffic. When a directory node can be identified using only the key, the
efficiency in searching can be improved more strategically.
Figure 4.1 shows a summary on the service advertisement and service
discovery process that is proposed. First, the service provider will advertise one
of its services to a directory node. This is done by performing hashing on the
service type in order to obtain a service identifier. A key is extracted from the
service identifier to search for a directory node. Next, the directory node will
add the service provider into a list of service provider. Then when a service
consumer is in need of the service, it will hash the service type to obtain a
service identifier and extract the key from the service identifier to search for

34
the directory node. The directory node will send a copy of the list of service
provider and forwards it back to the service consumer. Finally, the service
consumer can use the list to identify service provider and request service from
the service provider.
Figure 4.1 Service advertisement and service discovery
One of the focuses of this project is to emphasize on locality awareness in
searching for service discovery because it is better for a service consumer to be
able to find a service provider in close proximity. This is to ensure that the
distance in between service provider and service consumer is as close as
possible to avoid delay in delivering the services requested.
Hence, a structured P2P system that is suitable to be integrated with the
proposed system must have locality awareness in its routing protocol. The
Pastry routing P2P network (Rowston & Druschel, 2001) is one of the good
candidates because in Pastry the routing table at each node is constructed
according to the proximity to its neighbours.
In Pastry, each node in the network is identified by a randomly generated
unique node identifier (nodeId) with length of n bits using a hash function. The
Directory node
Service
provider Service
consumer
(4) Request service

35
nodeId can also be generated by hashing the IP address of the node and
expressed in n digits, each digit has a radix of B. When given a key, a Pastry
node can efficiently route the message to any Pastry node that is numerically
closest to the key.
The randomness of nodeId generated and assigned to each node can result
in a uniformly distributed Pastry network. Hence, nodes with adjacent nodeIds
are diverse geographically and nodes in close proximity have diverse nodeId
prefixes. For example, a node with nodeId of 3302 is supposed to be physically
far away from node with nodeId of 3301. Besides this, a node with nodeId of
0123 may be in the same neighbourhood as a node with nodeId of 3012.
Each Pastry node maintains three states as follows:
i. Leaf set
Consist of peer nodes with adjacent nodeIds.
ii. Routing table
Consist of peer nodes that are in close proximity.
iii. Neighbourhood set
Consist of other nodes in close proximity but not listed in
the routing table.
Each Pastry node maintains L nodes in its own leaf set. Note that 𝐿/2
entries are numerically closest smaller than the local nodeId whereas 𝐿/2
entries are numerically closest larger than the local nodeId. The size of routing
table consists of 𝑙𝑜𝑔𝐵𝑁 × (𝐵 − 1) entries where N represents the number of
nodes in the network.

36
In Pastry, when presented a message with a numeric key, a node will use
the key to search from its routing table in order to forward the message to the
next hop. Since all nodes shown in the routing table are physically close to the
node, based on the construction principle of routing table in Pastry, this enables
the searching to start from its close proximity.
The Pastry routing process requires leaf set and routing table. Given a
message, the node first checks to see if the key is within the range of nodeIds
covered by its leaf set. If such node exists, then it is the nodeId that is
numerically closest to the key and the message will be forwarded to that node.
The routing table is used if the key is not covered by the leaf set. The message
is forwarded to the node that shares a common prefix with the key by at least
one more digit. In cases where no such node exists, the message is forwarded
to the node that shares a prefix with the key at least as long as the local node
and is numerically closer to the key than the current node.
The node entries in Pastry routing table is arranged according to the
prefixes of nodeIds. The nodeId in row 𝑝 column 𝑞 has the same first digits
with that of the local node, and the 𝑝 + 1𝑠𝑡 bit is 𝑞, where 0 ≤ 𝑝 ≤ 𝑙𝑜𝑔2𝐵 − 1,
and 0 ≤ 𝑞 ≤ 𝐵 − 1. For example, given a Pastry network that is assigned with
16-bit node identifier space and is identified by a sequence of digits with base,
B where B = 4. The routing table can be expressed as shown in Figure 4.2
where the first row of a Pastry node routing table contains nodeIds that have a
distinct first digit. The distinct value is taken from the set{0, 1, 2, 3} . The
second row of a Pastry node routing table contains nodeIds that share the first
digit prefix with the Pastry nodeId but different in the second digit. A simpler
explanation is, nodes in row 0 share 0 prefix with the nodeId, nodes in row 1

37
share only 1 digit prefix with the nodeId, nodes in row 2 share 2 digits prefix
with the nodeId, and so forth.
Figure 4.2 Example of routing table state for Pastry node with nodeId =
3302, B = 4, and n = 4 digits
When a new node N joins a Pastry network, it has to go through node A
that is already in the network. Node A is known as the contact node of node N.
The joining process continues as node N performs lookup using its own
identifier as the key. As Pastry routing will bring the lookup message to the
node that is numerically closest to the key, hence the information of each node
along the path from node A to the targeted destination will be used to help
node N builds its own routing table.
For example, given the join request of node N has passed through node A,
B, C and finally reaching the node Z whose nodeId is numerically closest to
node N. The leaf set of node N can be constructed based on the leaf set of node
Z. As node A is usually in the proximity of node N, hence the neighbourhood
set of node A is suitable for node N.
If node N does not share any common prefix with node A, then entries in
row zero of node A routing table can be used to construct row zero of node N
routing table as row zero of the routing tables are not dependent on one’s

38
nodeId. Next, row one of node N routing table can be obtained from row one of
node B routing table, given that both N and B share one digit common prefix in
their nodeId. Similarly, row two of node N routing table can be obtained from
row two of node C routing table if both node N and C share two digit common
prefix in their nodeId.
4.2 Service advertisement and service discovery
This sub-section discusses the in-depth of service advertisement and
service discovery using prefix based routing.
4.2.1 Service advertisement
In the prefix based routing scheme, the key is generated by hashing the
service type a service provider can provide. The hashed service type will return
the serviceId that will be used as the key for routing. In service advertisement,
searching for a directory node only requires the first m bits of the serviceId,
where 𝑙𝑜𝑔2𝐵 ≤ 𝑚 ≤ 𝑛. Note that any nodes that share the same m prefix bits
with the key are eligible to become a directory node.
The following are the steps for service advertisement:
(1) Service provider hashes the service type to get the serviceId.
(2) The first m bits of serviceId are extracted and used as the key.
(3) The service provider sends a service advertisement message using
Pastry routing to search for any directory nodes that share the same
prefix of m bits as the key.
(4) The directory node that receives this service advertisement message
will add the information of the service provider and capability of the

39
service provider into a list of service provider hosted by the directory
node.
(5) The directory node then forwards the service advertisement message to
all nodes from its routing table whose nodeId also share the same
prefix of m bits as the key and those nodes that receive this message
will also add the information of service provider into the list of service
provider.
Figure 4.3 shows an example of service advertisement. Step 1 shows node
A, the service provider hashes the service type that it can provide to obtain a
serviceId, say in this example, serviceId of 1230. Then the first m bits of the
serviceId are extracted to become the key. At step 2, Pastry routing using the
key is shown as node A forwards the service advertisement request to node B
whose nodeId is numerically closest to the key according to node A’s routing
table. At step 3, node B forwards the service advertisement request to node D
because node D has a nodeId that is numerically closest to the key and that it
also shares the same prefix with the key. Finally, node D becomes the directory
node for the service type of 1230 and the information about the service
provider, node A is added into the list of service type 1230 as shown in the
figure. On the other hand, node D is also the directory node for service type
1201 as well because they share the same prefix of 2 digits as the key. The
service advertisement continues as shown in the figure where the directory
node D further forwards the service advertisement request to all nodes in its
routing table that share the same prefix key as highlighted in blue.

40
Figure 4.3 Service advertisement example where B = 4, n = 8 bits (4
digits), and m = 4 bits (2 digits)
4.2.2 Service discovery
The overall concept of service discovery is almost similar with service
advertisement. The service discovery starts with a service consumer who is in
need of a particular service. Then the service consumer hashes the service type
that it needs to get the serviceId and then extract the first m bits of the serviceId
to be the key.
The following are the steps for service discovery:
(1) Service consumer hashes the service type to get the serviceId.
(2) The first m bits of serviceId are extracted and used as the key.
Routing table of Node 1212:
Routing table of Node 1101:
Routing table of Node 3302: Service Type: GPU
Hash(GPU): 1230
Key: 12
Node A (3302)
Node B (1101)
Service Provider
Directory Node
Node D (1212)
Node O (1203)
Node P (1221) Node Q (1233)
(1)
(2)
(3)
Row 0 0123 1101 2000 -
Row 1 3032 3112 3231 -
Row 2 - 3312 3322 3330
Row 3 3300 3301 - 3303
Row 0 0233 - 2000 3001
Row 1 1003 - 1212 1321
Row 2 - 1111 1121 1130
Row 3 1100 - 1102 1103
Row 0 0212 - 2300 3120
Row 1 1021 1133 - 1300
Row 2 1203 - 1221 1233
Row 3 1210 1211 - 1213
Service 1230
Node A 3302
Service 1230
Node A 3302
Service 1230
Node A 3302
Service 1230
Node A 3302
Node K 2103

41
(3) The service consumer sends a service discovery message using Pastry
routing to search for any directory nodes that share the same prefix of
m bits as the key.
(4) The directory node that receives this service discovery message will
send a copy of the service provider list to the service consumer.
(5) If the directory node does not have the list of service provider
requested, the directory node forwards the service discovery request to
all nodes in its routing table whose nodeId share the same prefix of m
bits as the key. These nodes that received the service discovery request
will forward a copy of the service provider list to the service consumer.
An example of service discovery is illustrated in Figure 4.4. At step 1, the
service consumer, node P hashes the service type that it needs to get a serviceId,
say in this example, serviceId of 1230. Then, the key is extracted and is used
for routing at step 2 where the service consumer forwards the service discovery
query to node Q whose nodeId is 1102 because node Q is numerically closest
to the key. When node Q receives the service discovery request, it continues to
forward the service discovery request to node D whose nodeId is numerically
closest to the key from node Q’s routing table of at step 3. Finally, the service
discovery message arrives at node D whose nodeId shares the same 2 digit
prefix with the key, which also indicate that node D is the directory node for
the service type 1230.

42
Figure 4.4 Service discovery example where B = 4, n = 8 bits (4 digits),
and m = 4 bits (2 digits)
As shown in Figure 4.4, node D is currently the directory node for both
serviceId of 1201 and serviceId 1230. At step 4, since the requested service
type is 1230, hence node D will make a copy for the service list 1230 that
contains both node A and node K back to the service consumer, node P. Note
that, if the directory node D does not have the list of service provider requested,
the directory node can forward the service discovery request to all nodes in its
routing table that share the same 2 digit prefix with the key. These nodes that
received the service discovery request will forward a copy of the service
provider list to the service consumer if they have the list.
4.3 The selection of m
The selection of m bits as the prefix key will affect the number of
directory nodes in the network. Although more directory nodes in the network
Routing table of Node 2131: Service Type: GPU
Hash(GPU): 1230
Key: 12
Node P (2131)
Node Q (1002)
Service Consumer
Directory Node
Node D (1212)
Routing table of Node 1002:
(1)
(2)
(3) (4)
Row 0 0312 1002 - 3100
Row 1 2032 - 2200 2323
Row 2 2100 2111 - 2131
Row 3 2130 - 2132 2133
Row 0 0012 - 2000 3101
Row 1 - 1132 1212 1323
Row 2 - 1101 1020 1032
Row 3 - 1001 - 1003
Service 1201
Node G 2000
Service 1230
Node A 3302
Node K 2103

43
may increase the success rate, also other factors have to be analysed before
determining what should be the value of m.
4.3.1 Smaller m
A smaller m can result in more directory nodes in the network. For
example, when the value of m is set to 0, any node in the network is eligible to
become the directory node of any service type. This is typically the brute force
advertisement because the service providers can advertise their capabilities to
any nodes in the network. Hence, smaller m enables more choices to map
between services and directory nodes.
Since smaller m can result in directory nodes to be closer to the service
providers, the travelling path to locate a directory node is shorter. However, a
small m may cause the service providers and service consumer to be unable to
meet at a common directory node. This event is illustrated in Figure 4.5.
Figure 4.5 Impact of small m
4.3.2 Larger m
Larger m may result in smaller number of directory nodes in the network.
This is because there will be fewer choices to map between services and
Service
Provider
Service
Consumer
Directory nodes

44
directory nodes in the network. Besides, larger m may cause the services to be
mapped to directory nodes that are far from the service provider. Thus a
directory node may not be located in the close proximity of service provider.
However, if m is sufficiently large, it would be easier for service provider and
service consumer to meet at a common directory node. Figure 4.6 illustrates
this example where a common directory node is found.
Figure 4.6 Impact of large m
4.4 Performance measure
The service discovery success rate of the proposed scheme is bounded by
two factors:
1. Success rate in identifying a directory node
The success rate in identifying a directory node shown in Figure
4.7 is higher when the value of m is small and the success rate will
start to decrease as the value of m increases. This phenomenon has
been explained in the previous sub-section 4.3.
Service Provider Service
Consumer
Directory nodes

45
Figure 4.7 Success rate in identifying a directory node
2. Probability that a directory node contains the required list of
service providers
There could be many nodes in the network that can become the
directory node for a particular service type as long as the directory
nodes share the same prefix as the key. However, not all of the
potential directory nodes are chosen by the service providers to
advertise their services. Hence, directory nodes that are found by
service consumers may or may not contain the required list of
service providers. Figure 4.8 shows the probability that a directory
node contains the required list of service provider increases as the
value of m increases. This shows that when the value of m is small,
it is harder for service provider and service consumer to meet at the
common directory node.
0
20
40
60
80
100
0 2 4 6 8Su
cces
s ra
te (
%)
m (digits)

46
Figure 4.8 Probability that a directory node contains the required
list of service providers
The combination of these two factors will yield the service
discovery success rate shown in Figure 4.9. This shows that there is
an optimal point of m where 0 ≤ m ≤ n.
Figure 4.9 Service discovery success rate
4.5 The prefix-based advertising and searching scheme simulations
In order to test the performance of the proposed scheme (PASS),
simulations are carried out in a Pastry network that consists of 6000 active
nodes. The node identifier address field used in the simulation is 16 bits. It is
assumed that there are 500 types of services and their unique serviceIds are
randomly generated. Each node in the network can provide two or three service
0
20
40
60
80
100
0 2 4 6 8Pro
ba
bil
ity
a D
N
con
tain
s th
e
req
uir
ed l
ist
m (digits)
0
20
40
60
80
100
0 2 4 6 8
Per
cen
tag
e (%
)
m (digits)
Factor #1
Factor #2
Discovery Success
rate(%)

47
types and the serviceIds are randomly chosen from the pool of 500 serviceIds.
There are in total 10 regions and each node is randomly assigned with one
region. In order to measure the latency between nodes in the simulation, the
latency between each node is generated according to the region they are
assigned to. The following table shows the latency range between nodes:
Table 4.1 Latency range between nodes
Type Latency
Contact node 1-5 ms
Same region 6-20 ms
Different region 100-200 ms
The simulation starts with service advertisement. Each service provider
advertises the services they can provide to directory nodes. For service
discovery request, service consumer is randomly chosen to perform service
discovery. The service consumers are set to randomly choose a serviceId as the
requested service. In the simulation, 100,000 of service discovery requests will
be generated.
Two simulations with different settings are conducted to measure the
performance of the proposed scheme in a large node identifier space. In the
first simulation, known as Simulation-I, the value of its base is set to 4 whereas
in the second simulation, known as Simulation-II will have the value of its base
set to 16.
4.5.1 Simulation-I results and discussion
The specific setting used in this experiment is that the node identifier
space is 16 bits and is represented in 8 digits, where each digit is presented
with 2 bits. Besides that, the base that is used in the simulation is 4 (B = 4)

48
hence, the routing table size of each Pastry node consist of 4 columns and 8
rows, giving each node a maximum number of 24 neighbours which is around
0.4% of the network information.
Figure 4.10 shows the influence of m value to the performance of PASS in
terms of service advertisement success rate and service discovery success rate.
The figure shows that as the value of m increase, it is harder for the service
provider to find directory nodes that share the same prefix as the key hence
causing the success rate in advertisement to decrease.
Figure 4.10: Simulation-I result
Figure 4.10 shows as the value of m increases, the value of the probability
of non-empty directory node lists also increases. This is because the service
advertisement by service providers starts from a smaller distance to a larger
distance as m increases. From the results, it seems that most of the service
providers and service consumers are able to meet at common directory nodes
when m = 3, implying that the optimal value of m in this experiment is 3 digits.
Finally, Figure 4.10 also shows that the service discovery success rate is
bounded by the service advertisement success rate and the probability of non-
0
20
40
60
80
100
0 2 4 6 8
Per
cen
tag
e (%
)
m (digit)
Advertisement Success
rate(%)
Probability of non-
empty DN list
Discovery Success
rate(%)

49
empty directory node lists. The figure shows that the highest discovery success
rate is 91.7%.
Figure 4.11 shows the performance of PASS in terms of latency. The
figure demonstrates that as m increases, both average latency from service
consumer to directory node and average latency from service provider to
directory node also increase. This is because the range of service advertisement
and service discovery also increases with m. On the other hand, the average
latency from service consumer to service provider is less than 64 ms. This
shows that most service consumers are able to locate a nearby service provider.
Figure 4.11 Simulation-I: Average latency of prefix-based service
discovery
Figure 4.12 shows the locality failure of prefix-based searching in the
proposed scheme. When m = 3, the service discovery records the highest
success rate at 91.7% but the locality failure at this point is 43.4%. This means
that there are around 43% of the successful service discovery cases where the
service consumers are unable to find a nearby service provider, even it exists in
the region.
0
50
100
150
200
250
300
350
0 2 4 6 8
Av
era
ge
late
ncy
(m
s)
m (digit)
Average Latency SC
to DN
Average Latency SP
to DN
Average Latency SC
to SP

50
Figure 4.12 Simulation-I: Locality failure of prefix-based service
discovery
Furthermore, at m = 0, the locality search failure is the lowest when
compared with other values of m. This is because both service providers and
service consumer will tend to advertise and search from their own region.
Although the success rate of service discovery for m = 0 is low, this shows that
whenever a service consumer found a directory node to get the service provider
that it needs, the service providers found will be nearby.
However, the locality search failure slowly decreasing from m = 1 to m =
4 which means that service providers and service consumers are able to
gradually meet at the common directory node and the optimal point is at m = 4.
The locality search failure starts to increase after m = 4 because the service
consumer would tend to find service providers that are far from it as the radius
of service advertisement and service discovery becoming bigger.
Even so, the prefix-based service discovery approach has much lower
percentage in locality search failure compared with the distributed service
discovery scheme in section 3.2. This means that the proposed approach, PASS
has achieved the objective of locality awareness.
0
20
40
60
80
100
0 2 4 6 8
Lo
cali
ty f
ail
ure
(%
) m (digit)

51
4.5.2 Simulation-I with only 0.1% of service providers
In this sub-section, the performance of PASS in terms of effectiveness is
evaluated by limiting the number of available service providers in the network.
In this simulation, we test whether rare services can be located by the proposed
approach or not.
The simulation is carried out by inducing only 6 service providers for each
service type resulting in only 0.1% of service providers are made available in a
network of 6000 nodes. The setting used in this experiment consists of 16 bits
of node identifier space, represented in 8 digits where each digit is presented
with 2 bits. The base, B is set to 4 and there are 6000 number of active nodes
simulated in the network. The assignment of each serviceId to service
providers is done by randomly choosing six nodes from the network and each
service provider can only be assigned with a maximum number of 3 serviceId.
The simulation will induce 100,000 service discovery requests and each
request is performed by randomly selecting service consumers from the
network.
Figure 4.13 shows the simulation results in terms of service advertisement
and service discovery success rate. The simulation with only 0.1% of service
providers available in the network can achieve 70.14% of discovery success
rate at m = 3 digits. Besides, the discovery success rate is again bounded by the
advertisement success rate and the probability of non-empty directory node list
as shown in the figure.

52
Figure 4.13 Simulation-I result with 0.1% of service providers
Figure 4.14 shows that the average latency from service consumer to
service provider remains under 100 ms for most of the time except when m = 3.
This shows that in most of the successful discovery cases, the service
consumers are able to locate a nearby service provider even though there are
only 0.1% of service providers available in the network.
Figure 4.14 Average latency for 0.1% of service provider simulation-I
The above simulation results shows that highest service discovery rate is
achieved when m = 3. Figure 4.15 shows discovery success rate increases when
the number of service providers for each service is increased when m = 3.
Furthermore, Figure 4.16 shows that the locality failure rate is between 40%
0
20
40
60
80
100
0 2 4 6 8P
erce
nta
ge
(%)
m (digit)
Advertisement
Success rate(%)
Probability of
non-empty DN list
Discovery Success
rate(%)
0
100
200
300
400
0 2 4 6 8
Av
era
ge
late
ncy
(m
s)
m (digit)
Average Latency SP
to DN
Average Latency SC
to DN
Average Latency SC
to SP

53
and 60% where the locality failure rate decreases when the number of service
provider for each type of service is increased.
Figure 4.15 Simulation-I: Service discovery success rate when m = 3 and
N = 6000
Figure 4.16 Simulation-I: Locality failure rate when m = 3 and N = 6000
4.5.3 Simulation-II results and discussion
The setting in this simulation is almost the same as Simulation-I, which is
conducted in a network of 6000 nodes. The differences are the base, B that is
used in this section is 16 (B = 16), and the node identifier is represented in 4
digits. For example, given the length of node address space is 16 bits and is
represented in 4 digits where each digit is equal to 4 bits. The Pastry routing
0
20
40
60
80
100
1 6 11 16 21 26
Dis
cov
ery
su
ccess
ra
te
(%)
Number of SP for each type of service
0
20
40
60
80
100
1 6 11 16 21 26
Lo
cali
ty f
ail
ure
ra
te (
%)
Number of SP for each type of service
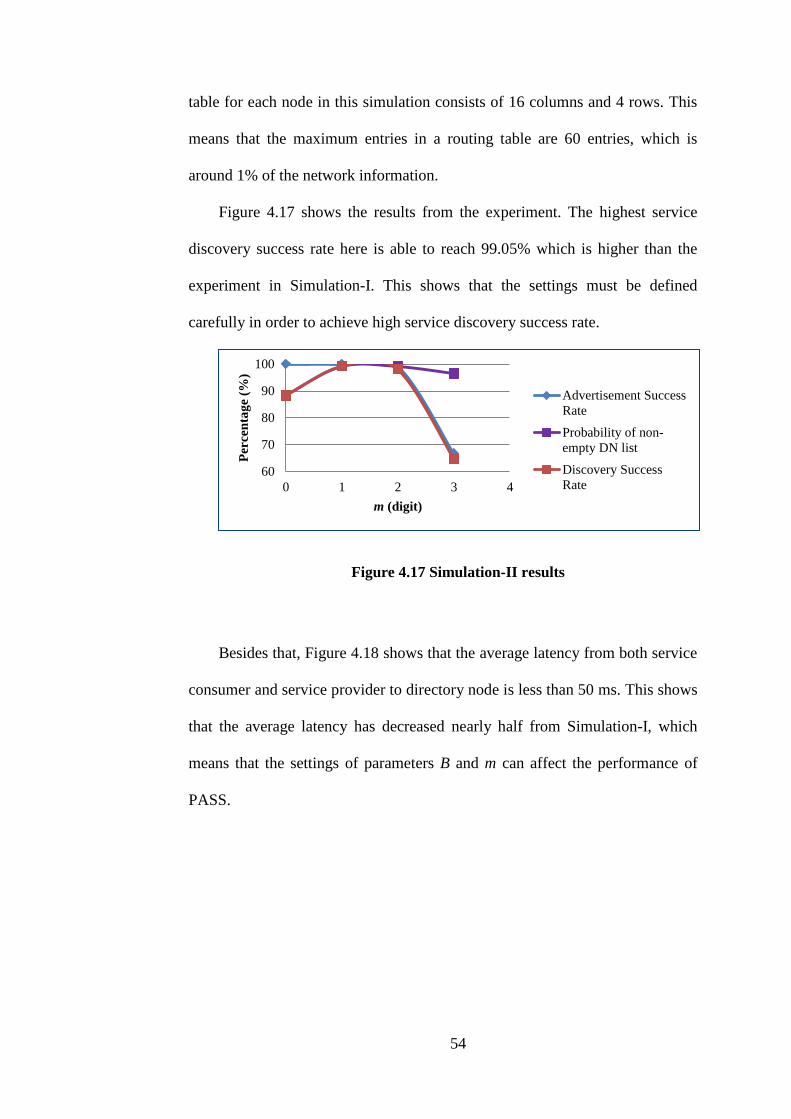
54
table for each node in this simulation consists of 16 columns and 4 rows. This
means that the maximum entries in a routing table are 60 entries, which is
around 1% of the network information.
Figure 4.17 shows the results from the experiment. The highest service
discovery success rate here is able to reach 99.05% which is higher than the
experiment in Simulation-I. This shows that the settings must be defined
carefully in order to achieve high service discovery success rate.
Figure 4.17 Simulation-II results
Besides that, Figure 4.18 shows that the average latency from both service
consumer and service provider to directory node is less than 50 ms. This shows
that the average latency has decreased nearly half from Simulation-I, which
means that the settings of parameters B and m can affect the performance of
PASS.
60
70
80
90
100
0 1 2 3 4
Per
cen
tag
e (%
)
m (digit)
Advertisement Success
Rate
Probability of non-
empty DN list
Discovery Success
Rate

55
Figure 4.18 Simulation-II: Average latency of prefix-based service
discovery
Figure 4.19 shows at m = 1, the locality failure is at 12.51% when the
successful service discovery rate is at 92.96% as shown in Figure 4.17.
Compared with Simulation-I, the locality failure at the highest service
discovery rate has dropped from 43.4% to 12.51%.
Figure 4.19 Simulation-II: Locality failure of prefix-based service
discovery
4.5.4 Simulation-II with only 0.1% of service providers
Using the same settings in as previous sub-section 4.5.3, another
simulation is conducted using only 6 service providers for each service type in
the network of 6000 active nodes yields the following results:
0
50
100
150
200
250
0 1 2 3 4A
ver
ag
e la
ten
cy (
ms)
m (digit)
Average Latency SC
to DN
Average Latency SP
to DN
Average Latency SC
to SP
0
20
40
60
80
100
0 1 2 3 4Lo
cali
ty f
ail
ure
(%
)
m (digit)

56
Figure 4.20 below shows that even with 0.1% of the service providers are
available, PASS can still reach 92.96% of successful discovery rate at m = 1.
This shows that the proposed solution is able to locate rare services with high
success rate.
Figure 4.20 Simulation-II with 0.1% of service providers
Figure 4.21 shows that even with 0.1% of service providers, average
latency from service consumer to service provider is 83 ms while the average
latency from both service providers and service consumers to directory node is
less than 20 ms. This shows that in most of the successful service discovery
cases, the service consumers are able to locate a nearby service provider even
though there are only 0.1% of service providers available in the network.
30
40
50
60
70
80
90
100
0 1 2 3 4
Per
cen
tag
e (%
)
m (digit)
Advertisement
Success rate(%)
Probability of non-
empty DN list
Discovery Success
rate(%)

57
Figure 4.21 Simulation-II: Average latency for 0.1% of service provider
As shown in all the results above, when the prefix key for service
discovery and advertisement, m is equal to 1, the service discovery success rate
is at its highest. The following Figure 4.22 shows the discovery success rate
increases when the number of service providers for each service is increased
when m = 1. Furthermore, Figure 4.23 shows that the locality failure rate is
below 20%. This means that the locality awareness of PASS is preserved.
Figure 4.22 Simulation-II: Service discovery success rate when m = 1 and
N = 6000
0
50
100
150
200
250
0 1 2 3 4L
ate
ncy
(m
s)
m (digit)
Average Latency SP to
DN
Average Latency SC to
DN
Average Latency SC to
SP
50
60
70
80
90
100
1 6 11 16 21 26Dis
cov
ery
su
ccess
ra
te (
%)
Number of SP for each type of service

58
Figure 4.23 Simulation-II: Locality failure rate when m = 1 and N = 6000
In conclusion, the prefix-based advertising and searching scheme (PASS)
shows superior performance when compared with the approaches discussed in
the previous chapter. In this chapter, we have proved that PASS is able to
provide locality awareness in searching with lower volume of traffic in the
network and can maintain high service discovery success rate. Besides that,
the simulation of PASS in a network that consists of 0.1% of service providers
further proved the effectiveness of PASS in locating rare services as 92.9% of
service discovery success rate is achieved.
0
5
10
15
20
25
1 6 11 16 21 26Lo
cali
ty f
ail
ure
ra
te (
%)
SP for each service type

59
CHAPTER 5
CUMULATIVE PREFIX-BASED ADVERTISING AND SEARCHING
SCHEME FOR DISTRIBUTED SERVICE DISCOVERY IN
STRUCTURED P2P NETWORKS
5.1 Introduction
From the simulation study, PASS for distributed service discovery
proposed in Chapter 4 has satisfactory performance in all aspects as compared
with the existing schemes. However, the scheme can be further improved by
slightly modifying the algorithm service advertising and searching. For
example, instead of searching only for directory nodes of which the nodeIds
share the same prefix of m bits with the serviceId, the performance can be
enhanced by enabling the search cumulatively from the nodes sharing 0 prefix
bits incrementally to m prefix bits. That would greatly increase the number of
directory nodes along the path to the destination nodes and thus increasing the
chances of service capabilities to be found. In this chapter, we introduce a
cumulative prefix-based advertising and searching scheme (CPASS).
The following sub-sections describe service advertisement and service
discovery in CPASS. Next, the simulation results of CPASS and the
comparison between PASS and CPASS are shown and discussed.
5.1.1 Service advertisement
The steps taken in service advertisement are almost similar to the steps in
PASS. A new variable, r is introduced in CPASS where 0 ≤ r ≤ m. Here, r will

60
act as a running variable in both service advertisement and service discovery.
In order to provide a better explanation, the term main-branch node is
introduced. In Pastry, when presented a message with a numeric key, a node
will use the key to search from its routing table in order to forward the message
to the next node until the message reaches its destination. Each node along the
path is known as the main-branch node. A level-r main-branch node shares the
same r prefix bits with the key.
Given m = 2 and the variable r is initialised with 0, Figure 5.1 illustrates
an example of service advertisement by the service provider where the main-
branch directory nodes are node A, B and D. The numbers of bits in the node
identifier space are presented in digits in the example (i.e., 2 bits in 1 digit).
As shown in Figure 5.1, the service advertisement starts with the service
provider, node A hashes the service type that it can provide at step 1 and the
key 12 is extracted from the serviceId 1230. The main-branch nodes A, B, and
D are shown in the figure and these nodes will be responsible to do the service
advertisement. The service provider (node A) is known as the level-0 main
branch node. Hence, it will become the directory node for the service it can
provide. Besides, the all routing table entries in row-0 of node A, as
highlighted in blue, will also become the directory node for the service 1230 as
they currently share zero digit prefix with the key. When proceeding to the next
main-branch node, the value of r in digit is incremented by 1.
At step 2, using Pastry routing, the next main branch node is node B,
whose nodeId is 1101 because it is numerically closest to the key according to
node A’s routing table. The current variable of r is 1, as node B shares 1 digit

61
prefix as the key. Thus, node B will forward the service advertisement request
to all nodes of row 1 in its routing table and these nodes will also become the
directory node for service 1230. When proceeding to the next main-branch
node, the value of r will be incremented with 1 again, producing r = 2, as
shown at step 3 in the figure.
Figure 5.1 Cumulative prefix-based service advertisement
Note that the current variable is r = 2 at the main-branch node D (1212),
hence the service provider has to advertise service 1230 to every node that
shares r digit prefix as the key. Shown in the routing table of Node D, every
node in row 2 is eligible to become the directory node for service 1230 because
Node A (3302)
Node B (1101)
Service Provider
Node D (1212)
Service Type: GPU
Hash(GPU): 1230
Key: 12
Routing table of Node 1212:
Routing table of Node 1101:
Routing table of Node 3302:
Node M (0123) Node N (2000)
Node L (1003) Node K (1321)
Node P (1221) Node O (1203) Node Q (1233)
(1)
(2)
(3)
𝑟 = 0
𝑟 = 1
𝑟 = 2
Row 0 0123 1101 2000 -
Row 1 3032 3112 3231 -
Row 2 - 3312 3322 3330
Row 3 3300 3301 - 3303
Row 0 0233 - 2000 3001
Row 1 1003 - 1212 1321
Row 2 - 1111 1121 1130
Row 3 1100 - 1102 1103
Row 0 0212 - 2300 3120
Row 1 1021 1133 - 1300
Row 2 1203 - 1221 1233
Row 3 1210 1211 - 1213

62
they also share 2 digit prefix with the key. The service advertisement stops now
because the value of r has been incremented until it is equal to the value of m.
The following describes the algorithm for service advertisement in
CPASS:
1. Service provider (SP) hashes the service type it can provide to
generate a serviceId and then extract the first m bits of serviceId to
be the key.
2. Service provider performs lookup search for any directory nodes of
which the nodeIds share the same prefix of m bits with the
serviceId. Note that the path from service provider to the node
sharing the same prefix of m bits with the serviceId is referred to as
the main-branch of advertisement. All nodes along this path are
called the main-branch nodes, and the service provider itself is
defined as the level-0 main-branch node. Besides, all the main-
branch nodes help the service provider to do advertisement.
3. A running variable, r is set with an initial value of 0 where 0 ≤ r ≤
m.
4. If a service advertisement request from a service provider reaches a
main-branch directory node who shares at least r bits prefix with
the key, the information of the service provider will be added into
a service provider list in that particular directory node. Note that if
the directory node is not found, then the service advertisement
stops and this particular service advertisement request is consider
failed and shall not proceed to the next step.

63
5. The main-branch directory node will forward the service
advertisement request message to nodes in the r-th row of its
routing table where all nodes in the r-th row share the same r bits
prefix with the key.
6. The r-th row directory nodes that receive the service advertisement
request query from the main-branch directory node will add the
information of the service provider to their own list of service
provider.
7. If r ≤ m, increment the value of r by 1 and repeat step 4, 5, and 6.
Stop the service advertisement request if the value of r exceeds m.
5.1.2 Service discovery
Given m = 2 and the variable r is initialised with 0, Figure 5.2 illustrates
an example of service discovery by the service consumer:
The service discovery starts with the service consumer node P hashes the
service type that it can provide at Step 1 and the key 12 is extracted from the
serviceId 1230. The main-branch nodes, P, Q, and D are shown in Figure 5.2
and these nodes will be responsible to help the service consumer to do service
discovery. As the service consumer, node P is known as the level-0 main
branch node, hence it will check its own list of service provider for the service
it needs. Besides, node P will also forward the service discovery message to all
routing table entries in row-0 of node P, highlighted in blue, for the service
1230 as they currently share 0 digit prefix as the key. If any of these directory
nodes have the list of service providers requested, the list of service provider
will be forwarded back to the service consumer node P and the service
discovery stops here without proceeding to Step 2.

64
Figure 5.2 Cumulative prefix-based service discovery
However, if none of the directory nodes in level-0 has the list of service
providers requested, the service discovery request will be forwarded to the next
main-branch node, with an incremented value of r as shown at Step 2 in Figure
5.2. As node Q receives the service discovery request, it forwards the request to
all level-1 directory nodes in its routing table, as highlighted in blue in the
figure. If any of these directory nodes has the list of service provider requested,
the list will be forwarded to the service consumer and the service discovery
shall stop here without proceeding to Step 3.
Note that each time the service discovery proceeds from one main-branch
directory node to the next main-branch directory node, the value of r must be
(1)
(2)
(3)
Node P (2131)
Node Q (1002)
Service Consumer
Node D (1212)
Routing table of Node 1212:
Routing table of Node 1002:
Routing table of Node 2131: Service Type: GPU
Hash(GPU): 1230
Key: 12
Node G (0312) Node H (3100)
Node L (1132) Node K (1323)
Node O (1203) Node Q (1233) Node O (1203)
𝑟 = 0
𝑟 = 1
𝑟 = 2
Row 0 0312 1002 - 3100
Row 1 2032 - 2200 2323
Row 2 2100 2111 - 2131
Row 3 2130 - 2132 2133
Row 0 0012 - 2000 3101
Row 1 - 1132 1212 1323
Row 2 - 1101 1020 1032
Row 3 - 1001 - 1003
Row 0 0212 - 2300 3120
Row 1 1021 1133 - 1300
Row 2 1203 - 1221 1233
Row 3 1210 1211 - 1213

65
incremented by 1. The service discovery shall continue to proceed until the
value of r is equal to the value of m or at any phase where the list of service
provider is found.
The following describes the algorithm for service discovery in the
cumulative scheme:
1. When a service consumer (SC) is in need of a specific service, it hashes
the service type in need to generate the serviceId by using a hashing
algorithm and then extract the first m bits of serviceId to be the key.
2. Service consumer performs lookup search for any directory nodes that
shares the same prefix of m bits with the serviceId. Note that the path
from service consumer to the node sharing the same prefix of m bits
with the key is referred to as the main-branch of discovery. All nodes
along this path are called the main-branch nodes, and the service
consumer itself is defined as the level-0 main-branch node. Similar to
service advertisement, all the main-branch nodes help the service
consumer to do service discovery.
3. A running variable, r is set with an initial value of 0 where 0 ≤ r ≤ m.
4. If a service discovery request from a service consumer reaches a main-
branch directory node who shares at least r bits prefix with the key, the
list of service providers will be retrieved from the main-branch
directory node and forwarded back to the service consumer. Note that if
the directory node is not found, then the service discovery request is
considered failed and shall not proceed to the next step.

66
5. If the directory node does not have the list of service provider requested,
the main-branch directory node will forward the service discovery
request to nodes in the r-th row of its routing table where all nodes in
the r-th row shares the same prefix bits as the key.
6. The r-th row directory nodes that receive the service discovery request
query from the first directory node will forward the list of service
providers back to the service consumer.
7. If none of these directory nodes have the list of service provider
requested by the service consumer and r ≤ m, then increment the value
of r by 1 and repeat step 4, 5, 6, and 7. Note that if the value of r is
larger than m, and the list of service provider is not found, then the
service discovery is considered failed.
5.2 Simulation results and discussion
Simulations are carried out to test the performance of cumulative prefix-
based service advertisement and searching scheme (CPASS). The settings in
the simulation consist of 16 bits of node identifier address space, represented in
4 digits. The base, B is 16 and the other settings will be similar to the
simulation settings in 4.5.3 except the network size will vary from 1000 nodes
to 10000 nodes but the focus is on network with size 6000 nodes. The reason is,
given the node identifier space is 16 bits where there are 216
, or 65536 unique
node identifiers that can be assigned to each node before collision in
assignment of node identifiers take place. Thus, in a full network that consist of
65536 nodes with each node has a unique node identifier, 6000 nodes is almost
10% of the maximum network size.

67
Note that our proposed schemes can actually be implemented on both
Pastry and Chord. However, as discussed in the literature review, although
Chord is also a popular structured P2P approach for resource sharing, it does
not provide locality awareness. Hence, two simulations on CPASS are
conducted where Pastry will be used in the first simulation and Chord will be
used in the second simulation in order to compare the performance of CPASS
on the two P2P protocols. Note that both simulations on Chord and Pastry have
the same settings as described in section 4.5. Both simulations have the base of
the node address identifier space set to 16, and the node identifier is
represented in 4 digits.
5.2.1 Simulation on Pastry network
The bounding first factor discussed in PASS (section 4.4) is not applicable
here because every service advertisement should be successful considering the
service provider is the directory node for the service type that it can provide as
well as all row-0 nodes from its routing table, unless there is no entry at all in
the routing table of the service provider, which cannot be true since the
provider already joined the network. Due to this, the service discovery success
rate in CPASS will definitely outperform PASS described in Chapter 4.
Figure 5.3 shows the simulation conducted in networks that consist of
numbers of nodes from 1,000 to 10,000 nodes, with increment 1000 nodes.
From the figure, it is shown that higher success rate is achieved when the value
of m is more than one and when the network size increases.

68
Figure 5.3 Service discovery success rate in CPASS on Pastry network
The following simulation results focus on the network service discovery
success rates with respect to different values of m in the network that consists
of 6000 nodes as this represents 10% of the entire network.
As shown in Figure 5.4, the service discovery success rate in CPASS
shows some improvement at all digit of m. The comparison Table 5.1 shows
that the service discovery rate can reach as high as 99% in both PASS and
CPASS but CPASS shows that the success rate is more stable when the value
of m is increased.
Figure 5.4 Service discovery success rate in network size of 6000 nodes
on Pastry network
75
80
85
90
95
100
0 2000 4000 6000 8000 10000S
ucc
ess
rate
(%
) Network size
m = 0
m = 1
m = 2
m = 3
86
88
90
92
94
96
98
100
0 1 2 3 4
Su
cces
s ra
te (
%)
m (digit)

69
Table 5.1 Comparison of discovery success rate between prefix-based
scheme (PASS) and cumulative prefix-based scheme (CPASS) on Pastry
network
m Prefix-based advertising and searching
scheme
Cumulative prefix-based advertising
and searching scheme
0 86.38 % 87.54 %
1 99.56 % 99.87 %
2 98.70 % 99.86 %
3 59.07 % 99.88 %
On the other hand, Figure 5.5 shows the average traffic in terms of the
number of query messages generated per service discovery request in CPASS.
This figure shows the significant improvement of this scheme when compared
with the distributed scheme in section 3.2.
Figure 5.5 Traffic generated in service discovery of cumulative prefix-
based scheme on Pastry network
Furthermore, Table 5.2 shows the comparison of both schemes traffic
generated in network of 6000 nodes. The table also shows that there is no need
to flood the network as using the cumulative prefix-based scheme can achieve
99% of discovery success rate. When the value of m increases, the search
radius and success rate will also increase but it will not increase the traffic
0
10
20
30
40
50
0 1 2 3 4
Tra
ffic
gen
era
ted
m (digits)
Average service
discovery traffic
Average service
advertisement traffic

70
generated in the network. However when compared with the distributed service
discovery scheme, as the search radius (or depth) increases, the traffic
generated will increase exponentially. Even so, the only trade-off of CPASS is
that the traffic (or messages) generated in service advertisement is slightly
higher than the distributed service discovery in structured P2P scheme using
Chord discussed in section 3.2.
Table 5.2 Comparison of average traffic generated per query between
distributed service discovery scheme and cumulative prefix-based scheme on
Pastry network
Distributed service discovery in
structured P2P
Cumulative prefix-based advertising and
searching scheme
12.85 (Depth = 1) 13.98 (m = 0)
218.50 (Depth = 2) 14.47 (m = 1)
3448.81 (Depth = 3) 14.42 (m = 2)
- 14.42 (m = 3)
Figure 5.6 shows that the locality failure has significantly decreased when
compared to the prefix-based searching scheme in Chapter 4. This means that
the current cumulative scheme gives higher probability of enabling the service
consumer to discover nearby service providers.
Figure 5.6 Locality search failure of prefix-based cumulative scheme on
Pastry network
5
6
7
8
9
0 1 2 3 4
Lo
cali
ty f
ail
ure
(%
)
m (digit)

71
Figure 5.7 shows the average latency from service consumer to directory
node and the average latency from service consumer to service provider. As
explained in Table 4.1, the latency generated between nodes according to the
node’s region where two nodes in the same region should have 6 ms to 20 ms
latency, the average latency from service consumer to service provider is below
20 ms. This means that the service consumer is able to find service providers
that exist in the same region as shown in Figure 5.7. Hence, the locality of
service discovery is preserved, or even enhanced, in this cumulative scheme.
Figure 5.7 Average latency of cumulative scheme on Pastry network
5.2.2 Simulation on Chord network
5.2.2.1 Prefix-based cumulative service advertisement and discovery searching on
Chord network
This sub-section briefly describes Chord routing and how the prefix-based
advertising and searching scheme (CPASS) is implemented on Chord system.
As the simulation on Chord will only use Chord’s finger table to do
routing, hence the structure of a Chord’s finger table is focused here. Each
Chord node has a pointer pointing to a successor node and a predecessor node,
hence Chord network is assumed to be constructed on a circular identifier
0
10
20
30
0 1 2 3 4
La
ten
cy (
ms)
m (digit)
Average latency SC to
DN
Average latency SC to
SP

72
space (El-Ansary & Haridi, 2005). Furthermore, each Chord node keeps a set
of pointers of node called the finger table and the size of finger table is equal to
the node identifier length, M in bits. The set of pointers are chosen by
positioning the node itself at the start of the identifier space and find fill up
finger table entries such that 𝐹𝑖 = 𝑆𝑢𝑐𝑐𝑒𝑠𝑠𝑜𝑟(𝑢 + 2𝑖−1), 𝑤ℎ𝑒𝑟𝑒 1 ≤ 𝑖 ≤
𝑀and u represents the node identifier.
For example, given M = 8 bits and the following shows the finger table
entries for Chord node with the identifier of 5, where u = 5. The Chord network
consists of 10 nodes with identifiers of 4, 5, 9, 40, 66, 78, 99, 130, and 240.
Table 5.3 Chord finger table example for Chord with node identifier of 5,
with M = 8
𝑭𝒊 𝑺𝒖𝒄𝒄𝒆𝒔𝒔𝒐𝒓(𝒖 + 𝟐𝒊−𝟏)
𝐹1 𝑆𝑢𝑐𝑐𝑒𝑠𝑠𝑜𝑟(6) = 9
𝐹2 𝑆𝑢𝑐𝑐𝑒𝑠𝑠𝑜𝑟(7) = 9
𝐹3 𝑆𝑢𝑐𝑐𝑒𝑠𝑠𝑜𝑟(9) = 9
𝐹4 𝑆𝑢𝑐𝑐𝑒𝑠𝑠𝑜𝑟(13) = 40
𝐹5 𝑆𝑢𝑐𝑐𝑒𝑠𝑠𝑜𝑟(21) = 40
𝐹6 𝑆𝑢𝑐𝑐𝑒𝑠𝑠𝑜𝑟(37) = 40
𝐹7 𝑆𝑢𝑐𝑐𝑒𝑠𝑠𝑜𝑟(69) = 78
𝐹8 𝑆𝑢𝑐𝑐𝑒𝑠𝑠𝑜𝑟(133) = 240
When a Chord node needs to route to a specific target, it first checks its
finger table for any entries that is closest preceding to the key and forwards the
message to that node entry. For instance, if node 5 has a message with the key
27, the node will select node 9 to send the message because node 9 has a Chord
identifier that immediately precedes the key 27.

73
The service advertisement using Chord is the same as service
advertisement algorithm using Pastry in section 5.1.1. The only difference is in
Pastry, routing table is used whereas in Chord, finger table is used. The
algorithm for service discovery stated in section 5.1.2 can also be applied on
Chord.
For example, the algorithm of service advertisement discussed in section
5.1.1 is to forward the service advertisement query to all nodes in row-r
because those nodes shares r prefix with the key. Here, the finger table entries
are not arranged according to prefix. Hence, the advertisement query will be
forwarded to any node entry that shares the first r digits with the key.
5.2.2.2 Simulation results and discussion
The Chord finger table has at most 16 entries as the size of finger table
depends on the bit length of the Chord’s node identifier address space.
Shown in Figure 5.8 and Figure 5.9, both service advertisement and
service discovery are performed using brute force hence the lower success rate
at m = 0. The reason is Chord’s finger table which consist of only at most 16
entries, causing the lower chances in achieving successful discovery. Besides,
the routing table size for Pastry in the previous simulation (section 5.2.1) is
bigger than Chord where Pastry has at most 60 entries. Hence m = 0 has lower
success rate in discovery compared with the same scheme on Pastry network.
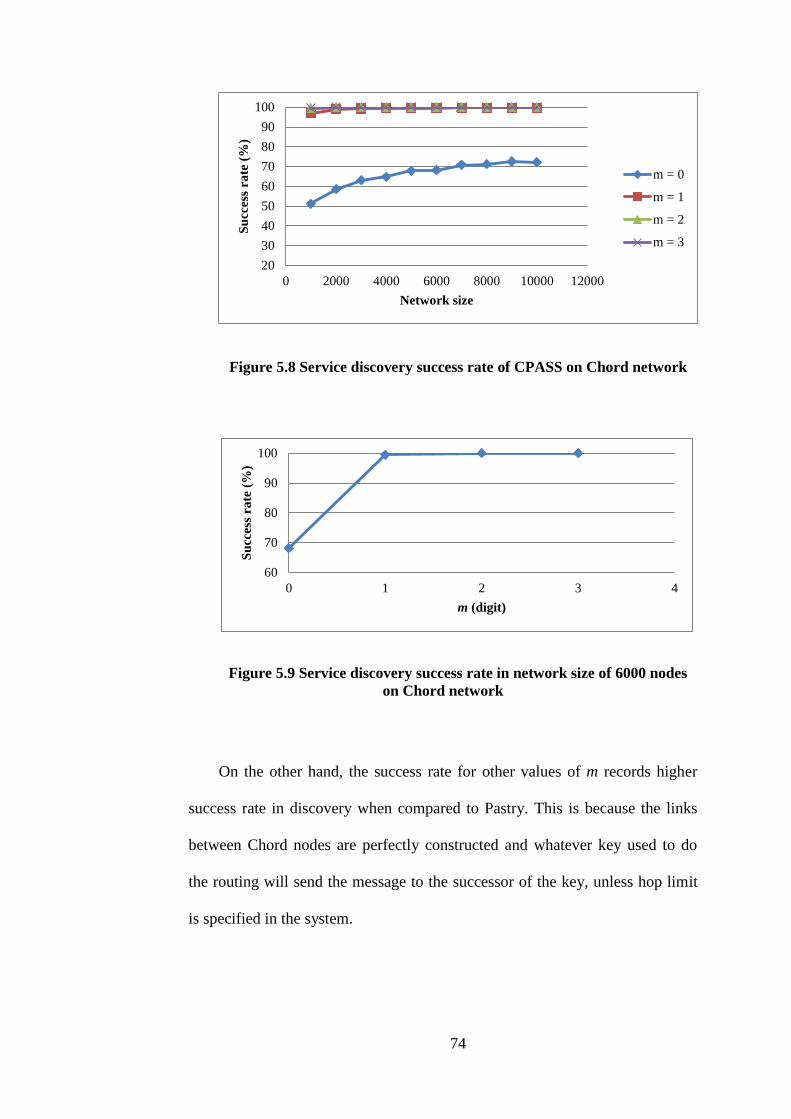
74
Figure 5.8 Service discovery success rate of CPASS on Chord network
Figure 5.9 Service discovery success rate in network size of 6000 nodes
on Chord network
On the other hand, the success rate for other values of m records higher
success rate in discovery when compared to Pastry. This is because the links
between Chord nodes are perfectly constructed and whatever key used to do
the routing will send the message to the successor of the key, unless hop limit
is specified in the system.
20
30
40
50
60
70
80
90
100
0 2000 4000 6000 8000 10000 12000
Su
cces
s ra
te (
%)
Network size
m = 0
m = 1
m = 2
m = 3
60
70
80
90
100
0 1 2 3 4
Su
cces
s ra
te (
%)
m (digit)

75
Figure 5.10 Average traffic generated in service discovery of CPASS on
Chord network
The traffic generated for both service discovery and service advertisement
on Chord network is slightly lower than the traffic generated on Pastry network.
This is because Chord’s finger table is not structured according to prefixes like
Pastry’s routing table thus the number of entries that shares the same prefix in
Chord’s finger table are lesser than Pastry’s. Hence the traffic generated is also
lesser than Pastry.
Besides that, the number of directory nodes for each service type are lower
when compared with Pastry because in most cases of service discovery and
service advertisement, the service provider or service consumer tend to find the
same directory node when the same key is used for routing. Due to this the
success rate on Chord is higher than Pastry.
Although with higher success rate, the locality search failure is high on
Chord network. As shown in Figure 5.11, the locality failure is at the highest at
88% when m = 0. Besides that, the locality failure is still around 72% for other
values of m. This means that Chord system is unable to preserve locality when
routing for a certain node.
0
5
10
15
20
25
30
0 1 2 3 4T
raff
ic g
ener
ate
d
m (digit)
Average service
discovery traffic
Average service
advertisement traffic
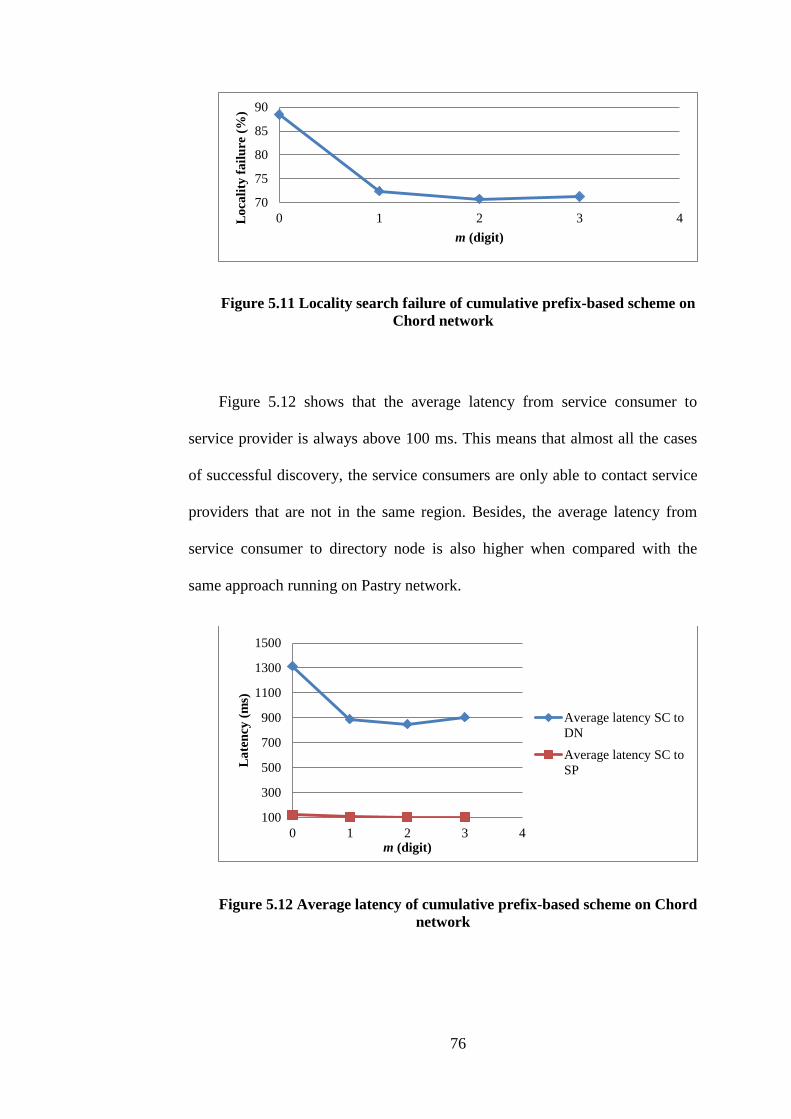
76
Figure 5.11 Locality search failure of cumulative prefix-based scheme on
Chord network
Figure 5.12 shows that the average latency from service consumer to
service provider is always above 100 ms. This means that almost all the cases
of successful discovery, the service consumers are only able to contact service
providers that are not in the same region. Besides, the average latency from
service consumer to directory node is also higher when compared with the
same approach running on Pastry network.
Figure 5.12 Average latency of cumulative prefix-based scheme on Chord
network
70
75
80
85
90
0 1 2 3 4Lo
cali
ty f
ail
ure
(%
) m (digit)
100
300
500
700
900
1100
1300
1500
0 1 2 3 4
La
ten
cy (
ms)
m (digit)
Average latency SC to
DN
Average latency SC to
SP

77
In conclusion, when the same searching algorithm CPASS is applied on
Chord and Pastry, CPASS on Chord shows slightly better result in service
discovery success rate than that of CPASS on Pastry, but both actually can
achieve 99% of service discovery success rate as shown in Table 5.4. Both
simulations of CPASS on Pastry and Chord have significant improvement
when compare against PASS on Pastry when the prefix key m increased as
shown in Table 5.5.
Table 5.4 Service discovery success rate of CPASS on Pastry and Chord
Network
Size
Service discovery success rate of CPASS (%)
m = 0 m = 1 m = 2 m = 3
Pastry Chord Pastry Chord Pastry Chord Pastry Chord
3000 82.30 62.95 98.70 99.29 98.85 100.00 98.76 100.00
6000 87.54 68.13 99.87 99.43 99.86 100.00 99.88 100.00
9000 88.38 72.40 99.91 99.65 99.92 100.00 99.93 100.00
Table 5.5 Service discovery success rate of PASS on Pastry
Network Size Service discovery success rate of PASS (%)
m = 0 m = 1 m = 2 m = 3
3000 81.64 98.91 96.01 34.33
6000 88.33 99.31 98.06 64.68
9000 88.94 99.43 98.31 67.82
Although CPASS on Chord gives better success rate but CPASS on Pastry
gives much better locality awareness when compared with CPASS on Chord.
This can be seen in Table 5.6 where the locality failure of CPASS on Pastry is
much lower than CPASS on Chord. However, when comparing locality
awareness, CPASS is better than PASS as shown in Table 5.7 where higher
value of m results in lower locality failure in CPASS.

78
Table 5.6 Locality failure success rate of CPASS on Pastry and Chord
Network
Size
Locality failure rate of CPASS (%)
m = 0 m = 1 m = 2 m = 3
Pastry Chord Pastry Chord Pastry Chord Pastry Chord
3000 10.86 87.75 8.93 69.41 8.78 67.76 8.81 68.34
6000 8.14 88.43 7.05 72.40 6.91 70.77 6.85 71.23
9000 7.87 87.60 7.23 73.89 6.82 72.24 7.03 72.58
Table 5.7 Locality failure rate of PASS on Pastry
Network Size Locality failure rate of PASS (%)
m = 0 m = 1 m = 2 m = 3
3000 9.30 18.94 18.41 68.06
6000 6.85 12.51 13.34 38.86
9000 6.29 12.23 13.14 35.92
In the next chapter, the resiliency of CPASS on Pastry is tested.

79
CHAPTER 6
THE RESILLIENCY OF CUMULATIVE PREFIX-BASED
ADVERTISING AND SEARCHING SCHEME
This chapter describes the resiliency of the cumulative prefix-based
service advertisement and service discovery scheme (CPASS) by performing
simulation where nodes are set to leave the network. In the following sub-
chapters, the performance of CPASS will be tested and discussed in the event
of 10% nodes encountered failure (or departed from the network) after the
routing tables have been set up for all nodes. Next, the routing tables of the
remaining active nodes will be repaired and the results of both simulations are
compared. It should be noted that the resiliency of prefix-based service
advertisement and service discovery scheme (PASS) is not tested because the
performance of CPASS has already proved to outperform PASS in the previous
chapter.
6.1 The resiliency simulation
In this simulation, 10% of the active nodes are randomly chosen to leave
the network. It should be noted that these leaving nodes are considered failed
and will not inform the remaining active nodes in the network about their
departure. Hence, the node identifiers of these departed nodes will still exist in
the remaining active nodes’ routing tables. In the case where a departed node is
encountered during the Pastry routing process, the routing will cease and
should not be able to carry on hence will result in a failed search.

80
Figure 6.1 shows the simulation of running CPASS on Pastry in a network
that consist of numbers of nodes from 1,000 to 10,000 nodes with increment
1000 nodes. The simulation settings are the same as described in section 5.2.
The difference here is that 10% of the active nodes are set to depart from the
network. For example, in a network that consists of 6000 nodes, 600 randomly
chosen nodes are set to leave the network. As shown in Figure 6.1, the
cumulative prefix-based scheme shows that even when 10% of the nodes have
left the network, good success rate is still achievable. Although the success rate
shows declination when compared with the simulation shown in section 5.2.1
however this is expected due to the existence of node identifiers of failed nodes
in the remaining active nodes’ routing tables.
Figure 6.1 Service discovery success rate for resiliency test in a Pastry
network
Figure 6.2 shows that the success rate has also declined when compared
with the simulation shown in Figure 5.4 in section 5.2.1. Although at the
beginning where m = 0, the success rate has dropped from 88% to 82% but as
m increases, the service discovery success rate gradually goes back to a higher
60
65
70
75
80
85
90
95
100
0 2000 4000 6000 8000 10000
Su
cces
s ra
te (
%)
Network size
m = 0
m = 1
m = 2
m = 3

81
rate which is comparable with the result by the cumulative prefix-based
scheme (CPASS).
Figure 6.2 Success rate in a network that consist of 6000 nodes after 10%
of the nodes departed
The traffic generated in this resiliency test in a 6000 nodes network is
almost the same as in the normal network. This shows that the proposed
scheme is able to withhold against node failure even when 10% of the network
population have failed.
Figure 6.3 Traffic generated in a network that consist of 6000 nodes after
10% of the nodes departed
80
85
90
95
100
0 1 2 3 4
Su
cces
s ra
te (
%)
m (digit)
0
10
20
30
40
50
0 1 2 3 4
Tra
ffic
gen
era
ted
m (digits)
Average service
discovery traffic
Average service
advertisement traffic

82
Overall, the low locality failure shown in Figure 6.4 indicates that most of
the successful service discovery cases are able to locate a nearby service
provider as well.
Figure 6.4 Locality search failure in a network that consist of 6000 nodes
after 10% of the nodes departed
Figure 6.5 shows that the average latency in successful service discovery
queries from service consumer to service provider are between 10 ms to 20 ms.
This means that the majority of the service consumers are able to locate service
providers in their own proximity. However, when compared with the average
latency shown at Figure 5.7 in section 5.2.1, a rise in latency occurs. This is
because the time taken to locate a directory node has become longer due to the
failed node identifier entries in the routing tables of the remaining active nodes.
Besides, the average latency from service consumer to service provider also
increase as the value of m increases. The declining number of active node
entries in the service consumer’s routing table has forced the service consumer
to widen its search radius.
2
4
6
8
10
12
0 1 2 3 4
Lo
cali
ty f
ail
ure
(%
)
m (digit)

83
Figure 6.5 Average latency in a network that consist of 6000 nodes after
10% of the nodes departed
In conclusion, the resiliency test shows that even with 10% of nodes have
departed from the network, the proposed cumulative scheme is still able to
perform well by achieving high success rate, i.e., 99% when m = 3. However,
this has caused the increase in latency between service consumer and service
provider as a result of forcing the service consumer to expand its search radius.
Hence, in order to reduce such effect, repairing the routing tables of remaining
active nodes by replacing the departed nodes identifiers with active nodes
identifiers is important in the real network.
6.2 Repairing the Pastry routing table
The Pastry routing protocol comes with routing table repairing system that
enables each node to repair its routing table when departed or failed node is
identified during the occasional node checking process. However, the original
Pastry’s process of repairing the routing table requires the neighbourhood set
maintained by each node. The neighbourhood set consist of nodes that are in
close proximity but not listed in the routing table.
0
5
10
15
20
25
30
35
0 1 2 3 4L
ate
ncy
(m
s)
m (digit)
Average latency SC to
DN
Average latency SC to
SP

84
As the neighbourhood set is not configured in the simulation system, an
alternative way of repairing the routing table is performed. The following
describes the steps performed by each node for repairing routing table.
1. Identify the failed node from the routing table.
2. Query the first active node that is in the same row as the failed
node.
3. Request routing table from the active node and use the routing
table entries from the active node to replace the failed node.
4. If the failed node is not appropriate to be replaced by the node
entry in the retrieved routing table, then request routing table from
the next active node in the same row as the failed node.
5. After the failed node identifier is replaced by the active node
identifier, the active node will send copies of relevant service lists
to the replaced node.
Given node X whose nodeId is 1212 and has a failed node entry whose
nodeId is 1133 in its routing table as shown in Figure 6.6. In order to replace
the failed node entry, node 1212 sends a request to node Y whose nodeId is
1021 for its routing table because node Y is the first active node that is in the
same row as the failed node 1133. When node X receives a copy of node Y’s
routing table, it finds a suitable replacement for 1133. Then the entry 1133 is
replaced by the entry 1111 retrieved from node Y’s routing table.
Note that the replacement of failed node will be equipped with service lists
that are relevant to it. For example, node 1111 will receive service lists with
serviceIds that share the same prefix of m bits with node 1111 from node X.

85
This is a step to enable the replacement node to become a directory node and
resume its responsibilities of providing information about service providers.
Although the replacement might already become a directory node but it may
not contain as much information about service provider as the failed node that
it replaced. Thus, this step may help to ensure high success discovery rate is
still achievable and the average latency is lowered.
Figure 6.6 Example of routing table repairing process
The following describes the simulation results and discussions. As shown
in Figure 6.7, the service discovery success rate at m = 0 has shown 10%
improvement after repairing the routing table. However, the success rate also
slowly increased (as the network size increased) to be at the same rate even
without repairing procedure. This may be caused by the completeness of
routing table entries in higher network size and 10% of departed nodes in the
network did not affect much on the service discovery process.
Node X (1212)
Node Y (1021)

86
Figure 6.7 Service discovery success rate after the repairing procedure
Figure 6.8 shows the service discovery success rate after the routing table
repairing process, where the success rate slowly increases to 99% as the value
of m increases.
Figure 6.8 Success rate in a network that consist of 6000 nodes after
repairing process
According to Figure 6.9, the average traffic generated at m = 0 is slightly
lower than m = 1, 2, and 3. As most of the successful service discovery cases
occurred at m = 0 hence the traffic generated is low at first. However as the
search radius expands, the traffic generated also increased.
60
65
70
75
80
85
90
95
100
0 2000 4000 6000 8000 10000S
ucc
ess
rate
(%
)
Network size
m = 0
m = 1
m = 2
m = 3
80
85
90
95
100
0 1 2 3 4
Su
cces
s ra
te (
%)
m (digit)
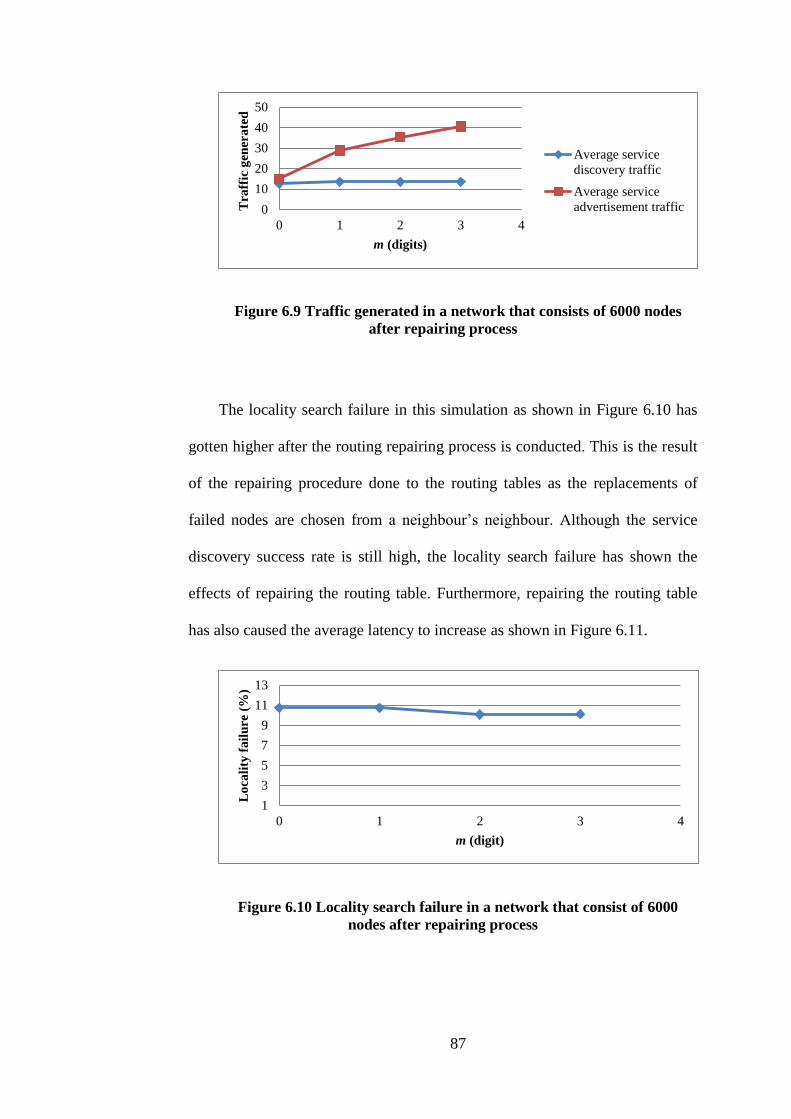
87
Figure 6.9 Traffic generated in a network that consists of 6000 nodes
after repairing process
The locality search failure in this simulation as shown in Figure 6.10 has
gotten higher after the routing repairing process is conducted. This is the result
of the repairing procedure done to the routing tables as the replacements of
failed nodes are chosen from a neighbour’s neighbour. Although the service
discovery success rate is still high, the locality search failure has shown the
effects of repairing the routing table. Furthermore, repairing the routing table
has also caused the average latency to increase as shown in Figure 6.11.
Figure 6.10 Locality search failure in a network that consist of 6000
nodes after repairing process
0
10
20
30
40
50
0 1 2 3 4
Tra
ffic
gen
era
ted
m (digits)
Average service
discovery traffic
Average service
advertisement traffic
1
3
5
7
9
11
13
0 1 2 3 4
Lo
cali
ty f
ail
ure
(%
)
m (digit)
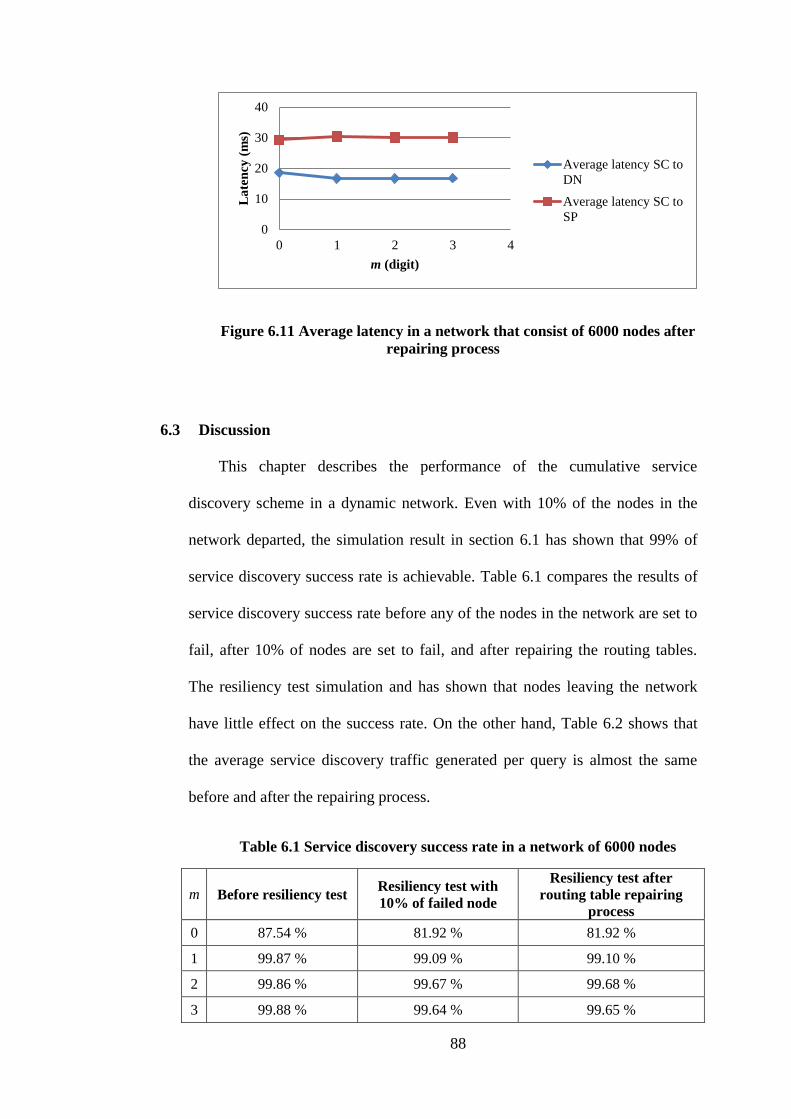
88
Figure 6.11 Average latency in a network that consist of 6000 nodes after
repairing process
6.3 Discussion
This chapter describes the performance of the cumulative service
discovery scheme in a dynamic network. Even with 10% of the nodes in the
network departed, the simulation result in section 6.1 has shown that 99% of
service discovery success rate is achievable. Table 6.1 compares the results of
service discovery success rate before any of the nodes in the network are set to
fail, after 10% of nodes are set to fail, and after repairing the routing tables.
The resiliency test simulation and has shown that nodes leaving the network
have little effect on the success rate. On the other hand, Table 6.2 shows that
the average service discovery traffic generated per query is almost the same
before and after the repairing process.
Table 6.1 Service discovery success rate in a network of 6000 nodes
m Before resiliency test Resiliency test with
10% of failed node
Resiliency test after
routing table repairing
process
0 87.54 % 81.92 % 81.92 %
1 99.87 % 99.09 % 99.10 %
2 99.86 % 99.67 % 99.68 %
3 99.88 % 99.64 % 99.65 %
0
10
20
30
40
0 1 2 3 4L
ate
ncy
(m
s)
m (digit)
Average latency SC to
DN
Average latency SC to
SP

89
Even after repairing the routing tables by replacing the failed nodeId
entries with active nodeId entries, there is only small increase in the service
discovery success rate and the average traffic generated shows no changes.
Table 6.2 Average service discovery traffic generated in a network of
6000 nodes
m Before resiliency test Resiliency test with
10% of failed node
Resiliency test after
routing table repairing
process
0 15.93 12.63 12.63
1 13.31 13.38 13.38
2 13.02 13.39 13.39
3 12.83 13.51 13.51
The existence of departed nodes in the network has forced the service
consumers to expand search radius causing higher average latency between the
service provider and service consumer as shown in Table 6.3 and Table 6.4.
However, the average traffic generated in service discovery still maintained the
same in both simulations. The increase of latency between service consumer
and directory node could be caused by the routing table repairing process
where the failed nodes are replaced with active nodes that are much farther
than the local node. Even so, the average latency between service consumer
and service provider has slightly improved.
Table 6.3 Average latency generated from service consumer to directory
node in a network of 6000 nodes
m Before resiliency test Resiliency test with
10% of failed node
Resiliency test after
routing table repairing
process
0 15.93 ms 18.55 ms 18.55 ms
1 13.31 ms 16.64 ms 16.72 ms
2 13.02 ms 16.64 ms 16.65 ms
3 12.83 ms 16.72 ms 16.73 ms

90
Table 6.4 Average latency generated from service consumer to service
provider in a network of 6000 nodes
m Before resiliency test Resiliency test with
10% failed node
Resiliency test after
routing table repairing
process
0 24.35 ms 29.26 ms 29.26 ms
1 24.65 ms 30.35 ms 30.34 ms
2 24.43 ms 30.08 ms 30.04 ms
3 24.33 ms 30.07 ms 30.10 ms
In conclusion, the resiliency test has shown that CPASS is able to achieve
99% service discovery success rate even when 10% of the nodes have failed to
work. Besides, the average traffic generated per query and the locality search
failure maintained low. Furthermore, the simulation experiments have shown
that both PASS and CPASS rely on the underlying P2P routing protocol to
achieve good performance in terms of service discovery success rate, locality
awareness, and others. Thus, the performance of PASS and CPASS could
inherit the limitations of the routing protocol used.

91
CHAPTER 7
CONCLUSION
This research has studied about resource sharing in a large scale
decentralised network. The conventional approaches are often centralised and
subject to the single-point failure risk. This issue leads to a distributed
approach in service discovery using P2P system.
This dissertation has presented some existing approaches of distributed
service discovery schemes and introduced new distributed service discovery
schemes and its simulation study. Besides that, this research has also
introduced a new term, named the directory node that act as a platform for
service advertisement and service discovery by peer nodes.
The finding of the simulation studies has shown that the existing
approaches of using unstructured P2P and structured P2P can achieve high
success rate but either can result in (1) high traffic generated as brute force
technique is usually applied, or (2) cannot provide locality awareness while
perform searching for a service provider.
In order to tackle the above two issues, we have proposed two Prefix-
based Advertising and Searching Schemes, namely PASS and CPASS, based
on the Pastry P2P architecture. Through simulation, we showed that both PASS
and CPASS are able to achieve 99% success rate with only 1% of active nodes
in the network. Furthermore, when compared with other existing approaches,

92
the proposed schemes, especially CPASS have superior performance as they
are able to maintain locality awareness with locality success rate of more than
90% and deterministic routing with log order complexity using Pastry as the
underlying routing protocol. The simulation studies have also shown that the
proposed schemes are able to achieve high success rate without generating high
number of traffic in the network.
This dissertation also compares the performance of using two most
popular structured P2P system i.e., Pastry and Chord. The simulation result has
revealed that although the Chord routing protocol is able to achieve higher
service discovery success rate, Pastry is better in providing locality awareness.
In addition, resiliency test has also been conducted in order to measure the
resiliency of CPASS. The simulation result has shown that even with 10% of
active nodes having left the network, 99% of service discovery success rate is
still achievable. This shows that the proposed schemes are able to withstand the
dynamicity of a peer-to-peer network.
One issue that comes with the proposed framework is when a requesting
peer receives a list of potential providers that can deliver the same service,
which provider it will choose to minimize the cost in terms of delay, bandwidth,
charge, and etc. Besides, security issues are yet to be addressed in the proposed
scheme such as phishing where the directory node may return a list of
malicious addresses to the service consumer. On the other hand, the
maintenance of the proposed scheme has to be carefully planned to avoid the
risk of returning outdated results. Hence, future work may include (1)
simulating both proposed schemes (i.e., PASS and CPASS) in a large Pastry

93
network with 128 bits of identifier space, (2) address the issue to select the best
service provider from the list of potential providers, and (3) implement both
proposed schemes on similar structured P2P protocol that can provide locality
awareness such as Kademlia and Tapestry.

94
REFERENCES
Anusuya, R., Kavitha, V. & Golden, J. E., 2010. Enhancing and analyzing
search performance in unstructured peer to peer networks using enhanced
guided search protocol (EGSP). Journal of Computing, 2(6), pp. 59-65.
Awan, A., A. Ferreira, R., Jagannathan, S. & Y. Grama, A., 2004.
Unstructured Peer-to-Peer Networks for Sharing Processor Cycles, s.l.:
Purdue University Purdue e-Pubs.
Bowman, C. M., Peter B., D., Udi, M. & Michael, F. S., 1994. Scalable internet
resource discovery: Research problems and approaches. Communications of
the ACM-Association for Computing Machinery-CACM, 37(8), pp. 98-107.
Brain, M. & Crawford, S., 2014. howstuffworks. [Online]
Available at: http://www.howstuffworks.com/dns.htm
[Accessed 9 January 2014].
Caron, E., Chuffart, F., He, H. & Tedeschi, C., 2011. Implementation and
Evaluation of a P2P Service Discovery System Application in a Dynamic Large
Scale Computing Infrastructure. Pafos, IEEE 11th International Conference on
Computer and Information Technology (CIT).
Caron, E., Frederic, D. & Cedric, T., 2006. A dynamic prefix tree for service
discovery within large scale grids. Cambridge, Sixth IEEE International
Conference on Peer-to-Peer Computing, pp. 106-116.

95
Castro, M., Druschel, P. & Kermar, 2002. One Ring to Rule them All: Service
Discovery and Binding in Structured Peer-to-Peer Overlay Networks. Saint-
Emilion, France, SIGOPS European Workshop.
Christensson, P., n.d. TechTerms.com. [Online]
Available at: http://www.techterms.com/definition/nameserver
[Accessed 29 July 2013].
Cobb, J., Korpela, E., Lebofsky, M. & Wethimer, D., 2002. SETI@home: an
experiment in public-resource computing. Communications of the ACM, 45(11),
pp. 56-61.
Datta, S., Bhaduri, K., Giannella, C. & Wolff, R., 2006. Distributed Data
Mining in Peer-to-Peer Networks. IEEE Internet Computing, 10(4), pp. 18-26.
Ding, A. et al., 2012. A distributed framework for mining financial data. Taipei,
2012 IEEE 4th International Conference on Cloud Computing Technology and
Science (CloudCom).
Drost, N. et al., 2010. JEL: unified resource tracking for parallel and
distributed applications. Concurrency and Computation: Practice and
Experience, 23(1), pp. 17-37.
Druschel, P. et al., 2001. Pastry: A substrate for peer-to-peer applications.
[Online]
Available at: http://www.freepastry.org/
[Accessed 9 January 2014].

96
Eclipse, 2014. Eclipse. [Online]
Available at: http://www.eclipse.org/
[Accessed 5 January 2014].
El-Ansary, S. & Haridi, S., 2005. An overview of structured P2P overlay
networks, s.l.: s.n.
Guo, H. et al., 2006. An Optimized Peer-to-Peer Overlay Network for Service
Discovery. s.l., 11th IEEE Symposium on Computers and Communications,
2006. ISCC '06. Proceedings.
Gupta, R. & Somani, A., 2004. CompuP2P: An Architecture for Sharing of
Compute Power in Peer-to-Peer Networks with Selfish Nodes. s.l., s.n.
Gu, P., Wang, J. & Cai, H., 2007. ASAP: An advertisement-based search
algorithm for unstructured peer-to-peer systems. Xian, China, International
Conference on Parallel Processing (ICPP).
Hautakorpi, J., KERÄNEN, A. & MÄENPÄÄ, J., 2012. Method and
arrangement for locating services in a peer-to-peer network. STOCKHOLM,
Patent No. 498,323.
Hsu, C.-Y., Wang, K. & Shih, H.-C., 2012. Decentralized structured peer-to-
peer network and load balancing methods thereof. United States of America,
Patent No. 166,493.
Liew, S.-Y., 2012. An overlay approach for service discovery in a large-scale
decentralized cloud. Shen Zhen, Cloud Computing Congress (APCloudCC),
2012 IEEE Asia Pacific.

97
Li, X. & Wu, J., 2005. Searching Techniques in Peer-to-Peer Networks.
Handbook on Theoretical and Algorithmic Aspects of Sensor, Ad Hoc
Wireless, and Peer-to-Peer Networks ed. Boston: Auerbach Publications,
Talyor and Francis Group.
Lua, E. K. et al., 2005. A survey and comparison of peer-to-peer overlay
network schemes. IEEE Communications Surveys and Tutorials, 7(1-4), pp.
72-93.
Luca, G., Giuseppe, L. R. & Salvatore, G., 2005. An adaptive routing
mechanism for efficient resource discovery in unstructured P2P networks.
Berlin Heidelberg, Computational Science and Its Applications–ICCSA.
Mark, J., Alberto, M., Gian, P. J. & Spyros, V., 2013. PeerSim: A Peer-to-Peer
Simulator. [Online]
Available at: http://peersim.sourceforge.net/
[Accessed 5 January 2014].
P2PNews, 2012. P2PNEWS The File Sharing News Authority. [Online]
Available at: http://www.p2pnews.net/2012/06/14/art-thou-a-peer/
[Accessed 11 July 2013].
Qiang, H. et al., 2008. Chord4S: A P2P-based Decentralised Service Discovery
Approach. Honolulu, HI, IEEE International Conference on Service
Computing.
Ranaivo-ravonison, G. & Sabourin, A., 2007. P2P simulation with PeerSim.
TELECOMINT.

98
Ranjan, R., 2007. Coordinated Resource Provisioning in Federated Grids. s.l.,
s.n.
Rowston, A. & Druschel, P., 2001. Pastry: Scalable , decentralized object
location and routing for large-scale peer-to-peer systems. Heidelberg,
Germany, s.n.
Sabu, M. T. & Chandra, S. K., 2010. Survery of search and replication schemes
in unstructured P2P networks. Network Protocols and Algorithms.
Saleem, H. M., Hassan, M. F. & Asirvadam, V. S., 2011. Distributed Service
Discovery Architecture: A Bottom-Up Approach with Application Oriented
Networking. s.l., s.n.
Skjegstad, M. & Johnson, F. T., 2009. Search+: An efficient peer-to-peer
service discovery mechanism, s.l.: s.n.
Stefan, S. & Roger, W., 2007. Structuring unstructured peer-to-peer networks.
Heidelberg, Springer-Verlag Berlin, pp. 432-442.
Stoica, I. et al., 2001. Chord: A scalable peer-to-peer lookup service for
internet applications. ACM SIGCOMM Computer Communication Review,
31(4), pp. 149-160.
Strickland, J., n.d. howstuffworks. [Online]
Available at: http://computer.howstuffworks.com/grid-computing.htm
[Accessed 2 September 2013].

99
Tie, J. et al., 2006. Peer-Tree: A Hybrid Peer-to-Peer Overlay for Service
Discovery*. Vienna, Advanced Information Networking and Applications,
2006. AINA 2006. 20th International Conference (Volume:1 ).
Ting, N. S., 2003. A generic peer-to-peer network simulator. saskatchewan:
Proceedings of the 2002-2003 Grad Symposium, CS Dept, University of
Saskatchewan.
Young, B., 2013. Navigating Cyberspace: The Domain Name System. Austin:
s.n.
Zhou, J., Abdullah, N. A. & Shi, Z., 2011. A Hybrid P2P Approach to Service
Discovery in the Cloud. International Journal of Information Technology and
Computer Science (IJITCS), Volume 3, pp. 1-9.