preferencerelations based …cse.iitkgp.ac.in/~pabitra/paper/esa16.pdf... etc. metasearch is one...
TRANSCRIPT

Expert Systems With Applications 49 (2016) 86–98
Contents lists available at ScienceDirect
Expert Systems With Applications
journal homepage: www.elsevier.com/locate/eswa
Preference relations based unsupervised rank aggregation for
metasearch
Maunendra Sankar Desarkar1,∗, Sudeshna Sarkar, Pabitra Mitra
Department of CSE, IIT Kharagpur, Kharagpur 721302, India
a r t i c l e i n f o
Keywords:
Rank aggregation
Metasearch
Information retrieval
a b s t r a c t
Rank aggregation mechanisms have been used in solving problems from various domains such as bioin-
formatics, natural language processing, information retrieval, etc. Metasearch is one such application
where a user gives a query to the metasearch engine, and the metasearch engine forwards the query
to multiple individual search engines. Results or rankings returned by these individual search engines
are combined using rank aggregation algorithms to produce the final result to be displayed to the user.
We identify few aspects that should be kept in mind for designing any rank aggregation algorithm for
metasearch. For example, generally equal importance is given to the input rankings while performing
the aggregation. However, depending on the indexed set of web pages, features considered for ranking,
ranking functions used etc. by the individual search engines, the individual rankings may be of differ-
ent qualities. So, the aggregation algorithm should give more weight to the better rankings while giving
less weight to others. Also, since the aggregation is performed when the user is waiting for response,
the operations performed in the algorithm need to be light weight. Moreover, getting supervised data for
rank aggregation problem is often difficult. In this paper, we present an unsupervised rank aggregation
algorithm that is suitable for metasearch and addresses the aspects mentioned above.
We also perform detailed experimental evaluation of the proposed algorithm on four different bench-
mark datasets having ground truth information. Apart from the unsupervised Kendall-Tau distance mea-
sure, several supervised evaluation measures are used for performance comparison. Experimental results
demonstrate the efficacy of the proposed algorithm over baseline methods in terms of supervised eval-
uation metrics. Through these experiments we also show that Kendall-Tau distance metric may not be
suitable for evaluating rank aggregation algorithms for metasearch.
© 2015 Elsevier Ltd. All rights reserved.
1. Introduction and motivation
The input to the rank aggregation problem is a number of rank-
ings obtained from different sources. The sources can be human
judges or algorithms. The task is to combine these input rank-
ings and produce an aggregate ranking. Rank aggregation tech-
niques have been used to solve problems from different appli-
cations domains. We mention here a few expert and intelligent
systems applications or application domains where rank aggrega-
tion techniques have been used to arrive at solutions to different
problems.
∗ Corresponding author. Tel.: +91 40 2301 8466.
E-mail addresses: [email protected] (M.S. Desarkar), [email protected].
ernet.in (S. Sarkar), [email protected] (P. Mitra).1 Present address: IIT Hyderabad, Kandi, Medak District 502 285, Telangana, India.
http://dx.doi.org/10.1016/j.eswa.2015.12.005
0957-4174/© 2015 Elsevier Ltd. All rights reserved.
• Voting: For voting applications, there is a fixed list of candi-
dates. There are voting schemes where the voters are allowed
to rank the candidates based on the order of their choices. For
such schemes, it is often necessary to combine the rankings
provided by the voters to produce an aggregate ranking of the
candidates, to obtain a consensus ordering of the candidates. This
aggregate ranking can be determined by rank aggregation algo-
rithms (de Borda, 1781; Davenport & Kalagnanam, 2004; Elkind
& Lipmaa, 2005).• Metasearch: Metasearch engines (e.g. MetaCrawler (http://
www.metacrawler.com/), Dogpile (http://www.dogpile.com),
Entireweb (http://www.entireweb.com/), etc.) accept queries
from users, and forward that query to several second-level
search engines. Each of these second-level search engines
returns a ranked list of items for the query. The metasearch en-
gine then combines these ranked lists to produce an aggregate
list. This aggregate list is displayed to the user as a response

M.S. Desarkar et al. / Expert Systems With Applications 49 (2016) 86–98 87
g
l
i
v
S
d
2
r
t
m
r
t
t
r
c
g
i
v
r
i
t
i
a
w
s
t
a
z
m
T
m
p
r
S
f
v
q
f
t
e
f
S
r
2
w
g
a
a
e
d
i
s
w
t
s
o
a
to his/her query (Aslam & Montague, 2001; Chen, Wang, Song,
& Zhang, 2008; Jansen, Spink, & Koshman, 2007; Thomas &
Hawking, 2009). Thus rank aggregation is a central task for
successful working of any metasearch engines.• Multi-criteria decision making: There are systems where the
objects (documents/products/candidates) might be scored or
ranked based on multiple criteria. However, a single order-
ing of the objects is required as the final ranking. Rank ag-
gregation algorithms are often used in tasks such as selecting
product or services for recommendation (Shao, Chen, & Huang,
2010), combining feature based rankings for producing a single
ranking for web search queries (Farah & Vanderpooten, 2007),
candidate screening for hiring process in a large organization
(Mehta, Pimplikar, Singh, Varshney, & Visweswariah, 2013), di-
versifying search results (Ozdemiray & Altingovde, 2015), etc.• Recommender systems: Recommender systems have tradition-
ally recommended items to individual users. Recently there has
been a proliferation of recommender systems that recommend
items to groups of users (Jameson & Smyth, 2007). Examples
of such scenarios include a group of users listening to music,
watching a movie, going to a restaurant or a museum etc. For
recommending items to a group of users, Baltrunas, Makcin-
skas, and Ricci (2010) present a methodology where the system
first gets ranked recommendation list for each member of the
group, and then aggregates the individual lists to produce the
recommendation for the group. Sohail, Siddiqui, and Ali (2015)
aggregate user feedbacks to provide evaluation in product rec-
ommender systems.• Natural language processing: For the language translation task,
algorithms are suggested that for a source sentence, consider
the ranked list of translations returned by different translator
algorithms, and combine them to produce a final ranking of the
candidate translations (Rosti et al., 2007). Similar techniques of
combining ranked lists of candidate solutions for finding the fi-
nal output are used for approaching the problems of syntactic
dependency parsing (Sagae & Lavie, 2006) and word sense dis-
ambiguation (Brody, Navigli, & Lapata, 2006).• Networking: In the networking domain, a number of metrics
have been proposed to quantify the inherent robustness of a
network topology against failures. However, each single met-
ric usually offers only a limited view of network vulnerabil-
ity. When applied to certain network configurations, different
metrics rank the network topologies in different orders, and
no single metric fully characterizes network robustness against
different modes of failure. To overcome this problem, Yazdani
and Leonardo Duenas-Osorio (2013) propose a multi-metric ap-
proach where the ordering of the topologies given by differ-
ent individual metrics are combined to get an overall ranking
of robustness for the network topologies. In social network-
ing domain, Tabourier, Libert, and Lambiotte (2014) use rank
aggregation for link prediction. Ordering of a user’s neighbors
according to various network-based features (such as Adamic-
Adar, Jaccard Index, Katz measure, etc.) are identified. These or-
derings are aggregated to suggest set of possible new connec-
tions for the user.• Healthcare: In Fields, Okudan, and Ashour (2013), the authors
present a system where in an emergency department of a hos-
pital, nurses provide orderings of the patients in terms of the
severity of the patients’ conditions. Nurses put patients requir-
ing medical attention more urgently than others near the top of
the list. Such orderings provided by multiple nurses are aggre-
gated to produce a single ranking of patients and the patients
are attended in that order.• Bioinformatics: Rank aggregation algorithms are used in the
bioinformatics domain also, for cluster validation in microarray
data analysis (Pihur, Datta, & Datta, 2007), identifying differen-
tially expressed genes (Fang, Feng, & Ng, 2011), high throughput
screening in nanotoxicology (Patel et al., 2012), multimodal bio-
metric systems (Monwar & Gavrilova, 2013), feature selection
(Sarkar, Cooley, & Srivastava, 2014), etc.
It is evident from the discussion above that rank aggregation al-
orithms are used to solve problems in different expert and intel-
igent systems. Most of the rank aggregation algorithms discussed
n literature are unsupervised in nature. This is because unsuper-
ised methods can be easily ported across different applications.
upervised approaches to rank aggregation need supervised ranked
ata, which is expensive to acquire (Klementiev, Roth, & Small,
008; Wu, Greene, & Cunningham, 2010). Therefore, unsupervised
ank aggregation is an important problem to be studied. We wish
o develop an unsupervised rank aggregation algorithm. Our main
otivation is to work on the metasearch problem. In metasearch,
anked responses from different search engines are combined and
he aggregate ranking is displayed as the output. As the aggrega-
ion is performed in runtime when the user is waiting for the final
esult for his query, it is essential for the algorithm to be of low
omplexity, and also the steps involved in performing the aggre-
ation should involve low cost operations. Also, the quality of the
nput rankings given by individual search engines are affected by
arious factors such as indexed set of web-pages, features used for
anking, ranking function used etc. Due to this fact, qualities of the
nput rankings may not be equal. So, in metasearch, there is a need
o identify the qualities of the input rankings and use that quality
nformation while performing the aggregation. We have not come
cross any work in literature that emphasizes on these requirements
hile developing unsupervised algorithms for metasearch. The un-
upervised algorithm proposed in this paper is developed keeping
hese aspects in mind.
Several unsupervised rank aggregation algorithms and their
nalysis are presented in the works (Aslam & Montague, 2001; Bet-
ler, Bredereck, & Niedermeier, 2014; de Borda, 1781; Dwork, Ku-
ar, Naor, & Sivakumar, 2001; Schalekamp & van Zuylen, 2009).
hese algorithms are widely used in metasearch engines and in
etasearch literature. However, all these methods consider the in-
ut rankings to be equally good. Equal importance is given to the
ankers for computing the aggregate ranking. Cohen, Schapire, and
inger (1998) learn quality weights of the rankers and uses that in-
ormation for aggregation. The algorithm maintains a single query
ector over the rankers at any time, which is irrespective of the
uery. However, relative qualities of the rankers can be different
or different input queries. This is often true for metasearch, due
o different sets of indexed pages maintained by different search
ngines. Also, the method learns the quality weights from user
eedback data, which as mentioned earlier, may be difficult to get.
everal other recent researches also use supervised approaches for
ank aggregation (Liu, Liu, Qin, Ma, & Li, 2007; Pujari & Kanawati,
012; Tabourier et al., 2014). The work in Rajkumar and Agar-
al (2014) discusses desirable theoretical properties for rank ag-
regation algorithms and provides a supervised algorithm for rank
ggregation.
The method proposed in this work considers each input ranking
s a preference graph and aggregates the preference graphs to gen-
rate the aggregate ranking. We want to give different weights to
ifferent rankers (or the corresponding preference graphs) depend-
ng on their qualities or goodness on a given query. We want to as-
ign the weights in an unsupervised manner. At the same time, we
ant the weight assignment and ranking aggregation algorithms
o involve low cost operations, so that the algorithm is fast and
uitable for real time processing. Although the algorithm is devel-
ped keeping in mind the metasearch problem, it can be used for
ll the applications/frameworks mentioned earlier in this section

88 M.S. Desarkar et al. / Expert Systems With Applications 49 (2016) 86–98
2
g
C
t
t
o
l
o
f
o
a
s
n
i
n
c
2
g
c
s
t
l
M
o
2
K
g
l
l
j
K
p
t
p
m
v
2
i
w
i
g
e
g
o
i
a
b
t
e
s
e
o
(
a
t
(except for the voting application, where it is mandatory to give
equal importance to all the voters).
We provide detailed experimental evaluation of the proposed
algorithm. Different supervised and unsupervised evaluation met-
rics are used as evaluation measures. Generally unsupervised rank
aggregation algorithms are evaluated using the unsupervised met-
ric Kendall-Tau distance. This metric computes the number of in-
versions between to rankings. Lower number of inversions lead to
lower values of the metric and are preferred by the algorithms.
However, this metric is known to have some drawbacks (Carterette,
2009; Yilmaz, Aslam, & Robertson, 2008) as it does not distin-
guish between inversions at the top and bottom of the rankings.
Recently, few benchmark datasets (Chapelle & Chang, 2010; Qin,
Liu, Xu, & Li, 2009) with ground truth information have been
released for the rank aggregation task. It is possible to use su-
pervised evaluation measures for these datasets. We use these
datasets for experimentation. The experimental results indicate the
effectiveness of the proposed algorithm. From the results, we also
see that algorithms that obtained good Kendall-Tau distance mea-
sure performed badly according to supervised evaluation measures
and vice-versa. The ordering of the algorithms according to the
Kendall-Tau distance measure was completely different from the
ordering obtained using the supervised evaluation measures. Su-
pervised measures use ground truth information for determining
the quality of results. Hence the experimental evaluations indi-
cate that if supervised labels are available, then it might be better
to use supervised evaluation measures for evaluating the perfor-
mances of the rank aggregation algorithms for metasearch.
The specific contributions of the work are three-fold:
• We propose an unsupervised rank aggregation algorithm that
assigns weights to the rankers depending on their qualities.
These quality weights are different for different queries and are
assigned in an unsupervised manner.• The algorithm is developed keeping in mind that the operations
need to be fast for real time aggregation of the input rankings.• We perform detailed evaluation of different unsupervised rank
aggregation algorithms. Four different benchmark datasets are
used for experimentation. Apart from the Kendall-Tau distance,
we also use several supervised evaluation measures like Preci-
sion, NDCG, MAP, mean NDCG, ERR as evaluation metrics. By
using both supervised and unsupervised evaluation measures
for performance evaluation, we show that Kendall-Tau distance
may not be suitable for evaluating Rank aggregation algorithms
for metasearch.
The rest of the paper is organized as follows. We discuss the
related work from literature in Section 2. A formal definition of
the rank aggregation problem for metasearch is given in Section 3.
The rationale behind using preference relations is described in
Section 4. Section 5 describes a data structure that can be used
to store the preference relations. The details of the proposed algo-
rithm is presented in Section 6. Experimental results are presented
and analyzed in Section 7. Section 8 concludes the discussion and
also provides pointers for future research directions.
2. Related work
In this section, we describe some of the existing rank aggrega-
tion methods and discuss their merits and demerits.
2.1. Existing methods: unsupervised
We classify the existing unsupervised rank aggregation algo-
rithms into different categories based on the ways the aggregation
is performed and review each of these categories in detail.
.1.1. Positional score based methods
Borda Count (de Borda, 1781) is the most widely used rank ag-
regation algorithm that is based on positional scores. In Borda
ount, scores are assigned to the items or candidates based on
heir absolute ranks in the different input lists. For each ranking,
he lowest item is assigned a score of x. The candidate at the sec-
nd lowest position in that list is given a score x + 1, the third
owest item is given a score of x + 2 and so on. The value of x is
ften set to 1. For each item, the scores that it gets for the dif-
erent lists are added up, and the items are sorted in decreasing
rder based on their total scores. This sorted list is output as the
ggregate list. Amin and Emrouznejad (2011) present a positional
core based algorithm that assigns weights to each position dy-
amically, by looking at the data. However, if there are N items
n the set and the length of the longest list is L, then the method
eeds to solve N linear programming problems, each with O(N + L)
onstraints.
.1.2. Markov chain based methods
Several Markov chain based methods were used for rank aggre-
ation in Dwork et al. (2001). The items in the ranked lists were
onsidered as states. For each pair of items i1 and i2, the corre-
ponding state transition probability depends on what fraction of
he input rankers have ranked both the items, and also how many
ists have i1 before i2. Four such methods were proposed, namely,
C1, MC2, MC3, and MC4. The methods are different from each
ther in the ways the transition probabilities are calculated.
.1.3. Kemeny optimal aggregation
Methods belonging to this category try to optimize the average
endall-Tau distance or the Kemeny distance between the aggre-
ate list and the input lists. Kemeny distance between two ranked
ists is defined as the number of item pairs (i, j) for which the two
ists disagree on their relative ordering, i.e. one list places i above
, and the other has j above i.
Several researchers have posed the task of optimizing average
emeny distance as the minimum feedback arc set problem and
roposed algorithms for the task. There are weighted versions of
he problem as well, and people have tried to find efficient ap-
roximate algorithms for these versions (Ailon, Charikar, & New-
an, 2008; Coppersmith, Fleischer, & Rurda, 2010; Schalekamp &
an Zuylen, 2009; van Zuylen & Williamson, 2007).
.1.4. Condorcet procedure
This is a pairwise method and comes from the literature of vot-
ng theory. Condorcet winner for an election is the candidate who
ins over or ties with every other candidate in the election. Repet-
tive application of the Condorcet procedure produces the aggre-
ate ranking of the candidates (Condorcet, 1785).
For rank aggregation, the input rankings are viewed as the pref-
rence ordering of candidates as given by different voters. The ag-
regation is then performed in a number of steps, by selecting
ne Condorcet winner (which corresponds to an item from the
nput ranked lists) in each step. However, it is not necessary for
n election to always have a Condorcet winner. Variations of the
asic Condorcet procedure are suggested to address such situa-
ions. Montague and Aslam (2002) view the input lists as a pref-
rence graph over the candidates. It then partitions the graph into
trongly connected components (SCC). Items in a single SCC are
qually preferable. Edges between two SCCs denote the preference
f one SCC over the other. There is another rule called Black rule
Jean, 1961) that combines Borda and Condorcet policies for rank
ggregation. If there is a Condorcet winner, then Black rule selects
hat item. Otherwise Borda Count is used to determine the winner.

M.S. Desarkar et al. / Expert Systems With Applications 49 (2016) 86–98 89
2
i
t
t
a
W
S
d
h
f
a
r
e
p
2
J
&
t
s
p
p
2
l
i
t
f
b
t
b
s
t
c
p
f
fi
t
i
p
b
p
b
b
2
l
a
f
r
v
2
i
a
w
r
r
r
S
a
a
G
w
p
t
t
p
r
g
r
i
t
2
p
r
t
n
w
v
f
c
e
a
f
f
n
o
i
2
e
&
a
i
d
t
r
m
s
e
o
R
s
W
L
m
u
t
t
p
t
n
n
a
i
r
a
t
a
o
.1.5. Linear aggregation
This scheme is often used when scores are available from the
nput rankers. Several data fusion approaches using linear aggrega-
ion of scores are suggested in literature for the Learning to Rank
ask. Weighted sum or its variations are used as aggregation oper-
tors (Farah & Vanderpooten, 2007; Lee, 1997; Shaw & Fox, 1994;
u, Li, Zeng, & Bi, 2014). Shaw and Fox (1994) introduced Comb-
UM, CombMIN, CombMAX, CombANZ, CombMNZ strategies for
ata fusion. CombSUM ranks items based on sum of scores they
ave obtained from the rankers. The next two strategies consider
or ranking the maximum and minimum scores respectively that
n item has obtained. Scores are often normalized to a bounded
ange to make them comparable across different rankers. Differ-
nt variants of these strategies are suggested in Farah and Vander-
ooten (2007) and Wu et al. (2014).
.1.6. Probabilistic models
Several research work in recent literature (Clémençon &
akubowicz, 2010; Klementiev et al., 2008; Klementiev, Roth, Small,
Titov, 2009) suggest the use of probabilistic models such as
he Mallows model on permutations to solve the problem of un-
upervised rank aggregation. Algorithms that use Mallows model
erform well, but have a complexity of O(n!). Reduction in com-
lexity is possible using sampling techniques (Klementiev et al.,
008). However, this affects the effectiveness of the model. Mal-
ows model has also been used to aggregate “typed rankings” com-
ng from domain-specific experts – where the type or domain of
he candidate items are known (Klementiev et al., 2009).
Clémençon and Jakubowicz (2010) apply Luce model for per-
orming rank aggregation, using generalized Kantorovich distances
etween rankings. The problem of measuring disagreement be-
ween rankings is cast as discrete mass transportation problem,
y embedding the set of permutations in a convex set of doubly
tochastic permutation matrices. Let the set of all doubly stochas-
ic matrices of size n × n be denoted as Kn. Each input ranking σ i
an be represented as an element Ai ∈ Kn. If there are m such in-
ut rankings, then any A∗ ∈ Kn having minimum average distance
rom A1, A2, ..., Am is called as the median ranking. The algorithm
rst finds one such A∗. It then builds the aggregate ranking sequen-
ially, by including one new item in each step. This part of build-
ng the list sequentially is governed by the Luce model, where the
robability of an item being included as the next item is computed
ased on the entries in the median matrix A∗ already chosen. Com-
lexity of the method is high. The step of distance computation
etween rankings takes O(n6) time in general. The complexity can
e reduced by using certain specific cost functions.
.2. Existing methods: supervised
The majority of the algorithms for the rank aggregation prob-
em are unsupervised in nature. However, recently, due to the
vailability of few rank aggregation datasets with supervised in-
ormation (Qin et al., 2009), people are discussing supervised algo-
ithms also for the task. Here we briefly review some of the super-
ised methods for the rank aggregation task.
.2.1. Probabilistic models
A supervised Probabilistic Fusion method for rank aggregation
s presented in Lillis et al. (2006). The approach is based on the
ssumption that a ranker that does well on past queries, will do
ell for future queries also. Scores are treated as probabilities of
elevance. The rank positions are divided into k segments. Given a
anker and a segment, the probability that the ranker has placed a
elevant item in that segment is calculated from the training data.
core for a test item is calculated based on this probability as well
s the scores given to the test item by the different rankers.
A probabilistic model for supervised rank aggregation by using
combination of Mallows and Luce models is suggested in Qin,
eng, and Liu (2010a). A coset-permutation distance based stage-
ise (CPS) model is used for this purpose. Specifically, the final
ermutation π of n objects is generated in n sequential stages. At
he kth stage, the task is to select the kth object in the permuta-
ion π . The probability of this selection is defined using the coset-
ermutation distance between the right coset Sn−kπ and the input
ankings σ , where Sn is the symmetric group of order n. The ag-
regated list can be computed in O(mn4) time if there are m input
ankings. However, the authors mention that the runtime complex-
ty can be brought down to O(mn2) by using efficient implementa-
ion techniques.
.2.2. Machine learning based methods
An online learning based method for combining ranking “ex-
erts” is given in Cohen et al. (1998), which gives weights to each
anker. For each query in the training set, weights of the rankers
hat performed poorly for that query were reduced. When the
ext query comes, the algorithm starts with the current value of
eights, and the process goes on. Clicklog data or document rele-
ance information is used to measure the performance of a ranker
or a query. In Liu et al. (2007), supervised versions of Markov
hain based approaches (Dwork et al., 2001) were proposed. Wang
t al. (2013) take the differences among queries into consideration
nd proposes a query similarity based supervised rank aggregation
ramework. First, the framework sets up a number of base rankers
or each query. Next, the base rankers are aggregated to get the fi-
al ranked lists. A supervised approach is used to tune the weights
f these base rankers. Semisupervised rank aggregation is proposed
n Chen et al. (2008).
.3. Learning to Rank
The Learning to Rank task has as input scores given to differ-
nt query–document pairs by different ranking features (Chapelle
Chang, 2011; Li, 2011). Given a collection of such scores and
lso the relevance labels for different query–document pairs, rank-
ng functions are learned. Given a new query, feature scores for
ocuments are first determined. Then the learned ranking func-
ions are applied on these feature scores to determine the final
anking. Different methods have been proposed for the task. The
ethods differ from each other in the (a) family of functions con-
idered for ranking like feature-weighted linear aggregation (Cao
t al., 2006), boosting trees (Chen, Bai, & Zheng, 2011), (b) family
f loss functions used (Acharyya, Koyejo, & Ghosh, 2012; Burges,
agno, & Le, 2006; Weston, Yee, & Weiss, 2013), (c) instances con-
idered for training the ranking function – pointwise (Li, Burges, &
u, 2008), pairwise (Sculley, 2009), listwise (Cao, Qin, Liu, Tsai, &
i, 2007), etc., (d) comparing different ways of supervision infor-
ation (Chen & Hofmann, 2015), etc. Also, there are works that
se the feature scores to generate additional intermediate fea-
ures and use them for a two-stage learning of the ranking func-
ion (Keyhanipour, Moshiri, & Rahgozar, 2015). Semi-supervised ap-
roaches for the task by using both labeled and unlabeled data for
raining are also proposed (Pan, Luo, Qi, & Tang, 2011). It should be
oted that, for the rank aggregation problem, the feature scores are
ot available as input. Only the relative orderings of documents are
vailable. Still, one can assume the different features as rankers,
nduce rankings based on the feature scores, and combine these
ankings using rank aggregation techniques.
As described in this section, both supervised and unsupervised
lgorithms exist for rank aggregation. In this paper, our focus is
o develop unsupervised rank aggregation algorithm that is suit-
ble for a real time application like metasearch. As input, we have
nly rankings obtained from different sources and not the scores

90 M.S. Desarkar et al. / Expert Systems With Applications 49 (2016) 86–98
Fig. 1. Converting a ranking to a preference graph. d1, . . .d4 are the documents.
D1, . . .D4 are the corresponding nodes in the preference graph. Edges denote pref-
erence relations.
6
a
a
r
p
t
i
d
p
d
6
g
g
g
t
i
m
g
T
g
h
f
p
i
o
t
r
o
t
a
a
s
i
e
a
a
T
given to the items by the different rankers. Hence, aggregation al-
gorithms that combine scores for the different items in the rank-
ings cannot be used for the task at hand. Also, majority of the
rank aggregation algorithms discussed in literature consider each
input ranking to be equally good. Due to various reasons as men-
tioned in Section 1, the input rankings for metasearch may not be
equally good. There are rank aggregation algorithms that rely on
supervised data for determining the weights of the input rankers.
However, our focus is to estimate the goodness of the input rank-
ings without using any supervised data and use that information
for determining the aggregate ranking. We now give a formal def-
inition of the rank aggregation problem and explain our solution
for approaching the problem.
3. Rank aggregation: problem formulation
Before describing our proposed algorithm for solving the prob-
lem, we formally introduce the task of rank aggregation.
Rank aggregation: Let I be a set of items. A ranked list or rank-
ing RI w.r.t. I is a permutation of the items from a set S⊆I.
In other words, RI = 〈x1, x2, · · · , xd〉, where each xi ∈ S. If xi
appears before xj in RI, it is said that xi is ranked above xj in
RI. Given N such ranked lists RI1, RI
2, · · · RI
N, the rank aggrega-
tion problem attempts to find an aggregate ranking RIA
over
the same item set I.
4. The rationale behind using preference relations
We wish to consider the relative ordering between items appear-
ing in the input rankings for solving the rank aggregation task. If
item i appears above item j in a ranking, we consider that i is more
preferable to j in the ranking. This is intuitive, as several applica-
tions put better items at the top of the list. We use this relative
ordering or preference relations between items for producing the ag-
gregate ranking.
The inputs from human experts or algorithms about a set of
items may come in different forms: (a) scores for all the items,
(b) rankings of items and (c) pairwise preference relations. Inputs
represented as scores or rankings can be easily converted to pref-
erence relations. Also, there can be cases where giving opinions
in the form of preference relations might be easier. For example,
if there is a set of movies to be ranked by a user, giving a set
of preference relations might be less confusing than giving abso-
lute scores to the movies or ranking the movies in order of user
satisfaction. Different algorithms also may find it easier to provide
relative ordering between items (possible translations for machine
translators, pairs of matching texts for plagiarism detection, etc.).
Hence, it is imperative to look at preference relations based algo-
rithms for such aggregation tasks.
5. A data structure for storing the preference relations
We use a data structure called preference graph for storing the
preference relations. Our algorithm views each ranked list as a col-
lection of preference relations, and hence as a preference graph
over the items present in that list.
Representing a ranking as a preference graph: A preference graph
is a data structure where there is one directed edge between
each pair of nodes. The edge denotes the preference relation
between the items it connects. In our representation, the
nodes in the preference graph represent the items present
in the ranked list. If the list contains item i above item j,
then the graph contains a preference edge (a directed edge)
from node j to node i. The weight of this edge is set to one.
As the input is a ranking where there is no tie, there can be
exactly one edge between every node pair in this preference
graph. Fig. 1 gives an example of representing a ranking as
a preference graph.
. A preference relations based unsupervised rank aggregation
lgorithm
We now describe the proposed rank aggregation algorithm. The
lgorithm works in two phases. The first phase views the input
ankings as preference graphs. It then assigns weights to the in-
ut rankings (or the corresponding preference graphs) based on
heir qualities. A weighted combination of these preference graphs
s performed to construct an aggregate graph. The second phase in-
uces a ranking from the aggregate graph. This ranking is the out-
ut of the rank aggregation algorithm. These steps are described in
etail in the next subsections.
.1. Creating an aggregate graph from the input rankings
The first phase of the proposed algorithm creates an aggregate
raph. For this, first the input rankings are viewed as preference
raphs. All the input rankings (equivalently, the input preference
raphs) may not be equally good in terms of representing the ac-
ual (ground truth) preference relations between items. If we can
dentify the rankings that are good and the ones that are bad, we
ay give higher importance to the better rankings during the ag-
regation process. We keep a weight vector on the input rankings.
he weight of a ranking is indicative of the confidence that the al-
orithm has on that ranking. So, we expect the better rankings to
ave higher weights. This phase first computes the quality weights
or the rankings, and uses these weights to produce the aggregate
reference graph.
Identification of better rankings can be easily done if supervised
nformation is available in the form of document relevance scores
r clicklogs. In absence of supervised information, one can consider
he majority opinion to be indicative of the supervised label for the
elative importance between a pair of items. i.e., if more than half
f the rankings say that i is better than j, then i is considered bet-
er than j in the ground truth setting. This is common for voting
pplications.
However, this may not be a good choice for metasearch. If there
re 20 rankers and 9 say that i is better than j, it is difficult to
ay whether i is actually better than j. Again, if 5 rankers say that
is better and the remaining say otherwise, then the metasearch
ngine may assume that i is indeed better than j. In other words, if
webpage is preferred over another by many ranked lists, chances
re high that the user will have more satisfaction for that page.
o model this scenario, we consider the opinion of a ranker to be

M.S. Desarkar et al. / Expert Systems With Applications 49 (2016) 86–98 91
i
b
d
t
αg
t
i
t
r
t
n
n
I
n
I
αc
p
0
r
6
e
i
i
i
t
i
R
t
i
f
d
�
w
δ
H
D
t
t
o
w
w
m
o
6
g
b
c
l
G
e
p
t
f
i
s
f
r
s
t
i
g
6
e
h
i
r
p
c
p
m
h
w
a
a
w
n
c
i
n
i
t
ncorrect if it fails to agree with a fraction α of rankers that rank
oth the items. In this context, we first define what we mean by
isagreement with α-majority.
Definition: disagreement of a ranking withα-majority: Suppose
here are N rankings. α and β are two constants such that 0 ≤≤ 0.5 and 0 ≤ β ≤ 1. For each item pair (i, j), the rankings may
ive their opinions. The set of possible opinions is X = {0, 1}. Also,
here can be rankings that do not provide any opinion about the
tem pair. For the pair (i, j), let the number of rankings which give
he opinion x ∈ X is denoted as nx.
Suppose the opinion by a ranking k is x(k) ∈ X. We say that
anking k has disagreed with the α-majority if and only if both
he following conditions are satisfied.
0 + n1 ≥ βN (1)
x(k) < α(n0 + n1). (2)
nequality (1) signifies that if a minimum number of opinions is
ot available for the item pair, no ranking is marked as incorrect.
nequality (2) indicates that a ranker failing to agree with at least
fraction of available opinions for the same pair is marked as in-
orrect (in disagreement with α-majority).
An example:We now explain the above definition using exam-
les. Suppose the number of rankings is N = 20. Also assume α =.3 and β = 0.5.
� Case 1: 12 rankings say that i is better than j (consider this as
opinion 0). 5 rankings say that j is better than i (consider this
as opinion 1). So, n0 = 12 and n1 = 5.
n0 + n1 = 17, βN = 0.5 × 20 = 10.
So, Eq. (1) is satisfied.
Now, α(n0 + n1) = 0.3 × (12 + 5) = 5.1
As n1 = 5 < α(n0 + n1), Eq. (2) is satisfied for x = 1.
Hence, according to Definition, all the rankings which say j is
better than i are in disagreement with the α-majority for the
pair (i, j).
� Case 2: 5 rankings say that i is better than j. 10 rankings say
that j is better than i. So, n0 = 5 and n1 = 10.
n0 + n1 = 15, βN = 0.5 × 20 = 10.
So, Eq. (1) is satisfied.
Now, α(n0 + n1) = 0.3 × (5 + 10) = 4.5
As n0 = 5 > α(n0 + n1) and n1 = 10 > α(n0 + n1), Eq. (2) is sat-
isfied for neither x = 0 nor x = 1.
Hence, according to the definition none of the rankings are in
disagreement with the α-majority.
Based on this definition, we now design a weight assignment
ule for the input rankings.
.1.1. Assigning quality scores to input rankings
Let R1 to RN be the input rankings. Also, let dijl denote the pref-
rence relation between items i and j as obtained from the rank-
ng Rl. As discussed in Section 5, preference relation between two
tems is determined by considering the relative positions of the
tems in the ranking. For each input ranking Rl, we also consider
hat all items that are present in Rl are preferred over all other
tems that are not in Rl. However, if both i and j are not present in
l, we cannot comment on the opinion of Rl on the preference rela-
ion involving this item pair. We define the disagreement of Rl with
nput rankings (R) as the number of item pairs for which Rl differs
rom α-majority opinion on the relative ordering of the items. We
efine the disagreement score for ranking Rl as:
l =∑(i, j)
∈S×S
δi jl . (3)
r
here
i jl ={
0, if Rl does not disagree with α-majority for (i, j)1, if Rl disagrees with α-majority for (i, j)0.5, if both i and j are not ranked by Rl .
(4)
ere S is the set of distinct items that appear in the input rankings.
isagreements with α-majority are determined using the condi-
ions described in the previous section. α and β are parameters of
he algorithm. Their values remain same for all input cases. Weight
f the ranking Rl is then set as
l = 1 − �l(|S|2
) . (5)
l denotes the fraction of item pairs for which Rl agrees with α-
ajority. Rankings which agree with α-majority for more number
f item pairs get high weights according to this scheme.
.1.2. Weighted aggregation of input preference graphs
Once the weights of the input rankings are determined, an ag-
regate graph (GA) can be constructed by taking a weighted com-
ination of the preference relations obtained from the rankings. GAontains as nodes all the items in S, i.e. the items appearing in at
east one of the input rankings. Weight of the edge from i to j in
A, denoted as ei jA, is computed as:
i jA =∑
ei jk is in Gk
(wkei jk
). (6)
In Eq. (6), the summation runs over the individual rankings that
rovide preference relations for the pair (i, j). wk is the weight of
he ranking Rk, and eijk denotes the weight of the preference edge
rom i to j in the preference graph corresponding to the input rank-
ng Rk. Similarly, weight for the directed edge from j to i in GA is
et to e jiA = ∑e jik is in Gk
(wke jik
).
It may be recalled from Section 5 that the weight of the edge
rom i to j is set to 1 in a preference graph if and only if the cor-
esponding ranking prefers j over i. Hence, from Eq. (6) it can be
aid that: the weight of directed edge (i, j) in GA represents the to-
al weighted votes in favor of the preference relation j is better than
as given by the input rankings. This weight is high if many of the
ood rankings place j above i in their orderings.
.2. Inducing linear order
The aggregate graph GA may not represent a total order. How-
ver, the output of rank aggregation has to be a total order. So, we
ave to induce a total order from the preference relations stored
n GA. This can be achieved in several ways. The different algo-
ithms suggested for the minimum feedback arc set problem try to
ose this as an optimization problem. Extended Markov chain pro-
edure explained in Dwork et al. (2001) also can be used for this
urpose.
However, methods that use the extended Markov chain or
inimize feedback arc set are of higher complexity. On the other
and, in metasearch, the aggregation is performed in runtime,
hen the user is waiting for the results. Hence, we wanted a fast
lgorithm that can be used for finding the total order. We use
heuristic based method for this purpose. It first computes the
eighted indegree of each node of GA. The weighted indegree of a
ode j is given by σ j = ∑i∈S ei jA. From the way the values ei jA are
omputed, it can be seen σ j is high if many good rankers consider
tem j to be better than many other items. The heuristic sorts the
odes of the aggregate graph in decreasing order of their weighted
ndegrees. This sorted order of the nodes gives the final output of
he algorithm. The unweighted version of this algorithm, where all
ankers are given equal weights, was proposed in Copeland (1951).

92 M.S. Desarkar et al. / Expert Systems With Applications 49 (2016) 86–98
(
n
t
m
f
(
w
m
m
n
s
m
t
t
t
w
h
w
t
i
a
a
e
O
t
l
r
s
H
d
7
p
s
m
s
m
a
b
r
Z
1
L
a
v
o
t
v
d
i
p
e
i
S
d
M
t
t
r
6.3. Complexity of the algorithm
We now analyze the complexity of the proposed rank aggrega-
tion algorithm.
• Aggregating preference graphs: In this phase, the algorithm finds
the α-majority opinion for each each item pair. The time com-
plexity for finding this information for an item pair is O(N)
where N is the number of input rankings. Once the majority
opinion is obtained, updating the disagreement count �l of the
N rankings requires O(N) time. If the total number of distinct
items is m, then there are O(m2) item pairs, and finding dis-
agreement counts of all rankings requires O(Nm2) time.
Once disagreement counts of all the rankings are computed,
computing the quality weights of the N rankings need O(N)
time. Hence the total complexity of this phase is O(Nm2 + N) =O(Nm2). It can be noted that any pairwise method for rank ag-
gregation must have a complexity of �(Nm2), as it has to look
at all pairs in all the input rankings.• Inducing linear order: This phase sorts the nodes in the graph by
their weighted indegrees. As there are m nodes in the graph,
computing the weighted indegrees takes O(m2) time. Sorting
can be done in O(mlog m) time. Hence, the complexity of this
phase is O(m2 + m log m) = O(m2).
Hence the complexity of the entire algorithm is O(Nm2). It is
worth mentioning that almost all of these operations involve
comparisons and additions. Moreover, careful examination of
the algorithm will indicate that the constants involved in the
order notations are also very small. As a result, the method is
very fast and suitable for real-time processing.
7. Experimental results
In this section, we compare the performance of the pro-
posed algorithm against existing unsupervised rank aggregation
algorithms.
7.1. Datasets used
We used Yahoo Learning to Rank Challenge (LTRC) dataset, Mi-
crosoft Learning to Rank (MSLR-WEB10K) dataset and LETOR 4.0
rank aggregation datasets (MQ2007-agg, MQ2008-agg) for our ex-
periments. The LETOR datasets are specifically for rank aggregation
and we use them directly.
The other two datasets viz. Yahoo-LTRC and MSLR-WEB10K
datasets contain scores given to different documents based on dif-
ferent features. We considered each feature as a ranker. For each
feature, we obtained the ranked list for a query by sorting the
documents in decreasing order of the scores. For MSLR-WEB10K
dataset, we considered the top 30 features according to the num-
ber of distinct scores assigned by the feature in the dataset. This
was to reduce the number of ties in the input rankings. Typically,
rankings received by metasearch engines do not have any ties.
Upon cross-referencing with the feature list given in Qin, Liu, Ding,
Xu, and Li (2010b), we found that these top 30 identified features
are (in order): (1) LMDIR.ABS for whole document, (2) BM25 score
for the whole document, (3) LMIR.DIR score for the whole docu-
ment, (4) LMDIR.JM score for the whole document, (5) LMIR.ABS
for the document body, (6) BM25 score for the document body,
(7) LMIR.DIR score for the document body, (8) LMIR.JM score for
the document body, (9) mean of tf∗idf for the whole document,
(10) sum of tf∗idf for the whole document, (11) mean of tf∗idf for
the document body, (12) sum of tf∗idf for the document body, (13)
variance of tf∗idf for the whole document, (14) variance of tf∗idf for
the document body, (15) vector space model score for the whole
document, (16) vector space model score for the document body,
17) PageRank score, (18) SiteRank score, (19) sum of stream length
ormalized term frequency for the whole document, (20) max of
f∗idf for the whole document, (21) LMIR.ABS score for the docu-
ent title, (22) sum of stream length normalized term frequency
or the document title, (23) max of tf∗idf for the document body,
24) mean of stream length normalized term frequency for the
hole document, (25) LMDIR.DIR score for the document title, (26)
ean of stream length normalized term frequency for the docu-
ent body, (27) BM25 score of the title, (28) max of stream length
ormalized term frequency for the whole document, (29) LMIR.JM
core for the document title and (30) max of stream length nor-
alized term frequency for the document body. It can be noted
hat, intuitively, all the features mentioned above are good indica-
ors of a document’s relevance for a given query. Hence we decided
o use these features as rankers.
We also changed each relevance label from rel to⌊
rel2
⌋. This
as done for two reasons: (a) as there are 5 relevance labels (0–4),
aving a document with relevance label 1 in the original data
ould increase the precision, whereas there are other documents
hat are much more relevant than this. We wanted to have those
n the top results. (b) If a document with relevance label 4 appears
t the top, then it influences the NDCG a lot. Changes in ordering
t remaining places may get unnoticed as a result. We performed
xperiments with original values of the relevance labels also.
rdering of the algorithms in terms of performance metrics were
he same as the ordering that we obtained using the modified
abels. Here we report the results obtained using the modified
elevance labels.
The Yahoo-LTRC dataset also was used in a similar way. We con-
idered top 45 features according to the number of distinct scores.
owever, names of the exact features are not available for this
ataset.
.2. Algorithms used for comparison
We compare the proposed algorithm with several other unsu-
ervised rank aggregation algorithms, namely, BORDA (uses po-
itional score) (de Borda, 1781), MC4 (uses Markov chain based
ethod) (Dwork et al., 2001), QSORT (optimizes Kendall-Tau
core), (Schalekamp & van Zuylen, 2009) LUCE-R (uses probabilistic
odel) (Clémençon & Jakubowicz, 2010). We refer to our algorithm
s WT-INDEG. We implemented another algorithm, EQ-INDEG, as a
aseline for our algorithm. EQ-INDEG gives equal weight to each
anking. EQ-INDEG was used as a baseline in Schalekamp and van
uylen (2009) and is a variant of the Copeland method (Copeland,
951). We did not implement LUCE-R due to complexity issues. For
UCE-R, we only compare the NDCG values reported in Clémençon
nd Jakubowicz (2010).
We also include for comparison performances of two super-
ised rank aggregation algorithms. The first algorithm is based
n Coset Permutation Distance (Qin et al., 2010a). We denote
his method as CPS(sup). For CPS(sup), the values for the super-
ised evaluation measures on the MQ2007-agg and MQ2008-agg
atasets are available at Qin et al. (2009). We use these values
n our comparisons. The other supervised algorithm that we com-
are with is a tree adaptation based supervised algorithm (Chen
t al., 2011). We denote the algorithm by TRADA(sup). For train-
ng, TRADA(sup) uses feature scores for the query–document pairs.
uch scores are not available in the LETOR datasets. Hence we
o not have metric values of TRADA(sup) for MQ2007-agg and
Q2008-agg datasets. We report the results of this algorithm for
he Yahoo dataset only.
For CPS(sup) and TRADA(sup), the word “sup” indicates that
he algorithms are supervised. Comparisons with supervised algo-
ithms should only be used as reference. Supervised algorithms are

M.S. Desarkar et al. / Expert Systems With Applications 49 (2016) 86–98 93
Table 1
Effect of parameter β on the MQ2007-agg dataset.
β 0 0.1 0.2 0.3 0.4 0.5 0.6 0.7 0.8 0.9 1
Mean NDCG 0.359 0.359 0.359 0.360 0.360 0.359 0.359 0.357 0.356 0.355 0.314
MAP 0.350 0.351 0.351 0.351 0.351 0.351 0.351 0.349 0.348 0.346 0.309
KT 0.408 0.409 0.409 0.409 0.409 0.409 0.409 0.408 0.407 0.407 0.509
ERR 0.204 0.204 0.204 0.204 0.205 0.204 0.204 0.203 0.202 0.201 0.162
Table 2
Effect of parameter β on the MQ2008-agg dataset.
β 0 0.1 0.2 0.3 0.4 0.5 0.6 0.7 0.8 0.9 1
Mean NDCG 0.450 0.450 0.448 0.445 0.438 0.435 0.418 0.401 0.307 0.297 0.307
MAP 0.437 0.437 0.434 0.430 0.425 0.423 0.407 0.391 0.310 0.295 0.301
KT 0.403 0.403 0.405 0.405 0.404 0.403 0.398 0.393 0.385 0.291 0.396
ERR 0.266 0.266 0.266 0.264 0.261 0.261 0.253 0.243 0.175 0.168 0.175
Table 3
Effect of parameter β on the Yahoo dataset.
β 0 0.1 0.2 0.3 0.4 0.5 0.6 0.7 0.8 0.9 1
Mean NDCG 0.486 0.487 0.487 0.489 0.489 0.489 0.490 0.493 0.452 0.406 0.355
MAP 0.459 0.459 0.459 0.461 0.461 0.461 0.462 0.463 0.434 0.400 0.364
KT 0.345 0.345 0.346 0.346 0.346 0.346 0.347 0.347 0.362 0.391 0.435
ERR 0.280 0.280 0.280 0.282 0.282 0.282 0.282 0.286 0.259 0.226 0.191
Table 4
Effect of parameter β on the MSLR-WEB10K dataset.
β 0 0.1 0.2 0.3 0.4 0.5 0.6 0.7 0.8 0.9 1
mNDCG 0.389 0.389 0.389 0.389 0.389 0.389 0.389 0.389 0.390 0.382 0.251
MAP 0.277 0.276 0.276 0.276 0.276 0.277 0.277 0.276 0.276 0.267 0.170
KT 0.172 0.171 0.171 0.171 0.171 0.172 0.172 0.171 0.172 0.171 0.084
ERR 0.235 0.237 0.237 0.237 0.237 0.237 0.238 0.239 0.243 0.272 0.449
e
l
7
e
t
(
q
7
p
r
w
(
t
m
v
m
t
o
d
t
t
u
t
c
w
n
a
a
i
e
t
M
T
t
t
u
r
v
r
r
o
t
v
h
e
d
d
a
t
b
w
t
e
a
p
i
xpected to perform better than unsupervised algorithms as they
ook at additional ground truth data for training.
.3. Evaluation metrics
We have used one unsupervised evaluation metric, namely, av-
rage Kendall-Tau (KT) distance and several supervised evalua-
ion metrics such as Precision, NDCG, MAP, mean NDCG and ERR
Chapelle, Metlzer, Zhang, & Grinspan, 2009) for determining the
ualities of the aggregate rankings.
.4. Parameter values for the proposed algorithm
As explained in Section 6.1, the proposed algorithm uses two
arameters α and β for determining the quality weights of the
ankers. We set α to 0.5 for all the datasets to indicate that we
ant the opinions given by the rankers to agree with majority
50% of the rankers). We used a small set of validation data to de-
ermine the value of β , that indicates the number of rankers that
ust have provided opinion for a document pair.
Ideally, high value of β indicates we want many rankers to pro-
ide relative orderings for each document pair. If β is set to 0, that
eans, we are not bothered about how many rankers provide rela-
ive rankings for the document pairs. Among the ones that provide
pinion for the pair, we compute the majority opinion and adjust
isagreement count accordingly. On the other hand, if β is set to
he maximum value 1.0, then it means that we want all the rankers
o provide opinions about the document pairs. In metasearch, it is
nlikely that all the rankers provide relative ranking opinion for
he document pairs. As a result, in this case, the disagreement
ount for all the rankings would remain as 0. Hence, all rankings
ould have equal weight, which, as explained in Section 6.1, may
ot be desired. It appears that β should be set to some moder-
te value. To determine that value, we used a subset of the data
s validation set. In our experiments with validation data, we var-
ed β from 0.0 to 1.0 in steps of 0.1. Based on the results of this
xperiment, we selected β = 0.3 for MQ2008-agg and β = 0.5 for
he other datasets. Effect of different β on complete MQ2007-agg,
Q2008-agg, Yahoo and MSLR-WEB10K datasets are mentioned in
ables 1, 2, 3 and 4, respectively.
It can be seen that, for MQ2007-agg and Yahoo as β increases,
he metric values do not change initially. However, after some
ime, (β = 0.9 for MQ2007-agg and β = 0.7 for Yahoo), the val-
es start degrading. This behavior is expected, as high value of βesults in less number of document pairs for which disagreement
alues can be updated. As a result, weights assigned to different
ankers become almost similar, and the performance of the algo-
ithm degrades. For MSLR-WEB10K data, the values were affected
nly when β was set to 1.0.
The behavior is quite different for MQ2008-agg. The degrada-
ion in performance starts much earlier. After β = 0.5, the metric
alues start degrading quickly. We tried to analyze the reason be-
ind this difference in behavior. To do so, we calculated the av-
rage number of opinions for each document pair in the three
atasets. This value for MQ2007-agg, Yahoo and MSLR-WEB10K
atasets were 0.5, 0.7 and 0.9 respectively. Whereas, for MQ2008-
gg, the value was only 0.18. As a result, even when β was set
o a moderate value of 0.5, it was difficult to get sufficient num-
er of opinions for the document pairs. Based on the observations,
e recommend the following heuristic for setting the value of β . If
here are N rankers and the average number of opinions available for
ach document pair is more than 50% of N, then set the value of beta
s 0.5. Otherwise set the value of β to 0.3.
In the following section, we compare the performance of the
roposed algorithm WT-INDEG with other algorithms mentioned
n Section 7.2. In the rest of the paper, metric values reported for

94 M.S. Desarkar et al. / Expert Systems With Applications 49 (2016) 86–98
Table 5
Comparing average KT distances.
Dataset → Yahoo MQ2007-agg MQ2008-agg MSLR-WEB10K
WT-INDEG 0.346 0.409 0.405 0.237
EQ-INDEG 0.311 0.379 0.357 0.216
BORDA 0.307 0.330 0.275 0.218
MC4 0.306 0.345 0.287 0.217
QSORT 0.151 0.307 0.244 0.214
TRADA(sup) – – 0.349 –
W
Table 6
NDCG comparison for MQ2007-agg dataset. Perfor-
mance of CPS(sup) is used as a reference.
Algorithm Rank positions
Name 2 4 6 8
WT-INDEG 0.234 0.250 0.265 0.279
EQ-INDEG 0.210 0.225 0.237 0.250
BORDA 0.201 0.213 0.225 0.238
MC4 0.179 0.195 0.206 0.218
QSORT 0.122 0.145 0.159 0.172
LUCE-R 0.233 0.245 0.258 0.268
CPS(sup) 0.332 0.341 0.352 0.362
Table 7
NDCG comparison for MQ2008-agg dataset. Perfor-
mance of CPS(sup) is used as a reference.
Algorithm Rank positions
Name 2 4 6 8
WT-INDEG 0.346 0.398 0.438 0.464
EQ-INDEG 0.308 0.370 0.416 0.441
BORDA 0.280 0.343 0.389 0.372
MC4 0.241 0.310 0.363 0.389
QSORT 0.155 0.228 0.283 0.325
LUCE-R 0.273 0.328 0.369 0.358
CPS(sup) 0.314 0.376 0.419 0.398
Table 8
NDCG comparison for Yahoo dataset. Performance of
TRADA(sup) is used as a reference. Results of LUCE-R
and CPS(sup) are not available for this dataset.
Algorithm Rank positions
Name 2 4 6 8
WT-INDEG 0.416 0.425 0.438 0.451
EQ-INDEG 0.347 0.373 0.389 0.404
BORDA 0.350 0.370 0.386 0.400
MC4 0.333 0.357 0.374 0.392
QSORT 0.341 0.361 0.376 0.394
TRADA(sup) 0.477 0.479 0.487 0.499
Table 9
NDCG comparison for MSLR-WEB10K dataset. Re-
sults of LUCE-R and CPS(sup) are not available for
this dataset.
Algorithm Rank positions
Name 2 4 6 8
WT-INDEG 0.249 0.251 0.260 0.265
EQ-INDEG 0.236 0.240 0.247 0.252
BORDA 0.233 0.239 0.244 0.249
MC4 0.213 0.223 0.231 0.238
QSORT 0.211 0.218 0.222 0.231
M
f
C
r
t
P
7
t
T
s
our algorithms correspond to α = 0.5 and β = 0.5 for MQ2007-agg,
Yahoo and MSLR-WEB10K datasets, and α = 0.5 and β = 0.3 for
MQ2008-agg. However, it can be noted that, for any dataset and
any evaluation metric (except KT distance), the proposed method
produces better result than the competitor algorithms for moder-
ate values (e.g. 0 ≤ β ≤ 0.5) of the parameter β .
7.5. The results
7.5.1. Comparing average Kendall-Tau (KT) distance
The KT value for LUCE-R is not mentioned in the correspond-
ing paper. The KT scores obtained by the other unsupervised al-
gorithms are shown in Table 5. Kendall-Tau distance between two
rankings is computed by counting the number of item pairs (i, j)
such that i is placed above j in one ranking and below j in an-
other. Average KT distance for the aggregate ranking is the aver-
age of the Kendall-Tau distances of the aggregate ranking with all
the input rankings. For this measure, lesser value indicates better
performance. It is clear from the table that QSORT is the best al-
gorithm for this evaluation metric. In fact QSORT is designed to
optimize the average KT distance of the aggregate ranking from
the input rankings. On the other hand, our algorithm WT-INDEG
performs poorly according to this metric. It obtains very high KT
scores for all the datasets.
This can be attributed to the following facts: (a) the proposed
method is a modification of EQ-INDEG which itself does not per-
form well according to the measure, and (b) we do not give equal
importance to all the rankers during the aggregation process. We
give lesser importance weights to the poor rankers to keep the ag-
gregate ranking far from them. This increases the average distance
of the aggregate ranking from the input rankings, which increases
the average Kendall-Tau distance. It has been pointed out in Yilmaz
et al. (2008), Carterette (2009) and Desarkar, Joshi, and Sarkar
(2011) that Kendall-Tau distance may not be suitable for evaluat-
ing of rank aggregation algorithms. Moreover, as the datasets used
for experimentation contain ground truth information in the form
of document relevance, supervised evaluation metrics can be used
to measure the performances of the algorithms. So we did not try
to modify our algorithm to obtain better KT score, but wanted to
see how it works according to the supervised evaluation metrics.
7.5.2. Comparing NDCG and Precision
We now compare the performances of the algorithms based
on the supervised evaluation metrics. We first consider NDCG and
Precision. For both these measures, higher values indicate bet-
ter performance. A comparison of NDCG values of the different
algorithms for the MQ2007-agg, MQ2008-agg, Yahoo and MSLR-
EB10K datasets are shown in Tables 6, 7, 8 and 9, respectively.
Compared to the other unsupervised algorithms, our method WT-
INDEG obtains better NDCG scores for all four datasets.
Performances of CPS(sup) and TRADA(sup), wherever available,
are provided for reference. Supervised algorithms are expected to
perform better than unsupervised algorithms. However, it is inter-
esting to note that WT-INDEG performs better than CPS(sup) for
Q2008-agg. Trada(sup) performs better than all other algorithms
or the Yahoo dataset.
The Precision values of the algorithms are compared in Fig. 2.
omparison with LUCE-R is not shown as Precision values are not
eported in the corresponding paper. From the figures it is clear
hat WT-INDEG is the best unsupervised algorithm according to
recision for all the four datasets.
.5.3. Comparing MAP and mean NDCG
For MAP and meanNDCG measures, higher value indicates bet-
er performance. The comparison of MAP values is shown in
able 10. WT-INDEG obtains the best MAP value among the un-
upervised algorithms for all the datasets. For all these datasets,

M.S. Desarkar et al. / Expert Systems With Applications 49 (2016) 86–98 95
0.1 0.12 0.14 0.16 0.18
0.2 0.22 0.24 0.26 0.28
0.3
2 3 4 5 6 7 8 9 10
Pre
cisi
on
Rank positions
Experiments with MQ2007-agg dataset
WT-INDEGEQ-INDEG
BORDAMC4
QSORT
(a) Precision@k for MQ2007-agg dataset
0.1
0.15
0.2
0.25
0.3
0.35
0.4
0.45
0.5
2 3 4 5 6 7 8 9 10
Pre
cisi
on
Rank positions
Experiments with MQ2008-agg dataset
WT-INDEGEQ-INDEG
BORDAMC4
QSORT
(b) Precision@k for MQ2008-agg dataset
0.3
0.35
0.4
0.45
0.5
2 3 4 5 6 7 8 9 10
Pre
cisi
on
Rank positions
Experiments with Yahoo dataset
WT-INDEGEQ-INDEG
BORDAMC4
QSORT
(c) Precision@k for Yahoo dataset
0.1 0.12 0.14 0.16 0.18
0.2 0.22 0.24 0.26 0.28
0.3
2 3 4 5 6 7 8 9 10
Pre
cisi
on
Rank positions
Experiments with MSLR-WEB10K dataset
WT-INDEGEQ-INDEG
BORDAMC4
QSORT
(d) Precision@k for MSLR-WEB10K dataset
Fig. 2. Comparison of Precision values of different unsupervised algorithms.
Table 10
Comparing MAP values. The results for CPS(sup) and TRADA(sup), wherever
available, are shown as a reference.
Dataset
MQ2007-agg MQ2008-agg Yahoo MSLR-WEB10K
WT-INDEG 0.351 0.430 0.461 0.277
EQ-INDEG 0.335 0.419 0.438 0.271
BORDA 0.325 0.394 0.436 0.269
MC4 0.316 0.369 0.430 0.263
QSORT 0.276 0.301 0.433 0.259
CPS(sup) 0.407 0.410 – –
TRADA(sup) – – 0.486 –
E
c
p
h
a
M
T
Table 11
Comparing mean NDCG. Results for CPS(sup) and TRADA(sup), wherever avail-
able, are shown as reference.
Dataset
MQ2007-agg MQ2008-agg Yahoo MSLR-WEB10K
WT-INDEG 0.360 0.445 0.489 0.389
EQ-INDEG 0.335 0.425 0.444 0.381
BORDA 0.322 0.390 0.442 0.378
MC4 0.309 0.372 0.430 0.372
QSORT 0.256 0.294 0.433 0.367
CPS(sup) 0.433 0.413 – –
TRADA(sup) – – 0.526 –
t
t
e
a
p
s
d
Q-INDEG appears as the second best unsupervised algorithm ac-
ording to MAP. For MQ2007-agg, WT-INDEG achieves a 4.8% im-
rovement over the closest baseline. For MQ2008-agg and Ya-
oo datasets, performance improvement by the proposed method
re 2.6% and 5.2%, respectively. This improvement is 2.2% for the
SLR-WEB10K dataset.
The comparison of mean NDCG values is shown in Table 11.
he results indicate that WT-INDEG performs the best among
he unsupervised algorithms used for comparison according to
his evaluation metric also. For all the four datasets, EQ-INDEG
merged as the second best unsupervised algorithm. For MQ2007-
gg, MQ2008-agg and Yahoo datasets, the improvements by the
roposed methods can be computed to be 7.5%, 4.7% and 10.1% re-
pectively. The improvement is small (2.1%) for the MSLR-WEB10K
ataset.
96 M.S. Desarkar et al. / Expert Systems With Applications 49 (2016) 86–98
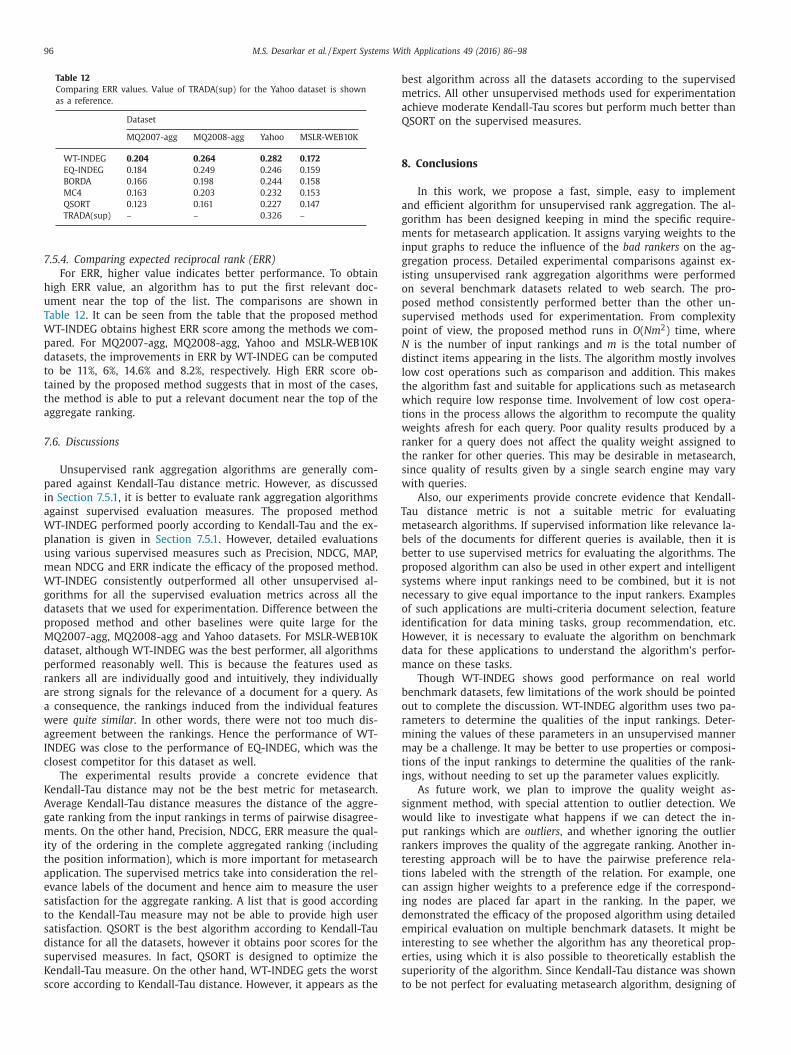
Table 12
Comparing ERR values. Value of TRADA(sup) for the Yahoo dataset is shown
as a reference.
Dataset
MQ2007-agg MQ2008-agg Yahoo MSLR-WEB10K
WT-INDEG 0.204 0.264 0.282 0.172
EQ-INDEG 0.184 0.249 0.246 0.159
BORDA 0.166 0.198 0.244 0.158
MC4 0.163 0.203 0.232 0.153
QSORT 0.123 0.161 0.227 0.147
TRADA(sup) – – 0.326 –
b
m
a
Q
8
a
g
m
i
g
i
o
p
s
p
N
d
l
t
w
t
w
r
t
s
w
T
m
b
b
p
s
n
o
i
H
d
m
b
o
r
m
m
t
i
s
w
p
r
t
t
c
i
d
e
i
e
s
t
7.5.4. Comparing expected reciprocal rank (ERR)
For ERR, higher value indicates better performance. To obtain
high ERR value, an algorithm has to put the first relevant doc-
ument near the top of the list. The comparisons are shown in
Table 12. It can be seen from the table that the proposed method
WT-INDEG obtains highest ERR score among the methods we com-
pared. For MQ2007-agg, MQ2008-agg, Yahoo and MSLR-WEB10K
datasets, the improvements in ERR by WT-INDEG can be computed
to be 11%, 6%, 14.6% and 8.2%, respectively. High ERR score ob-
tained by the proposed method suggests that in most of the cases,
the method is able to put a relevant document near the top of the
aggregate ranking.
7.6. Discussions
Unsupervised rank aggregation algorithms are generally com-
pared against Kendall-Tau distance metric. However, as discussed
in Section 7.5.1, it is better to evaluate rank aggregation algorithms
against supervised evaluation measures. The proposed method
WT-INDEG performed poorly according to Kendall-Tau and the ex-
planation is given in Section 7.5.1. However, detailed evaluations
using various supervised measures such as Precision, NDCG, MAP,
mean NDCG and ERR indicate the efficacy of the proposed method.
WT-INDEG consistently outperformed all other unsupervised al-
gorithms for all the supervised evaluation metrics across all the
datasets that we used for experimentation. Difference between the
proposed method and other baselines were quite large for the
MQ2007-agg, MQ2008-agg and Yahoo datasets. For MSLR-WEB10K
dataset, although WT-INDEG was the best performer, all algorithms
performed reasonably well. This is because the features used as
rankers all are individually good and intuitively, they individually
are strong signals for the relevance of a document for a query. As
a consequence, the rankings induced from the individual features
were quite similar. In other words, there were not too much dis-
agreement between the rankings. Hence the performance of WT-
INDEG was close to the performance of EQ-INDEG, which was the
closest competitor for this dataset as well.
The experimental results provide a concrete evidence that
Kendall-Tau distance may not be the best metric for metasearch.
Average Kendall-Tau distance measures the distance of the aggre-
gate ranking from the input rankings in terms of pairwise disagree-
ments. On the other hand, Precision, NDCG, ERR measure the qual-
ity of the ordering in the complete aggregated ranking (including
the position information), which is more important for metasearch
application. The supervised metrics take into consideration the rel-
evance labels of the document and hence aim to measure the user
satisfaction for the aggregate ranking. A list that is good according
to the Kendall-Tau measure may not be able to provide high user
satisfaction. QSORT is the best algorithm according to Kendall-Tau
distance for all the datasets, however it obtains poor scores for the
supervised measures. In fact, QSORT is designed to optimize the
Kendall-Tau measure. On the other hand, WT-INDEG gets the worst
score according to Kendall-Tau distance. However, it appears as the
est algorithm across all the datasets according to the supervised
etrics. All other unsupervised methods used for experimentation
chieve moderate Kendall-Tau scores but perform much better than
SORT on the supervised measures.
. Conclusions
In this work, we propose a fast, simple, easy to implement
nd efficient algorithm for unsupervised rank aggregation. The al-
orithm has been designed keeping in mind the specific require-
ents for metasearch application. It assigns varying weights to the
nput graphs to reduce the influence of the bad rankers on the ag-
regation process. Detailed experimental comparisons against ex-
sting unsupervised rank aggregation algorithms were performed
n several benchmark datasets related to web search. The pro-
osed method consistently performed better than the other un-
upervised methods used for experimentation. From complexity
oint of view, the proposed method runs in O(Nm2) time, where
is the number of input rankings and m is the total number of
istinct items appearing in the lists. The algorithm mostly involves
ow cost operations such as comparison and addition. This makes
he algorithm fast and suitable for applications such as metasearch
hich require low response time. Involvement of low cost opera-
ions in the process allows the algorithm to recompute the quality
eights afresh for each query. Poor quality results produced by a
anker for a query does not affect the quality weight assigned to
he ranker for other queries. This may be desirable in metasearch,
ince quality of results given by a single search engine may vary
ith queries.
Also, our experiments provide concrete evidence that Kendall-
au distance metric is not a suitable metric for evaluating
etasearch algorithms. If supervised information like relevance la-
els of the documents for different queries is available, then it is
etter to use supervised metrics for evaluating the algorithms. The
roposed algorithm can also be used in other expert and intelligent
ystems where input rankings need to be combined, but it is not
ecessary to give equal importance to the input rankers. Examples
f such applications are multi-criteria document selection, feature
dentification for data mining tasks, group recommendation, etc.
owever, it is necessary to evaluate the algorithm on benchmark
ata for these applications to understand the algorithm’s perfor-
ance on these tasks.
Though WT-INDEG shows good performance on real world
enchmark datasets, few limitations of the work should be pointed
ut to complete the discussion. WT-INDEG algorithm uses two pa-
ameters to determine the qualities of the input rankings. Deter-
ining the values of these parameters in an unsupervised manner
ay be a challenge. It may be better to use properties or composi-
ions of the input rankings to determine the qualities of the rank-
ngs, without needing to set up the parameter values explicitly.
As future work, we plan to improve the quality weight as-
ignment method, with special attention to outlier detection. We
ould like to investigate what happens if we can detect the in-
ut rankings which are outliers, and whether ignoring the outlier
ankers improves the quality of the aggregate ranking. Another in-
eresting approach will be to have the pairwise preference rela-
ions labeled with the strength of the relation. For example, one
an assign higher weights to a preference edge if the correspond-
ng nodes are placed far apart in the ranking. In the paper, we
emonstrated the efficacy of the proposed algorithm using detailed
mpirical evaluation on multiple benchmark datasets. It might be
nteresting to see whether the algorithm has any theoretical prop-
rties, using which it is also possible to theoretically establish the
uperiority of the algorithm. Since Kendall-Tau distance was shown
o be not perfect for evaluating metasearch algorithm, designing of

M.S. Desarkar et al. / Expert Systems With Applications 49 (2016) 86–98 97
a
l
A
M
R
A
A
A
A
A
B
B
d
B
B
C
C
C
C
C
C
C
C
C
C
C
C
C
C
D
D
D
E
F
F
F
J
J
J
K
K
K
L
L
L
L
L
M
M
M
O
P
P
P
P
Q
Q
Q
R
R
lternative unsupervised evaluation metrics for metasearch prob-
em would be another interesting research direction.
cknowledgment
Work of the first author is supported by a Ph.D. Fellowship from
icrosoft Research, India.
eferences
charyya, S., Koyejo, O., & Ghosh, J. (2012). Learning to rank with Bregman diver-gences and monotone retargeting. In Proceedings of the twenty-eighth conference
on uncertainty in artificial intelligence, Catalina Island, CA, USA, August 14–18,2012 (pp. 15–25).
ilon, N., Charikar, M., & Newman, A. (2008). Aggregating inconsistent information:ranking and clustering. Journal of the ACM, 55(5), 1–27.
lireza, Y., & Leonardo Duenas-Osorio, Q. L. (2013). A scoring mechanism for the
rank aggregation of network robustness. Communications in Nonlinear Scienceand Numerical Simulation, 18(10), 2722–2732.
min, G. R., & Emrouznejad, A. (2011). Optimizing search engines results using lin-ear programming. Expert Systems With Applications, 38, 11534–11537.
slam, J. A., & Montague, M. (2001). Models for metasearch. In Proceedings of the24th annual international ACM SIGIR conference on research and development in
information retrieval, SIGIR’01 (pp. 276–284). New York, NY, USA: ACM.
altrunas, L., Makcinskas, T., & Ricci, F. (2010). Group recommendations withrank aggregation and collaborative filtering. In Proceedings of conference on
recommender systems, RecSys (pp. 119–126).etzler, N., Bredereck, R., & Niedermeier, R. (2014). Theoretical and empirical evalu-
ation of data reduction for exact Kemeny rank aggregation. Autonomous Agentsand Multi-Agent Systems, 28(5), 721–748.
e Borda, J. C. (1781). Mémoire sur les élections au scrutin. Histoire de
l’Académie Royale des Sciences.rody, S., Navigli, R., & Lapata, M. (2006). Ensemble methods for unsupervised WSD.
In Proceedings of the 21st international conference on computational linguisticsand the 44th annual meeting of the association for computational linguistics, ACL-
44.urges, C. J. C., Ragno, R., & Le, Q. V. (2006). Learning to rank with nonsmooth cost
functions. In Advances in neural information processing systems 19: proceedings of
the twentieth annual conference on neural information processing systems, Vancou-ver, British Columbia, Canada, December 4–7, 2006 (pp. 193–200).
ao, Y., Xu, J., Liu, T. Y., Li, H., Huang, Y., & Hon, H. W. (2006). Adapting rankingSVM to document retrieval. Proceedings of the 29th annual international ACM
SIGIR conference on research and development in information retrieval, SIGIR’06(pp. 186–193). New York, NY, USA: ACM.
ao, Z., Qin, T., Liu, T. Y., Tsai, M. F., & Li, H. (2007). Learning to rank: from pairwiseapproach to listwise approach. Proceedings of the 24th international conference
on machine learning, ICML’07 (pp. 129–136). New York, NY, USA: ACM.
arterette, B. (2009). On rank correlation and the distance between rankings. In Pro-ceedings of the 32nd international ACM SIGIR conference on research and develop-
ment in information retrieval, SIGIR’09 (pp. 436–443).hapelle, O. Chang, Y. (2010). Yahoo learning to rank challenge data. http://
learningtorankchallenge.yahoo.com/datasets.php. Accessed: 27.08.15.hapelle, O., & Chang, Y. (2011). Yahoo! learning to rank challenge overview. In Pro-
ceedings of the Yahoo! learning to rank challenge, held at ICML 2010, Haifa, Israel,
June 25, 2010 (pp. 1–24).hapelle, O., Metlzer, D., Zhang, Y., & Grinspan, P. (2009). Expected reciprocal rank
for graded relevance. In Proceeding of the 18th ACM conference on informationand knowledge management, CIKM’09 (pp. 621–630).
hen, K., Bai, J., & Zheng, Z. (2011). Ranking function adaptation with boosting trees.ACM Transactions on Information Systems, 29(4), 18:1–18:31.
hen, S., Wang, F., Song, Y., & Zhang, C. (2008). Semi-supervised ranking aggre-
gation. In Proceeding of the 17th ACM conference on information and knowledgemanagement, Cikm’08 (pp. 1427–1428).
hen, Y., & Hofmann, K. (2015). Online learning to rank: absolute vs. relative. Pro-ceedings of the 24th international conference on world wide web, WWW’15 Com-
panion (pp. 19–20). Republic and Canton of Geneva, Switzerland: InternationalWorld Wide Web Conferences Steering Committee.
lémençon, S., & Jakubowicz, J. (2010). Kantorovich distances between rankings with
applications to rank aggregation. In Proceedings of the 2010 european conferenceon machine learning and knowledge discovery in databases: part I, ECML PKDD’10
(pp. 248–263).ohen, W. W., Schapire, R. E., & Singer, Y. (1998). Learning to order things. In Pro-
ceedings of the 1997 conference on advances in neural information processing sys-tems 10, Nips’97 (pp. 451–457).
ondorcet, J. A. N. d. C. (1785). Essai sur l’application de l’analyse a la probabilite des
decisions rendues a la pluralite des voix. Paris: Imprimerie Royale.opeland, A. (1951). A ’reasonable’ social welfare function. In Proceedings of seminar
on applications of mathematics to social sciences.oppersmith, D., Fleischer, L. K., & Rurda, A. (2010). Ordering by weighted number
of wins gives a good ranking for weighted tournaments. ACM Transactions onAlgorithms, 6, 55:1–55:13.
avenport, A., & Kalagnanam, J. (2004). A computational study of the Kemeny rule
for preference aggregation. Proceedings of the 19th national conference on artificalintelligence, AAAI’04 (pp. 697–702). AAAI Press.
esarkar, M. S., Joshi, R., & Sarkar, S. (2011). Displacement based unsupervised met-ric for evaluating rank aggregation. Proceedings of the 4th international confer-
ence on pattern recognition and machine intelligence, PReMI’11 (pp. 268–273).Berlin, Heidelberg: Springer-Verlag.
work, C., Kumar, R., Naor, M., & Sivakumar, D. (2001). Rank aggregation methodsfor the web. In Proceedings of the 10th international conference on world wide
web, WWW’01 (pp. 613–622).lkind, E., & Lipmaa, H. (2005). Hybrid voting protocols and hardness of manipula-
tion. In Proceedings of the 16th international symposium on algorithms and com-
putation (pp. 206–215). Springer-Verlag.ang, Q., Feng, J., & Ng, W. (2011). Identifying differentially expressed genes via
weighted rank aggregation. Proceedings of the 11th international conference ondata mining, ICDM’11 (pp. 1038–1043). IEEE Computer Society.
arah, M., & Vanderpooten, D. (2007). An outranking approach for rank aggrega-tion in information retrieval. Proceedings of the 30th annual international ACM
SIGIR conference on research and development in information retrieval, SIGIR’07
(pp. 591–598). New York, NY, USA: ACM.ields, E. B., Okudan, G. E., & Ashour, O. M. (2013). Rank aggregation methods com-
parison: a case for triage prioritization. Expert Systems with Applications, 40(4),1305–1311.
ameson, A., & Smyth, B. (2007). The adaptive web (pp. 596–627). Berlin, Heidelberg:Springer-Verlag.
ansen, B. J., Spink, A., & Koshman, S. (2007). Web searcher interaction with the
dogpile.com metasearch engine. Journal of the American Society for InformationScience and Technology, 58(5), 744–755.
ean, M. (1961). Black (duncan) – the theory of committees and elections. RevueEconomique, 12(4), 668.
eyhanipour, A. H., Moshiri, B., & Rahgozar, M. (2015). Cf-rank: learning to rank byclassifier fusion on click-through data. Expert Systems with Applications, 42(22),
8597–8608.
lementiev, A., Roth, D., & Small, K. (2008). Unsupervised rank aggregation withdistance-based models. In Proceedings of the 25th international conference on ma-
chine learning, ICML’08 (pp. 472–479). New York, NY, USA: ACM.lementiev, A., Roth, D., Small, K., & Titov, I. (2009). Unsupervised rank aggregation
with domain-specific expertise. In Proceedings of IJCAI (pp. 1101–1106).ee, J. H. (1997). Analyses of multiple evidence combination. In Proceedings of the
20th annual international ACM SIGIR conference on research and development in
information retrieval, SIGIR ’97 (pp. 267–276).i, H. (2011). A short introduction to learning to rank. IEICE Transactions, 94-D(10),
1854–1862.i, P., Burges, C., & Wu, Q. (2008). Learning to rank using classification and gradient
boosting. In Proceedings of international conference on advances in neural infor-mation processing systems 20, MSR-TR-2007-74. Cambridge, MA: MIT Press.
illis, D., Toolan, F., Mur, A., Peng, L., Collier, R., & Dunnion, J. (2006). Probability-
based fusion of information retrieval result sets. Artificial Intelligence Review,25(1–2), 179–191.
iu, Y. T., Liu, T. Y., Qin, T., Ma, Z. M., & Li, H. (2007). Supervised rank aggregation.In Proceedings of the 16th international conference on world wide web, WWW’07
(pp. 481–490).ehta, S., Pimplikar, R., Singh, A., Varshney, L. R., & Visweswariah, K. (2013). Effi-
cient multifaceted screening of job applicants. Proceedings of the 16th interna-tional conference on extending database technology, EDBT’13 (pp. 661–671). New
York, NY, USA: ACM.
ontague, M., & Aslam, J. A. (2002). Condorcet fusion for improved retrieval. InProceedings of the eleventh international conference on information and knowledge
management, CIKM’02 (pp. 538–548).onwar, M. M., & Gavrilova, M. L. (2013). Markov chain model for multimodal bio-
metric rank fusion. Signal, Image and Video Processing, 7(1), 137–149.zdemiray, A. M., & Altingovde, I. S. (2015). Explicit search result diversification us-
ing score and rank aggregation methods. Journal of the Association for Informa-
tion Science and Technology, 66(6), 1212–1228.an, Y., Luo, H., Qi, H., & Tang, Y. (2011). Transductive learning to rank using associ-
ation rules. Expert Systems with Applications, 38(10), 12839–12844.atel, T., Telesca, D., Rallo, R., George, S., Tian, X., & Andre, N. (2013). Hierarchical
rank aggregation with applications to nanotoxicology. Journal of Agricultural, Bi-ological, and Environmental Statistics, 18(2), 159–177.
ihur, V., Datta, S., & Datta, S. (2007). Weighted rank aggregation of cluster vali-
dation measures: a monte carlo cross-entropy approach. Bioinformatics, 23(13),1607–1615.
ujari, M., & Kanawati, R. (2012). Link prediction in complex networks by super-vised rank aggregation. In Proceedings of 2012 IEEE 24th international conference
onTools with artificial intelligence, ICTAI: 1 (pp. 782–789).in, T., Geng, X., & Liu, T. Y. (2010a). A new probabilistic model for rank aggrega-
tion. In Proceedings of international conference on advances in neural information
processing systems (pp. 1948–1956).in, T., Liu, T. Y., Ding, W., Xu, J. Li, H. (2010b). MSLR-WEB10K feature list. http:
//research.microsoft.com/en-us/projects/mslr/feature.aspx. Accessed: 27.08.15.in, T., Liu, T. Y., Xu, J. Li, H. (2009). Letor dataset. http://research.microsoft.com/
en-us/um/beijing/projects/letor/letor4dataset.aspx. Accessed: 27.08.15.ajkumar, A., & Agarwal, S. (2014). A statistical convergence perspective of algo-
rithms for rank aggregation from pairwise data. In Proceedings of the 31st inter-
national conference on machine learning, ICML-14. In JMLR Workshop and Confer-ence Proceedings (pp. 118–126).
osti, A. I., Ayan, N. F., Xiang, B., Matsoukas, S., Schwartz, R., & Dorr, B. J. (2007).Combining outputs from multiple machine translation systems. In Proceedings of
the North American chapter of the association for computational linguistics humanlanguage technologies (pp. 228–235).

98 M.S. Desarkar et al. / Expert Systems With Applications 49 (2016) 86–98
T
W
W
W
W
Y
v
Sagae, K., & Lavie, A. (2006). Parser combination by reparsing. In Proceedings ofHLT/NAACL (pp. 129–132).
Sarkar, C., Cooley, S., & Srivastava, J. (2014). Robust feature selection technique usingrank aggregation. Applied Artificial Intelligence, 28(3), 243–257.
Schalekamp, F., & van Zuylen, A. (2009). Rank aggregation: together we’re strong. InProceedings of ALENEX (pp. 38–51).
Sculley, D. (2009). Large scale learning to rank. In Proceedings of NIPS workshop onadvances in ranking (pp. 1–6).
Shao, Z., Chen, Z., & Huang, X. (2010). A mobile service recommendation system
using multi-criteria ratings. International Journal of Interdisciplinary Telecommu-nications and Networking, 2(4), 30–40.
Shaw, J. A., & Fox, E. A. (1994). Combination of multiple searches. In Proceedings ofthe second text retrieval conference, TREC-2 (pp. 243–252).
Sohail, S., Siddiqui, J., & Ali, R. (2015). User feedback based evaluation of a productrecommendation system using rank aggregation method, Advances in intelligent
systems and computing: Vol. 320. Advances in intelligent informatics (pp. 349–
358). Springer International Publishing.Tabourier, L., Libert, A. S., & Lambiotte, R. (2014). Rankmerging: learning to rank in
large-scale social networks. In Proceedings of dynamic networks and knowledgediscovery workshop in ECML-PKDD 2014, DyNaK-II: Vol. 320.
homas, P., & Hawking, D. (2009). Server selection methods in personal metasearch:a comparative empirical study. Information Retrieval, 12(5), 581–604.
ang, Y., Huang, Y., Pang, X., Lu, M., Xie, M., & Liu, J. (2013). Supervised rank aggre-gation based on query similarity for document retrieval. Soft Computing, 17(3),
421–429.eston, J., Yee, H., & Weiss, R. J. (2013). Learning to rank recommendations with
the k-order statistic loss. Proceedings of the 7th ACM conference on recommendersystems, RecSys’13 (pp. 245–248). New York, NY, USA: ACM.
u, G., Greene, D., & Cunningham, P. (2010). Merging multiple criteria to identify
suspicious reviews. In Proceedings of the fourth ACM conference on recommendersystems, RecSys’10 (pp. 241–244).
u, S., Li, J., Zeng, X., & Bi, Y. (2014). Adaptive data fusion methods in informationretrieval. Journal of the Association for Information Science and Technology, 65(10),
2048–2061.ilmaz, E., Aslam, J. A., & Robertson, S. (2008). A new rank correlation coefficient
for information retrieval. In Proceedings of the 31st annual international ACM
SIGIR conference on research and development in information retrieval, SIGIR’08(pp. 587–594).
an Zuylen, A., & Williamson, D. P. (2007). Deterministic algorithms for rank ag-gregation and other ranking and clustering problems. In Proceeding of WAOA
(pp. 260–273).