predictive modeling with consumer data - member | … · using predictive modeling and con- ......
TRANSCRIPT

Article from:
The Actuary
October/November 2011 – Volume 8 Issue 5

Consumer DataPredictive Modeling with
0.60%Running/JoggingPrevalence of cardiovascular disease by interest
health care reforM will re-
quire health insurers to change the
way they make decisions on what
to sell while remaining financially sound. The
new regulatory reality of expanded access to
coverage leaves insurers with fewer options
for managing costs and business risk. With the
introduction of risk adjustment mechanisms in
the exchanges, the most profitable members
will not necessarily be the lowest cost ones,
but rather, the members which the health
plan is relatively more effective at servic-
ing. While Patient Protection and Af-
fordable Care Act (PPACA) prohibits
underwriting and using any health
status information for denying cov-
erage or varying the premium rates,
using predictive modeling and con-
sumer data to help identify and market
to these members will allow carriers to remain
competitive in the post-reform world.
What does this all mean for a consumer?
28 | the actuary | OctOber/nOvember 2011

Consumer DataBy Ksenia draaghtel
1.33%BiCyClingPrevalence of cardiovascular disease by interest
The greater awareness of the publicly avail-
able consumer data and its uses in the in-
dustry may make some consumers nervous.
Consumer data is self-reported and inferred
information about individuals and house-
holds that is primarily used for marketing
purposes. It is collected and aggregated
by a number of commercial data vendors.
However, having information and knowl-
edge is power for a consumer as well. “How
accurate are these data? What is the source
of this information? How is it used in the
health insurance industry?” All are valid
questions and deserve consideration.
the Business needsEFFICIENCY THROUGH SEGMENTATION
Facing myriad regulatory restrictions, many
carriers are starting to explore their unique
competitive advantages in their markets and
the ways they can “play” the efficiency game in
order to remain competitive. PPACA explicitly
prohibits marketing practices that can be used
here’s how using consuMer data will affect the way health insur-ers MaKe decisions on what Prod-ucts to sell.
to identify individuals who are
less likely to become claimants and
discourage enrollment of those with signifi-
cant health care needs.1 With restricted abil-
ity to accurately price individual risks, what
if areas of greatest comparative advantage
are identified and offered to the subpopula-
tions that would benefit from these particu-
lar services? With the introduction of risk
adjustment mechanisms in the exchanges,
the prior goal of attracting healthier seg-
ments of the population is no longer neces-
sarily the optimal strategy.
We expect that some health plans are more
effective at managing certain conditions
and providing certain services more cost-
effectively than others. They have dedicat-
ed resources to improving their outcomes
in certain areas, gained the expertise, ac-
quired appropriate staff and technology,
and hence are better positioned to serve
these populations. Predictive modeling
OctOber/nOvember 2011 | the actuary | 29

TEA (UNITS) COFFEE
(UNITS)
TEA,
COST/UNIT
COFFEE,
COST/UNIT
china 560 80 $10 $70
Brazil 200 400 $20 $10
to producing one of these two goods, China and
Brazil would be able to produce the quantity of
tea and coffee noted in the graph below.
While China can produce both tea and cof-
fee, it is more advantageous (cheaper) for
China to produce excess tea and trade with
Brazil for coffee for the price closer to the
price of producing tea. Brazil benefits from
this trade because its cost of producing cof-
fee has not changed, but the price of tea has
been reduced by half. Therefore, both parties
benefit from the trade by specializing and fo-
cusing their efforts on the product with the
most comparative advantage and trading
with other parties for the remaining products.
Similarly, it is more economically advantageous
for a plan with a $400 per member per month
(PMPM) incurred claim cost to provide care for
patients with heart disease and $600 PMPM to
provide care for chronic obstructive pulmonary
disease (COPD) patients to attract a greater
number of heart patients, than it is for a plan
where it costs $500 PMPM to cover either
COPD or heart disease members. We are as-
suming that each plan has the same quality of
care for each condition.
One potential approach for identifying the
areas of competitive advantage is by using a
carrier’s past experience to calculate the in-
surer’s financial gain/loss for each member.
Given each member’s condition profile, the
difference (gain or loss) between the carrier’s
actual total incurred claim costs for each
member and the expected average market
cost can be calculated. A reasonable proxy
for the expected average market cost across
competitors for health care services utilized
by a member is a risk adjuster predicted cost
using an out-of-the-box risk adjuster model.
The risk adjuster predictions can be obtained
from a commercial risk adjuster model that is
calibrated on a general population basis as
opposed to the carrier’s specific population.
Comparing the member’s expected market
cost to the carrier’s actual claim cost can pro-
vide valuable insight to the areas in which the
carrier provides and delivers care most and
least efficiently. Examples of potential areas
of advantage (or disadvantage) may include:
and consumer data offer a way for insurers to
identify their areas of competitive advantage
by segmenting the population and identifying
subpopulations that are most likely to benefit
from their products and services. It’s a win-win
proposition: insurers can become more com-
petitive by spending their resources in places
they can manage care more efficiently than
their competitors, and consumers benefit by
finding plans that fit their needs. The similar
approach is used now in the Medicare Special
Needs Plans that are designed to insure mem-
bers with specific conditions.
In economics, the concept of comparative
advantage states that two parties (companies,
countries or individuals) can benefit from a
trade of goods or services if without the trade
they have different relative costs of producing
the goods or services. The concept was first in-
troduced back in 1817 by David Ricardo in his
book titled “On the Principles of Political Econ-
omy and Taxation.”2 As a simple illustration, as-
sume that if all resources were dedicated solely
3.02%FishingPrevalence of cardiovascular disease by interest
3.39%Camping/hiking
Prevalence of cardiovascular disease by interest
30 | the actuary | OctOber/nOvember 2011

• Which conditions’ presence contributes
to the gain and loss? For example, a
large portion of members with a finan-
cial gain may have had claims associat-
ed with asthma, recognizing that the car-
rier may manage these patients better
than the average insurer in the market.
• Which commonly available mem-
ber characteristics (e.g., age, gender,
product type, region of residence)
contribute to the gain and loss? For
example, a large portion of members
with financial gain may be females
between the ages of 25 and 30 in a cer-
tain geographical region.
• Are there particular service types (e.g.,
inpatient/outpatient/pharmaceutical,
inpatient surgery, maternity, mental
health) which contribute to the gain
and loss? For example, a large portion
of members with financial gain may
have had maternity services.
• What lifestyle and socioeconomic
characteristics contribute to the gain
and loss? For example, a large por-
tion of members with a financial gain
might have an estimated household
income of $60,000 to $124,999, own
two or more vehicles, and have dem-
onstrated frugal spending behavior.
This information is also valuable in iden-
tifying areas for further improvement. For
example, if the incurred costs are signifi-
cantly higher for patients with mental health
disorders, this may indicate that this is one
clinical area where better integration of
care is needed. Once the areas of relative
advantage have been identified, consumer
data and predictive modeling can further
assist in identifying the consumer and de-
mographic characteristics of the population
segments (such as those listed in the ex-
amples above) associated with the area of
competitive advantage. A predictive model
3.39%Camping/hiking
Prevalence of cardiovascular disease by interest
2.36%golFingPrevalence of cardiovascular disease by interest
Consumer DataPredictive Modeling with

can synthesize all of this information to cre-
ate a scoring methodology which can then
be applied prospectively. This analysis and
the resulting model have multiple business
applications, including:
• Product design and pricing: Identifying
gaps in coverage and designing prod-
ucts that serve specific markets.
• Patient-centered care delivery: Design-
ing care delivery programs that serve
patient needs more effectively.
• Provider network customization and ne-
gotiation: Choosing providers who are
best able to serve the needs of a given
population most cost-effectively.
• Sales and marketing: Finding new
markets for given products based on
demographic and lifestyle character-
istics.
• Cost reduction: Finding consumers
who can be served most effectively by
an insurer.
SEGMENTATION WITH CONSUMER
DATA
“It is estimated that lifestyle-related chronic
diseases account for 70 percent of the na-
tion’s medical care costs, which translates to
more than 11 percent of the entire U.S. gross
domestic product.”3
Consumer data and predictive modeling—cor-
relating commercially available lifestyle and
demographic data with disease incidence—
has been around for years and provides a way
to use nontraditional publicly available life-
style information to stratify individuals by risk.
Suppose that a health plan has determined that
it is comparatively more effective at provid-
ing coverage for members with heart disease
and therefore would like to attract prospec-
tive members with this condition. If this is the
case, having the ability to determine and con-
sequently use the information contained in
Table 1 is key to implementing the engage-
ment and enrollment strategy. One dimen-
sion in a population segmentation aimed
at finding members with higher likelihood
of having heart disease would be to identify
individuals with interest in flower gardening
and walking for health.
Models can be built which rely purely on con-
sumer data as predictor elements to predict a
likelihood of certain medical conditions. The
advantage of such a model is that it can be ap-
plied to a large population base after purchas-
ing their consumer data. This approach exploits
correlations between lifestyle characteristics
taBle 1: Prevalence of cardiovascular disease By self-rePorted favorite interest
REpORTED FAvORITE INTEREST pREvAlENCE
running/Jogging 0.60%
Bicycling 1.33%
golfing 2.36%
fishing 3.02%
camping/hiking 3.39%
home workshop/do-it-yourself 3.42%
avid Book reading 3.91%
walking for health 4.03%
flower gardening 4.55%
Source: Based on data used in Milliman’s past analysis.
3.91%aviD Book ReaDingPrevalence of cardiovascular disease by interest
32 | the actuary | OctOber/nOvember 2011
$150
$175
$200
$225
$250
$275
$300
1 2 3 4 5 6 7 8 9 10
PMPM
Cos
t
Manual PMPM
Manual+LBA PMPM
Actual PMPM
and medical conditions and in combination
with statistics and modeling techniques deter-
mines correlations between the lifestyle infor-
mation and prevalence of various diseases.
It is important to be realistic about the pre-
dictive power of the lifestyle information. It
will not replace past actual claim experience
or information gathered through health risk
assessment surveys (that is, if it can still be
gathered). However, in the absence of any
other source of information, consumer data
can be an extremely useful resource for
health actuaries.
I have been heavily involved in using consum-
er data over the last five years in my consult-
ing practice. We have completed a number of
projects in which we have built and helped
clients to implement such models for under-
writing purposes. After completing these proj-
ects, we determined that the power of this ap-
proach is in its ability to stratify members more
effectively than age and gender and enhance
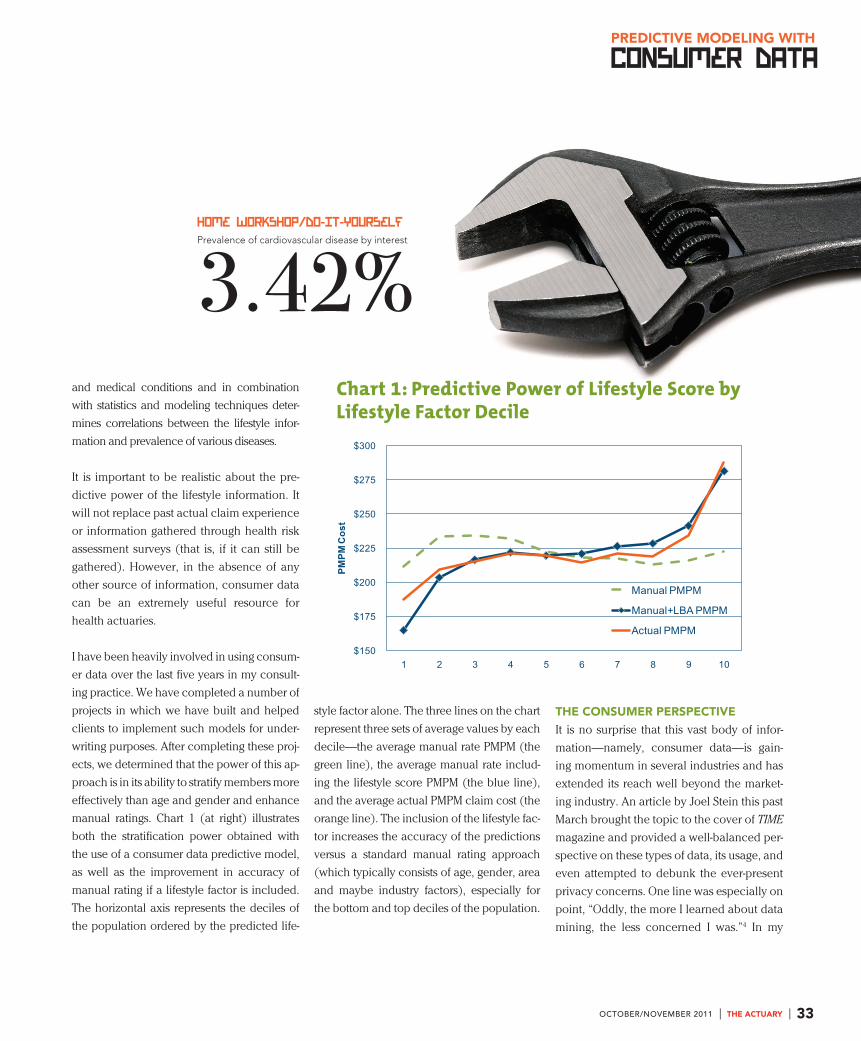
manual ratings. Chart 1 (at right) illustrates
both the stratification power obtained with
the use of a consumer data predictive model,
as well as the improvement in accuracy of
manual rating if a lifestyle factor is included.
The horizontal axis represents the deciles of
the population ordered by the predicted life-
style factor alone. The three lines on the chart
represent three sets of average values by each
decile—the average manual rate PMPM (the
green line), the average manual rate includ-
ing the lifestyle score PMPM (the blue line),
and the average actual PMPM claim cost (the
orange line). The inclusion of the lifestyle fac-
tor increases the accuracy of the predictions
versus a standard manual rating approach
(which typically consists of age, gender, area
and maybe industry factors), especially for
the bottom and top deciles of the population.
the consuMer PersPectiveIt is no surprise that this vast body of infor-
mation—namely, consumer data—is gain-
ing momentum in several industries and has
extended its reach well beyond the market-
ing industry. An article by Joel Stein this past
March brought the topic to the cover of TIME
magazine and provided a well-balanced per-
spective on these types of data, its usage, and
even attempted to debunk the ever-present
privacy concerns. One line was especially on
point, “Oddly, the more I learned about data
mining, the less concerned I was.”4 In my
Chart 1: Predictive Power of Lifestyle Score by Lifestyle Factor Decile
3.42%home WoRkshop/Do-it-youRselFPrevalence of cardiovascular disease by interest
OctOber/nOvember 2011 | the actuary | 33
Consumer DataPredictive Modeling with

own experience, the more informed consum-
ers are about what type of information about
them is truly out there, the less concerned
they become. There are many misconceptions
about the level of information that is gathered
and that someone will know everything about
you. However, the information available is typ-
ically at a much lower level of detail than most
people might assume. Moreover, the chances
of any human actually reading that informa-
tion specifically about you are rather slim.
So let’s review the sources of consumer data,
what they do and do not include, and the
data’s advantages and limitations. The con-
sumer data that we keep referring to comes
from commercial data aggregators. These
databases have their origins in the field of
marketing and are typically used to target ad-
vertising campaigns, particularly direct mail.
This type of data is available in some form
for approximately 95 percent of consumer
households in the United States, although the
number of variables included on a particular
household varies considerably. It does not
contain information protected by the Fair
Credit Reporting Act such as credit scores
or bank account information, nor does it
contain specific purchase data such as the
frequency of your stops at Wendy’s fast food
restaurants or the purchase of tobacco prod-
ucts. The specific data elements commonly
contained in consumer data include lifestyle in-
terests (fine dining, traveling, golf, etc.), demo-
graphic information (such as age, gender, fam-
ily composition and ethnicity), an approximate
home value, and possibly the type and number
of owned vehicles.
Consumer data can be roughly divided into
four general types:
• Self-reported: Typically gathered directly
from consumer surveys and registration
cards.
• Inferred: Data assumed to be true about
an individual or a household because of
the presence of other related informa-
tion. For example, one of your favorite
interests can be inferred to be golfing if a
certain number of occurrences of shop-
ping in a golf specialty store are present.
• Modeled: Variables arrived at through
the use of mathematical models whose
inputs are known variables about the
household or characteristics of its
neighborhood. Household income is
a good example of such an element,
which is frequently modeled using
other available information.
• Aggregated: Data compiled at the level
of block, neighborhood, ZIP code,
metropolitan statistical area (MSA),
city, state or other geographical re-
gion. These variables are usually avail-
able for 100 percent of households and
are often based on publicly available
sources such as U.S. Census data.
The price tag for this information is surprisingly
low, and varies anywhere from three to 10
cents per household for the standard set of in-
Learn about Predictive modeling techniques—read the collection of papers, “Predictive Modeling for Life Insurers,” at www.soa.org/predictive-modeling. A
4.55%FloWeR gaRDeningPrevalence of cardiovascular disease by interest
34 | the actuary | OctOber/nOvember 2011

formation, usually subject to minimum orders.
Certain proprietary or modeled variables may
increase the per-record cost. The usual method
of obtaining the consumer data is by matching
the name and address to the data and specify-
ing which variables are to be purchased.
what eleMents are Predictive?Different consumer data elements are corre-
lated with different medical conditions, and
not always in intuitive ways. We have found
that building condition-specific sub-models
and aggregating the results produces a much
more accurate prediction than modeling the
overall claim cost. Examples of correlations
found in past models include:
• Gambling is correlated with higher fu-
ture likelihood of diabetes claims.
• Purchasing men’s “big and tall” apparel
and women’s plus size clothing is cor-
related with higher future likelihood of
cardiovascular-disease-related claims.
• Presence of pets in a household is cor-
related with lower future likelihood of
pregnancy claims.
• An interest in dieting and weight con-
trol is correlated with higher future
likelihood of depression claims, while
watching sports on TV is correlated
with the lower future likelihood.
• Golfing, the presence of boats, or a
saltwater fishing license is correlated
with higher future likelihood of skin
cancer claims.
Some of these correlations appear fairly
intuitive, but others are not as obvious.
And, in any case, it is important not to
draw conclusions about causation.
Even if a strong correlation is pres-
ent, there is no implication that a
specific lifestyle attribute causes a
specific disease. Nevertheless, the
correlations do, in fact, exist, and
are statistically significant.
what is My lifestyle score?So what type of lifestyle infor-
mation makes its way into the
final lifestyle score for an indi-
vidual? As mentioned earlier
in the article, the lifestyle
score is a combination
of predicted expected
costs contributed by sev-
eral medical conditions.
Hence, for each
prediction, the
information con-
tained in a subset
4.03%Walking FoR healthPrevalence of cardiovascular disease by interest
OctOber/nOvember 2011 | the actuary | 35

REACTION OF AN ACTUARY AND CONSUMER
By ruth ann woodleyAs the subject guinea pig for this article, I
have found myself having some mixed reac-
tions. Going into the project, I had no direct
experience with how health insurers are us-
ing consumer data, but as I learned the ba-
sics, the idea sounded promising. As an ac-
tuary, I like the idea of using any data that
gives more accurate predictions of risk and
cost, as long as it is legal. Having seen how
my data was used, I am still a novice on the
topic, but here are my reactions—decidedly
not those of a professional with respect to
the topic, but colored by my actuarial back-
ground.
I had a chance to review the specific data
available for purchase on my name and my
husband’s, and I found it was mostly correct,
but not entirely. Some of the inaccuracies
were trivial and don’t seem to have been im-
portant in the modeling process. A couple of
items were quite different between my data
set and my husband’s—one set listed our
household as having only one resident, and
the home values given were quite different.
These might have been more important in
the rating process, and since both data used
the same address, flagging and addressing
these kinds of discrepancies seems to be a
desirable improvement to the process.
The majority of the data elements based on
me personally (as opposed to aggregate in-
formation for my area of residence) were
actually blank. That may be true for many or
most people, since there turned out to be a
lot of individual items for things like hobbies
and interests. This suggests that these data
profiles may be less comprehensive than many
people fear, or at least that the modeling is not
trying to reach a conclusion about where every-
one falls on every possible item.
My first reaction to our assigned niches was
that they must be completely wrong, since I
am the opposite of chic. But after reviewing
the descriptions, they are reasonably accurate.
Not every detail fits my household, but many
more are correct than not and we look more
like these descriptions than we do the popula-
tion as a whole. The two niches assigned do
contradict each other on a couple of points,
which may be a result of the contradictory de-
tails mentioned in our data.
By far the most difficult aspect of this pro-
cess—and maybe the most important—was
to decide how I feel about the lifestyle score
of 1.05 assigned. In fact, for the past few years,
my household’s medical costs have been much
lower than a typical manual rate for our demo-
graphic, probably by 50 percent or more, and
there has been no change to our health status
that should vary that in the near future. As an
actuary, I find the evidence presented in this
article for the model’s predictive power to be
compelling, and realize I cannot judge it on the
results for just two individuals. But as an indi-
vidual consumer, I can’t help but react to the
fact that this does overestimate my risk quite
a bit. The lifestyle grouping I am assigned to
may be correct, but there are apparently other
qualities that differentiate me from that group
and cause me to have lower claim costs. Find-
ing ways to identify those and better predict
low-cost customers—always a difficult aspect
of medical risk predictions—could be a valu-
able enhancement to the model.
Finally, there is the question of whether my
privacy felt violated when I saw the wealth of
personal information that can be purchased
about me for just pennies. To be honest—not
really. I’ve never been particularly concerned
about this kind of privacy and experiencing
this firsthand did not change that as I thought
it might. I would probably feel better about
the data being out there if I thought it could
lead insurance companies to charge me
much lower rates, but even with these specific
results I don’t seem too much worse off than
I would have been under the old individual
insurance application process.
Despite the somewhat controversial nature
of this topic, I have learned how consumer
data can be used in a positive way by insur-
ers. Regardless of how relevant regulations
develop in the next few years, we as actuar-
ies have a responsibility to harness the data
in a positive way such as that described in
this article. We should also be careful to
educate the public on how we are—and are
not—using the data, to protect the reputation
of our industry and our profession. A
Ruth Ann Woodley, FSA, MAAA, is vice president
with Ruark Consulting LLC. She can be contacted at
36 | the actuary | OctOber/nOvember 2011
of lifestyle data elements would contribute to
either an increase or a decrease of the condi-
tion’s expected cost. The predictor elements
include all types of information available in the
consumer data—from self-reported indicators
to area- and state-level information.
To see an example of how this works in practice,
we acquired data for Ruth Ann Woodley and her
husband. Using a model developed for a previous
assignment, we were able to calculate a lifestyle
score for both of them, which was 1.05 for both
individuals. In other words, based on the data
we received, we would expect that Ruth Ann and
her husband are 5 percent more expensive than
the average commercially insured population
of the same age and gender. To illustrate what
makes up this score, we dug into its components.
In doing so, we determined that for most of the
medical conditions, the resulting predictions
did not significantly deviate from the age- and
gender-based expectation, which contributed to
the score close to an average score of 1.00. There
were two other conditions which contributed to
an increase in the lifestyle score and two others
that contributed to a small decrease in the score.
The claim cost predictions specific to tobacco
neoplasm and COPD were lower than expected,
while the predictions for cardiovascular diseases
and other neoplasm were slightly above the age-
and gender-based expectation.
Further investigation of the individual predictors
of each condition suggested that the vast major-
ity of data elements were at the area and state
level, rather than directly attributable to Ruth
Ann’s and her husband’s lifestyle habits. This
was likely due to the absence of self-reported
information in the data on the Woodleys, which
we noticed when Ruth Ann was reviewing the
accuracy of the information. For instance, Ruth
Ann’s area of residence is located in an area
with a lower reported interest in running/jogging
as well as camping and hiking, but a higher level
of interest in Bible or devotional reading. Addi-
tionally, the state of residence as a whole expe-
rienced a lower prevalence of COPD. These are
a few of the data elements which contributed
to the lower predicted costs for COPD and to-
bacco-related neoplasm. Similarly, the average
expected prevalence in the state of residence
of cardiovascular disease and other neoplasm,
as well as higher reported interest in automo-
tive work contributed to the largest portion of
the predicted cost for these two conditions.
In this particular case, the more interesting
drivers of the score were segmentation ele-
ments called niches, where each individual is
assigned into one of more than 50 consumer
segments based on their overall data profile.
Niches assigned were Chic society and Loose
change,5 both of which contributed to the
higher expected prevalence of cardiovascular
conditions in both scores. A
Ksenia Draaghtel, ASA, MAAA, is an associate actu-
ary with Milliman, Inc. She can be contacted at ksenia.
EndnotES1 [To be certified], a plan shall, at a minimum meet
marketing requirements, and not employ market-
ing practices or benefit designs that have the effect
of discouraging the enrollment in such plan by
individuals with significant health needs” (Sec.
1311(c)1(A)).2 Fully searchable text is available at the Library
of Economics and Liberty via link: http://www.
econlib.org/library/Ricardo/ricP.html.3 Fries JF, Koop CE, Soklov J, Beadle CE, and Wright
D. Beyond Health Promotion: Reducing Need
and Demand for Medical Care. Health Affairs
1998;17(2):70-84.4 Stein, Joel. “Your Data, Yourself.” TIME, March 21,
2011.5 loose change—This niche is dominated by
households containing two adults and no children.
These households tend to be homeowners and typ-
ically have longer length of residence—between
two and 13 years. Their homes are valued at about
$120,000. These professional households are more
likely to contain a postgraduate degree than the
households in the general population.
These households are not big credit card owners
and users, and fall below the general population
use of credit cards. They are also less mail-respon-
sive, but do shop retail and on the Internet, and occa-
sionally from catalogs. They purchase electronics,
home improvement and workshop items, and wines.
These households travel abroad, often on business,
and are members of frequent flyer clubs. They also
contribute to wildlife and environmental charities.
This niche is marked by its interest in the rugged
outdoors. They are fond of camping, hiking, bicy-
cling, horseback riding, power boating, hunting and
shooting, snow skiing, and motorcycling. As com-
pared to the general population, this niche is much
more likely to own household pets. They are inter-
ested in a healthy lifestyle and try to watch their diets.
Additional interests include golf, watching sports on
TV, surfing the Internet, science fiction, working on
cars, cultural events, and stock/bond investing.
Chic society—The households in this niche are
very business- and culturally-oriented. These 49-year-
old-headed households typically have no children.
There is extensive domestic business and foreign
travel in this niche. It is no wonder they are frequent
flier members. These homeowners have residences
that have an average value of about $265,000 and
they have lived there for about six years, many of
them as long as 20 years or more. They are also
more likely than the general population to own a
vacation property.
These households own many credit cards and have
a known history of being mail-responsive and to
purchase items through the mail. They purchase
many items through the mail, including books
and music, general merchandise, magazines and
women’s apparel. The households in this niche
are also more likely to donate to charitable causes,
like wildlife and environmental issues. They have
a great interest in monetary investing, specifically
mutual funds, stock/bond investments and real
estate investments.
These households tend to lead very cultural, high
society lives. Their activities and interests include
fine arts and antiques, cultural events, fashion,
wine, gourmet food and book reading. Other inter-
ests include photography, home furnishings and
decorating, golf and bicycling. They are very health
conscious with regular physical fitness, exercise,
dieting, and self improvement.
OctOber/nOvember 2011 | the actuary | 37
Consumer DataPredictive Modeling with