predictive microbiology and risk assessment of non thermal technologies a. martínez, f. sampedro...
TRANSCRIPT

Predictive microbiology and risk assessment of non thermal technologies
A. Martínez, F. Sampedro and D. RodrigoInstituto de Agroquímica y tecnología de Alimentos (CSIC)
INNOVATIVE APPLICATION OF NON-THERMAL TECHNOLOGIES IN FOODS:
TECHNOLOGY, SAFETY AND CONSUMER ACCEPTABILITY

NOVEL PRESERVATION TECHNOLOGIES IN RELATION TO FOOD SAFETY
On account of a growing consumer demand towards foods that are safe, but retain the characteristics of fresh or freshly-prepared foods, mild preservation technologies are gaining more and more importance.
Examples include high-pressure processing, pulsed electric fields treatment, light technologies, cold plasma, and use of biopreservatives.

NOVEL PRESERVATION TECHNOLOGIES IN RELATION TO FOOD SAFETY
These mild preservation technologies enhance the shelf life of foods, are usually applied at room temperature and have a minor impact on the quality and fresh appearance of food products.
They are referred to as mild since they pose little stress on foods. This on the other hand increases the importance of food safety considerations.

Extended shelf life and a “fresh-like” product presentation emphasise the need to take full account of food safety risks, alongside possible health benefits to consumers.
Compared to a decade ago, research on mild preservation technologies has made a tremendous step forward. At this moment, novel technologies such as high pressure, pulsed electric fields and the use of biopreservatives are beyond the first development phase.
Equipment is available on different scales and several process conditions have been described.
NOVEL PRESERVATION TECHNOLOGIES IN RELATION TO FOOD SAFETY

The introduction of novel preservation methods stimulated research in microbiology, technology and food processing. The adoption of mild preservation technologies under European legislation is an ongoing process, as shown by the Novel Food Regulation. (Novel Food Regulation, Regulation No 258/97, 1997).
NOVEL PRESERVATION TECHNOLOGIES IN RELATION TO FOOD SAFETY

NOVEL PRESERVATION TECHNOLOGIES IN RELATION TO FOOD SAFETY

ModelingClassic log-linear survival model Modelling non log-linear survival curves Predictive modelling
FOCUS ON UNDERSTANDING MICROBIOLOGY

Behavior of microbial cells can be modeled in order to describe and/or predict microbial survival or growth.
Traditionally it was assumed that inactivation of microbial cells and spores exposed to heat or another stressing environment were governed by first-order reaction kinetics (in analogy with chemical reactions).
FOCUS ON UNDERSTANDING MICROBIOLOGY:MODELLING

The now classic log-linear method of D and z-values (Stumbo, 1973) is based on this theory and is widely accepted and practiced.
In this mechanistic model it is assumed that all cells have a similar resistance to the stressing factor and cell death occurs as a single critical event.
FOCUS ON UNDERSTANDING MICROBIOLOGY:MODELLING

The D/z method has proven its value in food preservation for over 80 years, mainly in sterilization of canned products, but should we still use it?
Analysis of microbial inactivation resulting from these mild preservation methods revealed that many deviations from log-linearity occur.
These deviations can lead to over- or underprocessing when linearity is assumed and may result in a decrease in product quality or food spoilage respectively.
FOCUS ON UNDERSTANDING MICROBIOLOGY:MODELLING

SigmoidalSigmoidalSC4SC4
TailTailSC3SC3
ShoulderShoulderSC2SC2
LinealLinealSC1SC1
Types of inactivation curvesTypes of inactivation curves
FOCUS ON UNDERSTANDING MICROBIOLOGY:MODELLING
Simply assuming first-order kinetics of survival curves can therefore not be accepted anymore.

Non-lineal inactivation models:Non-lineal inactivation models:
))1(log(log))((
0
maxtBtk
BB eqqN
N
n
nnr
rtn
trtr
tr
n
rtB
1arctan
2arctanln
2
1)(
22
2
4 parameters
qB
kmax
r
n = 33 parameters
Baranyi model
)(
0
logMtBBM ee CeCe
N
N 3 parameters
C
B
M
Gompertz modified equation
FOCUS ON UNDERSTANDING MICROBIOLOGY:MODELLING

Weibull frecuency distribution
b
0
taN
NLog
2 parameters
a
b
FOCUS ON UNDERSTANDING MICROBIOLOGY:MODELLING

FOCUS ON UNDERSTANDING MICROBIOLOGY:MODELLING
Some Examples
Inactivation of Enterobacter sakazakii by pulsed electric field in bufferedpeptone water and infant formula milk
M.C. Pina Pérez, D. Rodrigo Aliaga, C. Ferrer Bernat, M. Rodrigo Enguidanos, A. Martínez López (International Dairy Journal 17 (2007) 1441–1449)

Inactivation of Enterobacter sakazakii by pulsed electric field in bufferedpeptone water and infant formula milk

Inactivation of Enterobacter sakazakii by pulsed electric field in bufferedpeptone water and infant formula milk

Inactivation of Enterobacter sakazakii by pulsed electric field in bufferedpeptone water and infant formula milk

Inactivation of Enterobacter sakazakii by pulsed electric field in bufferedpeptone water and infant formula milk

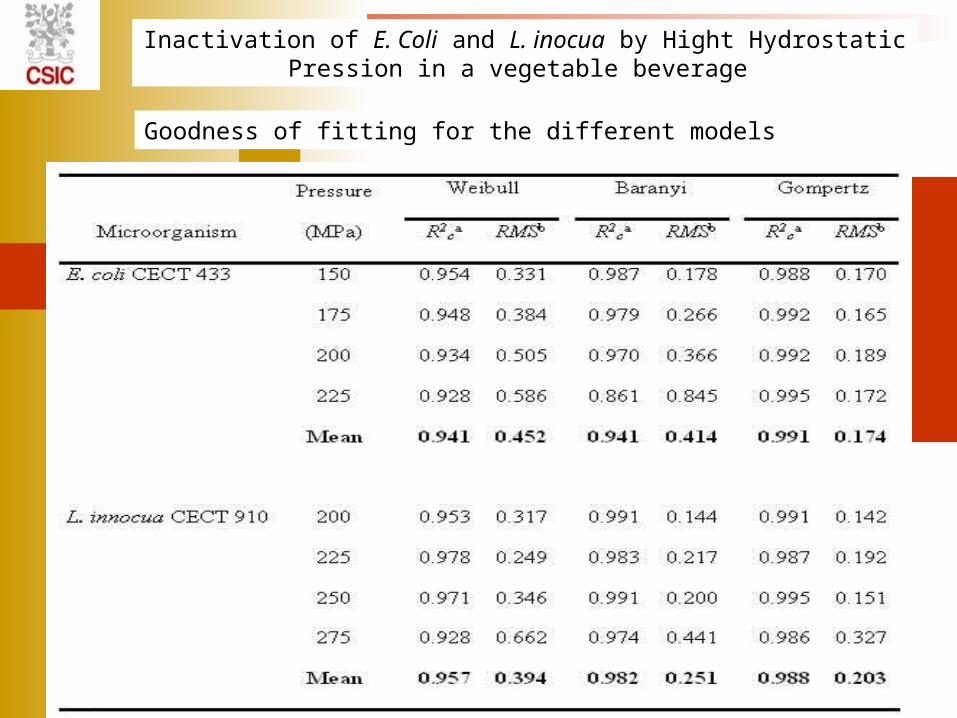
Comparisson of fitting experimental data by Weibull distribution function (······), Gompertz modified equation () and Baranyi model ( ) for inactivation of E. coli cells at 150 (), 175 (), 200 () y 225 MPa ()
Inactivation of E. Coli and L. inocua by Hight Hydrostatic Pression in a vegetable beverage
Daniela Saucedo-Reyes, Dolores Rodrigo-Aliaga, Aurora Marco-Celdrán and Antonio Martínez-López (II Congreso Iberoamericano sobre seguridad alimentaria CIBSA 2008)

Comparisson of fitting experimental data by Weibull distribution function (······), Gompertz modified equation () and Baranyi model ( ) for inactivation of L. innocua at 200 (◊), 225 (□), 250 () y 275 MPa (○) MPa.
Inactivation of E. Coli and L. inocua by Hight Hydrostatic Pression in a vegetable beverage
Inactivation of E. Coli and L. inocua by Hight Hydrostatic Pression in a vegetable beverage
Goodness of fitting for the different models

Inactivation of E. Coli and L. inocua by Hight Hydrostatic Pression in a vegetable beverage
Validation of models used in the study

Predictive modeling is regarded as the solution for microbial safety. These models can provide useful information on microbial behavior without experimental effort. Although they can be used within the limits of the model, extrapolations or true predictions are not always allowed or correct.
FOCUS ON UNDERSTANDING MICROBIOLOGY:PERDICTIVE MODELLING

In the future new tools should be developed to describe the potential hazards with a huge variety of products and formulations and suitable for expossure assessment studies. In these models a precise description of the behaviour of the mircoorganisms should be accounted for. However, the development of a precise or complete mechanistic model requires more information on the physiology of cell populations as well as single cell behavior.
FOCUS ON UNDERSTANDING MICROBIOLOGY:PERDICTIVE MODELLING

NOVEL PRESERVATION TECHNOLOGIES IN RELATION TO FOOD SAFETY

Novel food technologies such as high pressure and pulsed electric field treatments are used or will be used in the near feature for commercial applications.
Research is needed to evaluate the effects on food quality.
Issues such as safety and legislation have to be considered.
NOVEL PRESERVATION TECHNOLOGIES IN RELATION TO FOOD SAFETY

The Risk Analysis process
FOCUS ON IMPLEMENTATION:RISK ANALYSIS

ALOP
Risk Analysis
HACCP
GHP’s/ GMP’s/ GAP’s
FSO Food Safety Objective
Goverment Level
Industrial Level
FOCUS ON IMPLEMENTATION:RISK ANALYSIS
Risk assessment and management procedure, which follows the requirements of the Codex Alimentarius Commission, results in the final food safety objectives

Hazard identification
Hazard characterization
Exposure assessment
Risk characterization
FOCUS ON IMPLEMENTATION:RISK ASSESSMENT

FOCUS ON IMPLEMENTATION:EXPOSURE ASSESSMENT
An Example
The Monte Carlo simulation is used to establish the most influential parameters on the final load of pulsed electric fields E. coli cells
C. Ferrer, D. Rodrigo, M.C. Pina, G. Klein, M. Rodrigo, A. MartÍnez (Food Control 18 (2007) 934–938)
PEF TREATMENT OF A BLENDED ORANGE-CARROT JUICE INOCULATED WITH E. coli

Nomenclature: a scale parameter of the Weibull distribution function aE scale factor of the Weibull distribution at an electric field
strength (E) aR scale factor of the Weibull distribution at the referent
electric field strength (ER) N shape parameter of the Weibull distribution function E electric field strength (kV/cm) ER referent electric field strength (kV/cm) % percentage of carrot juice %R referent percentage of carrot juice z% variation on % of carrot producing a variation of ten fold
on scale parameter (a) zE variation on electric intensity strength producing a
variation of ten fold on scale parameter (a)
FOCUS ON IMPLEMENTATION:EXPOSURE ASSESSMENT
An example

N0: Initial microbial load (CFU/ml)
ZE: Electric field strength (kV/cm)
Z%: Juice percentage (%)
a: Kinetic parameter (s)
DEPENDENT VARIABLE (OUTPUTS)
INDEPENDENT VARIABLES (INPUTS):
N: Number of microorganisms after the process (CFU/ml)
FOCUS ON IMPLEMENTATION: EXPOSURE ASSESSMENT
An example

FOCUS ON IMPLEMENTATION:EXPOSURE ASSESSMENT
An example

Predicted aE values, as a function of electric field strength and carrot juice percentage, were obtained using the following predictive model:
FOCUS ON IMPLEMENTATION:EXPOSURE ASSESSMENT
An example
Ln(aE)=Ln(aR)-(B-C)/D-(E-ER)/F

The final number of microorganisms was predicted by using the following equation:
FOCUS ON IMPLEMENTATION:EXPOSURE ASSESSMENT
An example
Ln(S)=-(t/aE)n

1) Inputs were defined by distribution functions:
BestFit @Risk4.5 (Palisade Corporation)
a Beta General (0.38372; 0.32221; 7.9828;
16.1975)
NoNormal (12535984; 2488898)
ZEExtreme value (8.5689; 2.6152)
Z%Normal (27.4814; 4.5023)
FOCUS ON IMPLEMENTATION:EXPOSURE ASSESSMENT
An example

Inputs predicted values (a, N0 zE y z%)
N0 a zE z%
Experimental values
12535984 ±
2488897
12.7597 ±
2.9001
13.3467 ±
6.5801
23.4573 ±
1.6961
Monte Carlo Simulation
12535931 ±
2488749
12.4230 ±
3.1538
10.0784 ±
3.3530
27.4814 ±
4.5033
2) Monte Carlo Simulation:
FOCUS ON IMPLEMENTATION:EXPOSURE ASSESSMENT
An example

FOCUS ON IMPLEMENTATION:EXPOSURE ASSESSMENT
An example

No
%
E
-1 -0,5 0 0,5 1
1
No
E
%
-0,5 0 0,5 1
1
0% carrot juice
60 % carrot juice
40 µs, 25 KV/cm
At low intensities N0 is the most influent factor
3) Sensivity analysis
FOCUS ON IMPLEMENTATION:EXPOSURE ASSESSMENT
An example

E
No
%
-1 -0,5 0 0,5 1
1
%
E
No
-1 -0,5 0 0,5 1
1
0% carrot juice 60 % carrot juice
70 µs, 35 KV/cm
FOCUS ON IMPLEMENTATION:EXPOSURE ASSESSMENT
An example
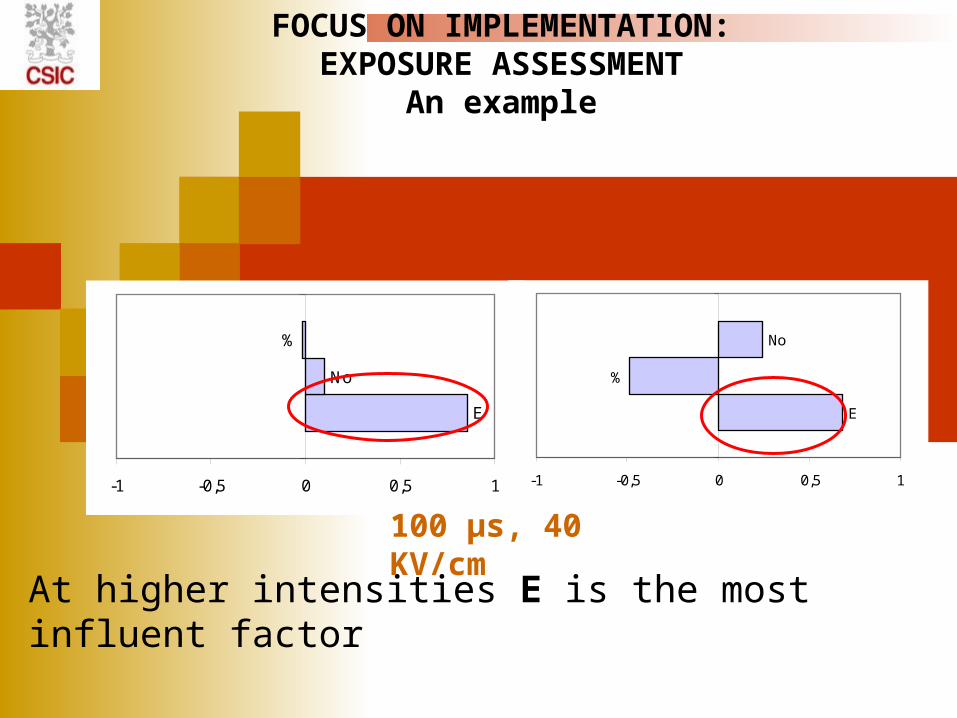
At higher intensities E is the most influent factor
E
No
%
-1 -0,5 0 0,5 1
1
E
%
No
-1 -0,5 0 0,5 1
1
100 µs, 40 KV/cm
FOCUS ON IMPLEMENTATION:EXPOSURE ASSESSMENT
An example
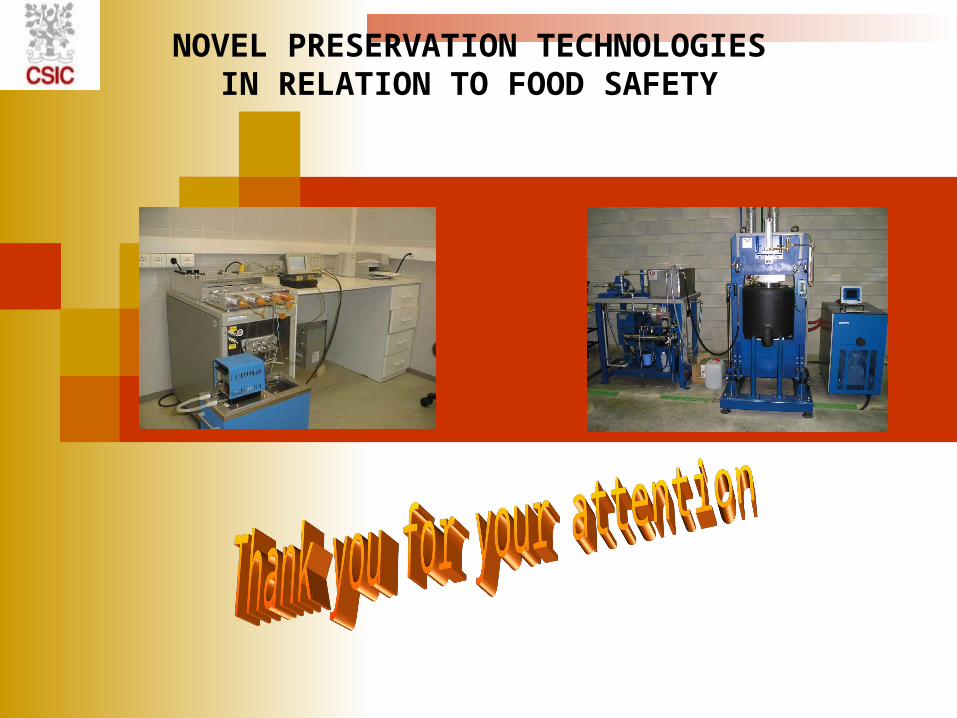
NOVEL PRESERVATION TECHNOLOGIES IN RELATION TO FOOD SAFETY