predictive in vitro dissolution tools: application during
TRANSCRIPT
HAL Id: tel-00719613https://tel.archives-ouvertes.fr/tel-00719613
Submitted on 20 Jul 2012
HAL is a multi-disciplinary open accessarchive for the deposit and dissemination of sci-entific research documents, whether they are pub-lished or not. The documents may come fromteaching and research institutions in France orabroad, or from public or private research centers.
L’archive ouverte pluridisciplinaire HAL, estdestinée au dépôt et à la diffusion de documentsscientifiques de niveau recherche, publiés ou non,émanant des établissements d’enseignement et derecherche français ou étrangers, des laboratoirespublics ou privés.
Predictive in vitro dissolution tools : application duringformulation development
Emmanuel Scheubel
To cite this version:Emmanuel Scheubel. Predictive in vitro dissolution tools : application during formulation devel-opment. Pharmacology. Université d’Auvergne - Clermont-Ferrand I, 2010. English. �NNT :2010CLF1PP04�. �tel-00719613�

University Clermont-Ferrand 1 Faculty of Pharmacy 2010 N° d’ordre :
ECOLE DOCTORALE DES SCIENCES DE LA VIE ET DE LA SANTE
Thesis
presented and publicly examined on December 22nd, 2010 at the University Clermont-Ferrand 1, France,
for the degree of doctor of pharmaceutical science
by
Scheubel Emmanuel
__________________________________________________
Predictive in vitro dissolution tools: Application during formulation development
__________________________________________________
Chairman: Professor Gilles Ponchel (Faculty of Pharmacy, University of Paris-XI, France) Jury: Professor Jean-Michel Cardot (Faculty of Pharmacy, Clermont-Ferrand, France)
Professor Eric Beyssac (Faculty of Pharmacy, Clermont-Ferrand, France)
Doctor Laurent Adamy (Galenical and Analytical Development,
F.Hoffmann-La Roche Ltd, Basel, Switzerland)
Reviewer: Professor Philippe Maincent (Faculty of Pharmacy, Nancy, France) Doctor Johannes Krämer (Phast, Germany) Equipe de Recherche Technologique « Conception, Ingenerie et Development de l’Aliment et du Médicament » (ERT CIDAM) Faculté de Pharmacie – CNRH Auvergne – IFR Santé - Université d’Auvergne


Page 3 of 201
Acknowledgment
My deepest gratitude goes to my supervisors at Roche, Doctor Laurent Adamy, Doctor Balz
Fischer and Professor Jean Michel Cardot from University of Clermont-Ferrand.
They have guided me towards being an independent and critical scientist.
I am very grateful to Laurent for his endless support and positive attitude towards my studies.
Professor Cardot is gratefully acknowledged for sharing of his expertise and encouraging me to go
further with the studies. His long patience and any-time availability has made my work a lot of
easier. During the crazy moments of this study Professor Cardot has help me to put things into
right perspective.
I warmly thank Professor Eric Beyssac for his valuable comment and fruitful discussion to improve
this work.
The reviewers Professor Philippe Maincent and Doctor Johannes Krämer and board of examiner
Professor Gilles Ponchel are thanked for extremely flexible and quick review process and their
constructive comments on the manuscript.
I wish to acknowledge the company F.Hoffmann-La Roche Ltd at Basel, Switzerland, and my
managers for allowing me to perform these investigations in parallel to my daily work. The
synergy between the outcomes of my thesis and the development of optimal dissolution methods in
the frame of the pharmaceutical development at Roche was a daily focus.
I am grateful to my colleges and co-workers of Galenical and Analytical Development at
F.Hoffmann-La Roche Ltd, Basel, Switzerland and in particular to Myriam, Christian, Philippe and
Yan.

Page 4 of 201
I dedicate this work to my family and in particular to
Hugo
and
Jade

Page 5 of 201
About Roche
The experimental parts included in this thesis were carried out at the Pharmaceuticals Division of
Galenical and Analytical Development (PTDFA) at F.Hoffmann-La Roche Ltd, Basel,
Switzerland.
Roche is one of the world’s leading research-focused healthcare groups in the fields of
pharmaceuticals and diagnostics. As the world’s biggest biotech company and an innovator of
products and services for the early detection, prevention, diagnosis and treatment of diseases, the
Group contributes on a broad range of fronts to improving people’s health and quality of life.
Roche is the world leader in in-vitro diagnostics and drugs for cancer and transplantation, and is a
market leader in virology. It is also active in other major therapeutic areas such as autoimmune
diseases, inflammatory and metabolic disorders and diseases of the central nervous system. Roche
has R&D agreements and strategic alliances with numerous partners, Genentech, United States, are
a wholly owned member of the Roche Group. Roche has a majority stake in Chugai
Pharmaceutical, Japan

Page 6 of 201

Page 7 of 201
Table of Content
Table of Content........................................................................................................................... 7
Abbreviation................................................................................................................................. 8
Glossary - Definition of terms...................................................................................................... 9
List of original papers ................................................................................................................ 11
1. Introduction ........................................................................................................................ 12
2. State-Of-The-Art ................................................................................................................ 16
2.1. Dissolution Theory......................................................................................................... 17
2.2. Dissolution Method ........................................................................................................ 19
2.2.1. Dissolution Apparatus ................................................................................................ 19
2.2.2. Dissolution Medium................................................................................................... 22
2.2.3. Qualification of Apparatus ......................................................................................... 25
2.2.4. Analytical methods associated with the Dissolutions ................................................ 26
2.2.5. Discriminating Power of a Method ............................................................................ 26
2.3. Biorelevance of Dissolution Testing .............................................................................. 28
2.3.1. BCS Definition........................................................................................................... 28
2.3.2. Extension of BCS ....................................................................................................... 29
2.3.3. Application of BCS in the formulation development................................................. 30
2.4. IVIVC/R......................................................................................................................... 31
2.4.1. Definitions.................................................................................................................. 31
2.4.2. Dissolution development for IVIVC/R ...................................................................... 42
2.4.3. Simulation tools.......................................................................................................... 42
2.5. Quality by Design and Dissolution ................................................................................ 43
2.6. References ...................................................................................................................... 48
3. Experimental ...................................................................................................................... 57
3.1. Experimental part 1 ........................................................................................................ 61
3.2. Experimental part 2 ........................................................................................................ 78
3.3. Experimental part 3 ...................................................................................................... 124
3.4. Experimental part 4 ...................................................................................................... 154
3.5. Summary of the experimental parts and discussion ..................................................... 190
4. Conclusion........................................................................................................................ 198

Page 8 of 201
Abbreviation
API Active Pharmaceutical Ingredient
BA Bioavailability
BE Bioequivalence
BCS Biopharmaceutical Classification System
CQA Critical Quality Attribute
DoE Design of Experiment
DP Drug Product
DR Dissolution Rate
DS Drug Substance
EIH Entry into Human. Corresponds to phase 1 of the development of new medicine.
FDA Food and Drug Administration
FaSSGF Fasted State Simulated Gastric Fluid
FaSSIF Fasted State Simulated Intestinal Fluid
FeSSIF Fed State Simulated Intestinal Fluid
GIT Gastro Intestinal track (GI tract)
ICH International Conference on Harmonization
IP Intellectual properties
IR Immediate Release
IVIVC In Vivo In Vitro Correlation
IVIVR In Vivo In Vitro Relationship
JP Japanese Pharmacopoeia
MR Modified Release
PAT Process Analytical Technology
PE Pharmacopeia European
PoC Proof of Concept
PSD Particle Size Distribution
QbD Quality by Design
QC Quality Control
USP United Stated Pharmacopeia
XRPD X-ray powder diffraction

Page 9 of 201
Glossary - Definition of terms
Bioavailability : Bioavailability is defined as the relative fraction of a drug dose that enters the
systemic circulation.
Bioequivalence : Bioequivalence of a drug product is achieved if its extent and rate of absorption
are not statistically significantly different from those of the standard when
administered at the same molar dose.
Biowaiver : The regulatory acceptance of in vitro testing as a reliable surrogate for an in
vivo bioequivalence study is commonly referred to as biowaiver.
Input profile : In vivo dissolution or in vivo absorption (includes permeability and dissolution
phases) of the drug from a particular dosage form
Sink condition: The term sink conditions is defined as the volume of medium at least greater
than three times that required to form a saturated solution of a drug substance. It
is a mandatory working condition for QC dissolution testing.

Page 10 of 201

Page 11 of 201
List of original papers
This thesis is based on the following papers and posters, which are referred to in the text by their
respective numerals (1 to 4).
Paper 1.
E. Scheubel, V. Hoffart and J-M Cardot. Selection of optimal API properties using in vitro
dissolution, animal study and IVIVR to derisk Human study during development. (2010) not
submitted
Paper 2
E. Scheubel, L. Adamy, E. Beyssac and J-M Cardot. Selection of the Most Suitable Dissolution
Method for an Extended Release Formulation based on IVIVC level A obtained on
Cynomolgus Monkey (2010). Drug Development and Industrial Pharmacy, Vol. 36, No. 11 ,
Pages 1320-1329
Paper 3
E. Scheubel, M Lindenberg, E. Beyssac and J-M Cardot. Small Volume Dissolution Testing as
Powerful Method during Pharmaceutical Development. (2010) Pharmaceutics, 2, 351-363
Poster
Nicole Wyttenbach1, André Alker, Olaf Grassmann, Emmanuel Scheubel. Tenoxicam-
Methylparaben Cocrystal Formation in Aqueous Suspension Formulation. Poster presented in
the AAPS Annual Meeting 2009, poster W4326.
Paper 4
E. Scheubel, L. Adamy and J-M Cardot. Mycophenolate mofetil: use of simple dissolution
technique to assess difference between generic formulations (2010). Dissolution Technologies
In review
Poster
E. Scheubel, L. Adamy, In vitro dissolution of mycophenolate mofetil: comparison between
innovator and generic formulations- Poster presented at BPS Winter meeting 2008, Abstract
0225 and at the ACCP/ESCP International Congress 2009, Presentation 114E.

Page 12 of 201
1. Introduction

Page 13 of 201
The business environment for the pharmaceutical industry has changed immensely over the past
few years. The current blockbuster business model is no longer viable for companies to sustain
growth. As the industry faces growing competition from generic drugs, the impact of US
healthcare reform in 2010, major price decrease in Europe, the growing threat of biosimilars, the
higher demands from regulatory authorities associated with declining product pipelines and rising
R&D costs, pharmaceutical executives begin to change the development strategy for NCE. A
company can no longer afford to go through the entire drug development process, risking that the
drug is rejected by the regulatory agencies, or worse, is withdrawn post-market due to safety
concerns e.g. Vioxx, Bextra (Meyer 1992; Vippagunta 2001). Therefore potential issue should be
identified and fixed as early as possible.
During the development of new drugs and drug dosage forms the main concerns of the
pharmaceutical company is to develop the optimal and constant medicinal product, starting from an
Active Pharmaceutical Ingredient (API) which exhibit optimal characteristics up to the production
of a robust formulation. This formulation insures a constant Bioavailability (BA) and therapy for
the patient over time as independently as possible from the production process. To assist successful
oral drug development and post marketed monitoring as well as generic companies in their
screening, in vitro dissolution testing has emerged as a preferred method of choice to evaluate
development potential of new APIs and drug formulations (figure 1). In the pharmaceutical
industry, dissolution may be defined as the amount of drug substance that goes into solution per
unit time under standardized conditions of liquid/solid interface, temperature and solvent
composition. Dissolution is also the only test that measures in vitro drug release as a function of
time. It measures the dynamic effect of static solid state properties. It is a holistic test, and can be
considered as a supra indicator of the all phenomena that lead to the release of API into a solution.
At the early stage of development, (preformulation), dissolution testing of pure APIs serves as an
important tool to evaluate the physicochemical properties of drug candidates and to select the most
appropriate solid form for further development. It guides the selection of toxicology and phase 1
formulations for evaluation in animals and humans. When dealing with poorly soluble drugs,
observations of potential solubility/dissolution-limited absorption phenomena can strongly
facilitate and guide formulation. At later stages of development, dissolution tests are performed
with drug products to compare prototype formulations, to elucidate drug release mechanism, as an
indicator of stability, the robustness of the manufacturing process, and to assure safe release and
reproducibility of the products to the market. Dissolution exhibits clearly a higher predictability if
it can be extrapolated directly to in vivo behavior of the medicinal product. This link is called In
Vitro In Vivo Correlation (IVIVC) (FDA, 1997; EMEA, 2000) or In Vitro In Vivo Relationship
(IVIVR). With the introduction of regulatory guidelines concerning Biopharmaceutics
Page 14 of 201
Classification System (BCS) (FDA, 2000), and IVIVC/R attempts, the dissolution testing can serve
as a strong indicator of in vivo performance. Dissolution tests can then be a surrogate measures for
bioequivalence (BE), called biowaiver. For high soluble entities, dissolution is a recognized tool to
demonstrate equivalence of product before and after certain post approval changes (SUPACs)
(FDA, 2000; EMEA, 2002). However several limitations still exist.
Development of a dissolution method may warrant significant and exhaustive evaluation of
dissolution profiles in multiple apparatus and media. This effort is rare in discovery and often not
fully done in early development phase due to time pressure and few vivo data availability, leading
to potential lack of understanding of the effect of the formulation component (API, excipients)
properties on manufacturing processes later on after scale up. Prediction of in vivo behavior often
requires the use of in vitro dissolution methods reflecting the in vivo GI conditions. Several
physiologically based dissolution media, like FaSSIF and FeSSIF (Galia 1998; Jantratid 2008,
Klein 2010), have been proposed for this purpose, but their prediction accuracy is still insufficient
in many cases. One of the main reasons is the complexity of the physiology of the GI tract (e.g.
hydrodynamics) and lack of understanding of the digestion process. In addition, the pharmaceutical
industry has been reluctant to make use of the more complex and expensive dissolution media in a
routine basis. Furthermore dissolution data quality and purpose may vary depending on its utility
and the phase of drug development; these data are sometimes even “sprinkled” in big companies
and are then difficult to correlate.
Thus despite their wide use in pharmaceutical development and registration, there is still a lack of
thorough understanding of what dissolution could/should measure (API, DP), and the value it adds
at various stages of drug development. Even, sometimes industry practices and regulatory
expectations with regard to dissolution testing are not similar. The new regulatory Quality by
Design (QbD) directives (ICH Q8, Q9, Q10), which encourage pharmaceutical development for in-
depth understanding of “causes and consequences”, leads now to a more innovative and science-
based approaches in order to improve dissolution method, decrease variability and ensure
consistently high quality of dug product.
The present work will focus on the optimization of the existing and alternative dissolution
techniques to lay a foundation for QbD principles, IVIVC, and IVIVR. This interplay should serve
as a guide for the selection of an appropriate QC or surrogate test(s). Ideally, the final dissolution
QC test should monitor the batch-to-batch consistency of the product and, whenever possible,
monitor the key biopharmaceutical parameters or Critical Quality Attribute (CQA) of the
formulation. However, this goal is frequently not achievable and remains a significant challenge
for pharmaceutical formulation and analytical scientist. Examples of this approach are presented in
this thesis.

Page 15 of 201
After a description of the current state-of-the-art on dissolution, BCS, IVIVC/IVIVR and
relationship with QbD, four aspects of importance of dissolution from early development phases of
a new medicine up to generics consideration will be presented in the experimental section. The role
and impact of dissolution all along the product life cycle for common solid dosage form will then
be discussed with regards to its actual and future use and by taking into consideration the findings
of the experimental sections. A decision tree to foster the set up of new dissolution method is
proposed. It seems certain that dissolution can be improved as a strong quality control test based on
greater understanding of process or release mechanism as well as identifying of CQA.
Figure 1: The central role of dissolution testing (early phases of development shaped in blue, late phases in orange, market in black; dotted red arrows show the interplay of dissolution and black arrows show the interaction between the different development phases )
SUPPORTING OF SCALE-UP
AND POST-APPROVAL
CHANGES (SUPAC)
IDENTIFICATION OF
CRITICAL MANUFACTURING
VARIABLES
PRE-FORMULATION
STUDIES/DRUG
CANDIDATE SELECTION
CANDIDATE FORMULATION
SELECTION
SURROGATE FOR
IN VIVO STUDY IN VITRO- IN VIVO
CORRELATIONS /
RELATIONSHIPS
SUPPORTING OF
WAIVERS FOR
BIOEQUIVALENCE
QUALITY CONTROL
PROCEDURE
batch reproducibility,
Stability…
IN VITRO
DISSOLUTION
STUDIES
SIMULATION OF
FOOD-EFFECTS ON
SCREENING OF
EXCIPIENTS

Page 16 of 201
2. State-Of-The-Art

Page 17 of 201
2.1. Dissolution Theory Dissolution is defined as a dynamic process by which a material is transferred from solid state to
solution per unit time. The dissolution of a drug substance can be described in two steps. In the
first, molecules are released from the surface to the surrounding dissolution media. This creates a
saturated layer, called the stagnant layer, adjacent to the solid surface. Thereafter, the drug diffuses
into the bulk of the solvent from regions of high drug concentration to regions of low drug
concentration. The theoretical expression most often used to describe the dissolution rate, assuming
a sphere, is the Noyes-Whitney equation (Noyes and Whitney, 1897), which was published over
one hundred years ago, was adapted by several authors ((Nernst 1904, Brunner 1900 , Underwood
1978 ) but is still valid.
dw/dt = k (Cs – C) (1)
where w is the mass of drug in solution, C is the concentration of drug in solution at time t and Cs
is the saturation solubility of the solute (drug) at equilibrium. K is given by
k = D.S /h (2)
where D is the diffusion coefficient of the solute (molecular weight and temperature dependent,
typically 4-8 x 10⁻⁶ cm2 sec-1 (Seki 2003), S is the surface area of the dissolving solid and h the
diffusion layer thickness. k also known as dissolution rate constant (cm sec-1). It is assumed that in
most cases, a rapid equilibrium is achieved at the solid-liquid interface followed by the rate-
controlling diffusion across a thin layer of solution, called diffusion layer, into the solution. The
latter step is affected by temperature, solution viscosity and composition, degree of agitation,
surface, drug particle size and molecular weight. Depending on the particle size, h may vary.
Under sink conditions, where C < 0.1Cs, equation (1) reduces to
dw/dt = kCs (3)
Dissolution of drug in a solid dosage form (e.g tablet or capsule) is composed of at least two
consecutive steps as well; liberation of solute/drug from the formulation matrix (e.g after
disintegration of the tablet resp. deaggregation for IR) followed by dissolution of the drug in the
liquid media (according to equation (3)). Thus, in order to achieve dissolution of drug from a
dosage form, the cohesive properties of the formulated drug and intrinsic physicochemical
properties of the drug molecule play a key role. The overall rate of dissolution will depend on
whichever is the slower of these two steps and this should be carefully considered during design of
the dissolution method.

Page 18 of 201
In vivo the dissolution rate is influenced by the physicochemical properties of the drug substance,
the drug product and additionally by the prevailing physiological conditions in the GI tract (Table
1), which vary between the fasted and fed state as well as within and between subjects.
Table 1: List of the physicochemical and the physiological properties that can influence drug
dissolution in the GI tract (Dressman 2000).
Factor Physicochemical properties Physiological properties
Surface area of drug (S) Particle size, wettability Surfactants in gastric juice and bile
Diffusion coefficient of the drug (D) Molecular weight Viscosity of luminal contents
Stagnant layer thickness (h) Motility patterns and flow rate
Solubility (Cs) Hydrophilicity, crystal structure, solubilization
pH, buffer capacity, bile and food composition
Amount of drug already dissolved Permeability
Volume of solvent available Secretion, co-administered fluids
Shear force
Thus the objective of a dissolution testing is to be a discriminatory method that is sensitive to
variables that impact the release rate and ideally is predictive of bio-performance. Such variables
may include characteristics of the active pharmaceutical ingredient (API) (e.g., particle size, crystal
form, bulk density), drug product composition (e.g., drug loading, excipient identity/type and
levels), drug product manufacturing process (e.g., compression forces, equipment) at the time of
release and during shelf life., and effects of stability storage conditions (e.g., temperature,
humidity); Pillay and Fassihi, 1998; Durig and Fassihi, 2000;FDA, 2000) (see also chapter 2.4).
In summary, understanding and control of the release mechanism is therefore a key factor during
development of NCE. IR formulation being more impacted by the API properties (see also paper 1
and 4) whereas MR formulation mainly by the formulation (see also paper 2).

Page 19 of 201
2.2. Dissolution Method
2.2.1. Dissolution Apparatus A variety of designs of apparatus for dissolution testing have been proposed and tested over the last
decades. Different apparatus, procedures and techniques are required for API or different dosage
forms because of significant differences in formulation design and the physicochemical properties
of the drugs. Dissolution tests have therefore been developed for various drug delivery systems
including neat API, immediate release solid dosage forms, several controlled release solid dosage
forms and many novel and special dosage forms (see Table 2). Most of the tests with
recommended apparatus and other specifications are now available as compendial standards in
Pharmacopoeias and are used in pharmaceutical analysis and drug development for the various
drug delivery systems (USP 32, PE 6, JP XV). An overview of the most current apparatus is
outlined figure 2 and 3. Nowadays the apparatus allow reproducible data and are periodically
controlled through mechanical and chemical performance verification tests (USP<711>).
The most commonly used dissolution apparatuses for drug products are the USP Apparatus 1
(basket) and the USP Apparatus 2 (paddle) at 50 to 100 rpm (USP<711>, PE 2.9). Both the paddle
and basket methods can accommodate media volumes ranging from 500 to 1000 ml using the
standard vessel. For high potent, low dosage drugs the use of 100 ml to 250 ml vessel can be
explored (see also paper 3) but are not compendial.
USP Apparatus 3 (reciprocating cylinder) and Apparatus 4 (flow-through cell), are used rather
earlier in the drug development process and less routinely for QC testing.
USP3 can be used to estimate the drug release profile in the GI tract by using a series of different
media in the vessels.
USP4 offers the advantages for instance to overcome the non sink condition in case of low soluble
compounds and allows setting the same method for all variants of the manufacturing process (API,
galenical intermediate (blend) up to DP) that is of great help during the development and for
supporting design space approach (see also chapter 2.5).
By design both USP3 and USP4 allow for a pH change method throughout the test that is of great
help by simulation of the GI tract pH and passages.
The intrinsic dissolution tests, i.e. pure drug substance with defined surface area, is traditionally
performed with a rotating disk holder (USP <1087>) similar to the one proposed by Wood et al.
(Wood 1965). The USP Apparatus 4 is however assumed to have hydrodynamic flow patterns that
mimics those found in vivo better than the rotating disk method that can be of great advantage by
seeking of In Vitro In Vivo Correlation or Relationship (IVIVC/R) (see also paper 1 and chapter
2.4). The dissolution of pure API using USP4 is called apparent dissolution (Ph Eur. 2.9).

Page 20 of 201
The amounts of drug substance being limited during the drug discovery phase, miniaturized
dissolution testing techniques are highly desired for early development phase. Miniaturized
rotating disk apparatuses have therefore been developed (Berger 2007, Persson 2008). Other
methods that have been published are mini-scale dissolution tests (Persson 2005, see also papers 3
and posters) with computer simulation (Takanao 2008) and channel flow methods (Peltonen 2004,
Shah 1975). Other modified system can be found in the literature using for instance Crescent
Shaped Spindle (Spagnoli 2006) and can be set up in case where conventional device did not match
the desired discriminatory power.
Table 2: Apparatus used for Novel/Special dosage Forms.

Page 21 of 201
USP Apparatus 1 (Basket) 1 Liter Vessel
USP Apparatus 2 (Paddle) 1 Liter Vessel
USP Apparatus 3 (Reciprocating Cylinder)
300 ml Vessel oriented for pH profile, soft gelatine capsule
and non-disintegrating multiple units.
USP Apparatus 4 (Flow through)
recommended for water insoluble or sparingly
water soluble. Cell for tablets and capsules (1-2)
Cell for powders and granulates (3)
Cell for implants (4)
Cell for suppositories and soft gelatine capsules (5)
((3-4-5) being non USP)
USP Apparatus 5 (Paddle over Disc) Trandermal patches using 1 Liter vessel
USP Apparatus 6 (Rotating Cylinder) Trandermal patches using 1 Liter vessel
USP Apparatus 7 (Reciprocating Holder) Trandermal patches using 300 ml vessel
Figure 2: Apparatus Types defined in pharmacopeia for DP
Page 22 of 201
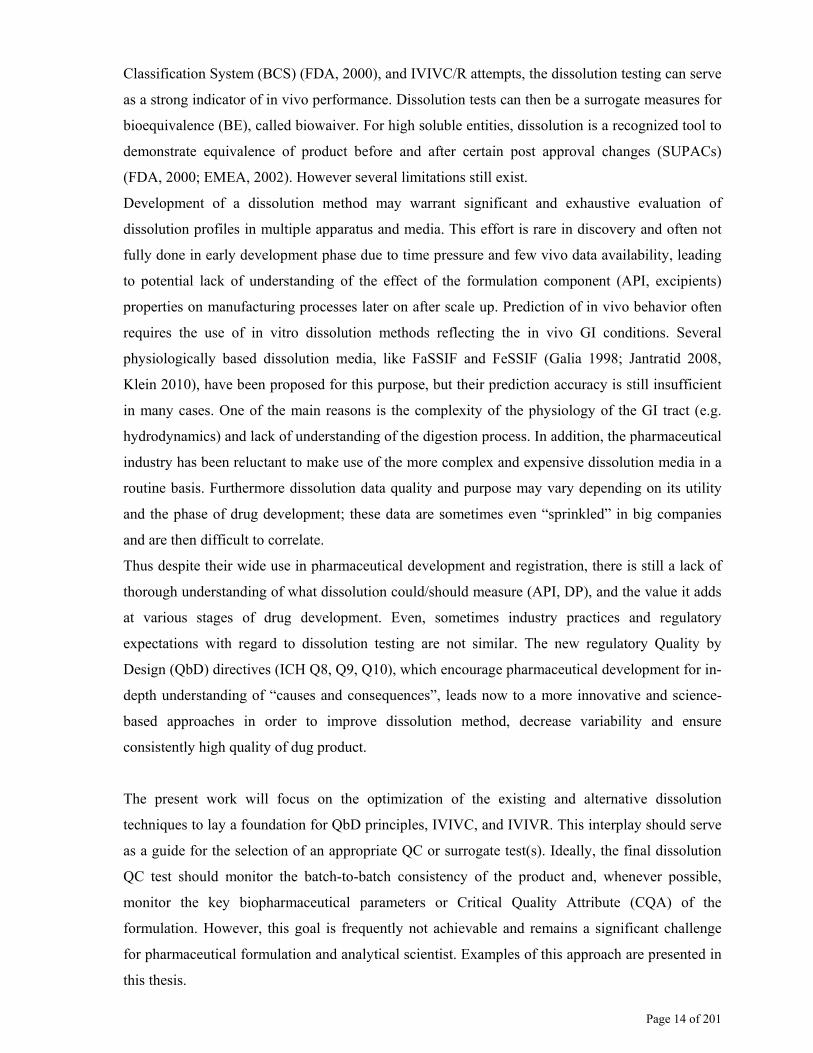
USP <1087> USP<711>, PE 2.9 Figure 3: Apparatus for Intrinsic and apparent dissolution
2.2.2. Dissolution Medium
For batch-to-batch quality testing, selection of the dissolution medium is based, in part, on the
solubility data and the dose range of the drug product in order to ensure that sink conditions are
met (FIP guideline 1997; FDA 2000; USP <1092>).
When the dissolution test is used to indicate the biopharmaceutical performance of the dosage
form, it is important that the proposed test closely simulate the environment in the gastrointestinal
(GI) tract than necessarily produce sink conditions for release. Therefore, it is not always possible
to develop one dissolution test or select one dissolution medium that ensures batch-to-batch control
as well as monitors the biopharmaceutical aspects of the drug product.
The dissolution characteristics of oral formulations should first be evaluated over the physiologic
pH range of 1.2 to 6.8 (1.2-7.5 for modified release formulations) in the absence of surfactants
since low solubility drugs include those with adequate aqueous solubility at either acidic (e.g.,
amines) or neutral (e.g., organic acids) pH’s. Selection of the most appropriate medium for routine
testing is then based on discriminatory capability, ruggedness, stability of the analyte in the test
medium, and relevance to in vivo product performance where possible.
For some low solubility compounds, adequate dissolution cannot be obtained with aqueous
solutions within the physiologic pH ranges noted previously. For these compounds, an aqueous
solution containing a percentage of a surfactant may be used to enhance drug solubility and ensure
sink conditions. Surfactants added to the dissolution medium will increase drug solubility
significantly. A colloid system, which contains surfactant micelles, will help maintain a poorly
water-soluble drug solubilized in an aqueous medium. The dissolution of the drug can be adjusted
by changing the concentration of the surfactant in the medium. Sink conditions can be achieved by
using higher concentrations of the surfactant. Up to 3% surfactant media are often used in
dissolution of poorly water-soluble drugs (Shah 1995). However, the human GI track does not have

Page 23 of 201
such a high concentration of surfactant, therefore it is not a surprise to find out that the dissolution
results obtained from media of high surfactant concentrations have poor correlation with
bioavailability. A biorelevant medium will need a similar surface activity as bio-fluids. The need
for surfactants and the concentrations used should be justified. Standard ionic or non-ionic
surfactants are sodium lauryl sulfate (SLS), Tween, CTAB, Cremophor, HTAB, Triton, Terigitol,
Cyclodextrins and Lecithin. In general, non-ionic detergents (e.g., Tween) are considered more
biologically relevant, and thus are often the preferred first choice when considering the addition of
a surfactant (it is to note that tween is the only defined surfactant in the Japan Pharmacopeia).
Surfactants can be used as either a wetting agent or, when the critical micelle concentration (CMC)
is reached, to solubilize the drug substance.
For some water-soluble drugs, pH of the dissolution medium has less effect on dissolution, but
surfactants added to the dissolution medium will increase drug solubility significantly. With this
regard, a USP4 method using open system (see previous chapter) can be an alternative to a
classical method using surfactant.
To simulate the in vivo conditions more nearly than just approximating the pH and volume,
substances that occur in the GI fluids can be added to the media. Several media simulating the GI
fluids have been proposed, including gastric (e.g. FaSSGF) and intestinal fluid (e.g. FaSSIF and
FeSSIF) (Galia 1998; Sunesen 2005) and efforts to further improve them are ongoing (Fujioka
2007, Jantrid 2008, Lue 2008, Ghazal 2009, Klein 2010). So called, biorelevant media, which are
designed to closely simulate physiological secretions, aim to better link in vitro with in vivo
performance. Dressman et al. (Dressmann 1998, 2000) created dissolution media through
consideration of the main factors which are generally expected to influence dissolution in vivo.
Values of lecithin, taurocholic acid, osmolality, surface tension, buffer capacity and pH were
adjusted to physiological values.
Even milk can be used during drug development to approximate condition in the postprandial
stomach. Milk contains similar ratios of protein/fat/carbohydrate to that found in typical Western
diet. Mechanisms by which milk can improve drug solubility include solubilisation of the drug in
the fatty part of the fluid, solubilisation in the caseine micelles and, for weak acids, the favorably
high pH values. This media presents however some difficulties in filtering and separating the drug
from the medium, making them unsuitable for routine QC.
To reflect differences between the fasted and fed state, different media were established: FaSSIF
(Fasted State Simulating Intestinal Fluid), FeSSIF (Fed State Simulating Intestinal Fluid). Usually
taurocholic acid and phosphatidylcholine from egg are used as bile salts and lecithin components,
respectively. To represent triglycerides and fatty acids glycerol monooleate and sodium oleate are
commonly used. Osmolality is adjusted to physiological values with NaCl. But even though the
media simulate most relevant characteristics, such as concentration of solubilising substances,

Page 24 of 201
buffer capacity, pH and solubilisation capacity of drugs, they are not a one-to-one copy of gastric
or duodenal juice. For example, pH and buffer capacity vary considerably as a function of
digestion and as a function of location within the intestine. FaSSIF is based on a non-physiological
buffer system, phosphate buffer (0.029 M, pH 6.5) whereas FeSSIF are based on a partly
physiological acetate buffer (0.144 M, pH 5.0). Additionally, compared to many surfactants with
micelle aggregation numbers >60 (Balakrishnan 2004) bile salt structures give values <10 (Sun
2003) and hence bile salts are expected to solubilize less compound. Lecithin added to bile salts
(mixed micelles) leads to an improvement of the solubility and of the dissolution rate of some low
solubility drugs (Naylor 1995). However, the effective diffusivity of mixed micelles is approx 100-
fold lower than in comparable taurocholate solutions since lecithin also increases the micellar
diameter (Naylor 1995). The increase depending on the dilution (Sugano 2007). Furthermore, the
buffer capacity of previously used FaSSIF and FeSSIF media (Gallia 1996 1998, Dresssman 2000)
were too high compared to values measured in human aspirates (Kalantzi 2006) and hence self-
buffering effects may have been underestimated with these media. Recently, this was corrected by
the introducing new media with lower buffer capacity (Jantrid, 2008, see Table 3). It is to note that,
addition of SDS can interfere with the vesicular drug solubilizing system of the biorelevant
medium (e.g. FaSSIF) and antagonized its solubilization capacity (Buch 2010).
However, the conventional preparation method of these fluids shows some disadvantages, it is
time-consuming, requires organic solvents, requires daily preparation and sometimes does not
result in a usable medium. Recently commercial “ready to use” preparations are available and can
perhaps help to better standardize and simplify the realization of the test (SIF Powder from
ePhares.com) (Kloefer 2010).
The fact that very different combinations of properties between the media were shown to produce
similar dissolution enhancement levels in FaSSIF and drug-specific concentrations of SLS or
Tween 80 underlines the importance of the evaluation of surfactant-facilitated dissolution as a
whole. Although it is obvious due to the specificity of the drug-surfactant interactions that the in
vivo prognostic amounts of synthetic surfactants have to be adjusted drug-specifically, some
studies shows the great potential of substituting FaSSIF with simple and cost-effective
conventional surfactant media (Zoeler 2007) (see also paper 1, paper 2 and paper 4).

Page 25 of 201
Table 3: Composition of FaSSIF and FeSSIF according to Jantratid et al. (Jantratid 2008).
2.2.3. Qualification of Apparatus
Ensuring the quality of data generated by analytical equipment includes an overall approach to
equipment quality. Pharmaceutical scientists have long accepted that equipment qualification—
installation qualification (IQ), operational qualification (OQ), and performance qualification
(PQ)—under good manufacturing practices (GMPs) should be executed to verify acceptable
quality of output from multi-component analytical instrumentation.
The dissolution test system consists of the mechanical apparatus (itself composed of several
components), the physical environment in which the apparatus exists, the analytical procedure, and
the analyst.
The suitability of the apparatus for the dissolution testing depends on both the physical and
chemical qualification which qualify the equipment for further analysis. Besides the geometrical
and dimensional accuracy and precision, as described in harmonized Pharmacopeia (USP, EP, JP),
any irregularities such as vibration or undesired agitation by mechanical imperfection are to be
avoided. Temperature of the test medium, rotation speed/flow rate, volume sampling probes and
procedures need to be monitored periodically.
For instance, USP endorses the concept of mechanical calibration (grounded in metrology),
conducted at periodic intervals, to ensure that the mechanical components meet specifications and
are in a state of control. These mechanical checks, however, are necessary but not sufficient
because they ignore the chemical and kinetic aspects of the dissolution procedure, an oversight that
is common in most chemical tests. One vital aspect of qualification is therefore the Performance
Verification Test (PVT) (USP 2010). The use of PVT tablets (for apparatus 1 and 2) is the only
standardized approach for conducting dissolution tests and has been able to identify variability or
operator failures (Gray 2002, USP 2010). Suitability tests have also been developed for Apparatus
3, using specific calibrators. The aim is to generate a set of calibrators for each and every
compendia dissolution test apparatus (Hanson 2004, Dressman and Krämer 2005)

Page 26 of 201
2.2.4. Analytical methods associated with the Dissolutions
The universal analytical separation method with acceptable selectivity and sensitivity is high-
performance liquid chromatography (HPLC), with transfer to the more efficient ultra-performance
liquid chromatography (e.g. UPLC (Waters) or RR LC (Agilents)). HPLC is often the method of
choice even though it is less time efficient than UV/VIS due to the fact that during early phase
development multiple formulations and strengths are screened and potential interferences from the
formulation matrix or medium or even degradation of the active can be separated easily by HPLC.
Further, large variations in sample concentration can often be dealt with simply by adjusting
injection volume. Later on UV/VIS can be re-evaluated for QC routine and efficacy increase when
the formulation, the strength and the stability is well known. For QC and release purpose the
analytical methods need to be validated with regard to selectivity, linearity and accuracy.
(<USP<1092>, Gray 2009).
Spectroscopic in situ methods with fiber optics can also be used to analyze the liquid phase in
dissolution testing (Josefson 1988, Cho 1995) and, if desired, in situ solid phase analysis can be
performed by XRPD (Debnath, 2003) or Raman spectroscopy (Aaltonen 2006). Alternative
detectors to UV/VIS can be used if the analyte contains poor chromophores or low absorbance
response. Some of these are: evaporative light-scattering detector (ELSD), electrochemical detector
(ECD), refractive index detector (RI) or mass spectrometry (MS).
Additionally qualitative imaging technologies have been developed recently (Malaterre 2008),
using for instance Magnetic resonance imaging (MRI), tomography (Zeitler 2008) or NMR
imaging (Djemai 2008), EIT, Electrical Impedance Tomography, (Rimpiläinena 2010).
A newly example using XRay topograph is presented in this work as illustration of these approach
(see paper 2 supplement). These techniques allow a better understanding or visualization of the
intrinsic release mechanism and clearly participate to a sound rational for the development of new
robust medicine, that is in line with the Quality by Design concept (see chapter 2.5) and highlight
some future broaden potentials for dissolution method.
2.2.5. Discriminating Power of a Method
The discriminatory power of the dissolution method depends on the method’s ability to detect
changes in the drug product performance. Ideally, the dissolution test conditions should
discriminate product changes that may affect biopharmaceutical product performance. However,
unless an IVIVR or IVIVC exists (see chapter 2.4) for the product, variations in dissolution
behavior may or may not reflect variations in the product’s in vivo performance.
To determine if a dissolution method can discriminate the impact of product changes, the method
needs to be challenged. The most common way to challenge the discriminatory power of the

Page 27 of 201
method is to test formulations manufactured with differences resulting from changes in the
characteristics of the API (e.g., particle size, crystal form, bulk density), drug product composition
(e.g., drug loading, excipients identity/type and levels), drug product manufacturing process (e.g.,
dosage form, equipment variables as under or over granulation), and effects of aging (e.g.,
temperature, humidity).
These experiments should be designed on a case-by-case basis , based on a DoE, in consultation
with the galenist, chemist and analytical specialist. At this stage the collaboration between the
expertises is clearly a key factor. Thus, the change in the drug product can be evaluated versus the
change in the dissolution data. If the data show a measurable difference for the key variables, then
the method may be considered a discriminating test for critical manufacturing variables. Any
differences in the dissolution rates as a result of the selected variables may or may not have impact
on the in vivo product performance.
The dissolution method tends to evolve depending on its utility for drug development and should
be re-evaluated and optimized (if needed) when human bioavailability data are available from the
clinical formulations. During further method development, optimization, and before selection of
the final method, the formulations utilized in the late phase clinical studies are tested using various
medium compositions (e.g., pH, ionic strength, surfactant composition). The effect of
hydrodynamics on the formulations should also be evaluated by varying the apparatus agitation
speed. If a non-bioequivalent batch is discovered during a bioequivalency study, the dissolution
methodology should be further modified to allow differentiation of non-bioequivalent batches from
the bioequivalent batches by dissolution specification limits, if possible. This would ensure batch-
to-batch consistency within a range that guarantees comparable biopharmaceutical performance in
vivo. Once a discriminating method is developed, the same method should be used to release
product batches for future studies, if possible. The biorelevant method may not always be feasible,
and may or may not be the same as the QC method due to the scope and limitations of such a
method.
Page 28 of 201
2.3. Biorelevance of Dissolution Testing
2.3.1. BCS Definition To be efficacious, the active drug substance must be released from the drug product and absorbed
into the systemic circulation so that it can be transported to its site of activity. The overall
efficiency of this process contributes to the bioavailability of the drug substance and involves two
steps, dissolution and absorption, or permeability, as defined within Food and Drug Administration
(FDA) guidelines concerned within the Biopharmaceutics Classification System (BCS).
The BCS was first described in 1995 (Amidon, 1995) and its principles have been used in several
FDA guidances (FDA, 1995, 1997, 2000). The BCS is a scientific framework for classifying drug
substances based on their aqueous solubility and intestinal permeability. The main parameters for
influencing rate and extent of absorption of a drug substance through gastrointestinal membranes
and having significant influence on its bioavailability. When combined with the dissolution of the
drug product, the BCS takes into account three major factors that govern the rate and extent of drug
absorption from immediate release solid oral dosage forms:
• Solubility
• Intestinal permeability
Low solubility compounds, based on the BCS, are defined as compounds whose highest
therapeutic dose is not soluble in 250 mL or less of aqueous media from pH 1.2 to 7.5 at 37ºC.
The highest dosage form divided by the lowest solubility in the pH range 1.2 to 7.5 should be less
than 250. It’s important to note that solubility is mostly a property of the API and its salt form.
Kinetic solubility is usually determined by measuring the concentration of a saturated solution after
equilibration at 37ºC usually for 1 hr to 24 hrs. The equilibration time depends on the test duration
time as well as the physical and chemical stability (e.g., conversion of salt to free base in vitro) of
the drug.
High permeability is defined as human absorption of 90% or more of the administered dose (FDA
2000). Rapidly dissolving is defined as no less than 85% of label claim dissolved within 30
minutes for either USP Apparatus I at 100 rpm or USP Apparatus II at 50 rpm in pH 1.2 (0.1 N
HCl or simulated gastric fluid USP without enzyme), pH 4.5 buffer and pH 6.8 buffer (or
simulated intestinal fluid USP). Aside from API solubility, dissolution rate is a function of the
product disintegration (porosity, lubrication, granules, etc). This put then one important thing in
evidence, the classical BCS concept does not integrate dissolution rate.

Page 29 of 201
Low solubility, high permeability compounds are classified as Class II compounds. For these
compounds which have increased potential to demonstrate intrinsic dissolution-limited absorption
(rate of drug solubilization is much less than the rate of drug absorption) an In Vitro In Vivo
Relationship (IVIVR) or In Vitro In Vivo Correlation IVIVC may be possible (Lipka 1999) (see
chapter 2.4). Low solubility, low permeability compounds are classified as Class IV compounds
and may have solubility and permeability limited absorption. High solubility, high permeability
compounds are classified as Class I compounds and high solubility, low permeability compounds
are classified as Class III compounds. See Table 4
Table 4: Biopharmaceutical Classification System (BCS)
Class I:
Class II:
Class III
Class IV:
High solubility,
Low solubility,
High solubility
Low solubility
high permeability
high permeability
low permeability
low permeability.
The BCS characteristics (solubility and permeability), together with the dissolution of the drug
from the dosage form, takes the major factors that govern the rate and extent of drug absorption
from dosage forms into account (Charkoftaki 2010).
2.3.2. Extension of BCS
In 2005, Wu and Benet proposed an extended BCS, the Biopharmaceutics Drug Disposition
Classification System (BDDCS), which introduced first pass metabolism in the intestine and/or
liver as additional factor for the categorization of drugs (Wu 2005, Benet 2009).
As well, Bergstrom et al. (Bergstrom 2003) proposed a modified Biopharmaceutical Classification
System, in which they categorized the drugs into six classes based on the solubility and
permeability. The solubility was classified as "high" or "low" and the permeability was allotted as
"low", "intermediate," or "high". This new classification was developed based on the calculated
surface area descriptors on the one hand and solubility and permeability on the other. Surface areas
related to the nonpolar part of the molecule resulted in good predictions of permeability. It was
tentatively concluded that these models would be useful for early indication with regard to the
absorption profiles of the compound during the early stages of drug discovery so that the necessary
modifications can be made to optimize the pharmacokinetic parameters

Page 30 of 201
BCS and BDDCS are useful tools in discovery and early development to identify rate limiting
steps, to rank order compounds, and to communicate potential higher formulation risks. In later
phases, the BCS is used as a regulatory tool to identify IVIVC and to obtain waivers for in vivo BA
and BE testing according to SUPAC (FDA 1995), using dissolution testing at different pH as main
method to show similarity.
Waivers are designed to replace in vivo BE studies for immediate release products by in vitro
dissolution which can both reduce costs and improve the quality of medicines. Waivers were
originally designed only for class 1 drugs (FDA guidance, 2000; EMEA, 2002). In that case, the
application may be based on in vitro dissolution and permeability data together with scientific
justification of linear pharmacokinetics within the dosing range, a proof that the drug does not have
a narrow therapeutic index and that the excipients do not have pharmacokinetic interactions with
the drug. Recently, EMEA (EMEA 2010) allows biowaivers for BCS Class III drugs in specific
cases. This is different to the FDA Guidelines, where the BCS approach is only applicable to BCS
Class 1 drugs. This class has been proposed in many publications as appropriate for biowaivers if
the effects of excipients on the gastrointestinal transit time and permeability can be excluded
(Blume, Schug 1999; Yu et al. 2002; Cheng et al. 2004; Vogelpoel et al. 2004; Jantratid et al.,
2006). BCS III drugs have low permeability, which, rather than dissolution, is the limiting factor
for absorption. This was clearly seen in a bioavailability study of cimetidine immediate-release and
controlled-release formulations (Jantratid 2006). Permeability was the rate-limiting step for in vivo
absorption even when more than 85% of the drug dissolved in 90 minutes. In many publications,
BCS III drugs have been suggested for biowaivers if more than 85% of the drug dissolves in 15
minutes (Yu 2002; Polli 2004; WHO, 2006, Fagerholm 2007).
The actual biowaiver strategies are highlighted in figure 12 and also in chapter 2.5.
2.3.3. Application of BCS in the formulation development
Once the solubility and permeability characteristics of a drug are known, the formulation scientist
can then, based either on BCS or BDDCS, easily decide which drug delivery technology will best
help in getting the optimum pharmacokinetic characteristics.
The major challenge in the development of drug delivery systems for a class I drug is to achieve a
targeted release profile associated with the particular pharmacokinetic and pharmacodynamic
properties. Formulation approaches include both the control of release rate and physiochemical
properties of drugs like the pH-solubility profile of the drug. Dissolution should be kept as simple
as possible and whenever possible rapidly dissolving should be reached for IR.
The formulation systems that are developed for class II drugs are mostly based on the
micronization, lyophilization, addition of a surfactants, formulation as emulsions and micro

Page 31 of 201
emulsion systems, use of complexing agents like cyclodextrins, and so on. Dissolution often needs
to be performed with addition of surfactant.
Class III drugs are required for technologies that address the fundamental limitations of absolute or
regional permeability. Dissolution is similar to BCS class 1.
The class IV drugs present a major challenge for the development of drug delivery systems and the
route of choice, due to their poor solubility and permeability characteristics. These are often
administered by parenteral route with the formulation containing solubility enhancers.
2.4. IVIVC/R
For a dissolution test to be valuable in linking the formulation with efficacy and performance
characteristics, establishment of IVIVC or IVIVR is crucial. The IVIVC or IVIVR dissolution
method can then serve as a guide for the development of a meaningful quality control method,
which will occur in the different clinical development phases.
2.4.1. Definitions
Definitions of in vitro-in vivo correlations were proposed by the FIP (International Federation of
Pharmaceutics), the USP (United State Pharmacopeia), the FDA (Food and Drug Administration
(US)), the EMEA (European Medicinal Evaluation Agency (Europe)) and ICH (International
Conference for Harmonisation). All those definitions are hopefully globally similar. For the USP
(chapter <1088>) the definition is as follows:
“The term in vitro-in vivo correlation first appeared in pharmaceutical literature as a result of the
awareness of the concepts of bioavailability and of in vitro dissolution rate determinations. The
term in vitro-in vivo correlation refers to the establishment of a rational relationship between a
biological property, or a parameter derived from a biological property produced by a dosage
form, and a physicochemical property or characteristic of the same dosage form. The biological
properties most commonly used are one or more pharmacokinetic parameters, such as Cmax or
AUC, obtained following the administration of the dosage form. The physicochemical property
most commonly used is a dosage form’s in vitro dissolution behaviour (e.g., percent of drug
released under a given set of conditions). The relationship between the two properties, biological
and physicochemical, is then established quantitatively.
With the proliferation of modified-release products, it becomes necessary to examine the concept
of in vitro—in vivo correlation in greater depth. Unlike immediate-release dosage forms, modified
release products cannot be characterized using a single-time point dissolution test. Furthermore,
with a modified-release product a patient is to show a specific plasma level curve covering a finite
time period, usually 12 to 24 hours. There must be some in vitro means of assuring that each batch
of the same product will perform similarly in vivo. An in vitro-in vivo correlation would satisfy this

Page 32 of 201
need. Initially it was thought that developing a meaningful correlation for immediate-release
dosage forms would be an easier task than for modifled-release products. However, because of the
nature of the principles upon which each type is based, it is believed that an in vitro-in vivo
correlation is more readily defined for modified-release dosage forms.”
For FDA in the “Guidance for Industry Extended Release Oral Dosage Forms: Development,
Evaluation, and Application of In Vitro/In Vivo Correlations”, IVIVC are defined in the glossary
as “In vitro/in vivo correlation: A predictive mathematical model describing the relationship
between an in vitro property of an extended release dosage form (usually the rate or extent of drug
dissolution or release) and a relevant in vivo response, e.g., plasma drug concentration or amount
of drug absorbed.”
The European Agency as well as ICH use the term in various notes for guidance without giving an
exact definition (ICH Q8 and EMEA Note for guidance on the quality of modify released product
section I, Note for guidance on product development, Note for guidance on BE/BA).
All those definitions could be summarized as relationships (in vitro in vivo relationship IVIVR) or
correlations (in vitro in vivo correlation IVIVC) observed between parameters or curves derived
from in vitro (dissolution) and in vivo (bioavailability or bioequivalence) studies, irrespective of
the mathematical definition of the terms. IVIVR or IVIVC try to establish a link either between the
full dissolution curves and the in vivo absorption curves or between some parameters derived from
in vitro curves (for example time to have x% dissolved or % dissolved at certain times) and in vivo
curves (mainly bioequivalence parameters: Cmax-AUC). IVIVR and IVIVC are two ways to
establish a link between in vitro and in vivo data.
It is not easy to differentiate in vitro in vivo relationships from in vitro in vivo correlations.
The terms relationship and correlation are close together. Merriam Webster dictionary defines “a
relationship as the state to be related or interrelated” and a correlation as “a relation existing
between phenomena or things or between mathematical or statistical variables which tend to vary,
be associated, or occur together in a way not expected on the basis of chance alone”. From a
statistical point of view, a correlation could be established when both variables are normally
distributed and randomly obtained and a relationship when only one of the two is randomly
obtained. From a biopharmaceutical point of view the two terms are often define as:
• IVIVC: a “quantitative” linear mathematical model relating in vitro property of a dosage form
(usually dissolution or release) and a relevant in vivo response (usually “absorption” curve or
parameters derived from plasma time-concentration curve). The IVIVC could be used (in case
of level A) as a biowaiver for in vivo BA studies.

Page 33 of 201
• IVIVR: a “qualitative” ranking between in vitro and in vivo data that indicates qualitative
tendencies. This IVIVR helps in the identification of key factors.
There are four levels of IVIVC that have been described in the FDA guidance, which include
levels A, B, C, and multiple C.
Level A Correlation: This correlation represents a point-to-point relationship between in vitro
dissolution and in vivo dissolution (input/absorption rate). Level A IVIVC is also viewed as a
predictive model for the relationship between the entire in vitro release time course and entire in
vivo response time course. In general, correlations are linear at this level. Although a concern of
acceptable non-linear correlation has been addressed, no formal guidance on the non-linear IVIVC
has been established. Level A correlation is the most informative and very useful from a regulatory
perspective.
Level B Correlation: In Level B correlation, the mean in vivo dissolution or mean residence time is
compared to the mean in vitro dissolution time by using statistical moment analytical methods.
This type of correlation uses all of the in vitro and in vivo data; thus, it is not considered as a point-
to-point correlation. This is of limited interest and use because more than one kind of plasma curve
produces similar mean residence time.
Level C Correlation: This correlation describes a relationship between the amount of drug
dissolved (eg, % dissolved at 1 hour) at one time point and one pharmacokinetic parameter (eg,
either AUC or Cmax). Level C correlation is considered the lowest correlation level as it does not
reflect the complete shape of the plasma concentration time curve. Similarly, a multiple Level C
correlation relates one or more pharmacokinetic parameters to the percent drug dissolved at several
time points of the dissolution profile and thus may be more useful. Level B and C correlations can
be useful in early formulation development, including selecting the appropriate excipients, to
optimize manufacturing processes, for quality control purposes, and to characterize the release
patterns of newly formulated immediate-release and modified-release products relative to the
reference.
Anyway those definitions like the mathematical one do not imply a causal relationship. Two
parameters could be related together by a direct cause-effect relation or by an indirect relation. The
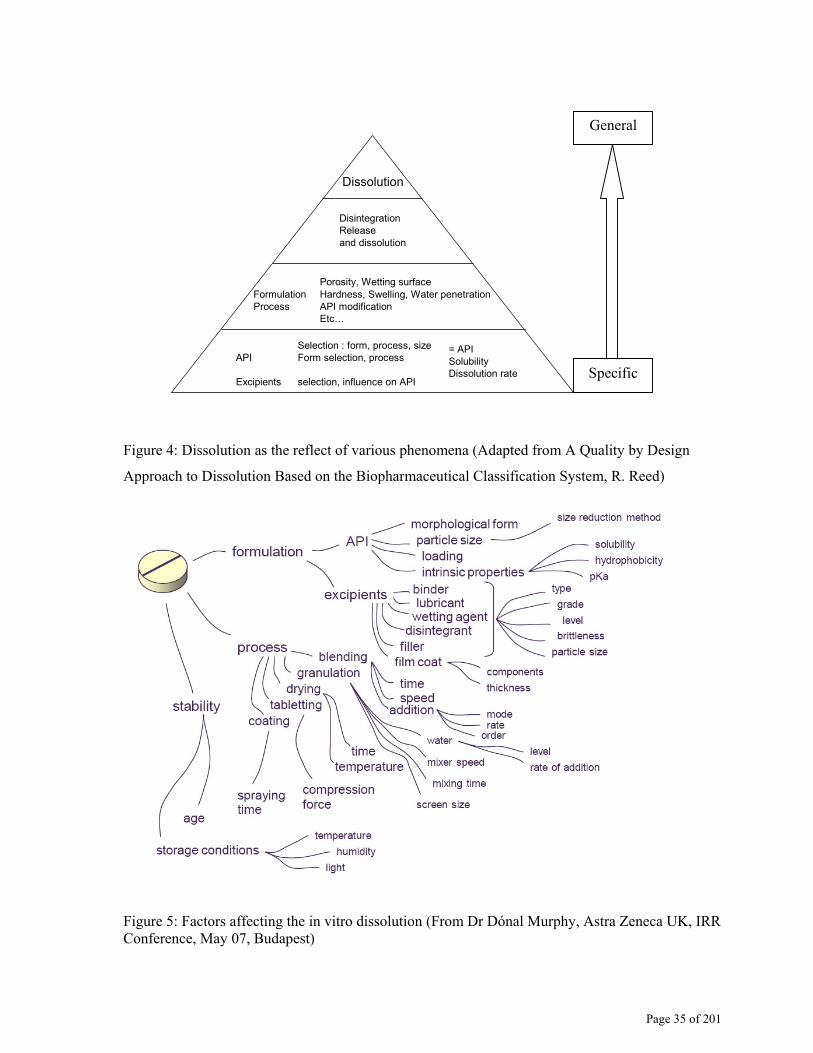
figure 4 shows that the dissolution curve reflects numerous underlined phenomena. A difference in
dissolution could reflect, as expected in IVIVC, a difference in release from the drug dosage form
Page 34 of 201
but also a difference in API characteristics which is of low interest for IVIVC, since it can be
addressed by other analytical method.
The causality will be assessed during the validation process (called predictability) taking into
account the API characteristics and formulation process in an ideal case.
Establishment of IVIVR or IVIVC could be summarized as “finding a correlation or relationship
between in vivo and in vitro results”. In vitro, the dissolution reflects a number of factors (cf figure
4 & 5& 6). For example a slow dissolution reflects either a slow dissolution rate or low solubility
of the API or a slow release from the drug dosage form (figure 7).
The API characteristics like dissolution rate or solubility belong to the chemistry field and not to
the pharmaceutical development field and could be considered to be perfectly studied and defined
before the development of the pharmaceutical formulation: normal or micronized API, acid or salt,
etc…. The main parameters studied in vitro must reflect the release of the drug from the drug
dosage form (figure 7) and not the API characteristics.
It is useful to have a full characterisation of the various batches of API, included in the formulation
and the manufacturing process of the final formulation so as to be able to establish that any
differences observed in vitro will be linked with the formulation and not with a problem of API
sourcing or manufacturing. In this case the manufacturer can predict the in vivo behaviour of the
formulation form of its composition without the influence of the API sourcing or manufacturing.
Page 35 of 201
Dissolution
DisintegrationReleaseand dissolution
Porosity, Wetting surfaceFormulation Hardness, Swelling, Water penetrationProcess API modification
Etc…
= API SolubilityDissolution rate
Selection : form, process, sizeAPI Form selection, process
Excipients selection, influence on API
Figure 4: Dissolution as the reflect of various phenomena (Adapted from A Quality by Design
Approach to Dissolution Based on the Biopharmaceutical Classification System, R. Reed)
Figure 5: Factors affecting the in vitro dissolution (From Dr Dónal Murphy, Astra Zeneca UK, IRR Conference, May 07, Budapest)
Specific
General

Page 36 of 201
Figure 6: Dissolution as a reflection of the pharmaceutical complexity of the product, continuous
line: directly accessible information, dashed line: underlined properties of material.
The figure 7 summarizes the behaviour of a drug administered per oral solution (os), the observed
plasma concentration reflects the slowest of the three phenomena: the dissolution rate of the API;
the release from the drug delivery form (DDF) in vivo and the absorption from the GIT. A part of
the information could be given by the BCS and the other metrics derived from it (absorption, dose
and dissolution numbers).
Formulation type: IR, MR, type of
MR, etc…
Process parameters: mixing ,
granulation, drying,
Formula: composition, grade
of excipients, quantity of
API: source, quality, purity, salt,
etc.
API: solubility, dissolution rate,
particle size, crystal shape,
polymorphism, pKa, etc.
Form
ulat
ion
and
proc
ess
API
Dissolution results:
Percentage dissolved
Dissolution apparatus
Dissolution media
Dissolution parameter

Page 37 of 201
Figure 7: Plasma concentration curve after the administration of a per os formulation (adapted from
Cardot, Sotax Workshop Basel 2010)
The plasma concentration curve is a global representation; it depends on drug input in the blood
flow which depends on the dosage form (release rate), the properties of the API (solubility,
dissolution rate, permeability, type of absorption, efflux, etc.), and thereafter its pharmacokinetics
input processes. The disposition of the drug after input depends only on the drug and patient
(figure 8).
Figure 8: main phenomena after administration of various formulations (FDA 1997))
Two different formulations could exhibit different blood profiles because either the release of drug
at site of absorption was not completed (formulation problem), or the drug in solution at site of
absorption is insufficient (API characteristics) or due to a non linear or inconstant physiological
i.v. Distribution-Elimination
p.o.
solution Distribution-EliminationAbsorption
p.o.
solid form Distribution-EliminationAbsorptionRelease, Dissolution
DRUG DELIVERY
SYSTEM
Liver
Kidneys
RECEPTOR
TARGET
RESPONSE
CENTRAL
COMPARTIMENT
PERIPHERIQUE
COMPARTIMENT
Distribution
Efficacy
URINE, METABOLISATIONSTOOLS ETC
AbsorptionMetabolisation
Elimination
Dissolution
The rate limiting or determining phenomenon is observed in vivo
Release
In vivo: PK In vitro: Dissolution, PAT, etc.
API
characteristics Formulation
** *
*
* Studied in IVIVR/C

Page 38 of 201
process (high or saturable first pass metabolism, low GI permeability, presence of efflux, non
passive absorption). When the synthesis of the API is stabilized, the release of the drug from the
DDF is the only factor which can have a role and can be studied in vitro. Figure 9 sums up those
phenomena.
If in vivo, absorption is the slowest of the three processes (kd>kp in figure 9), then absorption is
the limiting factor for the behaviour of the drug in the blood is then limited by this absorption in
vivo. The release or dissolution rate of the drug is then of no importance.
If slowest phenomena in vivo between dissolution release and absorption is the release (kd<kp in
figure 9 the behaviour of the drug in the blood is then limited by this dissolution/release in vivo.
The drug concentration observed in blood will then depend not of the absorption of the drug but of
its dissolution/release. This dissolution release could be easily studied in vitro. The aim of IVIVx is
to relate the observed release dissolution in vivo considered as the limiting factor to the in vitro
observed dissolution. In this last proposition 2 cases existed. If the API dissolution is slower than
the release (ks<kr) then the observed IVIVx will be between an API characteristics (like crystal
size, intrinsic solubility, etc., usually not investigated by dissolution tests) and the blood input. If
the API dissolution is faster than the release (ks>kr) then the observed IVIVx will be between the
drug release (which is normally studied by a dissolution test) and the blood input.
Figure 9: Representation of the main phenomena leading to absorption in vivo, in green apparent
observed (macro) phenomena, in red underlined dissolution (micro) phenomena
The aim of IVIVC is to study the relation between the formulation and process parameters
described in figure -1 usually studied by a dissolution test and the in vivo input. The main
Formulation
Solubilized Drug
kddDisintegration
Release
API Dissolution kr ks
Absorbed Drug Absorption
Dissolution
rate kd
kp

Page 39 of 201
parameters are summarized as kd and kp in figure 9, kd dependent on 3 main components and it is
assumed for IVIVC that ks is not the limiting factor).
IVIVC and mainly level A IVIVC can be used in numerous cases. It is a powerful tool for
development; it guarantees a gain of time and the in vivo performances. It allows determining the
release characteristic over time. It can be used as a process control and quality control for the
validation of the manufacturing control limits (dissolution limits). It facilitates certain regulatory
determinations like minor variations and can be used as a surrogate of certain bioequivalence
studies for extended release formulations (bio waiver) like for example in case of small
modification in the quantitative composition of the release excipients, of the dose strength, of small
modification of the manufacturing process or modification of the production site
In ICH Q8, regarding development of formulations, a full paragraph is on the use of IVIVC to
compare clinical formulation to final market image, this text emphases the interest of IVIVC and
the possible use of IVIVC to set dissolution limits: “Information from comparative in vitro studies
(e.g., dissolution) or comparative in vivo studies (e.g., bioequivalence) that links clinical
formulations to the proposed commercial formulation described in 3.2.P.1 should be summarized
and a cross-reference to the studies (with study numbers) should be provided. Where attempts have
been made to establish an in vitro/in vivo correlation, the results of those studies, and a cross-
reference to the studies (with study numbers), should be provided in this section. A successful
correlation can assist in the selection of appropriate dissolution acceptance criteria, and can
potentially reduce the need for further bioequivalence studies following changes to the product or
its manufacturing process.”
They point out also the fact that “… an establish IVIVC may reduce the number of bioequivalence
studies during product development, be helpful in setting specifications and be used to facilitate
certain regulatory decicion (e.g. scale-up and post approval variations)” and it is stressed out that
IVIVC should always be considered as a possible way of developing a formulation by the
applicant. Even if a correlation is used for developing a drug and mainly for generic some
limitations exist “…correlation is not intended to serve as a basis for claiming bioequivalence
between different product from different MA applicants, based on in vitro data only” that being
normal as the IVIVC established on a formulation using a release mechanism could not be used for
another release mechanism and due also to the fact that all the key factors of the production are not
know for the reference formulation.

Page 40 of 201
In development IVIVC is a tool with allow speed up development as it can be used to understand
better the in vivo release mechanism, to establish the key factors of the formulation and to de risk
bio equivalence studies. IVIVC may reduce the number of in vivo studies during the development
and can be established using forecasted studies with no additional cost.
A biowaiver is the use of in vitro dissolution curve in place of bioequivalence study to prove
equivalence of formulation or process. That is based on the simulation (calculation) of the plasma-
concentration curves based on the dissolution profile and on the established IVIVC (Figure 10)
Figure 10: Use of IVIVC as biowaiver
The use of IVIVC as a biowaiver is perfectly described in FDA note for guidance. Those biowaiver
involved a validated Level A correlation for extended or delayed release formulation, and could be
applied in case of major changes of non release-controlling excipients, minor changes of release-
controlling excipients, major changes in method or site of manufacturing. Various cases are
described and are function of category and level.
In conclusion IVIVC is a tool that can be used in numerous cases. IVIVC, as a multi factorial tool,
needs information from various domains and helps both a communication between collaborators
New batch
In vitro dissolution
In Vivo BE study
Bioequivalence Yes
No
SUPAC
New batch
In vitro dissolution
In Vivo Simulation
Bioequivalence
IVIVC
Yes
No level A IVIVC Level A IVIVC
For SUPAC categories 2 and 3

Page 41 of 201
and an improvement of the knowledge about API and formulation, production process, in vitro
dissolution and pharmacokinetics.
In development IVIVC is a tool to understand how the formulation and process behave, to identify
critical/key factors of formulation (Release controlling excipients or binder etc. ) and of the process
(Wet granulation, drying, compression force, etc…). It helps to optimize development and to lower
the risk of non-bioequivalence studies even if biowaiver are not used for the dossier. IVIVC could
be used to helps production scale up and modification, adjustment of formula, line extension and
might also be used post approval as biowaiver (Change in formulation, production site, etc…).
IVIVC represents in all cases a gain in the dossier to explain the development rational, to
implement quality by design or for regulatory modifications.
For generic industry IVIVC is a tool that can be used, starting from published data, as a first
approach of the formulation. This approach could not be used as biowaiver but only as a factor of
development speed up and dossier rational.
The IVIVC implementation cost is limited versus the full development but it has limitations like all
the tools. The main one being that a correlation established for a type of dosage form cannot be
extrapolated to another type of dosage form, the route of administration must be identical for all
formulations and the release must be the limiting factor
Page 42 of 201
2.4.2. Dissolution development for IVIVC/R
A basic relationship might be found between API properties and PK data (see also Paper 1). This
relationship can be in the form of a rank order or can be modeled mathematically (Emami 2006,
Cardot 2005). In the second level, deconvolution of PK (e.g. Wagner Nelson or Loo-Riegelman
method) (Wagner 1963, Loo and Riegelman 1968) data might be used to establish IVIVC or
IVIVR. The relationship can be achieved by correlating the fraction of dose dissolved versus the
fraction of dose absorbed, estimated by deconvolution (see also Paper 2). In most cases, however,
this correlation requires that the absorption process is dissolution controlled. For IR products, this
approach mostly fails or, in some cases, requires a scale factor between in vitro and in vivo data
(Löbenberg 2000, Levy 1965). For extended-release products, there is a high probability of
establishing IVIVC. When IVIVC cannot be established using deconvolution, convolution-based
models should be used. Convolution-based approaches use models such as the Advanced
Compartmental Absorption and Transit (ACAT) model or other PK models to predict the oral
performance of a dosage form (Wei 2008). In vitro data are used in these models to predict the
plasma time curves. Such a prediction, if established by using the appropriate parameters, is a
Level A correlation.
Determination of IVIVC and IVIVR is a continuous effort throughout development. It requires
input of data, including human PK levels and pharmacodynamic properties, food effects, API
properties (BCS), and dosage-form information (i.e., excipient properties). Computer tools can be
used to develop IVIVC and IVIVR. See also next chapter.
2.4.3. Simulation tools
Many efforts have been made to establish systems simulating in vivo behaviour of formulations. A
number of non compendial multicompartment dissolution models have been developed to more
closely mimic the in vivo situation. These systems are typically configured to allow transport of
buffer contents from gastric compartment to a second intestinal compartment. Some systems, like
the TIM model of TNO Pharma (Souliman 2007), attempt to exactly mimic in vivo conditions. For
instance it was shown that the TIM-1 could be used to generate a level A IVIVC for paracetamol in
both fasted and fed states (Souliman 2006).
But the high complexity of the TIM model makes it impractical for routine dissolution testing. The
artificial stomach duodenal model (ASD) which has been used to evaluate the effect of gastric
emptying on API dissolution, solubilization and precipitation in a separate duodenal compartment.
The in vivo relevance of ASD dissolution profiles is based on the assumption that the

Page 43 of 201
concentration of dissolved drug in the simulated duodenum is proportional to its bioavailability
(Castela-Papin 1999, Vatier 1998).
Also uses of software (as mentioned in 2.4) using ACAT model are of great help. Simulation of in
vitro dissolution behavior exits as well (DDD Plus from http://www.simulations-plus.com) but this
software offers for the time being only limited features. Commercial pharmacokinetic modeling
software, e.g. IDEA, Stella (http://www.iseesystems.com) and Gastroplus®
(http://www.simulations-plus.com), PK-Sim® (http://www.systems-biology.com/products/pk-
sim.html),Simcyp® (at http://www.simcyp.com ) and the TNO integrated software
(http://www.tno.nl) can be utilized to simulate and predict oral drug absorption in different
development phases for drug products. In silico, in vitro and in vivo data from test animal’s species
can be used to predict absorption properties (Parrot and Lavé, 2002). However, these programs are
not transparent; the whole structure of the model and the parameter values are not available. The
major aim in the simulation is to combine many variables that are related to gastrointestinal tract
physiology and drug and formulation properties, and to learn which are the most critical factors
affecting drug absorption.
The pros and cons of absorption modeling have been reviewed in 2009 by Fotaki (Fotaki 2009).
Only a self-constructed transparent model enables an interactive learning process. Stella software
is user-friendly and can be used to construct compartment models like CAT.
It is important to keep in mind that the simulation strongly depends on the quality of the data (e.g.
high low standard deviation) and their interpretation. Again the dissolution with its dynamic aspect
is a key element.
2.5. Quality by Design and Dissolution
Traditionally, manufacturing processes are fixed early in development with the intention that
material produced from fixed (respectively frozen) processes would be equivalent in quality and
that quality is measured by end product testing by fulfilling to specification. Dissolution testing is
then used to demonstrate that new batches have similar performance to reference pivotal clinical
batches.
The aim of QbD is to make more effective use of the latest pharmaceutical science and engineering
principles and knowledge throughout the lifecycle of a product. This has the potential to allow for
more flexible regulatory approaches where, for example, post-approval changes can be introduced
without prior approval and end-product batch testing can be replaced by real time release. Through
this understanding, the process and product can be designed to ensure quality and the role of end
product testing is reduced.

Page 44 of 201
During Phase III development, QbD approaches can be used to optimize and finalize the drug-
product formulation and manufacturing processes. Compared with conventional development
approaches, QbD is primarily devoted to increasing the mechanistic understanding of a formulation
and its manufacturing processes, their relationship to product quality attributes, and ultimately,
their impact on the safety and efficacy of the product. When a QbD approach is selected, robust
product formulation and manufacturing processes should be designed to achieve desired product
performance and also relate to desired clinical performance. When the product performance can be
appropriately characterized by in vitro dissolution (or a surrogate) test, the dissolution test can be a
powerful tool. The dissolution test helps then in the identification of critical quality attributes and
critical process parameters. Therefore use of QbD and IVIVC/R will contribute to specifications
that have meaning with in vivo performance.
FDA and EMEA are encouraging sponsors to use QbD in the development of their drug products.
The principle is outlined in the ICH guidelines Q8 (Pharmaceutical Development), Q9 (Quality
Risk Management) and Q10 (Quality System). In November 2009, the FDA published as final the
ICH Q8(R2) Guidance on Pharmaceutical Development.
A process is well understood when all critical (direct impact) or key (indirect impact) sources of
variability are identified and explained (so called “control space”). Variability is managed by the
process design and monitoring. Product quality attributes are accurately and reliably predicted over
testing of extreme combinations of all operating parameters for process, equipment, and facilities
(so called design space). Prior to this, the relevant knowledge about the drug substance, excipients
and process operations were gathered into a so called knowledge space. The QbD
interdependencies are outlined figure 11
In practice QbD consists of the following elements (ICH Q8(R2)):
• Define quality target product profile (QTPP).
• Design and develop product and manufacturing processes to meet the target product quality
profile (Design space).
• Identify and control critical raw material attributes, process parameters, and sources of variability
(CQA).
• Monitor and adapt processes to produce consistent quality over time (Control strategy).
Under the QbD system, pharmaceutical quality is assured by understanding and controlling
formulation and manufacturing variables, while end-product testing, including in vitro dissolution,
confirms the quality of the product. In the context of dissolution, QbD implies establishing the
relationships among raw material properties (such as particle size), formulation variables (excipient
levels and grade, aging), process parameters (such as compression force and blending time) see

Page 45 of 201
also figure 5 for detailed parameters, and the target product quality profile. This effort will allow
defining the design space. Efficient implementation of QbD requires a biorelevant dissolution test
during product development. In a QbD system, product attributes such as particle size or
polymorphic form that are previously monitored indirectly via a QC dissolution test are monitored
and controlled through the design and control of the manufacturing process (control space).
Although QbD does not necessarily directly link to clinical relevance, a thorough understanding of
the product properties through QbD enables to choose a dissolution test that may provide the
desirable IVIVR for drug release. Thus, under QbD, dissolution testing development should mainly
focus on its clinical relevance (see also paper 1).
QbD is a systematic approach to product development and process control that begins with
predefined objectives, emphasizes product and process understanding and sets up process control
based on sound science and quality risk management. QbD is partially based on the application of
multivariate statistical methods and statistical Design of Experiments (DoE) strategy for the
determination of the process and product design spaces and for the development of both analytical
methods and pharmaceutical formulations. Adequate process controls in pharmaceutical
manufacture are also required to suffice the current FDA demands, such as PAT (Process
Analytical Technology). PAT comprises designing, analyzing and controlling processes by
measuring on line critical process parameters and quality attributes. However, the PAT initiative is
only one topic within the broader FDA initiative of "Pharmaceutical cGMPs for the 21st century –
A risk based approach" (FDA 2004). If product performance is within the design space, dissolution
testing may not be needed as a routine test for a finished product specification or could be replaced
by other surrogate testing (e.g. NIR).
Additional objective to process understanding is clearly biowaiver. By combining the information
mentioned in previous chapters of this thesis, the QbD associated with the BCS (chapter 2.3.2) and
IVIVC/R (chapter 2.4) , allows for tomorrow biowaiver new perspective see figures 12 and 13.

Page 46 of 201
Figure 11: QbD Interdependencies
Despite the many potential benefits, the industry has not been quick to embrace QbD. It is not yet
clear how much flexibility regulators will offer, particularly since they have not outlined a clear
path for filing beyond the high-level discussion in Q8, Q9 and Q10. In addition, a QbD filing
requires a significant level of data sharing (although, in reality, the data must be made available for
review if requested, even for a traditional filing). Finally, planning for a QbD filing requires
significant investment of time and effort to coordinate information early in development. QbD is
an evolving process. QbD requires that we think in a different way to the 3-batches validation
paradigm and from early stage development up to post lauch dissolution remains a major method
in this approach (see also paper 1-2-3-4).
Controlspace
Design space(where variantsare tested duringdevelopment)
Knowledgespace

Page 47 of 201
BCS
SUPAC
BCS Class 1
BCS class 3(rapidely dissolving)
IVIVC Level A correlation
Bio Waiver
Figure 12: current Biowaiver strategy based on BCS and IVIVC
BCSClassification
SUPAC
BCS Class 1 and extention to
BCS class 3 and some class 2 acid
IVIVC Level A correlation
Bio Waiver
CQA . Particle sizeDissolution profile
QbDDesign space
Predictive Model:IVIVRClinical operation
Figure 13: Biowaiver potential for tomorrow (in blue) based on QbD, IVIVC, BCS and SUPAC.

Page 48 of 201
2.6. References
Aaltonen, J. et al. "In Situ Measurements of Solvent-Mediated Phase Transformations During
Dissolution Testing". Journal of Pharmaceutical Sciences. 2006. 95, 2730-2737.
Amidon, G.L., Lennernas, H., Shah, V.P. and Crison, J.R., “A Theoretical Basis for Biopharmaceutic
Drug Classification: The Correlation of in Vitro Drug Product Dissolution and in Vivo
Bioavailability,” Pharm. Res. 1995.12(3), 413-420.
Balakrishnan, A., Rege, BD., Amidon, GL., Polli, JE. "Surfactant-mediateddissolution: Contributions
of solubility enhancement and relatively low micelle diffusivity". Journal of Pharmaceutical Sciences.
2004. 93; 2064-2075.
Benet, LZ. "The Drug Transporter-Metabolism Alliance: Uncovering and Defining the Interplay".
Molecular Pharmaceutics.2009. 6; 1631-1643.
Berger, C. M. et al. "Technical Note: Miniaturized Intrinsic Dissolution Rate (Mini-IDR™)
Measurement of Griseofulvin and Carbamazepine." Dissolution Technologies, 2007, 14, 39-41.
Bergstrφm, CA., Strafford, M., Lazorova, L., Avdeef, A., Luthman, K., Artursson, P. "Absorption
classification of oral drugs based on molecular surface properties". J Med Chem. 2003.46:558-70.
Buch, P et al." IVIVC for Fenofibrate Immediate Release Tablets Using Solubility and Permeability as
In Vitro Predictors for Pharmacokinetics". Journal of Pharmaceutical Sciences. 2010, 99,10
Cho, J. H., Gemperline, P. J., SAlt, A. & Walker, D. S. "UV/visible spectral dissolution monitoring by
in situ fiber-optic probes". Analytical Chemistry. 1995. 67, 2858-2863
Debnath, S., Predecki, P. & Suryanarayanan, R. "Use of glancing angle X-ray powder diffractometry
to depth-profile phase transformations during dissolution of indomethacin and theofylline tablets".
Pharmaceutical Research.2003. 21, 149-159 .
Castela-Papin, N.; Cai, S.; Vatier, J.; Keller, F.; S, C. H.; Farinotti, R. “Drug interactions with
diosmectite: a study using the artificial stomach-duodenum model”. Int. J. Pharm. 1999, 182, 111–119.

Page 49 of 201
Charkoftaki, G.; Dokoumetzidis, A.; Valsami, G.; Macheras, P. “Biopharmaceutical classification
based on solubility and dissolution: a reappraisal of criteria for hypothesis models in the light of the
experimental observations”. Basic Clin. Pharmacol. Toxicol. 2010, 106, 3168–172.
Djemai, A. and I. C. Sinka. "NMR imaging of density distributions in tablets." Int J Pharm.
2006.319(1-2): 55-62.
Dressman, J.B., Amidon, G.L., Reppas, C., Shah, V. P. "Dissolution testing as a prognostic tool for
oral drug absorption: immediate release dosage forms". Pharm. Res.1998. 15 (1): 11-22
Dressman, J.B., Butler, J., Hempenstall, J., Reppas, C. "The BCS: Where do we go from here?"
Pharm. Techn. 2001. 6: 68-76
Dressman, J.B.and Reppas, C. "In vitro-in vivo correlations for lipophilic, poorly water soluble drugs".
Eur J Pharm Sci. 2000. 11(2):S73-80
Dressman, JB and Krämer, .J. “Pharmaceutical Dissolution Testing.” Taylor & Francis Group., 2005,
1-34.
Durig, T. and R. Fassihi. "Evaluation of floating and sticking extended release delivery systems: an
unconventional dissolution test." J Control Release. 2000. 67(1): 37-44.
EMEA Note for guidance development, European agency for evaluation of medical product
CPMP/QWP: 155/96 January 1998
EMEA Note of guidance on oral modified release and transdermal dosage form, European agency for
evaluation of medical product CPMP/EWP: 280/96 July 1999
EMEA. “Guideline for the Investigation of Bioequivalence” Committee for Medicinal Products for
Human Use, European Medicines Agency. Effective 1/8/2010.
EP. European Pharmacopoeia. 2.9.3: “Dissolution for solid oral dosage forms”. Strasbourg, France:
The Council of Europe (European Directorate for the Quality of Medicines & Healthcare); 2009.
Fagerholm U." Evaluation and suggested improvements of the biopharmaceutics classification system
(BCS j pharm pharm sci . 2007. 59; 751-757.
Page 50 of 201
FDA Guidance for Industry Nonsterile Semisolid Dosage Forms Scale-Up and Postapproval Changes:
Chemistry, Manufacturing, and Controls; In vitro Release Testing and In vivo Bioequivalence
Documentation U.S. Department of Health and Human Services Food and Drug Administration Center
for Drug Evaluation and Research (CDER) May 1997
FDA Guidance for Industry: Bioavailability and Bioequiva-lence Studies for Orally Administered
Drug Products—General Considerations. October 2000.
FDA Guidance for Industry: Dissolution Testing of Immediate Release Solid Oral Dosage Forms U.S.
Department of Health and Human Services Food and Drug Administration Center for Drug Evaluation
and Research (CDER) August 1997.
FDA Guidance for Industry: Extended Release Oral Dosage Forms: Development, Evaluation, and
Application of In Vitro/In vivo Correlations. U.S. Department of Health and Human Services Food
and Drug Administration Center for Drug Evaluation and Research (CDER) September 1997
FDA Guidance for Industry: SUPAC-IR: Immediate Release Solid Oral Dosage Forms: Scale-Up and
Postapproval Changes: Chemistry, Manufacturing, and Controls, In Vitro Dissolution Testing, and In
Vivo Bioequivalence Documentation. U.S. Department of Health and Human Services Food and Drug
Administration Center for Drug Evaluation and Research (CDER) November 1995.
FDA Guidance for Industry: Waiver of In Vivo Bioavailability and Bioequivalence Studies for
Immediate Release Solid Oral Dosage Forms Based on a Biopharmaceutics Classification System U.S.
Department of Health and Human Services Food and Drug Administration Center for Drug Evaluation
and Research (CDER) August 2000.
FIP guidelines for dissolution testing of solid oral products [Duplicate publication of FIP guidelines
for dissolution testing of solid oral products. Pharm Ind. 1997;59:760-766]. Dissolut Tech-nol.
1997;4:5-14.
Food and Drug Administration, Department of Health and Human Sciences. Pharmaceutical cGMPs
for the 21st Century-A Risk-Based Approach. 2004.
Fotaki, N. "Pros and cons of methods used for the prediction of oral drug absorption". Expert Review
of Clinical Pharmacology.2009. 2; 195-208.
Fuchs, W. S., Jakobs, R., Grunenberg, P., Weiss, G., Profitlich, T., von-Nieciecki, A., Klemm, F. H.,
Laicher, A., Stanislaus, F. "The effect of different variables on the in vitro dissolution of a
theophylline sustained-release preparation". Arzneim.-Forch./Drug Res.1998. 48(5A): 552-556

Page 51 of 201
Fujioka, Y., Kadono, K., Fujie, Y., Metsugi, Y., Ogawara, Ki., Higaki, K., Kimura, T. "Prediction of
oral absorption of griseofulvin, a BCS class II drug, based on GITA model: Utilization of a more
suitable medium for in-vitro dissolution study". Journal of Controlled Release. 2007. 119; 222-228.
Galia, E., Nicolaides E., et al. "Evaluation of various dissolution media for predicting in vivo
performance of class I and II drugs". Pharm Res .1998.15(5): 698-705.
GastroPlus. Available at http://www.simulations-plus.com. Accessed 2010 August 6.
Ghazal Heba, S., Dyas, AM., Ford, James L., Hutcheon, Gillian A. "In vitro evaluation of the
dissolution behaviour of itraconazole in bio-relevant media". International journal of pharmaceutics,
2009; 366; 117-123.
Gray, V. "Identifying Sources of Error in Calibration and Sample Testing," Am. Pharm. Rev. 2002. 5
(2), 8–13
Gray, V. et al. "The Science of USP 1 and 2 Dissolution: Present Challenges and Future Relevance.
Pharmaceutical Research". 2009. 26, 1289-1302
Hanson, R and Gray, V., Handbook of Dissolution Testing, 3 Dissolution Technologies, Hockessin,
DE, 2004.
ICH Harmonised Tripartite Guideline. International committee of harmonisation of technical
requirements for registration of pharmaceuticals for human use.Q10: Quality system 2006
ICH Harmonised Tripartite Guideline. International committee of harmonisation of technical
requirements for registration of pharmaceuticals for human use.Q8: Pharmaceutical Development.
2003.
ICH Harmonised Tripartite Guideline. International committee of harmonisation of technical
requirements for registration of pharmaceuticals for human use.Q8R2: Pharmaceutical Development
revision 2, november 2009
ICH Harmonised Tripartite Guideline. International committee of harmonisation of technical
requirements for registration of pharmaceuticals for human use.Q9:Quality RiskManagement. 2006.
Emami, J. "In Vitro–In Vivo Correlation: From Theory to Applications," J. Pharm. Sci. 2006. 9 (2),
31–51

Page 52 of 201
Jantratid, E., et al., Biowaiver monographs for immediate release solid oral dosage forms: cimetidine.
J Pharm Sci, 2006. 95(5): p. 974-84.
Jantratid, E.,Janssen N, et al. "Dissolution media simulating conditions in the proximal human
gastrointestinal tract: an update." Pharm Res. 2008.25(7): 1663-76.
Jones, HM., Parrott, N., Ohlenbusch, G., Lave, T. "Predicting pharmacokinetic food effects using
biorelevant solubility media and physiologically based modelling. Clinical Pharmacokinetics", 2006.
45; 1213-1226.
Josefson, M., Johansson, E. and Torstensson. "A. Optical fiber spectrometry in turbid solutions by
multivariate calibration applied to tablet dissolution testing".Analytical Chemistry.1988. 60, 2666-
2671
JP. The Japanese Pharmacopoeia. 15th ed. English Version. 6.10: Dissolution test. Tokyo: Society of
Japanese Pharmacopoeia, 2010.
Kalantzi, L., Goumas, K., Kalioras, V., Abrahamsson, B., Dressman, JB., Reppas, C.
"Characterization of the Human Upper Gastrointestinal Contents Under Conditions Simulating
Bioavailability/Bioequivalence Studies". Pharmaceutical Research. 2006. 23; 165-176.
Klein, S. "The use of biorelevant dissolution media to forecast the in vivo performance of a drug."
Aaps J . 2010.12(3): 397-406.
Kloefer, B., Van Hoogevest, P., Moloney, R., Kuentz, M., Leigh, M., Dressman, JB. “Study of a
Standardized Taurocholate-Lecithin Powder for Preparing the Biorelevant Media FeSSIF and FaSSIF.
Dissolution Technologies. 2010. Volume 17 Issue 3.
Lipka, E. and Amidon, G. L. "Setting bioequivalence requirements for drug development based on
preclinical data: optimizing oral drug delivery systems".Journal of Controlled Release.1999. 62, 41-49.
Löbenberg, R. et al., "Dissolution Testing as a Prognostic Tool for Oral Drug Absorption: Dissolution
Behavior of Glibenclamide," Pharm. Res.2000. 17 (4), 439–444
Loo, JC., Riegelman, S. “New methods for calculating the intrinsic absorption rate of drugs” J. Pharm.
Sci 1968; 57(6): 918-924.

Page 53 of 201
Lue, BM., Nielsen, F. S., Magnussen, T., Schou H. M., Kristensen, K., Jacobsen, L., and Mullertz, A..
"Using biorelevant dissolution to obtain IVIVC of solid dosage forms containing
Malaterre, V., Metz, H., et al. "Benchtop-magnetic resonance imaging (BT-MRI) characterization of
push-pull osmotic controlled release systems." J Control Release. 2009. 133(1): 31-6.
Meyer, M.C., Straughn, A.B., Jarvi, E.J., Wood, G.C., Pelsor, F.R., Shah, V.P. The bioinequivalence
of carbamazepine tablets with a history of clinical failures, Pharmaceutical Research. 1992, 9, 1612–
1616.
Naylor, L., Bakatselou, V., Rodriguez-Hornedo, N., Weiner, N., Dressamn, JB. "Dissolution of
steroids in bile salt solutions is modified by the presence of lecithin". Eur. J. Pharm. Biopharm., 1995.
41; 346-353.
Noyes, A.A., Whitney, W.R. "The rate of solution of solid substances in their own solutions". J. Am.
Chem. Soc. 1897. 19, 930–934.
Parrott, N., Lukacova, V., Fraczkiewicz, G., Bolger, MB. “Predicting pharmacokinetics of drugs using
physiologically based modeling-application to food effects”. AAPS Journal, 2009; 11; 45-53.
Peltonen, L., Liljeroth, P., Heikkilä, T., Kontturi, K. & Hirvonen, J. "A novel channel flow method in
determination of solubility properties and dissolution profiles of theophylline tablets". Journal of Drug
Delivery Science and Technology.2004. 14, 389-394
Persson, A. M. et al. "Design and Characterization of a New Miniaturized Rotating Disk Equipment
for In Vitro Dissolution Rate Studies". Journal of Pharmaceutical Sciences.2008. 97, 3344-3355
Persson, A. M. et al. "The Effects of Food on the Dissolution of Poorly Soluble Drugs in Human and
in Model Small Intestinal Fluids". Pharmaceutical Research.2005. 22, 2141-2151
Pillay, V. and Fassihi, R. "Evaluation and comparison of dissolution data derived from different
modified release dosage forms: an alternative method." J Control Release 1998. 55(1): 45-55
PK-Sim(R). Available at http://www.systems-biology.com/products/pk-sim.html. Accessed 2010
August 6.
Polli, J. E. "In vitro- in vivo relationships of several immediate release tablets containing a low
permeability drug". Adv. Exp. Med. Biol.1997. 423: 191-198 46.

Page 54 of 201
Polli, J.E. and. Ginski, M.J. “Human drug absorption kinetics and comparison to Caco-2 monolayer
permeabilities,”.Pharm. Res. 1998. 15, 47-52
Polli, J.E., Rekhi, G.S., Augsburger, L.L., Shah, V.P. “Methods to compare dissolution profiles and a
rationale for wide dissolution specifications for metoprolol tartrate tablets”. J. Pharm. Sci. 1997. 86,
690-700.
Rimpiläinena, V. et al. "Electrical impedance tomography for three-dimensional drug release
monitoring". European Journal of Pharmaceutical Sciences Article in Press, Available online 09
August 2010. http://www.sciencedirect.com/science/journal/09280987
Seki, T., Mochida, J., Okamoto, M., Hosoya, O., Juni, K., Morimoto, K. “Measurementof diffusion
coefficients of parabens and steroids in water and 1-octanol”.Chemical & Pharmaceutical Bulletin,
2003; 51; 734-736.
Shah, PV., Noory, A., Noory, C., McCullough, B., Clarke, S., Everett, R. et al . "In Vitro dissolution
of sparingly water-soluble drug dosage forms". Int J Pharm 1995;125:99-106
Shah, VP., Tymes, NW., Skelly, JP." In vitro release profile of clo-nidine transdermal therapeutic
systems and scopolamine patches". Pharm Res. 1989 ;6:346-351.
Shah, A. C. and Nelson, K. G. "Evaluation of a convective diffusion drug dissolution rate model.
Journal of Pharmaceutical Sciences".1975. 64, 1518-1520
Simcyp(R). Available at http://www.simcyp.com/. Accessed 2010 August 6.
Souliman, S.; Beyssac, E.; Cardot, JM.; Denis, S.; Alric, M. “Investigation of the biopharmaceutical
behaviour of theophylline hydrophilic matrix tablets using USP methods and an artificial digestive
system”. DDIP. 2007.33(4),475-483.
Souliman, S.; Blanquet, S.; Beysac, E.; Cardot, J.-M. A level A in vitro/in vivo correlation in fasted
and fed states using different methods: Applied to solid immediate release oral dosage from. Eur. J.
Pharm. Sci. 2006, 27 (1), 72–79.
Spagnoli, S. and Di Maso, M. "A Comparison of USP Paddle With Crescent-Shaped Spindle
Dissolution Profiles” Dissolution Technol. 2006. 13:20–25
STELLA(R). Available at http://www.iseesystems.com/. Accessed 2010 August 6.

Page 55 of 201
Sun, W., Larive, CK., Southard, MZ. "A mechanistic study of danazol dissolution in ionic surfactant
solutions". Journal of Pharmaceutical Sciences. 2003; 92; 424- 435.
Sunesen, V. H., B. L. Pedersen, et al. "In vivo in vitro correlations for a poorly soluble drug, danazol,
using the flow-through dissolution method with biorelevant dissolution media." Eur J Pharm Sci .
2005. 24(4): 305-13.
Takano, R. et al. "Oral Absorption of Poorly Water-Soluble Drugs: Computer Simulation of Fraction
Absorbed in Humans from a Miniscale Dissolution Test". Pharmaceutical Research.2006. 23, 1144-
1156
TNO. Available at http://www.tno.nl. Accessed 2010 August 6.
Underwood, T., Cadwallader, D. “Automated Potentiometric Procedure for Studying Dissolution
Kinetics of Acidic Drug under sink Conditions”.. Journal of Pharmaceutical Sciences 1978, 67, 1163-
67.
United States Pharmacopeia. in U.S. General Chapter <1088> in The United States Pharmacopeia
2009 (USP 32).Convention, Inc., Rockville, MD
United States Pharmacopeia. in U.S. General Chapters <711> Dissolution and <724> Drug Release in
The United States Pharmacopeia 2009 (USP 32). Convention, Inc., Rockville, MD
United States Pharmacopeia. in U.S. Pharmacopeia National Formulary 32, 2009,Chapter 1087
United States Pharmacopeia. in U.S. Pharmacopeia National Formulary 32, 2009,Chapter 711
United States Pharmacopeia. in U.S. Pharmacopeia. Dissolution Performance Verification Testing
(PVT). http://www.usp.org/pdf/EN/dissolutionProcedureToolkit2010-03.pdf Accessed 2010 October 6
USP 32. The United States Pharmacopeial Convention, Inc., Rockville, MD
Vatier, J.; Celice-Pingaud, C.; Farinotti, R. “A computerized artificial stomach model to assess sodium
alginate-induced pH gradient”. Int. J. Pharm. 1998, 163 (1-2), 225–229.
Vippagunta, S.R., Brittain, H.G. and Grant, D.J. "Crystalline solids. Advanced Drug Delivery
Reviews". 2001, 48, 3–26.
Vishvajit, A., Kamble D., Jagdale M. and Vilasrao. “Self micro emulsifying drug delivery system”.

Page 56 of 201
International Journal of Pharma and Bio Sciences. 2010. V1(2)
Wagner, J.G., Nelson, E., “Percent absorbed time plots derived from blood level and/or urinary
excretion data”. J. Pharm. Sci. 1963. 52 610–611
Wei, H. et al., "Physiochemical Characterization of Five Glyburide Powders: A BCS Based Approach
to Predict Oral Absorption," Eur. J. Pharm. Sci. 2008
Wood, J. H., Syarto, J. E. and Letterman, H. "Improved Holder for Intrinsic Dissolution Rate Studies".
Journal of Pharmaceutical Sciences.1965. 54, 1068
Wu, C-Y., Benet, LZ. "Predicting Drug Disposition via Application of BCS: Transport/Absorption/
Elimination Interplay and Development of a Biopharmaceutics Drug Disposition Classification
System". Pharmaceutical Research, 2005; 22; 11-23
Yu L.X., Amidon.G.L, Polli J.E., Zhao H., Metha M.U., Conner D.P., Shah V.P., Lesko L.J., Chen
M.-L., Lee V.H.L., and Hussain A.S. "Biopharmaceutics Classification system: the scientific basis for
biowaiver extensions". Pharm Res. 2002. 19:921-923.
Zeitler, J. A. and L. F. Gladden. "In-vitro tomography and non-destructive imaging at depth of
pharmaceutical solid dosage forms." Eur J Pharm Biopharm .2009. 71(1): 2-22.
Zhu, H., Zhou, H. & Seitz, K. "Bioavailability and Bioequivalence. Developing Solid Oral Dosage
Forms". Pharmaceutical Theory & Practice, 2009. Chapter 15
Zoeller, T., Klein, S. “Simplified biorelevant media for screening dissolution performance of poorly
soluble drugs”. Dissolution Technologies. 2007. 14 (4): 8-13

Page 57 of 201
3. Experimental

Page 58 of 201
Introduction Experimental
Dissolution is a holistic test and reflects on properties of the formulation and API.
The strategy for design of the dissolution testing may vary depending on its utility and the phase of
drug development up to a final method for QC. The utility may be to understand the mechanism of
drug release for a formulation and its manufacturing processes (API or DP) or to identify any
opportunity for an IVIVR/IVIVC or to perform quality control (QC) for process and product
consistency. As well dissolution can be used to address biopharmaceutical effect issues for oral
formulations like precipitation, which may reduce drug concentration for immediate action, leading
to delayed or reduced efficacy (Wei-Guo 2010). In some cases, the method used in the early phase
of a product’s formulation development might be different from the final test procedure utilized for
batch-to-batch control of the product. Therefore, with the accumulation of both in vivo and in vitro
experience during a product’s development cycle, the early phase method should be critically re-
evaluated and potentially simplified. During these phases, however, every attempt must be made to
lay a foundation for QbD principles, IVIVC, and IVIVR. The BCS classification of the drug should
be established and serve as a guide for the selection of an appropriate dissolution test or surrogate
test(s). Ideally, the final QC test should monitor the batch-to-batch consistency of the product and,
whenever possible, monitor the key biopharmaceutical parameters or Critical Quality Attribute
(CQA) of the formulation. Examples of this approach are presented in this thesis.
The experimental parts of this thesis is presented in forms of a succession of papers, drawing a line
thought the different development phases from API selection up to post marketed drug products
monitoring and generics. Different aspects of role and importance of dissolution with regard of
development of method, discrimination, biorelevance, IVIVC/R in animals and in human as well as
QbD and biowaiver for IR and ER formulations are highlighted and commented. The work is
structured in fours parts and presented in paper form. Supplements works which were performed
later on in the scope of this thesis are integrated as supplement papers.

Page 59 of 201
In a first part the role of the dissolution in the selection of the key parameters for API and
formulation are presented. This method was then extrapolated to the use of dissolution to optimize
API characteristics leading to early control on product quality via dissolution.
This work is presented as paper 1 entitled.
“Selection of optimal API properties using in vitro dissolution, animal study and IVIVR to
derisk Human study during development.”
This paper was not yet submitted and is presented blinded due to some IP confidentialities
currently on going.
In a second part the use of dissolution and various media in order to predict in vivo behavior of
new ER formulations is presented. This work is presented as paper 2 entitled.
“Selection of the Most Suitable Dissolution Method for an Extended Release Formulation
based on IVIVC level A obtained on Cynomolgus Monkey”
This paper has been published in Drug Development and Industrial Pharmacy (DDIP) in
November 2010, Vol. 36, No. 11 , Pages 1320-1329
The promising tablets were evaluated on healthy volunteers as PoC. The results are briefly listed
and commented in the first supplement (paper 2 Supplement 1) entitled: “Confirmation of IVIVC
in human”. In addition and to support a better process understanding the development of an
imaging technology associated with the dissolution was investigated. The experiments are
presented in the second supplement (paper 2 supplement 2) entitled: “Understanding of the
release mechanism using imaging technology“.
In a third part the possible use of dissolution in early development phase using non compendia
methods have been investigated. The use of small volume vessel and small paddle in place of
compendia system is commented using different kind of drug product.
This work is presented as paper 3 entitled.
“Small Volume Dissolution Testing as Powerful Method during Pharmaceutical
Development”
This paper has been published in Pharmaceutics in November 2010, Vol. 2, Pages 351-363.
Further investigation using the small vessel and the basket method are briefly presented in the first
supplement (paper 3 supplement 1) entitled “Small Volume Dissolution Testing using Basket
method”. On other example of applying small vessel non compendial method is highlighted in the
supplement (paper 3 supplement 2) entitled “Tenoxicam-Methylparaben Cocrystal Formation
in Aqueous Suspension Formulation “, where already in early development during the pre
formulation, dissolution can support the cocrystall screening program. This work was presented in
the AAPS Annual Meeting 2009, poster W4326.

Page 60 of 201
In the fourth part of this thesis, the usage of dissolution to monitor the quality of generic drugs of a
Roche product is described with proposal of a simple method that could help to discriminate
formulations that might not exhibit similar BE parameters in comparison to the innovator. This
work is presented as paper 4 entitled.
“Mycophenolate mofetil: use of simple dissolution technique to assess difference between
innovator and generic formulations”
This paper is currently in review process for publication in the journal : Dissolution Technologies.
The data are also well abstracted in a poster entitled “In vitro dissolution of mycophenolate
mofetil: comparison between innovator and generic formulations “which was presented twice.
At BPS Winter meeting 2008, Abstract 0225 and at the ACCP/ESCP International Congress 2009,
Presentation 114E.
In conclusion of these investigations, important differences exist between the different generic
formulations with regard to in vitro performance. In a next step, an exploratory clinical testing was
set up to evaluate the pharmacokinetics of different generics that showed the more pronounced
difference. The data are presented as a supplement (paper 4 Supplement 1) entitled “Confirmation
of the hypothesis in human “
All the studies and the importance of having a strong discriminating dissolution methods, IVIVC/R
and QbD as well as the general need of having a strategy for brand protection for all drugs already
in the early development is discussed shortly in the conclusion .
The experimental parts included in this thesis were carried out at the Pharmaceuticals Division of
Galenical and Analytical Development at Hoffmann La Roche Ltd, Basel, Switzerland.

Page 61 of 201
3.1. Experimental part 1
In the first part of these experiments, the role of dissolution in the selection of the key parameters
for formulation and process is stressed. IVIVC/R method was implemented to identify API
characteristics leading to early control of final product quality using dissolution. The pertinence of
the difference observed in vitro was challenged in vivo by screening on monkey and by
confirmation with human study. The role of dissolution as a supra indicator respectively global
quality tool during development is highlighted and discussed.
This work is presented here as a paper (paper 1) entitled.
“Selection of optimal API properties using in vitro dissolution, animal study and IVIVR to
derisk Human study during development.”
The NCE investigated was at this time in development phase II and is currently in phase III. Due to
some Intellectual Properties (IP) limitations at Hoffmann-La Roche Ltd, the paper was not
submitted. It is presented, blinded, in the frame of this thesis in order to discuss the impact of a
strong method development design and highlight the role of two dissolution methods applied in
early phase on API and DP as tool of QbD.

Page 62 of 201
Original Article
Selection of optimal API properties using in vitro dissolution, animal
study and IVIVR to derisk human study during development.
Emmanuel Scheubel a *, Valerie Hoffartb and Jean Michel Cardot b a F. Hoffman-La Roche Ltd, Pharmaceutical Division, Galenical & Analytical Development. CH-
4070, Basel, Switzerland.
b Univ.Clermont 1, Biopharmaceutical Department,UFR Pharmacie, 28 Place Henri Dunant, B.P.
38,F-630001 Clermont-Ferrand, France
* Corresponding author: e-mail: [email protected]
Key words: API, IVIVC, IVIVR, dissolution, biorelevant specification, particle size, PAT, QbD

Page 63 of 201
Introduction During the development of new medicines and drug dosage forms the main concerns of the
pharmaceutical company is to develop the optimal drug product: therapeutic effect, safety, easy
manufacturing, stability and low cost. This development starts from the selection of the most
appropriate Active Pharmaceutical Ingredient (API) up to the production of a robust formulation.
All the development steps have one goal: to develop an adequate and reproducible dosage form
able to guarantee the desired in vivo performance. For a given permeability, the absorption of the
substance within the blood flow is governed either by the solubility of the API itself and/or the
release of the API from the drug dosage form1. For Immediate Release formulation (IR) of oral
solid dosage form which by definition exhibited a fast disintegration and thus a fast drug release,
the limiting step is the solubilisation of the API. This solubilisation depends mainly on API
solubility and dissolution rate. Thus, the solubilisation speed is influenced by intrinsic properties of
API solid state such as particle size, crystal shape, and polymorphism. Consequently, any
phenomenon able to modify these parameters may have an influence on the API solubilisation and
eventually the in vivo behavior of the medicine and should be studied.
Time is an important factor during the drug development and all the possibilities to shorter
development time in the respect of the overall safety and quality of the product is a key factor. One
tool that is classically used in this race against the clock is In Vitro in Vivo Correlations (IVIVC) or
In Vitro in Vivo Relationship (IVIVR)2. IVIVC/R is a tool to predict in vivo results based on in
vitro data that (i) allows to optimize dosage forms with the fewest possible trials in animal or man
(ii) fix dissolution acceptance criteria and (iii) can be used as a surrogate for further bioequivalence
studies while being a recommendation from regulatory authorities3456. In front of development of
the IR formulation, IVIVC could be used to select the API form and to evaluate impact of API
modification and then to robust the final IR formulation.
This article focuses on a new approach using IVIVC/R to select key factors of API that govern
final quality of the IR formulation. A low soluble high permeable drug (class II according to the
biopharmaceutical Classification System (BCS7)) was used as a model. This drug was formulated
into classical IR tablet. In order to early identify factors affecting the performance several
investigations were performed: (i) in vitro performance to preselect API form for animal studies,
(ii) animal studies to decrease the risks linked with human administration (iii) human in vivo study.
All the data were further analyzed to identify relevant API parameters and to design space to find
the optimal API physiochemical characteristics.

Page 64 of 201
Material and Method
All used chemical were of pharmacopeia or gradient grade quality.
API and formulation
The API is a BCS class II drug exhibiting very low solubility in water. The more relevant
parameters influencing its solubilisation were investigated among particle size distribution, specific
surface and polymorphism. Four different batches of API , called API A, B, C, D were prepared in
order to find the relevant parameters which could insure an optimal exposure for the subjects
(Table 1). Batches A, B and C were solely composed of the polymorphic form I. Depending on the
desired particle size distribution (PSD), different technologies were used for these tree batches:
respectively jet milling, hammer milling and crystallisation. Batch D was composed of 75% of
polymorphic form I and 25% of form II. This batch was prepared to evaluate the impact of both
polymorph forms with similar PSD. An amount of 25% form II was chosen in order to potentially
see an impact on the performance in vivo, assuming some variation of the response, and if it is the
case to be in a position to detect it properly. Both polymorph forms having similar solubility and
intrinsic dissolution (data not shown).
The PSD was evaluated by laser diffraction using a Sympatec Helos©
The specific surface (BET) was measured using a Micromeritics Tristar©.
Table 1 : Characteristics of the four API batches
API API A
(reference) API B API C API D
Main technology Jet Milled Hammer milled Crystallization Jet Milled
Polymorphic form Form I Form I Form I Form I 75% Form II 25%
D 10% [µm] 1.1 3.7 15 1.4 1.1
D 50% [µm] 3.7 27.0 84.3 5.4 3.9
D 90% [µm] 12.2 109.0 177.9 21.2 13.2
BET [m2/g] 3.2 0.7 0.25 1.8 2.6 BET : specific surface
D particle size to limit the particle size distribution at various percentages
These four API batches were formulated into tablets (called tablets A, B, C, D respectively) by wet
granulation using the same composition and process parameters. The four tablets exhibited the
same physicochemical properties (e.g.: similar hardness, disintegration, data not presented). The
same tablets were used for in vitro studies, animal and human in vivo studies The formulations
used in these studies were produced with respect to the current Good Manufacturing Process
(cGMP) rules.

Page 65 of 201
Dissolution Studies
Dissolution profiles of the 4 different batches of pure API were performed using an USP4
apparatus (Sotax CE70, Allschwill, CH) equipped with 12 mm cells. The dissolution media was
HCl 0.1N containing 0.2% (m/v) sodium dodecyl sulphate (SDS) at a flow rate set at 20 mL per
minute in an open modus.. These conditions provide sink condition and acceptable stability during
the dissolution testing. Samples were withdrawn at predefined time intervals up to 90 min and were
directly filtered using glass fiber filter The amount of drug solubilised at each time point was
determined by a validated HPLC-UV method. All experiments were performed in triplicate.
Tablet dissolution profiles were investigated in 1000 mL of the same buffer in an USP2 apparatus
(Sotax AT7smart, Allschwill, CH) with rotation speed set at 50 rpm and temperature at 37 ± 0.5°C.
Samples were withdrawn at predefined time intervals up to 60 min followed by an infinity testing
(15 min at 200 rpm) and were directly filtered. The amount of drug released at each time point was
measured by the same validated HPLC-UV method. All experiments were performed with six
units.
In vivo bioavailability assessment
Animal studies
A single dose four ways cross over pharmacokinetics (PK) study was performed on 4 Cynomongus
monkey. Due to animal’s ethical limitations, only limited number of blood samples could be
withdrawn and a particular attention was given to the early time points. After oral administration of
the tablets (tablet A, B, C or D), the samples were collected at predefined time intervals (0, 0.5, 1,
2, 3, 4, 7, 24, 32 h) and measured by a validated HPLC-UV method. Classical bioavailability
parameters were calculated: maximum observed concentration and time to obtain it (Cmax and
Tmax) and amount absorbed (AUC).
Human studies
Two selected tablets (tablet A and B) were then further tested in 22 healthy volunteers in fasting
conditions in a two way cross over. The blood samples were collected at predefined time intervals
from 0 to 24 h and measured by a validated HPLC-UV method.
IVIVC/R
Various approaches of relationship between in vitro and in vivo data based either on values
(IVIVC) or rank (IVIVR), were tried on the main bioavailability parameters (Cmax and AUC).

Page 66 of 201
Results and Discussion
In vitro results
The dissolution profiles of the different API batches are presented in figure 1.
USP4 Profiles
0
10
20
30
40
50
60
70
80
90
100
0 15 30 45 60 75 90
time (min)
% d
isso
lved
API A API B API C API D
Figure 1: In vitro dissolution of the four API batches using USP4 (n=3, mean values ± SD)
0
20
40
60
80
100
0 10 20 30 40 50 60 70
time (min)
% d
isso
lved
tablet C tablet D tablet A tablet B
Figure 2: In vitro dissolution of the four tablets using USP2 at 50 rpm (n=6, mean values ± SD)

Page 67 of 201
The API A and D exhibited similar and fast dissolution profiles with more than 80% of the drug
being in solution within 15 min, whereas forms C and B clearly showed slower dissolution (68%
and 45% dissolved within 90 min respectively).
The release profiles of the different tablets containing various API forms are presented in figure 2.
Tablets A and D exhibited similar immediate release dissolution profiles with more than 90%
released in less than 30 min, whereas tablets C and B showed slower dissolution profiles. The
variability remain relatively high (>10%) after 30 minutes for the tablet A, B and D. However
difference in performance can clearly be distinguished between tablets. All samples reached
maximum dissolution after infinity testing.
The differences in performance observed for the four tested variants with both methods (USP2 and
USP4) are therefore clearly in relation with the solid state properties of the API and less with the
formulation. The profiles showed clearly performances in relation with the solid state properties of
the API.
In vivo results
The mean monkey in vivo pharmacokinetic parameters are presented in Table 2, the plasma time-
concentration are presented in figure 3.
Table 2: Mean Pharmacokinetic parameters observed for the four type of tablets in monkeys (n=4,
mean value).
Tablet type A B C D Cmax [ng/mL] 420.0 249.0 153.3 400.0
Cmax/Dose [ng/mL]/mg 108.1 67.8 41.6 108.5
Tmax [h] 5.0 4.5 5.5 5.0
AUCinf [ng.h/mL] 6936.8 5515.3 3061.7 7105.0
AUCinf/Dose [ng.h/mL]/mg 1781.9 1481.6 833.5 1933.0

Page 68 of 201
0
50
100
150
200
250
300
350
400
450
500
0 4 8 12 16 20 24 28 32time (h)
Plas
mat
ic d
rug
Con
cent
ratio
n (n
g/m
l) Tablet A Tablet B
Tablet C Tablet D
Figure 3: Mean in vivo plasma time-concentration data observed in Monkey after oral
administration of different tablet type (n=4, mean values ± SD).
After oral administration in monkeys, tablets A and D provided AUC and Cmax not significantly
different, respectively 6.9 vs. 7.1 mg.h/mL and 420 vs. 400 ng/mL. In comparison, tablets B and C
exhibited smaller AUC and Cmax, respectively 5.5 and 3.1 mg.h/mL and 249 and 153 ng/mL. The
four Tmax are comparable.
Based on these monkey’s results, the formulations A and B were selected for human studies.
Formulation D was discarded as a combination of polymorph which did not impact
bioperformance in comparison to A. Tablet C was discarded as being the slowest performer.
The human data are presented in Table 3 and Figure 4.
Table 3: Mean pharmacokinetic parameters observed for tablet A and B in human (n=22, mean
values, % Coefficient of Variation (CV) shown in bracket)
Tablet type A B Cmax (CV%) [ng/mL] 165 (26.6) 102 (21.7) Cmax/Dose (CV%) [ng/mL] 5.49 (26.6) 3.39 (21.7) Tmax (min-max) [h] 3 (1-7) 3 (1-7) AUCinf (CV%) [ng.h/mL] 6940 (26.3) 5430 (30.7) AUCinf/Dose (CV%) [ng.h/mL] 231 (26.3) 181 (30.7)

Page 69 of 201
0
1
2
3
4
5
6
0 4 8 12 16 20 24
time (h)
Plas
mat
ique
dru
g co
ncen
trat
ion
(ng/
ml)
Tablet A
Tablet B
Figure 4: in vivo plasma time-concentration data observed in human n=22, mean values)
The pharmacokinetic studies performed in human using tablet A as reference gave the following
results: ratio of 78% and 90% CI of [72, 80] for AUC/Dose and ratio of 62% and 90% CI of [57,
67] for Cmax/Dose.
The same performance ranking was found in monkey and human for the formulation A and B
containing fine and coarse API. The results confirmed the importance of controlling the drug
substance particle size distribution.
In vivo in vitro correlation
Level C was attempted between Cmax and AUC obtained in monkeys and percent of the dose
dissolved in vitro at various times. The results are presented in figures 5 and 6 and Table 4.
40
60
80
100
120
20 30 40 50 60 70 80 90 100 110
% dissolved in vitro
Cm
ax/D
(ng/
ml)/
mg
5 min 10 min
15 min 20 min
30 min

Page 70 of 201
Figure 5: IVIVC observed between percent of the dose dissolved in vitro at 5, 10, 15, 20 and 30
min and Cmax obtained in monkeys.
800
1000
1200
1400
1600
1800
2000
20 30 40 50 60 70 80 90 100 110
% dissolved in vitro
AUC
/D (n
g.h/
ml)/
mg
5 min 10 min
15 min 20 min
30 min
Figure 6: IVIVC observed between percent of the dose dissolved in vitro at 5, 10, 15, 20 and 30
min. and AUC obtained in monkeys.
Table 4: R2 observed between the main PK parameters obtained in monkeys and the in vitro
dissolution. R2
PK parameters units T= 5 T = 10 T = 15 T = 20 T = 30
Cmax/Dose [ng/mL]/mg 0.991 0.998 1.000 1.000 1.000
AUCinf/Dose [ng.hr/mL]/mg 0.990 0.972 0.967 0.965 0.963
The coefficients of correlation (R2) lie above 0.9 at all sampling times for both PK parameters. A
strong relationship was found for the two bioequivalence parameters, Cmax and AUC, and all
dissolution time.
Based on this first relationships the main properties of the API (PSD, BET) and the PK parameters
(divided by dose in order to be transposable easily in human) was studied and results are presented
in figure 8 and table 5

Page 71 of 201
0
50
100
150
200
30 40 50 60 70 80 90 100 110
Cmax/D (ng/ml)/mg
AP
I PS
D µ
m
D 0.1 D 0.5
D 0.9 BET
0
50
100
150
200
800 1000 1200 1400 1600 1800 2000
AUC/D (ng.h/ml)/mg
AP
I PS
D µ
m
D 0.1 D 0.5
D 0.9 BET
Figure 8: IVIVR observed between percent of the Cmax (8a) and AUC (8b) and API
characteristics in monkey.
Table 5: R2 observed between the main PK parameters and the API parameters. R2
D (0.1) [µm] D (0.5) [µm] D (0.9) [µm] BET [m2/g]
Cmax/Dose [ng/mL]/mg -0.902 -0.943 -0.998 0.884
Tmax [hr] 0.702 0.621 0.358 -0.140
AUCinf/Dose [ng.hr/mL]/mg -0.970 -0.985 -0.963 0.759
The R2 lie above 0.9 for the PSD associate with Cmax and AUC, whereas lower R2 are observed
for BET. Tmax does not correlate well.
Despite of known difference in transit time and pH, monkey are suitable model for comparison and
Proof of Model (PoM) as an understanding of drug and formulation properties8. In our case, the
drug was tested in animal first to select the API properties to assess reasonable performance before
administration in human. In addition the results in monkeys indicated an IVIVC of level C between

Page 72 of 201
the main bioequivalence parameters (AUC and Cmax) and the in vitro dissolution parameters. The
results of the IVIVR stressed that D0.5 and D0.9 were overall the main parameters that governed
the Cmax and AUC.
As the main parameters for this IR formulation are clearly linked with the API properties, the
results obtained in monkeys could be extrapolated to human as the galenical formulation and
transit time did not play the major role in this case. That is confirmed by rank and ratio observed
between monkey and human which were similar. The ratios of formulation B vs. A were of 62%
and 83% for Cmax/D and AUC/D respectively in monkey and of 62% and 78% respectively in
human.
In connection with the observed IVIVR and IVIVC (Table 4 and 5) a specification on PSD can be
proposed. Based on the results on the human PK study, the parameters used in the calculation of
the 90% Confidence Interval (CI) were extracted such as residual variance, degree of freedom for
tabulated t and number of subject. The higher and lower dissolution specifications that lead to
bioequivalence with API form A were calculated for each PK parameters (Cmax and AUC). This
can be done using the 90% CI equation as described in equations 1 and 2, adapted from the concept
described by Cutler et al9 .
Equation 1 Lower Limit: ( )
⎥⎥
⎦
⎤
⎢⎢
⎣
⎡ ×−−
= n
rreftest
stmLnmLn
eLL21 )()(
Equation 2 Upper Limit: ( )
⎥⎥
⎦
⎤
⎢⎢
⎣
⎡ ×+−
= n
rreftest
stmLnmLn
eUL22 )()(
From those equations, the two “test” means corresponding to the lower (LL) and upper limit (UL)
of the 90% CI could be extracted and lead to equations 3 for the lower limit and 4 for the higher
limit.
Equation 3: 1
)()(2
test
mLnst
LLLn
meref
n
r
=⎥⎥
⎦
⎤
⎢⎢
⎣
⎡+
×+
Equation 4: 2
)()(2
test
mLnst
ULLn
meref
n
r
=⎥⎥
⎦
⎤
⎢⎢
⎣
⎡+
×−
For BE estimation, lower and upper limits could be set to 80% and 125%.
The results of the human PK study led to ratio of 62% and 90%CI of [57, 67] for Cmax and ratio of
78 % and 90%CI of [72, 80] for AUC. Based on this study, the limits to have equivalence between
formulations A and B were back calculated. The formulation A was selected as reference, using

Page 73 of 201
equation 3 and 4. The calculations were based on the hypothesis (i) to be bioequivalent (BE) to
formulation A and (ii) to include 1 in the 90% CI. Assuming principle (i) the results were, for the
lower BE limit [0.80-], an API range of 2µm, 13µm, and 40µm for d0.1, d0.5, and d0.9
respectively. For the higher BE limit [-1.25] the API would result in nano range. Based on the
hypothesis (ii), the specification for API were of d0.5< 8µm and d0.9 < 25µm that would result in
a BE ratio of 96 and 90% CI of [92-101] for AUC/D and 93% and 90% CI of [92-100] for
Cmax/D. Those findings are stricter than the API form B PSD and the calculated limits can then be
reached only using the jet milling and not the hammer milling technology.
Based on this range, the dissolution specification, set at a single time point, was back calculated.
The dissolution limits, which can insure bioequivalence, were calculated to be greater than 80% at
30 minutes.
The technique of dissolution limit settings on the final formulation could also be applied to the raw
material, API, allowing accepting or rejecting the batches before any further formulation and
manufacturing steps or by derisking the scale up of API batches. The impact of further
manufacturing steps on the dissolution would have to be checked before setting dissolution limits
on API. As a target, based on figure 1, a specification at 80% dissolved after 90 minutes for the
API should ensure, if the tablets performance are as well within specification, to fullfill the BE
criteria. This dissolution held on API could be considered as an in process control (IPC) at entry of
the raw material within the production line and can be assimilated to a control close to a process
analytical technology (PAT) method as this simple and unique control (in addition to identification
and purity) could discriminate the overall qualities of the active substance to comply with the
characteristics of the final product.
The dissolution method applied on the API allows monitoring the performance based on the PSD.
API with similar PSD should result in similar profiles. If differences are observed, for instance
after scale up, process optimisation or change in final step (e.g. drying, milling), other properties
should be checked (e.g. BET, wetability, bulk density) before manufacturing of the tablets and
further in vivo testing. As well if a low dissolution of a new tablet batch is observed, the
successfully previous control of the dissolution rate of the API will rather indicate an issue during
manufacturing of the tablets.
IVIVR can also be used, in contrast to IVIVC, to identify the key parameters of the formulation,
process or API in which the release is not the limiting factor. Therefore before further in vivo test,
the dissolution performance can serve as monitoring tools to identify the most suitable API
batches. Those relations are a first step to implement Quality by Design (QbD) and design space by
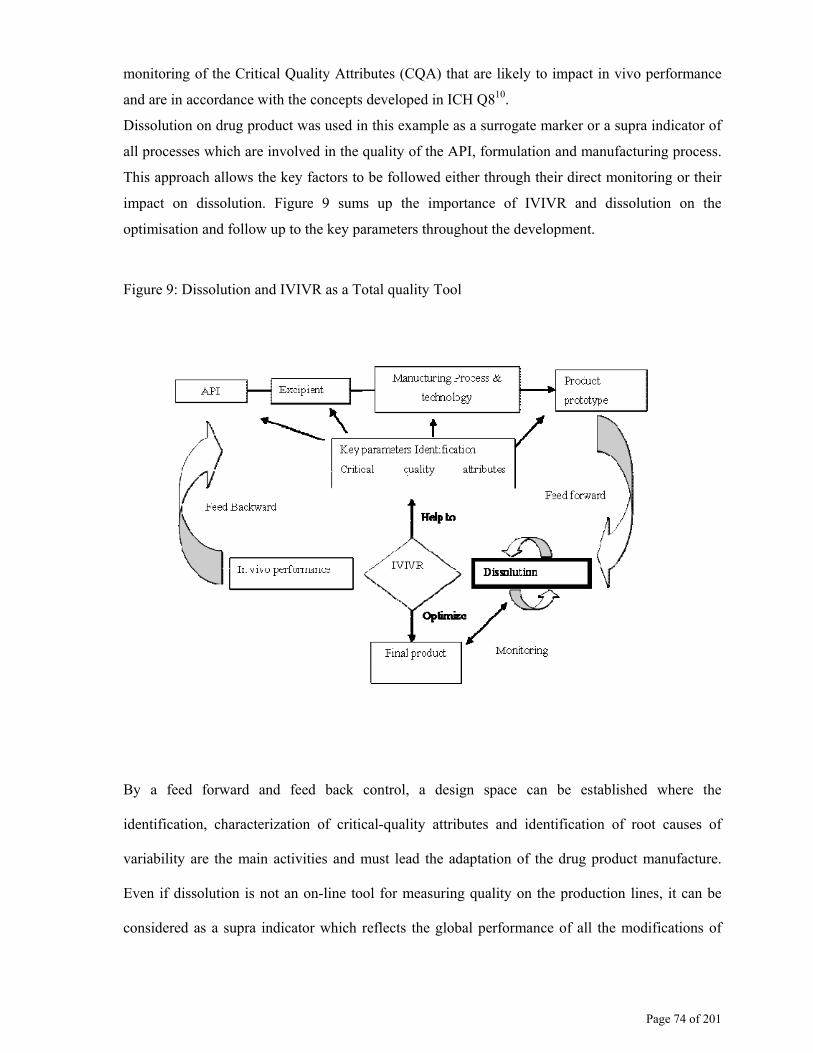
Page 74 of 201
monitoring of the Critical Quality Attributes (CQA) that are likely to impact in vivo performance
and are in accordance with the concepts developed in ICH Q810.
Dissolution on drug product was used in this example as a surrogate marker or a supra indicator of
all processes which are involved in the quality of the API, formulation and manufacturing process.
This approach allows the key factors to be followed either through their direct monitoring or their
impact on dissolution. Figure 9 sums up the importance of IVIVR and dissolution on the
optimisation and follow up to the key parameters throughout the development.
Figure 9: Dissolution and IVIVR as a Total quality Tool
By a feed forward and feed back control, a design space can be established where the
identification, characterization of critical-quality attributes and identification of root causes of
variability are the main activities and must lead the adaptation of the drug product manufacture.
Even if dissolution is not an on-line tool for measuring quality on the production lines, it can be
considered as a supra indicator which reflects the global performance of all the modifications of

Page 75 of 201
either the API, the formulation or the manufacturing process and can then guarantee the overall
pharmaceutical quality of the final product by control of the critical quality attributes (CQAs)11.
In the current study dissolution, animal and then human data were a help to identify the PSD as the
CQA of the pure API. Equivalence needs to be established between batches to insure that
bioequivalence would only be linked with the manufacturing process of the final formulation and
not any more only to the initial quality of the API.
As the animals’ findings were confirmed afterward in human. The relevance of the confirmed
difference in human performance will allow (1) to choose the best solid state properties to meet the
maximum exposure (2) to select the most suitable milling technology and take into consideration
the optimal cost of good (CoG) if milling for instance is not necessary to reach maximum exposure
(3) to cross validate the monkey as suitable model for this compound (4) to set up the suitable in
vitro analytical method(s) to accurately measure the material in quality control (5) to set up
biorelevant specification.
Conclusion
Dissolution and IVIVR are explanatory tools which by identification of key parameter(s) that are
likely to influence the performance allow improving the know-how about API intermediate,
formulation and process but also development and then derisking in vivo human BA /BE studies
by a fine and accurate selection of the variants to be tested in vivo. It has to be kept in mind that
the attempt of IVIVR/C, allows sound rationale for API, drug product, dissolution description and
setting and supports further scale up and formulation optimization including a biowaiver approach.
IVIVC and most likely IVIVR are straightforward tools that can be used when we are in presence
API related issues, immediate release formulations and process related problems. It is a help to
establish QbD and to better understand the formulation.
Page 76 of 201
References
1 Amidon GL, Lennernas H, Shah VP, Crison JR. A theoretical basis for a Biopharmaceutics drug classification: the
correlation of in vitro drug product dissolution and in vivo bioavailability. Pharm Res, 1995;12, 413-420. 2 Cardot J-M., Beyssac E., In vitro/in vivo correlations: Encyclopedia of Pharmaceutical Technology, Ed. James
Swarbrick, James C. Boylan, 3rd ed, Informa healthcare; 2006, vol 1: p 1062-72 3 Guidance for Industry: Waiver of In vivo Bioavailability and Bioequivalence Studies for Immediate-Release Solid
Oral Dosage Forms Based on a Biopharmaceutics Classification System U.S. Department of Health and Human
Services Food and Drug Administration Center for Drug Evaluation and Research (CDER) August 2000 4Guidance for Industry Bioavailability and Bioequivalence Studies for Orally Administered Drug Products - General
Considerations U.S. Department of Health and Human Services Food and Drug Administration Center for Drug
Evaluation and Research (CDER) March 2003 5 Guidance for Industry Extended Release Oral Dosage Forms: Development, Evaluation, and Application of In
Vitro/In vivo Correlations U.S. Department of Health and Human Services Food and Drug Administration Center for
Drug Evaluation and Research (CDER) September 1997 6 Guidance for Industry Nonsterile Semisolid Dosage Forms Scale-Up and Postapproval Changes: Chemistry,
Manufacturing, and Controls; In vitro Release Testing and In vivo Bioequivalence Documentation U.S. Department of
Health and Human Services Food and Drug Administration Center for Drug Evaluation and Research (CDER) May
1997 7 Löbenberg R, Amidon GL. Modern bioavailability and biopharmaceutics classification system. New scientific
approaches to international regulatory standards. Eur J Pharm Biopharm, 2000;50, 3-12. 8 Masayuki, T. and a. all "Characterization of Gastrointestinal Drug absorption in Cynomolgus monkeys." Molecular
Pharmaceutics. 2008. 9 David J. Cutler, Eric Beyssac and Jean-Marc Aiache Level B and C in vivo/in vitro correlations: statistical
considerations International Journal of Pharmaceutics, Volume 158, Issue 2, 8 December 1997, Pages 185-193 10 ICH Harmonised Tripartite Guideline. International committee of harmonisation of technical requirements for
registration of pharmaceuticals for human use.Q8R2: Pharmaceutical Development revision 2, november 2009 11 Reed RA. A quality by design approach to dissolution based on the biopharmaceutical classification system. DIA Annual
Meeting, June 2005.

Page 77 of 201
Conclusion experimental 1.
This example demonstrated how early dissolution could drive the parameter setting on API
characteristics and on process optimization leading, as mentioned in PAT and QbD, in a
selection of more appropriate tests during the production. The application of an USP4 method
on API, in addition to the standard QC USP2 for the final tablets, allows to clearly follow the
process step by step and identifies at which level change potentially occurs. The USP4 method
is suitable also for intermediates as granulate of final blend. In our case the difference observed
on the API was the key drivers and the particle size is a clear CQA for this compound as the
drug product form did not impact the difference in performance. This difference being
biorelevant the approach set by testing first the hypothesis on monkey and after by confirming
on human allows defining a strong development strategy. The monkey being then a valid
animal model for the human performance. Moreover it places the dissolution applied on API as
a strong monitoring tools what will serves for derisking of further development step. This
approach is in line with QbD and allow by setting of biorelevant specification, to defined
control space and ultimately the overall control strategy.
The overall goal of either establishing an IVIVC/R or implementing QbD is to have a better
control of the product performance within the life cycle of a product. Biowaivers are currently
only granted for BCS 1 drugs in US (and additionally for BCS 3 under specific circumstances
in EU) to establish bioequivalence and if a Level A IVIVC was established. For all other cases
SUPAC applies for formulation changes. The current guidelines allow minor changes without
the requirement to prove bioequivalence clinically. However, using dissolution and QbD there
is no scientifically justification not to grant biowaivers for formulation changes if the
parameters in the design space are properly defined and monitored. Reliance on end product
quality testing alone doesn't assure enough quality. This can be in particular helpful in case of
scale up or modification of strength, change which anyhow occur during the development
phase.

Page 78 of 201
3.2. Experimental part 2
A further example of the implementation of dissolution as surrogate for performance of tablets
is presented on the paper 2. The use of dissolution and various media in order to predict in vivo
behavior of MR formulations is discussed.
After in vitro screening, formulations were tested in monkey in order to assess the absence of
risks in human. IVIVC was assessed and the parameters which are likely to impact the
performance were identified and discussed.
The data are presented as a paper. The paper entitled “Selection of the Most Suitable
Dissolution Method for an Extended Release Formulation based on IVIVC level A
obtained on Cynomolgus Monkey” was accepted by Drug Development and Industrial
Pharmacy (DDIP). (2010, Vol. 36, No. 11 , Pages 1320-1329)
After proof of manufacturability (PoM) confirmed in monkey, the promising tablets were
evaluated on healthy volunteers as PoC. The results are briefly listed and commented in the
first supplement (Supplement 1) entitled: “Confirmation of IVIVC in human”. The IVIVC
can be confirmed and allows to stronger the found dissolution method as biorelevant tool to
support development.
The understanding and control of the release mechanism is further supported by the
development of an imaging technology associated with the dissolution. The experiments are
presented in the second supplement (Supplement 2) entitled: “Understanding of the release
mechanism using imaging technology“. The combination of both techniques (dissolution &
imaging) is discussed briefly in the context of QbD in order to highlight the strength of this
association. In this case the main objective was to qualitatively confirm the main parameter
impacting the release behavior found to be important for bioperformance.

Page 79 of 201

Page 80 of 201
Selection of the Most Suitable Dissolution Method for an Extended Release
Formulation based on IVIVC level A obtained on Cynomolgus Monkey
Emmanuel Scheubel a, b *, Laurent Adamy a, Valerie Hoffart b and Jean Michel Cardot b.
a F. Hoffman-La Roche Ltd, Pharmaceutical Division, Galenical & Analytical Development.
CH-4070, Basel, Switzerland.
b University of Clermont 1, Biopharmaceutical Department, UFR Pharmacie, 28 Place Henri
Dunant, B.P. 38,F-630001 Clermont-Ferrand, France
Corresponding author: e-mail: [email protected]; Tel: +41616886357
Keywords: Extended Release, dissolution, IVIVC, BCS class 2.
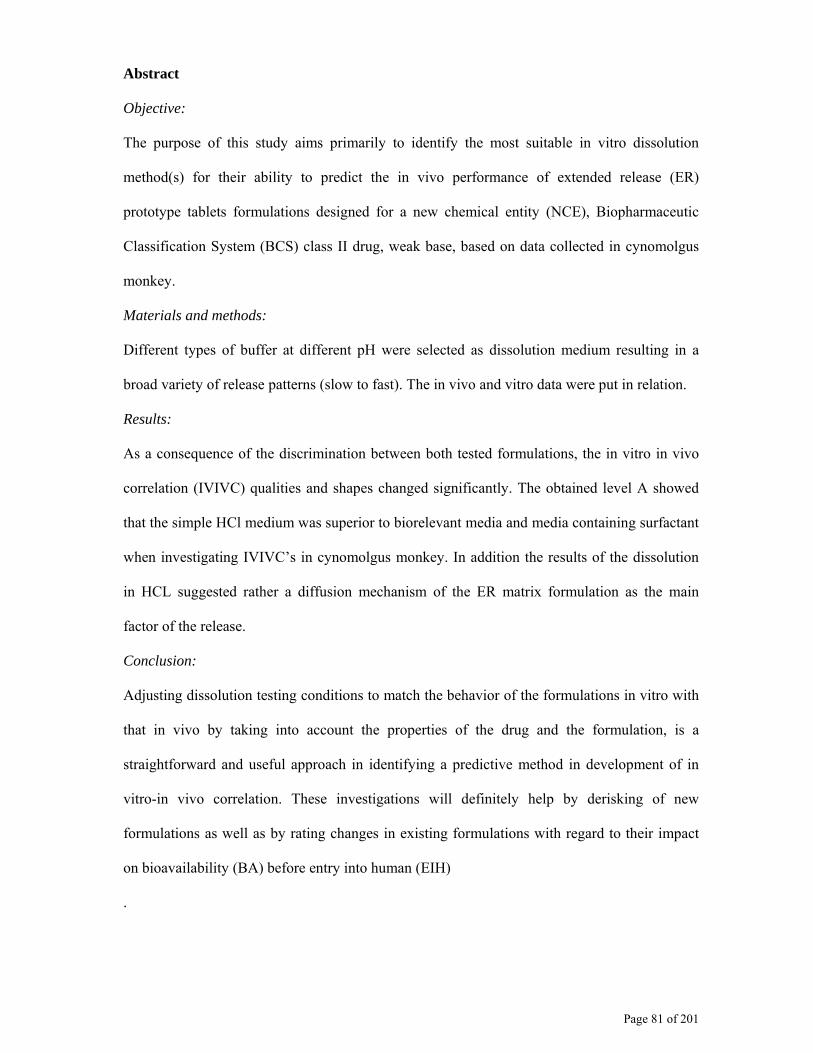
Page 81 of 201
Abstract
Objective:
The purpose of this study aims primarily to identify the most suitable in vitro dissolution
method(s) for their ability to predict the in vivo performance of extended release (ER)
prototype tablets formulations designed for a new chemical entity (NCE), Biopharmaceutic
Classification System (BCS) class II drug, weak base, based on data collected in cynomolgus
monkey.
Materials and methods:
Different types of buffer at different pH were selected as dissolution medium resulting in a
broad variety of release patterns (slow to fast). The in vivo and vitro data were put in relation.
Results:
As a consequence of the discrimination between both tested formulations, the in vitro in vivo
correlation (IVIVC) qualities and shapes changed significantly. The obtained level A showed
that the simple HCl medium was superior to biorelevant media and media containing surfactant
when investigating IVIVC’s in cynomolgus monkey. In addition the results of the dissolution
in HCL suggested rather a diffusion mechanism of the ER matrix formulation as the main
factor of the release.
Conclusion:
Adjusting dissolution testing conditions to match the behavior of the formulations in vitro with
that in vivo by taking into account the properties of the drug and the formulation, is a
straightforward and useful approach in identifying a predictive method in development of in
vitro-in vivo correlation. These investigations will definitely help by derisking of new
formulations as well as by rating changes in existing formulations with regard to their impact
on bioavailability (BA) before entry into human (EIH)
.

Page 82 of 201
Introduction
A common challenge of all pharmaceutical companies is the development of new drugs, as fast
as possible, to cover unmet medical needs and to ensure at the same time safety and efficacy.
Many strategies exist and amongst them, in vitro dissolution, animal experiment and in vitro in
vivo correlation (IVIVC) can be used early in the development phase in order to minimize the
risk before administration into man, to address impact of changes in existing formulations with
regard to bioavailability (BA) and to improve the development strategy leading to a faster time
to market.
In the present study this approach was used to select an extended release (ER) formulation of a
NCE, weak base classified as a poorly soluble and highly permeable drug (BCS Class 2 (Yu,
Amidon et al. 2002)). This drug, after oral administration of an immediate release (IR) capsule
in human, exhibited side effects, hypothetically due to high plasma concentration. To address
this high concentration (Cmax), prototype formulations of extended release hydrophilic matrix
tablets were developed and optimized using dissolution techniques in order to sustain Tmax
and lower Cmax. During this development, dissolution data were generated in order to assess
the formulations performance throughout the optimization process. However, at this stage, the
discriminative power and the effectiveness of the dissolution method as a predictive tool to
derisk human in vivo study is unknown. Therefore, the development of the initial dissolution
method for this poorly soluble compound included the assessment of relevant physical and
chemical properties of the drug as well as the key factors of the drug product and formulation.
The two optimal formulations, with regard to dissolution performance observed in the simplest
media achieving sink condition, were tested in animals before any new administration to
humans in order to demonstrate its technical feasibility and efficacy. A systematic screening of
various classical dissolution media keeping apparatus and condition similar was realized to
better understand the behavior of these two formulations and a relationship between in vitro
and in vivo animal data was assessed.

Page 83 of 201
The combination of these tools (dissolution, animal data and correlation as well as some
weakness of in silico data) to develop, and select the most suitable in vitro method is discussed
in the present paper as a smart development tool to speed up the realization of new
formulations and to ensure the best performance during the future human trials.
Materials and methods
Materials
Egg lecithin (E PC S, purity >96%) was obtained from Lipoid (Ludwigshafen, Germany) and
sodium taurocholate (NaTC, 97% pure) was used as received from Prodotti Chimici e
Alimentari SpA, Basaluzzo, Italy
Phosphate buffer, sodium chloride (ACS), 37% hydrochloric acid (fumed), 85% ortho-
phosphoric acid, ethanol (99.9%) as well as HPLC grade methanol and acetonitrile were
purchased from Merck (Darmstadt, Germany). Tris buffer was obtained from Applichem
(Darmstadt, Germany) and water was obtained from a Milli-Q (Millipore, Milford, MA, USA)
water purification system.
The various surfactant; sodium laury sulfate (SDS), hexadecyl-trimethyl-ammonium bromide
(CTAB) and polysorbate 80 (Tween 80) were purchased from Sigma-Aldrich Chemie GmbH,
(Steinheim, Germany).

Page 84 of 201
Model compound and solid formulations
The poorly soluble NCE Roche compound (RO-X) is a small molecule, a weak base used in the
form of hemi-sulphate salt. Only one polymorph form is known and is stable in water. Its main
physicochemical properties are ClogP of 3.7, pKa of 4.6. The experimental dose was set at 1
mg.
Experimental immediate release (IR) capsule formulation and extended release (ER) tablet
formulations were supplied by Roche Pharmaceutical Research department. The ER
formulations were produced by wet granulation using the same batch of API. Different amount
of HPMC were adjusted in order to decrease the Cmax having a target of 85% released in vitro
within 4 hours or 8 hours respectively. The IR reference formulation exhibits a complete
release within 0.5 hour. All formulations were designed and homotetically adjusted for
administration in monkey.
Methods
Dissolution media preparation
Various media were tested from pH 1.1 to 6.5. Compendial media were prepared according to
the United States Pharmacopeia. Phosphate buffer pH 4.0 and pH 6.0 were prepared from
0.05M sodium dihydrogen phosphate. pH was adjusted using 0.2M sodium hydroxide (NaOH)
or phosphoric acid. Surfactant amount was added accordingly. Due to the low solubility,
addition of three types of surfactant (anionic, cationic and non ionic ) were tested at pH 6.0 in
order to have (i) a pH close to neutrality (ii) a pH more in accordance with gastrointestinal (GI)
tract pH (Dressman, Berardi et al. 1990; Kalantzi, Goumas et al. 2006), (iii) a similar
effectiveness of all the surfactants and (iv) a reasonable stability of the solutions after filtration.
Biorelevant media FaSSIF and FeSSIF were prepared according to current procedures (Galia,
Nicolaides et al. 1998). Overall, media were stable and present as a single phase. Two steps
were included in the dissolution method. Step 1 was handled in the selection of the best
formulations to be tested in vivo on monkey and correspond to acidic media alone, step 2 after

Page 85 of 201
having the in vivo results corresponded to the screening of various dissolution methods in order
to seek for the most pertinent IVIVC.
Solubility Studies
The solubility of the RO-X was assessed in each dissolution medium. Duplicate samples were
incubated with an excess of compound in a 10 ml volumetric flask at 37°C with constant
rotation. Samples were collected after 4 hours and 24 hours , filtrated and subsequently diluted
with the HPLC mobile phase. The dissolved quantity was measured with a validated HPLC-UV
detection method. The solubility studies were carried out with the same batch of API which
was used for manufacturing of the tablets.
Dissolution Studies
The dissolution profiles of the ER formulations were examined in the different media, using a
Sotax AT7 smart apparatus equipped with automated sampling (Sotax, Allschwill, CH). In all
cases, paddle speed and temperature were set at 50 rpm and 37°C, respectively with n=3 units.
Due to the low dose of the tablets (1 mg) and sensitivity of the analytical method, the
dissolution volume was held constant at 500 ml (minimal volume insuring a homogeneity and
reproducibility of the media). Ten 1 ml samples were withdrawn at predefined time intervals up
to 8 hours from each vessel and not replaced. 20 ml of the test solution were pumped through
the circuit before each sampling time to prerinse the sampling lines and filters. Sampling and
filtration were automated and dissolution samples were directly filtered and subsequently
measured by a validated HPLC-UV detection method.
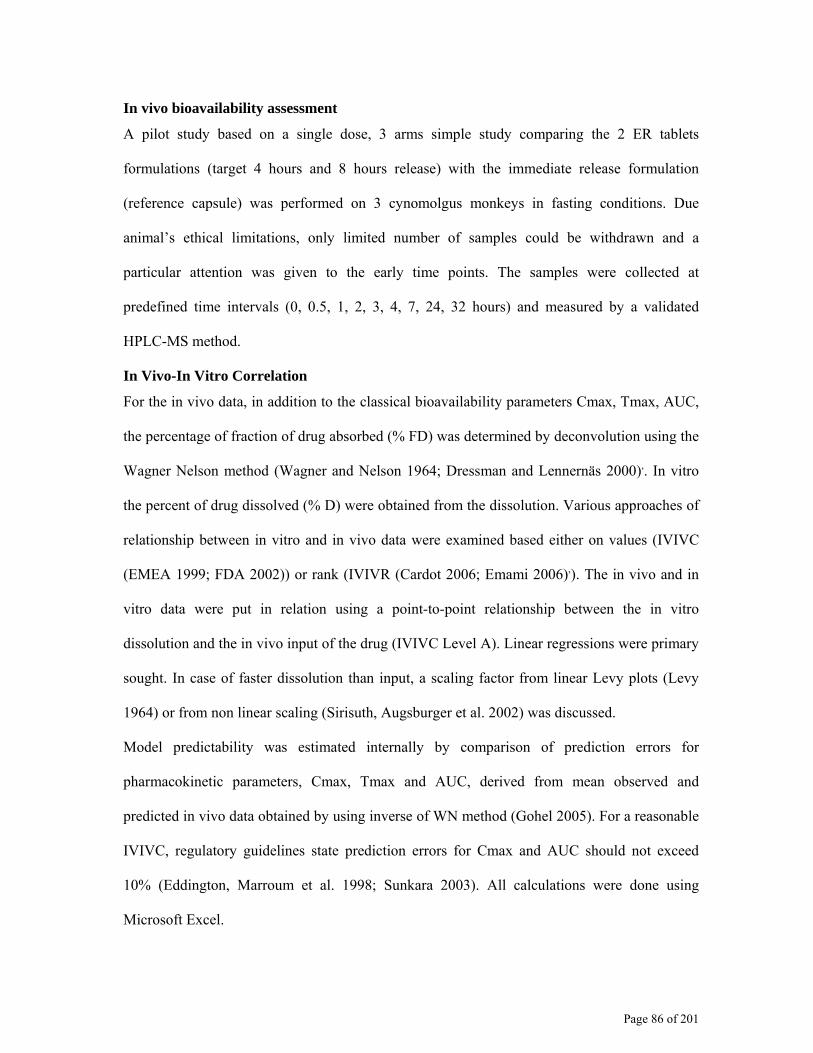
Page 86 of 201
In vivo bioavailability assessment
A pilot study based on a single dose, 3 arms simple study comparing the 2 ER tablets
formulations (target 4 hours and 8 hours release) with the immediate release formulation
(reference capsule) was performed on 3 cynomolgus monkeys in fasting conditions. Due
animal’s ethical limitations, only limited number of samples could be withdrawn and a
particular attention was given to the early time points. The samples were collected at
predefined time intervals (0, 0.5, 1, 2, 3, 4, 7, 24, 32 hours) and measured by a validated
HPLC-MS method.
In Vivo-In Vitro Correlation
For the in vivo data, in addition to the classical bioavailability parameters Cmax, Tmax, AUC,
the percentage of fraction of drug absorbed (% FD) was determined by deconvolution using the
Wagner Nelson method (Wagner and Nelson 1964; Dressman and Lennernäs 2000),. In vitro
the percent of drug dissolved (% D) were obtained from the dissolution. Various approaches of
relationship between in vitro and in vivo data were examined based either on values (IVIVC
(EMEA 1999; FDA 2002)) or rank (IVIVR (Cardot 2006; Emami 2006),). The in vivo and in
vitro data were put in relation using a point-to-point relationship between the in vitro
dissolution and the in vivo input of the drug (IVIVC Level A). Linear regressions were primary
sought. In case of faster dissolution than input, a scaling factor from linear Levy plots (Levy
1964) or from non linear scaling (Sirisuth, Augsburger et al. 2002) was discussed.
Model predictability was estimated internally by comparison of prediction errors for
pharmacokinetic parameters, Cmax, Tmax and AUC, derived from mean observed and
predicted in vivo data obtained by using inverse of WN method (Gohel 2005). For a reasonable
IVIVC, regulatory guidelines state prediction errors for Cmax and AUC should not exceed
10% (Eddington, Marroum et al. 1998; Sunkara 2003). All calculations were done using
Microsoft Excel.
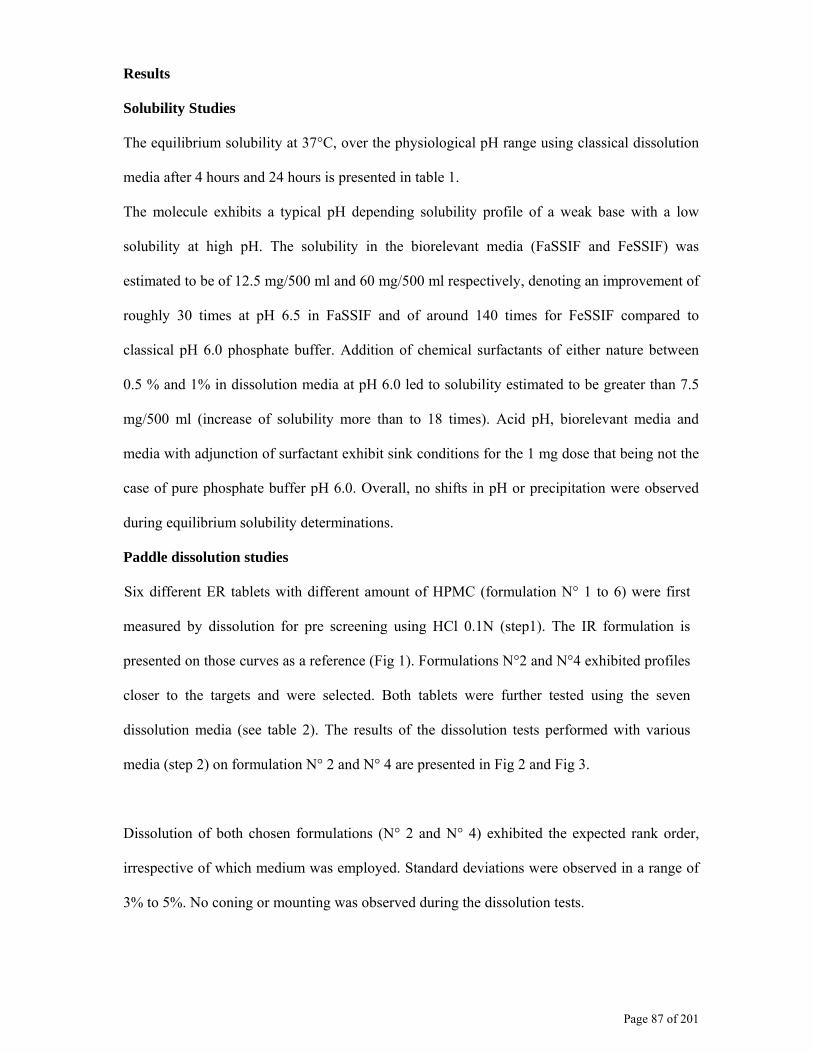
Page 87 of 201
Results
Solubility Studies
The equilibrium solubility at 37°C, over the physiological pH range using classical dissolution
media after 4 hours and 24 hours is presented in table 1.
The molecule exhibits a typical pH depending solubility profile of a weak base with a low
solubility at high pH. The solubility in the biorelevant media (FaSSIF and FeSSIF) was
estimated to be of 12.5 mg/500 ml and 60 mg/500 ml respectively, denoting an improvement of
roughly 30 times at pH 6.5 in FaSSIF and of around 140 times for FeSSIF compared to
classical pH 6.0 phosphate buffer. Addition of chemical surfactants of either nature between
0.5 % and 1% in dissolution media at pH 6.0 led to solubility estimated to be greater than 7.5
mg/500 ml (increase of solubility more than to 18 times). Acid pH, biorelevant media and
media with adjunction of surfactant exhibit sink conditions for the 1 mg dose that being not the
case of pure phosphate buffer pH 6.0. Overall, no shifts in pH or precipitation were observed
during equilibrium solubility determinations.
Paddle dissolution studies
Six different ER tablets with different amount of HPMC (formulation N° 1 to 6) were first
measured by dissolution for pre screening using HCl 0.1N (step1). The IR formulation is
presented on those curves as a reference (Fig 1). Formulations N°2 and N°4 exhibited profiles
closer to the targets and were selected. Both tablets were further tested using the seven
dissolution media (see table 2). The results of the dissolution tests performed with various
media (step 2) on formulation N° 2 and N° 4 are presented in Fig 2 and Fig 3.
Dissolution of both chosen formulations (N° 2 and N° 4) exhibited the expected rank order,
irrespective of which medium was employed. Standard deviations were observed in a range of
3% to 5%. No coning or mounting was observed during the dissolution tests.

Page 88 of 201
Table 1 : Solubility of Ro-X in the various dissolution media over the physiological pH.
Medium pH mg/ml
HCl 0.1N 1.1 13
Phosphate 0.05M 4.0 1.4
Phosphate 0.05M 6.0 0.0008
FeSSIF 5.0 0.12
FaSSIF 6.5 0.025
Phosphate 0.05M + 0.5% SDS 6.0 > 7.5
Phosphate 0.05M + 1% CTAB 6.0 > 7.5
Phosphate 0.05M + 1% tween 6.0 > 7.5
0
20
40
60
80
100
0 1 2 3 4 5 6 7 8
time (h)
% d
isso
lved
Formulation 1 Formulation 2 Formulation 3 Formulation 4 Formulation 5
Formulation 6 target 4h target 8h immediate release
Figure 1: Dissolution Profiles of different ER tablets vs IR formulation in HCl 0.1N

Page 89 of 201
0
20
40
60
80
100
0 1 2 3 4 5 6 7 8time (h)
% d
isso
lved
HCl pH 6.0 FaSSIFFeSSIF pH 6.0 + 1% CTAB pH 6.0 + 1% tw eenpH 6.0 + 0.5% SDS Target 4h
Figure 2: Dissolution Profiles of formulation 2 (ER 4H) within all tested media
0
20
40
60
80
100
0 1 2 3 4 5 6 7 8time (h)
% d
isso
lved
HCl pH 6.0 FaSSIFFeSSIF pH 6.0 + 1% CTAB pH 6.0 + 1% tw eenpH 6.0 + 0.5% SDS Target 8h
Figure 3: Dissolution Profiles of formulation 4 (ER 8H) within all tested media

Page 90 of 201
In vivo-data
The in vivo Cynomolgus monkey results are presented in figure 4 and in table 2 for PK
parameters.
The in vivo release data demonstrated that compared to the reference (immediate release
capsule), a lower Cmax and a prolonged Tmax can be observed with the extended release (ER)
tablets indicating a slower absorption and an impact of the composition of the tablets on the
global performance. The two slow release formulations exhibited a monophasic decline
indicating an apparent one compartment model. In this case the Wagner (Nelson Wagner, 1964)
method can be used for the deconvolution and the results are presented in figure 5 up to 7h
(100% of absorption being reached later). The figure 6 presented the percent remaining to be
absorbed denoting an apparent first order kinetic for both ER formulations.
IVIVC
The basic comparison of the dissolution data and the in vivo data indicated a correct ranking of
both formulation independently of the media used.
The various In vitro–in vivo correlations level A attempted with the different media tested are
presented in figure 7a to 7g and in table 3a, b and c.
No IVIVC of Level C or IVIVR were further investigated as a level A IVIVC can be
established.
PK of ROche1 in Cynomolgus Monkeysdifferent formulations
0
10
20
30
40
50
60
70
80
90
0 5 10 15 20 25 30 35
Time (h)
Plas
ma
Con
cent
ratio
ns (n
g/m
L)
Formulation 2 (extended release 4H)
Formulation 4 (extended release 8H)
immediate release
Figure 4: PK mean profiles of RO-X in Cynomolgus Monkeys for the 3 tested formulations
(ER formulations 2 and 4 versus reference IR formulation).
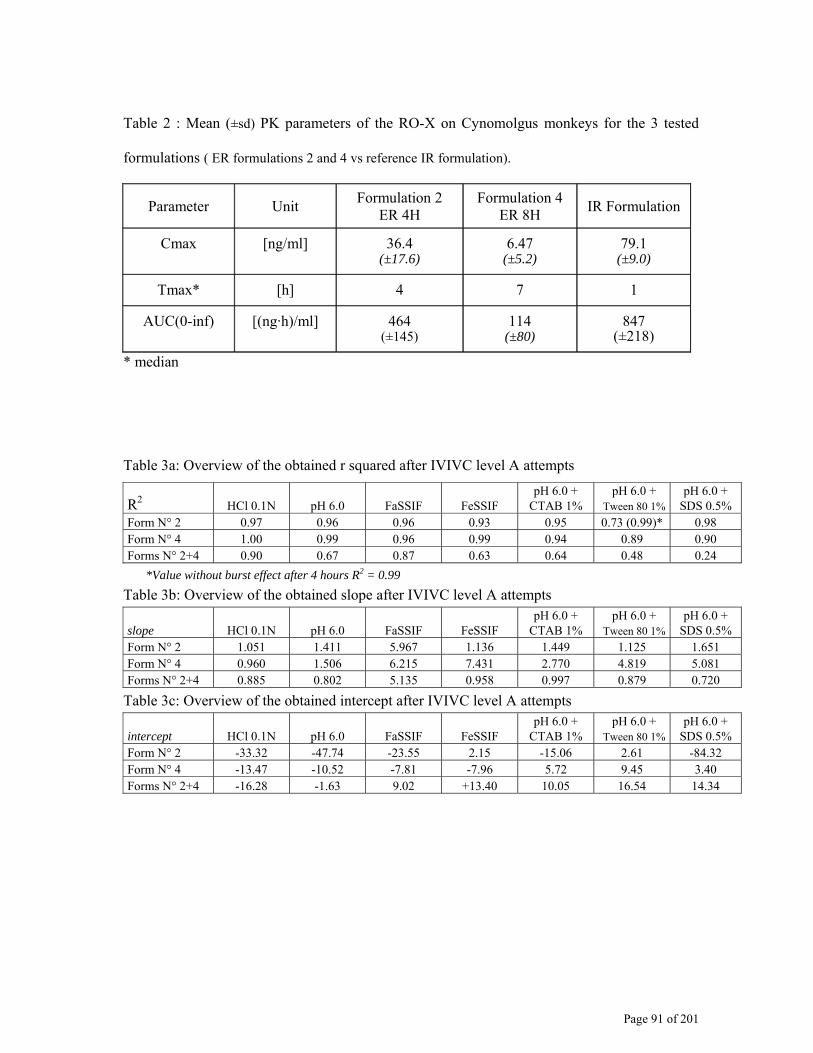
Page 91 of 201
Table 2 : Mean (±sd) PK parameters of the RO-X on Cynomolgus monkeys for the 3 tested
formulations ( ER formulations 2 and 4 vs reference IR formulation).
Parameter Unit Formulation 2 ER 4H
Formulation 4 ER 8H IR Formulation
Cmax [ng/ml] 36.4 (±17.6)
6.47 (±5.2)
79.1 (±9.0)
Tmax* [h] 4 7 1
AUC(0-inf) [(ng·h)/ml] 464 (±145)
114 (±80)
847 (±218)
* median
Table 3a: Overview of the obtained r squared after IVIVC level A attempts
R2 HCl 0.1N pH 6.0 FaSSIF FeSSIF pH 6.0 +
CTAB 1% pH 6.0 +
Tween 80 1%pH 6.0 +
SDS 0.5% Form N° 2 0.97 0.96 0.96 0.93 0.95 0.73 (0.99)* 0.98 Form N° 4 1.00 0.99 0.96 0.99 0.94 0.89 0.90 Forms N° 2+4 0.90 0.67 0.87 0.63 0.64 0.48 0.24
*Value without burst effect after 4 hours R2 = 0.99 Table 3b: Overview of the obtained slope after IVIVC level A attempts
slope HCl 0.1N pH 6.0 FaSSIF FeSSIF pH 6.0 +
CTAB 1% pH 6.0 +
Tween 80 1%pH 6.0 +
SDS 0.5% Form N° 2 1.051 1.411 5.967 1.136 1.449 1.125 1.651 Form N° 4 0.960 1.506 6.215 7.431 2.770 4.819 5.081 Forms N° 2+4 0.885 0.802 5.135 0.958 0.997 0.879 0.720
Table 3c: Overview of the obtained intercept after IVIVC level A attempts
intercept HCl 0.1N pH 6.0 FaSSIF FeSSIF pH 6.0 +
CTAB 1% pH 6.0 +
Tween 80 1%pH 6.0 +
SDS 0.5% Form N° 2 -33.32 -47.74 -23.55 2.15 -15.06 2.61 -84.32 Form N° 4 -13.47 -10.52 -7.81 -7.96 5.72 9.45 3.40 Forms N° 2+4 -16.28 -1.63 9.02 +13.40 10.05 16.54 14.34

Page 92 of 201
0
10
20
30
40
50
60
70
80
90
100
0 1 2 3 4 5 6 7time (h)
% a
bsor
bed
formulation 2 (ER4H)formulation 4 (ER8H)
Figure 5: % of fraction absorbed in function of time according to Wagner Nelson
y = -0.0999x + 2.0356R2 = 0.999
y = -0.0838x + 2.0625R2 = 0.9919
0
0.5
1
1.5
2
2.5
0 2 4 6 8 10
time (h)
log(
Fa)
formulation 2: ER4H formulation 4: ER8H
Figure 6 : Logarithm scale of Wagner Nelson.

Page 93 of 201
Hcl 0.1N
y4= 0.9599x - 13.473R2 = 0.998
y = 0.885x - 16.278R2 = 0.899
y2 = 1.0506x - 33.32R2 = 0.969
0
10
20
30
40
50
60
70
80
90
100
0 10 20 30 40 50 60 70 80 90 100
In vitro % dissolved
in v
ivo
% o
f FD
formulation 2
formulation 4
pH 6.0
y4 = 1.5065x - 10.521R2 = 0.9905 y2 = 1.4105x - 47.737
R2 = 0.9555
y = 0.8017x - 1.6318R2 = 0.6695
0
10
20
30
40
50
60
70
80
90
100
0 10 20 30 40 50 60 70 80 90 100
in vitro % dissolved
in v
ivo
% o
f FD
Formulation 2Formulation 4

Page 94 of 201
FaSSIF
y4 = 6.2151x - 7.8059R2 = 0.9643
y = 5.1352x - 9.0234R2 = 0.8699
y2 = 5.9668x - 23.555R2 = 0.9611
0
10
20
30
40
50
60
70
80
90
100
0 10 20 30 40 50 60 70 80 90 100
in vitro % dissolved
in v
ivo
% o
f FD
Formulation 2Formulation 4
FeSSIF
y4 = 7.4308x - 7.9607R2 = 0.9865
y2 = 1.1357x + 2.1486R2 = 0.9226
y = 0.9578x + 13.397R2 = 0.625
0
10
20
30
40
50
60
70
80
90
100
0 10 20 30 40 50 60 70 80 90 10
in vitro % dissolved
in v
ivo
% o
f FD
Formulation 2Formulation 4
pH 6.0 + CTAB 1%(m/v)
y = 0.9971x + 10.049R2 = 0.6409
y4 = 2.7699x + 5.7238R2 = 0.9392
y2 = 1.4492x - 15.057R2 = 0.9509
0
10
20
30
40
50
60
70
80
90
100
0 10 20 30 40 50 60 70 80 90 1
in vitro % dissolved
in v
ivo
% o
f FD
Formulation 2Formulation 4

Page 95 of 201
pH 6.0 + Tween 1% (m/v)
y4 = 4.8186x + 9.4545R2 = 0.8886
y2 = 1.1252x + 2.6121R2 = 0.7327
y = 0.8792x + 16.544R2 = 0.482
0
10
20
30
40
50
60
70
80
90
100
0 10 20 30 40 50 60 70 80 90 1
in vitro % dissolved
in v
ivo
% o
f FD
Formulation 2Formulation 4
pH 6.0 + SDS 0.5% (m/v)
y4 = 5.0814x + 3.4019R2 = 0.9809
y2 = 1.6515x - 84.321R2 = 0.8994
y = 0.7198x + 14.35R2 = 0.2417
0
10
20
30
40
50
60
70
80
90
100
0 10 20 30 40 50 60 70 80 90 1
in vitro % dissolved
in v
ivo
% o
f FD
Formulation 2Formulation 4
Figure 7: IVIVC attempt for both formulations N° 2 and 4 in different media: a) HCl 0.1N, b)
Buffer pH 6.0, c) FaSSIF, d) FeSSIF, e) Buffer pH 6.0 with CTAB 1% (m/v) , f) Buffer pH 6.0
with Tween1% (m/v), g) Buffer pH 6.0 with SDS 0.5% (m/v). Full line indicated the overall
correlation for formulations N°2 and N°4, Open symbols indicated formulation N°2 and full
symbols formulation N°4. Corresponding equations are identified with y2 and y4 and y for
overall correlations.

Page 96 of 201
Discussion
The IR formulation exhibited a fast absorption (Tmax = 1 hour) and a high peak followed by a
biphasic decline denoting a two compartment model. This biphasic decline was not observed
for both ER formulations confirming, as they behaved as a one compartment model, the
possibility to use Wagner Nelson equation.
For ER formulations, the observed Tmax are close to the forecasted time of release. It had to be
noted that the lack of sampling time points between 7 and 24 hours, due to limited blood
volumes permitted in monkey, might underestimate of the Tmax value of formulation N°4 as
well as Cmax and AUC. AUC decreased when absorption was slower (lower Cmax and
increased Tmax). The decrease of AUC was, as a mean; lower than the Cmax decrease but of a
similar magnitude. For formulation 2 and 4, the diminution of Cmax was respectively 48% and
91% and of 38% and 85% for AUC. The GI transit time of the monkey being shorter than in
man (Masayuki and all 2008), incomplete absorption due to the slow release was anticipated, in
particular for the formulation 4. Due to the longer residence time in man, the decrease in
exposure is expected to be lower. If high initial Cmax values are related to the observed clinical
side effects, then the modified release formulation meets the target and the technical feasibility
and efficacy is validated.
7 different dissolution media at various pH from HCl 0.1N pH 1.1 to phosphate buffers at pH
6.0; from a fasting state simulated intestinal fluid without lipid components (FaSSIF) of pH 6.5
to a fed state simulated intestinal fluid (FeSSIF) of pH 5.0, were employed on the dissolution
USP 2 apparatus. All the media studied were capable to some extent of differentiating between
both formulations and the expected rank order was found for the formulation 2 and 4 (ER 4H
and ER 8H) respectively. Despite the fact that based on the measured solubility, the entire drug
should be freely dissolved into the volume tested; huge differences in dissolution rate as well as
very poor recovery were found for some profiles. Profiles obtained in HCl and phosphate pH
6.0 exhibited the highest performance for both formulations. The dissolution profiles are faster
than all the others in HCl 0.1 N (pH 1.1). Since HPMC is a polymer with a release behavior
independent of the pH (Royce, Li et al. 2004) and since sink condition can be easily reached at
pH 1.1 (see table 1) the phenomenon observed in dissolution was the sole reflect of the
influence of the excipients on the release of the drug. The improvement of the apparent
solubility at pH= 6.0 by addition of surfactant of either nature did not improve the dissolution

Page 97 of 201
and led to worst results than those observed at pH=6.0. Surprisingly good dissolution up to
80% were observed in phosphate buffer at pH 6.0 (at pH 6.0 sink condition was not reached).
The good pH=6.0 results were not expected since the drug is a weak base with pKa of 4.6 and
solubility decreases with increasing pH. The increase in solubility between FaSSIF and FeSSIF
was only reflected slightly on the dissolution of the formulation 2. By contrast no significant
difference can be observed for the formulation 4. The release in FaSSIF medium is much
slower than in any of the other media examined. This is not expected in view of the high
solubility measured in this medium but can be explained to some extent by the low buffer
capacity of such a medium as already reported in the literature (Corrigan, Devlin et al. 2003). It
appears to be clear that using biorelevant media and medium containing surfactant, the release
mechanisms which generally control hydrophilic matrix tablets by diffusion, swelling and/or
erosion (Royce, Li et al. 2004; Conti, Maggi et al. 2007) are strongly impacted depending on
the HPMC ratio used in the ER formulations. Therefore the observed in vitro performances
seem not controlled by the solubility of the API, but rather by the release mechanism. The RO-
X molecule behaves in this environment presumably more likely as a BCS class I than like a
classical weak base, BCS class II. The dissolution limiting step being controlled solely by the
formulation (Costa and Sousa Lobo 2001; Sriamornsak, Thirawong et al. 2007).
By applying IVIVC, in vitro release profiles were compared to the corresponding in vivo input
profiles. For most of the media a linear response (R2 close to 1) for solely formulation 2 or
formulation 4 (ER4H or ER8H) can be achieved (see table 3a). Depending on the medium
used, similar slopes for ER4H or ER8H can be observed (see table 3b). The use of various in
vitro working conditions improved differentiation between formulations but did not necessarily
lead to an acceptable and useful correlation with in vivo absorption rates having both
formulations 2 and 4 fitted simultaneously. The systematic shift of the correlation shape
underlines the sensitivity of the IVIV relationship to medium composition and release
mechanism.

Page 98 of 201
Since the release mechanism changes depending on the medium used (but should be similar
within the same medium for both formulations) the observed difference in slope can highlight
that the dissolution rate is different between in vivo and in vitro, that indicate rather a non
suitable dissolution.
In case of strong positive intercept (table 3c) the relationship is considered as not of a good
quality as a certain percent is suppose to be absorbed when no part is dissolved in vitro (e.g. in
medium with surfactant). Similarly a slope markedly greater than one could indicate that a
great part (even 100%) is absorbed when only a small fraction is dissolved (e.g. FaSSIF). In
case of a slope lower than one a time scaling factor (e.g. Levy plotting) could be investigated
but since the low percentage dissolved observed should correlate to a high quantity absorbed,
the conclusion would be that the dissolution test did not adequately reflect the in vivo behavior.
Thus, it is obvious that the observed relationships denote that some media are not adequate to
perform IVIVC. The correlations resulting from the media containing surfactant are the most
weak, and might be due to interaction between the surfactants and the excipients leading to
similar in vitro dissolutions, hiding differences in release, even if differences between the
release rates existed in vivo. Both ER formulations exhibited similar apparent absorption
mechanism (see figure 6) the first choice for the level A correlation focused on the media
where each tested formulation resulted as well in a similar behavior with regard to release rate.
The aim was to obtain the simplest model possible. With this consideration in mind, the only
apparent IVIVC which showed similar drug release mechanism, which were linear and resulted
in similar slope for both ER variants were obtained using FaSSIF, pH 6.0 buffer and HCl 0.1N.
For those 3 media, release did not start at a similar time; formulation 2 is faster than 4, that
being in line with the expectations. However for FaSSIF, the slope is largely greater than 1
indicating that for a small amount dissolved (e.g: only 20% dissolved after 7h for the
formulation 2), a large amount was absorbed leading to the conclusion that this media is not
optimal. For pH 6.0 buffer a great difference in intercept was observed for the formulation 2
compared to formulation 4, leading to a poor overall coefficient of correlation (R2 =0.67). The

Page 99 of 201
negative intercept was always longer for formulation N° 2 compared to formulation N° 4
(Table 3c) indicating that in vitro the dissolution was slightly faster than the absorption for
formulation 2 compare to 4. The best level A correlation observed was obtained using HCl
0.1N. The overall linear regression yielded a regression coefficient R2 of 0.90.
By applying the IVIVC equation obtained with HCL, a prediction according to inverse of WN
method (Gohel, 2005) and based on the observed in vitro dissolution was tried and the results
are presented in figure 8.
0
5
10
15
20
25
30
35
40
0 5 10 15 20 25 30 35
time (h)
conc
entr
atio
n (n
g/m
l)
ER 8 h observedER 8 h simulatedER 4 h observedER 4 h simulated
Figure: 8 Prediction of absorbance profiles based on HCl 0.1N dissolution data and IVIVC.
The prediction resulted in an error of +13% and -7% on Cmax for ER 4H and ER 8H
respectively and on a negligible error on AUC and Tmax (less than 1%) denoting a rather good
predictability. Based on this correlation, dissolution in HCl 0.1N medium can adequately
support the development and improvement of further formulation.
Among the methods in the literature to ascertain the kinetic modeling of drug release, e.g: zero-
order, first-order (Gibaldi and Feldman 1967), Higuchi (Higuchi 1963), Hixon-Crowell

Page 100 of 201
(Hixson and Crowell 1931) and Weibull models (Langenbucher 1972; Papadopoulou,
Kosmidis et al. 2006) the exponential equation of Korsemeyer and Peppas (Peppas 1985), as
well as Harland (Harland, Gazzaniga et al. 1988; Kim and Fassihi 1997; Kim and Fassihi 1997)
are used to describe the drug release behavior from polymeric systems. These models are
generally used to analyze the release of pharmaceutical polymeric dosage forms, when the
release mechanism is not well known or when more than one type of release phenomenon
could be involved. As Korsemeyer and Peppas equation can only be used to fit 60 % release,
the best fit was obtained by using Harland et al. Thus the dissolution profiles can be fitted to
the equation (1):
Mt/M∞ = A√t + Bt eq. (1)
In the above equation, A and B are diffusion and erosion terms. When A>B, the diffusion
factor prevails in the release system. When A<B, erosion predominates. If A=B, the release
mechanism includes both diffusion and erosion equally (Ratsimbazafy, Bourret et al. 1996).
The dissolution profiles in HCL fitted by eq. (1) suggested clearly an apparent diffusion
mechanism associated to the in vitro release for both formulations (ER4H
A = 0.38; B=0 and ER 8H: A = 0.25; B= 0.02) and confirmed that both formulations behave
similarly in this medium. Controlling of the diffusion behavior can then be an additional
monitoring parameter to support new formulations or change during further development.
In comparison to more complex approaches using simulated intestinal fluids as often seen in
literature reports (Dressman, Amidon et al. 1998; Jantratid, Janssen et al. 2008; Lu 2008) the
use of this simple dissolution method is advantageous since it has the potential to serve both as
a robust quality control method and a biorelevant method with discrimination power.
Attention has to be paid on the fact that the present observed correlation is valid only for an
apparent one compartment model in vivo absorption using a hydrophilic matrix.

Page 101 of 201
Overestimation of these criteria can lead to misinterpretation even if the mathematical
correlation seems to suggest a reliable prediction of the in vivo performance (Dokoumetzidis
2008; Rettig and Mysicka 2008).
Additionally it is important at this stage of the development to note, that this animal approach
using IVIVC, has a number of limitations the major one being the gastrointestinal capacity and
transit time of monkey compared to humans. Monkeys are closer to humans in terms of
evolutionary development than all other commonly used laboratory animals like rodents or dog
(Kalarli 1995). As a model for oral drug absorption, cynomolgus monkeys can be used to
address intra and inter individual physiological variability (Willmann, Edginton et al. 2007).
Apart from species differences in intestinal physiology, erroneous assumptions can also be
made with regards to scaling of dosage. In our case, the drug was tested in animals as side
effects were observed in humans and a new in vivo study in humans could not be proposed
before the safety of the drug was assessed in animals. Rodents cannot be used due to size of
tablet, dog was not possible due to constriction force of the stomach that is known to destroy
HPMC matrix (Kamba, Seta et al. 2002), and therefore the monkey was the only practicable
species. The large variability observed between animals, implied difficulties to predict small
variations and limit the discriminative power the IVIVC linked to minor changes of the
formulation. However the aim of the present work was to be able to discriminate formulations
with a large release difference in order to insure the best selection before Human study and to
check which dissolution test was the most appropriate that being done based on the mean curve
which is an unbiased estimation.
In silico estimation was evaluated as well but also exhibited some limitations. Nowadays,
several computational simulation programs are available (GastroPlusTM; WinNonLin®; Parrott
and Lave 2002) and are offering specific modules (e.g. IVIVC Toolkit). However,
computational simulation is not always accurate since it is based on many assumptions like
numeric integration of the Noyes-Whitney equation for the dissolution or the membrane
permeation equation. Incorporation in the simulation of factors like the relationship between

Page 102 of 201
disintegration, dissolution and erosion/diffusion mechanism or furthermore the increase of
solubility due to addition surfactant but leading to slower dissolution as observed within this
investigation can not be easily set up using the current version of these software’s (Kesisoglou
and Wu 2008; Okazaki, Mano et al. 2008). In most of the cases a model can only be adequately
setup after a first comparison with real experimental data and some adjustments (Sugano 2007).
Thus until these criteria can be adequately modeled, generation of the appropriate in vitro data
to try to approximate the in vivo behavior and use as input to establish a correlation will remain
more accurate. However, the data generated within this study to demonstrate its technical
feasibility for the ER formulation, enable now a better basis for further in silico projection, in
particular for simulating human behavior based on animal data.
For drugs like RO-X associated as low dose with hydrophilic matrixes, first attempts can be
done in classical acidic media (pH 1.1 to 2.5) and neutral media (pH 5.5 to 7.0). In case of
similar and conclusive results between the two dissolution tests, the animal models can be used
to confirm the ranking of the formulations and the expected results. In this case an IVIVC/R
investigation can be much easily set up. As general rule for IVIVC investigation, the
correlation is more realistic if the release mechanism and rate observed in vivo is reflected in
vitro. In vitro working condition that can be adapted consequently in case of poor relationship.
The information likely to be gained is worthwhile and in this way, the efforts to achieve a
correlation, facilitate formulation screening at the early development stage by better
understanding of key parameter that are likely to impact the drug product performance.
Additionally the use of an IVIVC based on animal species in early stage potentially reduce the
number of animal studies, that are typically done for formulation screening, that being in line
with current recommendations. Anyhow these investigations provide valuable information to
better streamline the drug development process and offer help in evaluating manufacturing
process parameters at later stages.

Page 103 of 201
Conclusion
The in vitro release from the developed formulations was found to be independent of solubility
and pH but dependent mainly of the composition of the dissolution media. This investigation
shows that the simple HCl medium was superior to a biorelevant medium and medium
containing surfactant when investigating the drug in cynomolgus monkey and establishing
IVIVC. The results of the dissolution in HCL have helped to identify the diffusion mechanism,
from a HPMC based extended release formulation, as the apparent key parameter of the release
mechanism.
The significance of the present study may be applicable to other ionizable weak base drugs
with high permeability. For this BCS class II compound (weak base, low drug load), the
dissolution rate of this extended release form is not limited by the solubility over GI tract pH
but mostly by the release mechanism. During early drug development, it is extremely useful to
have a predictive in vitro dissolution test that correlates with in vivo absorption. Such a test
helps in screening of new formulations as well as evaluating changes in existing formulations
with regard to their impact on bioavailability (BA). In this case further research has to be
conducted to confirm this outcome in man. In conclusion, adjusting dissolution testing
conditions to match the behavior of the formulations in vitro with that in vivo is a simple and
useful approach in identifying a predictive method in development of in vitro-in vivo
correlation and allows clearly decreasing the risk before first entry into human.
Acknowledgment
The authors acknowledge: C. Keiflin, P. Wininger, C. Maureta, M. Brach, Y. Ducommun, Dr.
M. Lindenberg for technical assistance and Dr. B. Fischer for managerial support.
Declaration of Interest
The authors report no declaration of interest.

Page 104 of 201
References
Cardot, J.-M., Beyssac E (2006). "In vitro/in vivo correlations." Ed. James Swarbrick, James C. Boylan, 3rd ed,
Informa healthcare 1: 1062-72.
Conti, S., L. Maggi, et al. (2007). "Matrices containing NaCMC and HPMC 1. Dissolution performance
characterization." Int J Pharm 333(1-2): 136-42.
Conti, S., L. Maggi, et al. (2007). "Matrices containing NaCMC and HPMC 2. Swelling and release mechanism
study." Int J Pharm 333(1-2): 143-51.
Corrigan, O. I., Y. Devlin, et al. (2003). "Influence of dissolution medium buffer composition on ketoprofen
release from ER products and in vitro-in vivo correlation." Int J Pharm 254(2): 147-54.
Costa, P. and J. M. Sousa Lobo (2001). "Modeling and comparison of dissolution profiles." Eur J Pharm Sci 13(2):
123-33.
Dokoumetzidis, A. (2008). "IVIVC reasons for failure." Journal of control release 129: 76-78.
Dressman, J. B., G. L. Amidon, et al. (1998). "Dissolution testing as a prognostic tool for oral drug absorption:
immediate release dosage forms." Pharm Res 15(1): 11-22.
Dressman, J. B., R. R. Berardi, et al. (1990). "Upper gastrointestinal (GI) pH in young, healthy men and women."
Pharm Res 7(7): 756-61.
Dressman, J. B. and H. Lennernäs (2000). Oral Drug Absorption. Prediction and Assessment.
Eddington, N. D., P. Marroum, et al. (1998). "Development and internal validation of an in vitro-in vivo
correlation for a hydrophilic metoprolol tartrate extended release tablet formulation." Pharm Res 15(3): 466-73.
Emami, J. (2006). "In vitro - in vivo correlation: from theory to applications." J Pharm Pharm Sci 9(2): 169-89.
EMEA (1999). "Note for Guidance on Modified Release Oral and Transdermal Dosage Forms:Section II
(Pharmacokinetic and Clinical Evaluation." European Agency for the Evaluation of Medicinal Products, Human
Medicines Evaluation Unit, Committee for Proprietary Medicinal Products,
CPMP/EWP/280/96;London,U.K.(july).
FDA (2002). "In Vitro and In Vivo Evaluation of Dosage Forms. <1088>. In United States Pharmacopeia and
National Formulary USP 26-NF 21;United States Pharmacopeial Convention,Inc.:Rockville,MD."
Galia, E, Nicolaides E., et al. (1998). "Evaluation of various dissolution media for predicting in vivo performance
of class I and II drugs." Pharm Res 15(5): 698-705.
GastroPlusTM, Simulations Plus Inc, Lancanster, California.
Gibaldi, M. and S. Feldman (1967). "Establishment of sink conditions in dissolution rate determinations.
Theoretical considerations and application to nondisintegrating dosage forms." J Pharm Sci 56(10): 1238-42.

Page 105 of 201
Gohel, M. (2005). "Simplified Mathematical Approach for Back Calculation in Wagner-Nelson Method."
Pharmaceutical Reviews 3(2).
Harland, R. S., Gazzaniga A., et al. (1988). "Drug/polymer matrix swelling and dissolution." Pharm Res 5(8): 488-
94.
Higuchi, T. (1963). "Mechanism of Sustained-Action Medication. Theoretical Analysis of Rate of Release of
Solid Drugs Dispersed in Solid Matrices." J Pharm Sci 52: 1145-9.
Hixson, A. and J. Crowell (1931). "Dependence of reaction velocity upon surface and agitation." Ind Eng Chem.
23: 923.
Jantratid, E., N. Janssen, et al. (2008). "Dissolution media simulating conditions in the proximal human
gastrointestinal tract: an update." Pharm Res 25(7): 1663-76.
Kalantzi, L., K. Goumas, et al. (2006). "Characterization of the human upper gastrointestinal contents under
conditions simulating bioavailability/bioequivalence studies." Pharm Res 23(1): 165-76.
Kalarli (1995). "Comparison of the gastrointestinal anatomy, physiology, and biochemistry of humans and
commonly used laboratory animals." Biopharm. Drug Dispos 16(5): 351-380.
Kamba, M., Y. Seta, et al. (2002). "Comparison of the mechanical destructive force in the small intestine of dog
and human." International Journal of Pharmaceutics 237(1): 139-149.
Kesisoglou, F. and Y. Wu (2008). "Understanding the Effect of API Properties on Bioavailability Through
Absorption Modeling,." The AAPS journal.
Kim, H. and R. Fassihi (1997). "Application of a binary polymer system in drug release rate modulation. 1.
Characterization of release mechanism." J Pharm Sci 86(3): 316-22.
Kim, H. and R. Fassihi (1997). "Application of binary polymer system in drug release rate modulation. 2.
Influence of formulation variables and hydrodynamic conditions on release kinetics." J Pharm Sci 86(3): 323-8.
Langenbucher, F. (1972). "Linearization of dissolution rate curves by the Weibull distribution." J Pharm
Pharmacol 24(12): 979-81.
Levy, G. (1964). "Effect of dosage form on drug absorption - A frequent variable in clinical pharmacology." Arch.
Int. Pharmacodyn 152(1-2): 59-68.
Lu, B. (2008). "Using biorelevant dissolution to obtain IVIVC of solid dosage forms containing a poorly-soluble
model compound;." European Journal of Pharmaceutics and Biopharmaceutics 69: 648-657.
Masayuki, T. and a. all (2008). "Characterization of Gastrointestinal Drug absorption in Cynomolgus monkeys."
Molecular Pharmaceutics(02).
Okazaki, A., T. Mano, et al. (2008). "Theoretical dissolution model of poly-disperse drug particles in biorelevant
media." J. Pharm. Sci. 97: 1843-1852.

Page 106 of 201
Papadopoulou, V., K. Kosmidis, et al. (2006). "On the use of the Weibull function for the discernment of drug
release mechanisms." Int J Pharm 309(1-2): 44-50.
Parrott, N. and T. Lave (2002). "Prediction of intestinal absorption: comparative assessment of GASTROPLUS
and IDEA." Eur J Pharm Sci 17(1-2): 51-61.
Peppas, N. A. (1985). "Analysis of Fickian and non-Fickian drug release from polymers." Pharm Acta Helv 60(4):
110-1.
Ratsimbazafy, V., E. Bourret, et al. (1996). "Drug release from matrix tablets and minitablets containing
glycerides." Pharm. Ind. 58: 442-446.
Rettig, H. and J. Mysicka (2008). "IVIVC: Methods and Applications in Modified-Release Product Development."
Dissolution Technologies 15(1).
Royce, A., S. Li, et al. (2004). "In vivo and in vitro evaluation of three controlled release principles of 6-N-
cyclohexyl-2'-O-methyladenosine." J Control Release 97(1): 79-90.
Sirisuth, N., L. L. Augsburger, et al. (2002). "Development and validation of a non-linear IVIVC model for a
diltiazem extended release formulation." Biopharm. Drug Dispos 23: 1-8.
Sriamornsak, P., N. Thirawong, et al. (2007). "Swelling and erosion of pectin matrix tablets and their impact on
drug release behavior." Eur J Pharm Biopharm 67(1): 211-9.
Sugano, K. (2007). "Solubility and Dissolution Profile Assessment in Drug Discovery." Drug Metab.
Pharmacokinet. 22(4): 225-254.
Sunkara, G. (2003). "IVIVC: an important tool in the development of drug delivery." Drug Deliv. Tech. 3(4).
Wagner, J. and E. Nelson (1964). "Kinetic analysis of blood levels and urinary excretion in the absorptive phase
after single dose of drug." J Pharm Sci 5(1392).
Willmann, S., A. N. Edginton, et al. (2007). "Development and validation of a physiology-based model for the
prediction of oral absorption in monkeys." Pharm Res 24(7): 1275-82.
WinNonLin®, Pharsight® Corporation Mountain View, CA , USA.
Yu, L. X., G. L. Amidon, et al. (2002). "Biopharmaceutics classification system: the scientific basis for biowaiver
extensions." Pharm Res 19(7): 921-5.

Page 107 of 201

Page 108 of 201
Selection of the Most Suitable Dissolution Method for an Extended Release
Formulation based on IVIVC level A obtained on Cynomolgus Monkey
Supplement 1: Confirmation of IVIVC on human
Introduction
In order to confirm the outcome of the Proof of Mechanism observed on monkey for both
ER4H and ER8h formulations, a BA study was initiated in human as PoC.
The Ro-x Molecule is currently in phase II development at Roche and several studies are on
going. Due to some IP limitation, only reduced data set of the clinical results of comparison
immediate versus modified release are presented in this supplement of the paper. The aim of
this investigation was to assess if the correlation found on monkey can be further used on
human. The same tablets composition was used, allowing to directly comparing the data. The
combination of dissolution, in vivo data and correlation is discussed in the present supplement
as a smart development tool to speed up the realization of new formulations and to ensure the
best performance during the further development of the formulation.
Material and Method
Both ER4H and ER8H 1 mg tablets tested on Cynomolgus monkey were further used for a PK
human study.
In vivo bioavailability assessment
A single-center, double-blind, randomized, three-period cross-over study with 12 healthy
volunteers was performed. The IR release 1 mg formulation was compared to the ER4H and
ER8H in fasted state.
The samples were collected at predefined time intervals (0, 0.5, 1, 1.5,2, 4, 5, 6, 8, 9, 10, 11, 12
and 24 hours) and measured by a validated HPLC-MS method.
In Vivo-In Vitro Correlation
For the in vivo data, in addition to the classical bioavailability parameters Cmax, Tmax, AUC,
the percentage of fraction of drug absorbed (% FD) was determined by numerical
deconvolution using the software Gastro plus© with IVIVC toolkit and a Weibull function. In
vitro the percent of drug dissolved (% D) were obtained from the dissolution mentioned in the
paper 2. The in vivo and in vitro data were put in relation using a point-to-point relationship
between the in vitro dissolution and the in vivo input of the drug (IVIVC Level A). Linear
regressions were primary sought. Calculations were performed with Microsoft Excel©.

Page 109 of 201
Results
In vivo-data and in vitro data
The in vivo results are presented in figure 1 for PK parameters. For confidentiality reason
detailed information are not presented.
The IR formulation exhibited a fast absorption (Tmax = 1 hour) and a high peak followed by a
biphasic decline denoting a two compartment model. This biphasic decline was not observed
for both ER formulations, confirming that was observed on monkey. This observation is well in
line with observations made on figure 4 of paper 2.
The in vivo release data demonstrated that compared to the IR reference a lower Cmax and a
prolonged Tmax can be observed with both extended release (ER) tablets indicating a slower
absorption and an impact of the composition of the tablets on the global performance. The data
after deconvolution are presented Figure 2. After 4 hours the ER4H showed an apparent
absorption of 75 %, 100 % release being reached after approx 7 hours. After 8 hours the ER8h
exhibited an apparent absorption of 70%, 100 % release being reached after approx 24 hours.
The corresponding in vitro data for the ER4H and ER8H are presented Figure 3.
Figure 1: PK mean profiles of RO-x in human for the 3 tested formulations (ER4H and ER8H
versus reference IR formulation).

Page 110 of 201
0
0.2
0.4
0.6
0.8
1
0 1 2 3 4 5 6 7 8 9 10 11 12 13 14 15 16 17 18 19 20 21 22 23 24
Time (hrs)
mg
Abso
bed
ER4HER8H
Figure 2: mg of fraction absorbed in function of time for ER 4H and ER8H after
deconvolution.
IVIVC
The in vitro–in vivo correlation level A attempted is presented in Figure 4 and in Table 1.
A linear response (R2 close to 1) for solely ER4H and ER8H as well as both fitted together can
be achieved. Similar slopes for ER4H or ER8H can be observed. The negative intercept
indicating that in vitro the dissolution was slightly faster than the absorption for both
formulations. It can be seen from Table 1 that similar data to those observed on monkey have
been found.
0
20
40
60
80
100
0 1 2 3 4 5 6 7 8
time (h)
% d
isso
lved
ER4H in HCLER8H in HCL
Figure 3 : In vitro Dissolution Profiles of ER4H and ER8H in HCL 0.1N
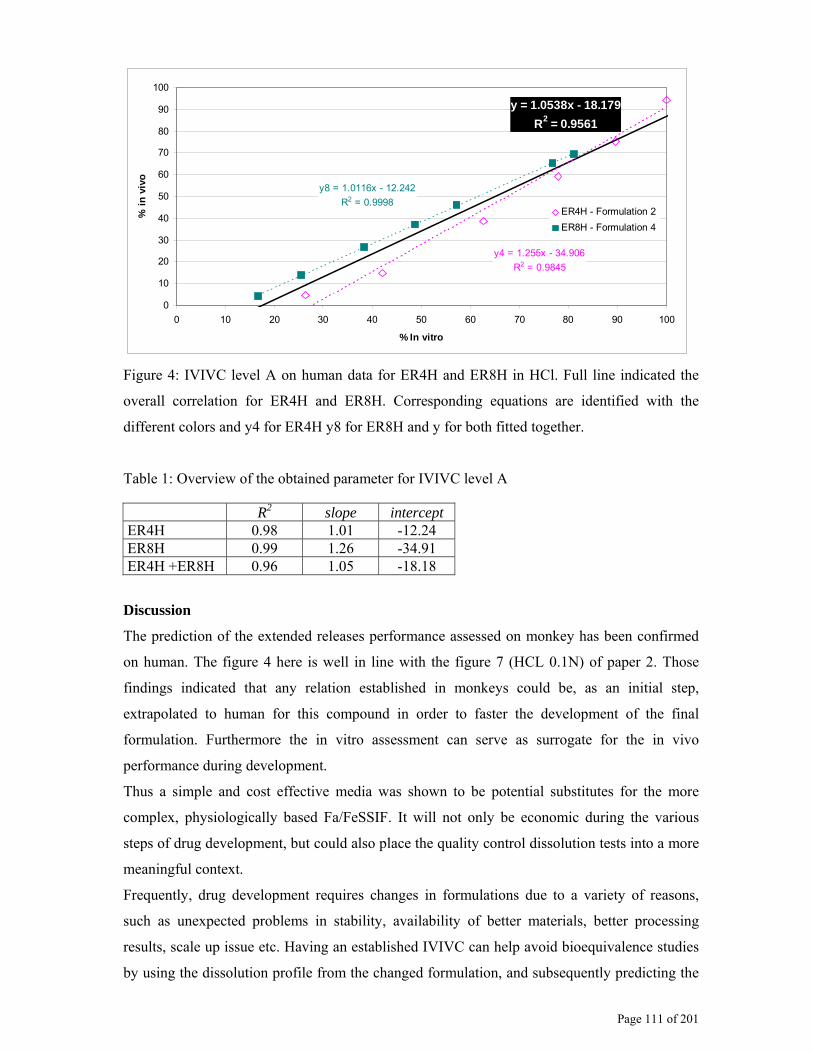
Page 111 of 201
y = 1.0538x - 18.179R2 = 0.9561
y8 = 1.0116x - 12.242R2 = 0.9998
y4 = 1.255x - 34.906R2 = 0.9845
0
10
20
30
40
50
60
70
80
90
100
0 10 20 30 40 50 60 70 80 90 100
% In vitro
% in
viv
o
ER4H - Formulation 2ER8H - Formulation 4
Figure 4: IVIVC level A on human data for ER4H and ER8H in HCl. Full line indicated the
overall correlation for ER4H and ER8H. Corresponding equations are identified with the
different colors and y4 for ER4H y8 for ER8H and y for both fitted together.
Table 1: Overview of the obtained parameter for IVIVC level A
R2 slope intercept ER4H 0.98 1.01 -12.24 ER8H 0.99 1.26 -34.91 ER4H +ER8H 0.96 1.05 -18.18
Discussion
The prediction of the extended releases performance assessed on monkey has been confirmed
on human. The figure 4 here is well in line with the figure 7 (HCL 0.1N) of paper 2. Those
findings indicated that any relation established in monkeys could be, as an initial step,
extrapolated to human for this compound in order to faster the development of the final
formulation. Furthermore the in vitro assessment can serve as surrogate for the in vivo
performance during development.
Thus a simple and cost effective media was shown to be potential substitutes for the more
complex, physiologically based Fa/FeSSIF. It will not only be economic during the various
steps of drug development, but could also place the quality control dissolution tests into a more
meaningful context.
Frequently, drug development requires changes in formulations due to a variety of reasons,
such as unexpected problems in stability, availability of better materials, better processing
results, scale up issue etc. Having an established IVIVC can help avoid bioequivalence studies
by using the dissolution profile from the changed formulation, and subsequently predicting the

Page 112 of 201
in vivo concentration-time profile. This predicted profile could act as a surrogate of the in vivo
bioequivalence study.
Furthermore, IVIVC can allow setting and validating of more meaningful dissolution method
and specifications. It can also assist in quality control for certain scale-up and post approval
changes. It is useable as a strong derisking tool.
Both the regulatory agencies and pharmaceutical industries have therefore understood this
value of IVIVCs. It reduces the need of human studies and has enormous cost-saving benefit in
the form of reduced drug development spending and speedy implementation of post-approval
changes. The nature of post-approval changes could range from minor (such as a change in non
release-controlling excipient) to major (such as site change, equipment change, or change in
method of manufacture, etc) (FDA, Supac MR 1997).
Conclusion
This example showed perfectly the role that could play dissolution in the elaboration of a
discriminative test to surrogate bio performance.
The importance of a representative dissolution testing method that accurately describes the in
vivo release rate is well highlighted in the paper 2 and this supplement.
The role of the dissolution testing method in IVIVC development and validation is to serve as a
surrogate measure of the rate and extent of oral absorption.
A valid IVIVC will allow for dissolution testing for subsequent formulation changes which
take place as a function of product optimization without the need for additional bioavailability
/bioequivalency studies.
Such a test helps in screening of new formulations as well as evaluating changes in existing
formulations with regard to their impact on bioavailability .

Page 113 of 201
Selection of the Most Suitable Dissolution Method for an Extended Release
Formulation based on IVIVC level A obtained on Cynomolgus Monkey
Supplement 2: Understanding of the release mechanism using imaging
technology.
Introduction
During the investigation of the release mechanism of the ER4H and ER8H HPMC ER
formulations , the diffusion was mathematically identified as the main mechanism that is likely
to impact the performance (see paper 2).
When a hydrophilic matrix is exposed to water or a biological fluid, it starts to hydrate and
swell from the outer boundary towards the center. A gel layer is formed around the matrix,
which significantly influences the dissolution and diffusion of the drug through the polymer.
Various authors have investigated the phenomena involved in the swelling and drug release
process for systems containing HPMC. They have concluded that the polymeric content, which
is related to swelling behavior, and the viscosity grade are the determining factors in predicting
the drug release from hydrophilic matrices (Ranga-Rao 1990, Atzhendler 2000). Lee and
Peppas (Lee 1987) defined the boundary between the matrix surface and the dissolution
medium, as the ‘‘erosion front’’ and the boundary between the glassy polymer and its rubbery
gel state as the ‘‘swelling front’’ (figure 1). Additionally the presence of a third front within the
gel layer was observed in a matrix containing sodium diclofenac as the active substance. This
was identified as the ‘‘diffusion front’’ and its boundaries are within the gel layer, between the
areas in which the drug has dissolved and not dissolved (figure 1) (Lee 1987). Further, it has
been demonstrated that the behavior of the diffusion front depends on the solubility and the
quantity (or loading) of the active substance (Bettini 1998). These three fronts can be observed
and their movements facilitate the calculation of the parameters of the swelling/dissolution
process. In fact, a synchronization of the movements of both the swelling and the diffusion
fronts is the essential step to achieve a constant drug delivery rate.
To better visualize this gel formation imaging technologies can be used. Several methods have
been described in the literature in the last decade for the study of the gel layer. These include
for instance the NMR imaging, (Shapiro 1996) or ultrasound (Rajabi-Siahboomi 1994)
methods together with optical methods, such as image analysis (Sung 1996) or more recently
Conti et al (Conti 2007) used image analyzer (digital microscope camera) for morphological
Page 114 of 201
studies. Since each technique is applied under different experimental conditions, it is difficult
to determine whether one is superior to the others.
In this complementary paper, a X-Ray Computed Microtomography (XCMT) imaging system
has been used to observed the gel layer formation. This method measures both the dimensional
changes of a matrix tablet and the gel layer growth in the tablet during swelling. This can be
observed directly into the tablet since this technique offers a non invasive qualitative and
quantitative tool to study in 3 dimensions (3D) swelling and solvent transport within the
matrices.
The varying levels of signal intensity of the XCMT provide a gray-scale in the images from
which information about the density, thickness, and attenuation properties of the sample can be
obtained. Very dense or thick regions and areas that contain heavy elements (e.g., sodium,
chlorine, or iron) will generally create the most contrast in the final images. In very simple
terms, X-ray microtomography can be thought of as creating a three-dimensional map of the
relative atomic density of the sample under evaluation. A virtual cut of the tablet is performed
and the different density observed.
It is important to note, that this approach was very experimental. Due to the limited amount of
material available and the early stage of the formulation at the time of the investigation, only
limited investigation can have been done. Very few references were found in the literature
associating this both techniques (Sinka 2004, Busignies 2006, Zeitler and Gladden 2008, Laity
2010) and several dry runs were necessary to propose valid measurements.
Nevertheless the limited amount of data presented were generated in order to highlight the
potential of a very innovative and promising imaging technique associated with dissolution to
assess the performance of a formulation.
In this complementary paper, the swelling behavior of the ER4H tablets versus the dissolution
time was investigated using this imaging technology. The observations gained with imaging are
correlated with the dissolution and are discussed as valuable information in view of process
understanding and identification of CQA.
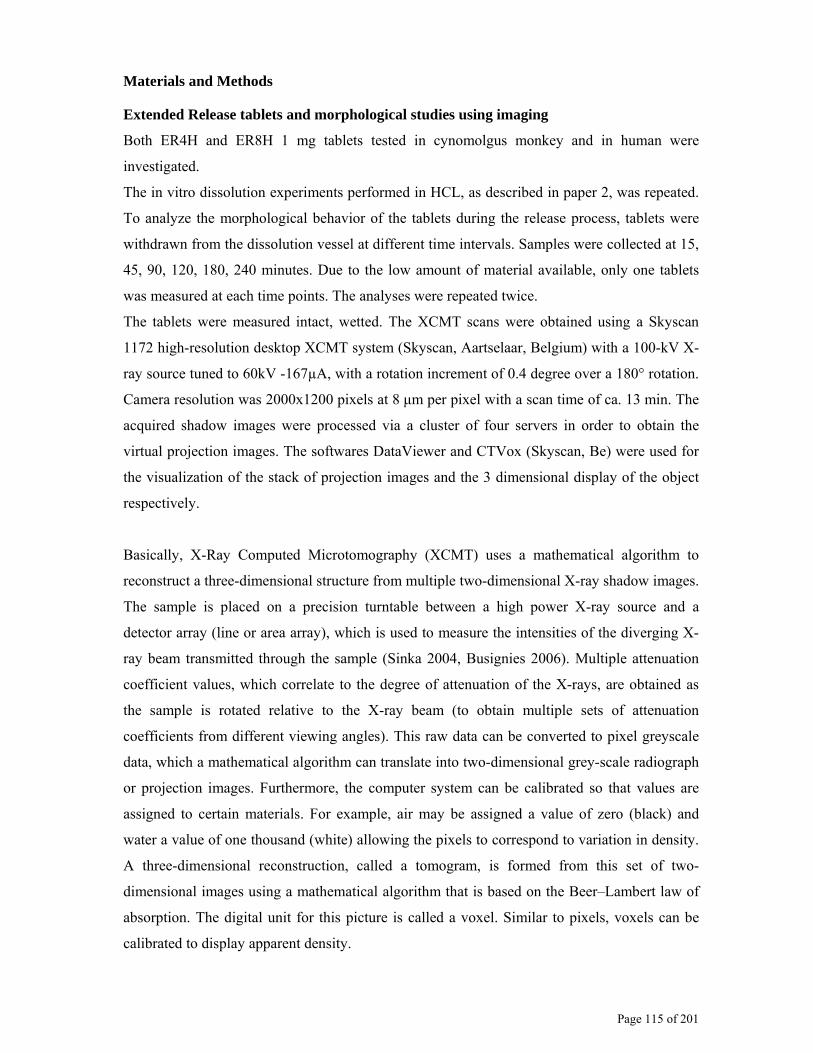
Page 115 of 201
Materials and Methods
Extended Release tablets and morphological studies using imaging
Both ER4H and ER8H 1 mg tablets tested in cynomolgus monkey and in human were
investigated.
The in vitro dissolution experiments performed in HCL, as described in paper 2, was repeated.
To analyze the morphological behavior of the tablets during the release process, tablets were
withdrawn from the dissolution vessel at different time intervals. Samples were collected at 15,
45, 90, 120, 180, 240 minutes. Due to the low amount of material available, only one tablets
was measured at each time points. The analyses were repeated twice.
The tablets were measured intact, wetted. The XCMT scans were obtained using a Skyscan
1172 high-resolution desktop XCMT system (Skyscan, Aartselaar, Belgium) with a 100-kV X-
ray source tuned to 60kV -167µA, with a rotation increment of 0.4 degree over a 180° rotation.
Camera resolution was 2000x1200 pixels at 8 μm per pixel with a scan time of ca. 13 min. The
acquired shadow images were processed via a cluster of four servers in order to obtain the
virtual projection images. The softwares DataViewer and CTVox (Skyscan, Be) were used for
the visualization of the stack of projection images and the 3 dimensional display of the object
respectively.
Basically, X-Ray Computed Microtomography (XCMT) uses a mathematical algorithm to
reconstruct a three-dimensional structure from multiple two-dimensional X-ray shadow images.
The sample is placed on a precision turntable between a high power X-ray source and a
detector array (line or area array), which is used to measure the intensities of the diverging X-
ray beam transmitted through the sample (Sinka 2004, Busignies 2006). Multiple attenuation
coefficient values, which correlate to the degree of attenuation of the X-rays, are obtained as
the sample is rotated relative to the X-ray beam (to obtain multiple sets of attenuation
coefficients from different viewing angles). This raw data can be converted to pixel greyscale
data, which a mathematical algorithm can translate into two-dimensional grey-scale radiograph
or projection images. Furthermore, the computer system can be calibrated so that values are
assigned to certain materials. For example, air may be assigned a value of zero (black) and
water a value of one thousand (white) allowing the pixels to correspond to variation in density.
A three-dimensional reconstruction, called a tomogram, is formed from this set of two-
dimensional images using a mathematical algorithm that is based on the Beer–Lambert law of
absorption. The digital unit for this picture is called a voxel. Similar to pixels, voxels can be
calibrated to display apparent density.

Page 116 of 201
In addition to the morphology evaluated towards the analyses of the pictures, the size and
volume of the tablets at the different time points can be assessed semi quantitatively (data not
shown).
Results
The X-Ray micro Computed Tomography allows measuring the entire tablets after withdrawal
out of the dissolution vessel. An example of the 3D image collected is shown figure 2. The gel
layer appears as a brighter zone. Undissolved drug in the glassy polymer layer appears darker.
To better visualize the two boundaries of the gel (swelling front and erosion front) a virtual cut
of the tablets from the middle on the larger side was performed. The 2D images are presented
figure 3. The swelling/diffusion front is qualitatively indicated in figure 3 by an orange ring.
The pictures presented figure 3 have all the same scale.
From visual observation it is clear that as soon as the tablets are exposed to the dissolution
medium, the liquid penetrates into the matrix and the hydrated polymer swells to form a
gelatinous layer around the tablet. From 15 minutes to 120 minutes a clear change in the
morphology of the tablets can be observed. Modification of the form of the tablets as well as
the size and contrast of the diffusion front (highlighted with the orange ring) are obvious.
In fact, upon contact with the dissolution fluid, the tablets hydrate slowly and swells showing a
thick gel layer after 15 minutes. The gel layer and a partially wetted core can be clearly
identified. The gel thickness increases progressively moving inwards as a function of
hydration, the dimensions of the solid core decrease. Only a small non-gelled core is visible
after 120 minutes and after 180 minutes the tablet appears to be completely gelled. After 180
minutes, the matrix appears completely hydrated and gelled (it is not possible to see the
presence of any glassy core).
Please note that the black holes that can be seen in some pictures are artifact due to the
manipulation of the tablets during the extraction out of the dissolution vessel using a pliers.
Change of composition during dissolution by observation of a diffusion/swelling mechanism
can then be visually confirmed (figure 4).

Page 117 of 201
Figure 1: Schematic representation of erosion, diffusion and swelling fronts, along with the
relevant layer: (A) undissolved drug in the glassy polymer layer; (B) undissolved drug in the
gel layer; (C) dissolved drug in the gel layer, rC –rA is the gel layer and rB-rA is the diffusion
layer. Figure taken from Lee PI, Peppas NA. Prediction of polymer dissolution in swellable
controlled-release systems. J. Contr. Rel. 1987; 6: 207.
Figure 2: Tomogram (3D imaging reconstructed) of the entire HPMC ER4H tablet after 45 min
dissolution in HCl using : X-Ray micro Computed Tomography.

Page 118 of 201
ER Tablet before dissolution testing
Figure 3: Virtual cut of the tablet at 8 microns resolution X-Ray micro Computed Tomography
(X-Ray micro CT) after dissolution in HCL at different time points.
Gel layer Partially
wetted core
ER Tablet after 15 minutes
Wetted coreGel layer
ER Tablet after 45 minutes
Wetted coreGel layer
ER Tablet after 90 minutes
Gel layer Wetted core
ER Tablet after 120 minutes
Tablet completely gelled
ER Tablet after 180 minutes
Tablet completely gelled
ER Tablet after 240 minutes

Page 119 of 201
Figure 4: Dissolution profile in HCL monitored with imaging using X-Ray micro Computed
Tomography.
Discussion It is important to note, that this approach was very experimental. Due to the limited amount of
material available and the early stage of the formulation at the time of the tests, only limited
investigation can have been done. Very few references were found in the literature associating
this both techniques and several dry runs were necessary to propose valid measurements.
The results of this morphological analysis have been correlated to the results of the dissolution
test with focus on the mechanism of drug release analyzed in the previous work (paper 2). The
diffusion mechanism was mathematically identified using the equation from Harland. It should
be noted that, while the equation may reflect a simple mathematical relationship, this arises
from considerably complex underlying processes.
Based on this limited amount of pictures, the diffusion mechanism can be reasonably
confirmed as main phenomenon observed during these investigations based on :
1) After a first wettability phase, the size of the tablets remains nearly constant (visual
observation presented here only). With erosion driven mechanism, we should have rather
expected, as the HPMC matrix erodes, a diminution of the size of the tablets over the time. This
was already observed by Polli, with digital microscope camera (Polli 2007, 2007). More deep
investigations may be necessary to confirm it (with thickness measurements for instance).
0
20
40
60
80
100
120
0 60 120 180 240 300 360 420
Time (min)
% d
isso
lved
15 min 45 min
90 min
120 min
180 min
240 min
0 min

Page 120 of 201
2) The wetting of the core of the tablets as function of the time can be clearly observed,
indicating a swelling of HPMC matrix mainly in axial direction (from surface to core).
This experiment allows tend to confirm the diffusion mechanism with a qualitative analysis.
The aim of this study was to assess the potential of an imaging technology in association with
the dissolution behavior. It is primarily devoted to increasing the mechanistic understanding of
a formulation and its manufacturing processes, with this regard it is a typical QbD tool. A
release mechanism well understood allowing taking a better decision.
Based on the IVIVC presented in the previous papers, the release mechanism associated with
the best in vivo performance is the diffusion.
As a new formulation will be proposed (after scale up or excipients quality change for
instance), the first assessment will be performed by dissolution.
It is paramount to understand the interrelationship between physicochemical and hydrodynamic
conditions in attaining sensitive and reproducible dissolution data.
However, although the dissolution performance (release rate) can be similar; the release
mechanisms can be slightly different (from pure diffusive mechanism to non Fickian
mechanism for instance). Change of the mechanism can impact the validity of the IVIVC and
lead to improper decision.
The evaluation of the release mechanism can be then confirmed with imaging and serve as an
additional tool to take the right decision before further testing on animal or human.
It is to note that this technique needs some specific imaging expertise on dissolution and on
imaging technology, which highlight the fact to have a strong collaboration between different
kinds of science.

Page 121 of 201
Conclusion
Data collected with the novel integrated apparatus were in good agreement with the released
mechanism, calculated based on the in vitro dissolution test. The limitation of the XMCT here
is the off line measurement and the impact of sample preparation on the data. However, this
study has shown that XCMT may be a reliable and appropriate method for elucidation of
physical transformations that occur during dissolution for HPMC matrix, which to-date have
only been studied via theoretical or destructive investigation. In conclusion, XMCT is a
sensitive in vitro technique suitable for the study of inert matrix tablets with the potential to be
used to investigate other solid dosage systems.
The overall goal of either establishing an IVIVC or implementing QbD is to have a better
control of the product performance within the life cycle of a product. The use of imaging
technology in association with dissolution clearly helps in this way.
Acknowledgment
C. Keiflin, P. Wininger, C. Maureta, M. Brach, Y. Ducommun, Dr. M. Lindenberg , Dr P.
Chalus are warmly acknowledged for technical assistance.
Reference for supplement 2.
Sung KC, Nixon PR, Skoug JW, Ju RT, Gao P, Topp EM, Patel MV. Effect of formulation
variables on drug and polymer release from HPMC-based matrix tablets. Int. J. Pharm. 1996;
142: 53.
Rajabi-Siahboomi AR, Bowtell RW, Mansfield P, Henderson A, Davies MC, Melia CD.
Structure and behaviour in hydrophilic matrix sustained release dosage forms: 2. NMR-
imaging studies of dimensional changes in the gel layer and core of HPMC tablets undergoing
hydration. J. Contr. Rel. 1994; 31: 121.
Shapiro M, Jarema MA, Gravina S. Magnetic resonance imaging of an oral gastrointestinal-
therapeutic-system (GITS) tablet. J. Contr. Rel. 1996; 38: 123.
Ferrero C, Munoz-Ruiz A, Jimenez-Castellanos MR. Fronts movement as a useful tool for
hydrophilic matrix release mechanism elucidation. Int. J. Pharm. 2000; 202: 21.
Lee PI, Peppas NA. Prediction of polymer dissolution in swellable controlled-release systems.
J. Contr. Rel. 1987; 6: 207.

Page 122 of 201
Lee PI, Kim C. Probing the mechanisms of drug release from hydrogels. J. Contr. Rel. 1991;
16: 229.
Bettini R, Peppas NA, Colombo P. Polymer relaxation in swellable matrices contributes to
drug release. Int. I. Symp. Contr. Rel. Bioact. Mater. 1998; 25: 26.
Ranga-Rao, K.V., Padmalatha Devi, K., Buri, P., 1990. Influence of molecular size andwater
solubility of the solute on its release from swelling and erosion controlled polymeric matrices.
J. Control Release 12, 133–141.
Katzhendler, I., Mader, K., Friedman, M., 2000. Structure and hydration properties of
hydroxypropylmethylcellulose matrices containing naproxen and naproxen sodium. Int. J.
Pharm. 200, 161–169.
Sinka I. C., Burch S. F., Tweed J. H., Cunningham J. C. Measurement of density variations in tablets using X-ray computed tomography. Int J Pharm. 2004;271(1–2):215–24. doi: 10.1016/j.ijpharm.2003.11.022. Busignies V., Leclerc B., Porion P., Evesque P., Couarraze G., Tchoreloff P. Quantitative measurements of localized density variations in cylindrical tablets using X-ray microtomography. Eur J Pharm Biopharm. 2006;64(1):38–50. doi: 10.1016/j.ejpb.2006.02.007. Zeitler JA, Gladden LF, In-Vitro Tomography and Non-Destructive Imaging at Depth of Pharmaceutical Dosage Forms. Eur J Pharm Biopharm 71(1):2-22, 2008
Laity, P. R., M. D. Mantle, et al. "Magnetic resonance imaging and X-ray microtomography studies of a gel-forming tablet formulation." Eur J Pharm Biopharm 74(1): 109-19. 2010.

Page 123 of 201
Conclusion experimental 2
Interplay dissolution, in vivo performance on animal, human and identification of CQA were
highlighted using this example of ER formulations.
The importance of a representative dissolution testing method that accurately describes the in
vivo release rate and allows a clear understanding of the factor acting on the performance, is
well highlighted in the paper 2 and both supplements.
Compared with IR product (paper 1) IVIVC is generally more likely for ER dosage forms
where drug absorption is normally limited by drug release. To increase the change of success, it
is crucial to evaluate IVIVC feasibility, in vitro and in vivo results, by applying integrated
knowledge of physico-chemical and biological characteristics of the drug substance, dosage
form design and their interplay with the GI tract. It is also important to make an IVIVC strategy
an essential part of the dosage form development program.
The relevance of the confirmed data in human performance allows
(1) to cross validate the animal model as suitable model for this compound
(2) to set up the suitable in vitro analytical method(s) to accurately measure the material in
quality control.
(3) to set up biorelevant specification.
(4) to identify and confirm the diffusion as main release mechanism likely to impact the
performance of these ER formulations
(5) to confirm the importance of the interaction between the different expertise during the
development.

Page 124 of 201
3.3. Experimental part 3
To support the development of meaningful dissolution method that allows high discrimination
or that aid in IVIVC/R discovery, more complex methods or apparatus than the standard
pharmacopeia may be developed.
One way of research can be, for instance, by seeking of medium designed to closely simulate
physiological composition to better link in vitro with in vivo performance. However another
way of investigation could be to investigate on the hydrodynamics.
In vitro this characteristic can be further challenged by changing the working condition and
modifying the apparatus.
The possible use of dissolution in early development phase using non compendia methods has
been investigated. The use of small volume vessel and small paddle in place of compendia
system is commented using different kind of drug product.
This work is presented as paper 3 entitled.
“Small Volume Dissolution Testing as Powerful Method during Pharmaceutical
Development”
This paper has been published in Pharmaceutics in November 2010, Vol. 2, Pages 351-363.
Further investigations using the small vessel and the basket method are presented in the first
supplement (paper 3 supplement 1) entitled “Small Volume Dissolution Testing using Basket
method”. The data obtained for the basket are summarized and briefly commented.
On other example of applying small vessel non compendial method is highlighted in the
supplement (paper 3 supplement 2) entitled “Tenoxicam-Methylparaben Cocrystal
Formation in Aqueous Suspension Formulation “, where already in early development
during the pre formulation, dissolution can support the cocrystall screening program. This work
was presented in the AAPS Annual Meeting 2009, poster W4326.

Page 125 of 201

Page 126 of 201
Article
Small Volume Dissolution Testing as Powerful Method during
Pharmaceutical Development
Scheubel Emmanuel 1,2,* Lindenberg Marc2 Beyssac Eric 1Cardot Jean-Michel1
1 Biopharmaceutical department, Faculty of Pharmacy, University of Auvergne 28 Place H.
Dunant, BP 38, 63001 Clermont-Ferrand France 2 F. Hoffmann-La Roche Ltd. Pharmaceutical Division, Galenical & Analytical Development.
CH-4070, Basel, Switzerland
E-Mails: [email protected]; [email protected];
[email protected] ; [email protected]
*Author to whom correspondence should be addressed: Tel: +41616886357 ; Fax
+41616870280

Page 127 of 201
Abstract:
Standard compendia dissolution apparatus are the first choice for development of new
dissolution methods. Nevertheless, limitations coming from the amount of material available,
analytical sensitivity, lack of discrimination or biorelevance may warrant the use of non
compendial methods. With this regard, the use of small volume dissolution methods offers
strong advantages. The present study aims primarily to evaluate the dissolution performance of
various drug products having different release mechanisms, using commercially available small
volume USP2 dissolution equipment.
The present series of tests indicate that the small volume dissolution is a useful tool for the
characterization of immediate release drug product. Depending on the release mechanism,
different speed factors are proposed to mimic common one liter vessel performance. In
addition, by increasing the discriminating power of the dissolution method, it potentially
improves know how about formulations and on typical events which are evaluated during
pharmaceutical development such as ageing or scale up. In this regard small volume dissolution
is a method of choice in case of screening for critical quality attribute of rapidly dissolving
tablets, where it is often difficult to detect difference using standard working conditions.
Key words: Dissolution, Small volume, Discrimination, Screening, Quality By Design

Page 128 of 201
1. Introduction
Dissolution testing is a core performance test in pharmaceutical development and quality
control. Dissolution testing more and more evolved to establish relationships with in vivo
performance or with manufacturing Critical Quality Attributes (CQA) in the scope of Quality
by Design (QbD)12. The overall goal is to better control product performance within the life
cycle of a product. For this purpose the use of the classical USP dissolution working conditions
using one liter vessel with basket (respectively USP1) and paddle (respectively USP2) are well
established13,14 and are used as first choice for development of a new dissolution method.
Nevertheless, limitations coming from the amount of material available, analytical sensitivity,
lack of discrimination or biorelevance may warrant the use of non compendial methods. In
particular in early phase development, during screening of drug candidates, formulation is often
developed for studies in animals and dissolution should be ideally conducted using media
simulating the gastrointestinal environment as well as in volumes in line with the animal
physiology15. Another case in which a classical method is not well suited is for low dose drugs
or if the analytical method is not sensitive enough to detect the amount of dissolved drug
precisely due to low concentration of the drug in the formulation16. To overcome those
problems the concept of small-volume dissolution arose recently due to the possibility of using
smaller sample sizes and smaller volumes of media, offering various advantages in view of
substance and material consumption17 and can serve as a valuable tool for dosage form
screening18 or formulation selection in animals.
The present study aims primarily to evaluate the potential of commercially available small
volume USP2 dissolution equipment for the dissolution of solid drug product. This
miniaturized vessel/paddle equipment can be easily fitted, without hardware change or
adaptation, on a classical USP2 system. For this purpose different kind of dissolution release
mechanisms for solid drug products; immediate release (IR), extended release (ER) as well as
low dose tablets, were screened using both standard (one liter) and small volume dissolution
setup. Working conditions to achieve the same dissolution performance for both tests were
sought using the small volume equipment. Attempts to generalize these dissolution working
conditions for new products are discussed. The discriminating power of the method is stressed
through one example of IR tablets by comparing the contribution of the small vessel dissolution
on typical events faced during development such as aging and scale up versus compendial
apparatus.

Page 129 of 201
2. Experimental Section
2.1. Materials
Phosphate buffer, sodium chloride, 37% hydrochloric acid (fuming), 85% ortho-phosphoric
acid, ethanol (99.9%) as well as HPLC grade methanol were purchased from Merck
(Darmstadt, Germany). Water was obtained from a Milli-Q (Millipore, Milford, MA, USA)
water purification system. For all tests GR grade material was used.
2.2. Methods
Dissolution experiments were performed using a Sotax AT7 smart apparatus (Sotax,
Allschwill, CH). The small volume vessel is based on the USP one liter vessel setup, scaled
down to be used with 50 mL to 200 mL of dissolution medium with an internal diameter of 40
mm. The Sotax small volume vessel is a single device and offers the advantage to be installed
directly on existing equipment. A small paddle of 29 mm length fitted at 10 mm from bottom
of the vessel is used. An overview of the small volume set up is presented Figure 1 and the
different sizes of the small volume equipments are listed in Table 1. The investigations were
conducted in 150 mL, working conditions that allow providing sink condition for all tested
products.
The aim of the series of tests was to establish a relationship between the reference one liter
vessel method (using 900 ml or 500 ml of media) and the small vessel. For this purpose the
rotation speed of the small vessel system was varied from 50 rpm up to 150 rpm to evaluate the
speed factor (sf) between both methods. All the tests were performed in triplicates for
screening purpose and with 6 units during the evaluation of scale up and ageing with one
example in order to confirm the early findings and assess the potential of the method during
development. An overview of the dissolution working conditions for the classical one liter
dissolution method is presented Table 2. The samples were collected semi automatically,
filtrated and measured according to USP or by validated UV or HPLC methods. For all tests
the same dissolution apparatus was used.
2.3. Model compounds
Five different products exhibiting different type of release rates were chosen. Both
Performance Verification Test tablets (prednisone and salicylic acid, disintegrating and non
disintegrating tablets respectively) were bought at USP, Rockville USA. Experimental IR
formulations and ER tablet formulations were supplied by Roche Pharmaceutical Research

Page 130 of 201
department, Basel, CH. The ER tablets formulations were produced by wet granulation using
different amounts of HPMC to achieve, 4 hours (ER4H) and 8 hours (ER8H) release profiles.
The IR formulations are either immediate release, low dose tablet (IR(1)) or a very rapidly
dissolving tablet IR(2), both exhibiting 85% dissolved within 15 minutes in classical
conditions.
The API of these five drug products exhibit high or low solubility according to the
biopharmaceutical classification system (BCS)19. However the medium chosen during these
investigations were set up in order to reach sink conditions in 150 ml. For each product, the
same medium was used for the one liter and for the small vessel testing. An overview of the
tablet types and properties is listed in Table 2.
For IR(2), comparison after storage 3 months at 25°C/ 60 % relative humidity (r.h.) and
40°C/75% r.h. according to ICH conditions and after scale up (8kg to 15kg) were performed
using both methods.
2.4. In vitro dissolution test comparison
For the screening purpose of the study, in addition to a visual comparison of the dissolution
profiles, where the shape and the plateau of the curves were estimated, the closeness of the
profiles was assessed by calculating the ratio of percent dissolved at each time point according
to equation 1 and the mean ratio for all sampling points was assessed using equation 2.
Ө(t) = Dsmall (t) / Dref (t) eq1
Өmean = n
tRn
t∑=1
)( eq2
Ө(t) represents the ratio at time t, Dsmall the percent dissolved for the small volume method
and Dref the percent dissolved for the reference method (so called one liter). Өmean represents
of mean of the Ө(t).
A Өmean close to one are sought with a ratio stable all along the profile. Өmean above 1 would
mean that the profiles have the tendency to be faster than the reference. Өmean below 1 would
mean that the profiles have the tendency to be slower than the reference. Applying such a ratio
assumes that the dissolution curves exhibit similar profiles with only a difference in the rate of
dissolution. The f2 factors20 were calculated on the mean dissolution values as an additional
factor to the Өmean.

Page 131 of 201
3. Results and Discussion
The Figures 2 to 8 show the mean dissolutions profiles of all tested variants and Table 3
shows the mean of the ratios. Similar findings were found for the ratios and the f2 factors. No
coning or mounting was observed using the small volume vessel except for the prednisone
disintegrating tablets what was also seen for the one liter vessel. Similar curves shapes were
observed for prednisone, salicylic acid as well as for ER tablets. Slight different curves shape
and time to reach the plateau were observed for the IR(1) and IR(2) tablets. For all dissolution
experiments, the observed standard deviations (SD) are low (maximum of 6% at first sampling
point and below 5% for the next sampling points). The SD are similar for both small volume
and one liter methods through the entire profiles.
The small volume vessels using the identical rotation speed as for the one liter vessel showed
a lower percent of drug dissolved for most of the methods except for the slowest ER8H using
paddle at 50 rpm.
For prednisone (Figure 2), a small vessel/paddle at 125 rpm results in a similar profile
compared to the USP paddle 50 rpm method. This corresponds to a speed factor (sf) of 2.5 (sf =
2.5).
For salicylic acid non-disintegrating tablets (Figure 3), a small vessel/paddle at 150 rpm results
in a similar profile to the USP paddle 100 rpm method (sf =1.5).
For the extended release tablets ER4H and ER8H (Figure 4), the impact of the small
vessel/paddle setup is less pronounced. By varying the rotation speed from 50 to 100 rpm,
similar profiles can be observed and the ratios remain very close.
For the IR(1) tablets (Figure 5), both motion speeds at 100 rpm and 125 rpm using small
vessel/paddle result in a similar profile to the one liter method with paddle at 50 rpm (sf = 2.5).
For the IR(2) tablets (Figure 6), small vessel/paddle at 125 rpm results in similar profiles to
the one liter method at paddle 50 rpm method (sf =2.5).
The comparison of samples after storage (Figure 7) does not show difference whereas after
scale up (Figure 8) a new trend is visible only using the small vessel at 50 rpm.
All those results are summarized in Table 4.
These investigations clearly showed that using the small vessel set up, equivalent or higher
rotational speeds are necessary to obtain similar dissolution rates when compared to the one
liter vessel. Speed factors from 1 to 2.5 have been observed (see Table 4).
A theoretical calculation of the rotation speed needed for the small paddle to reach the velocity
of the large paddle at 50 rpm was performed based on the differences of the paddle sizes (Table
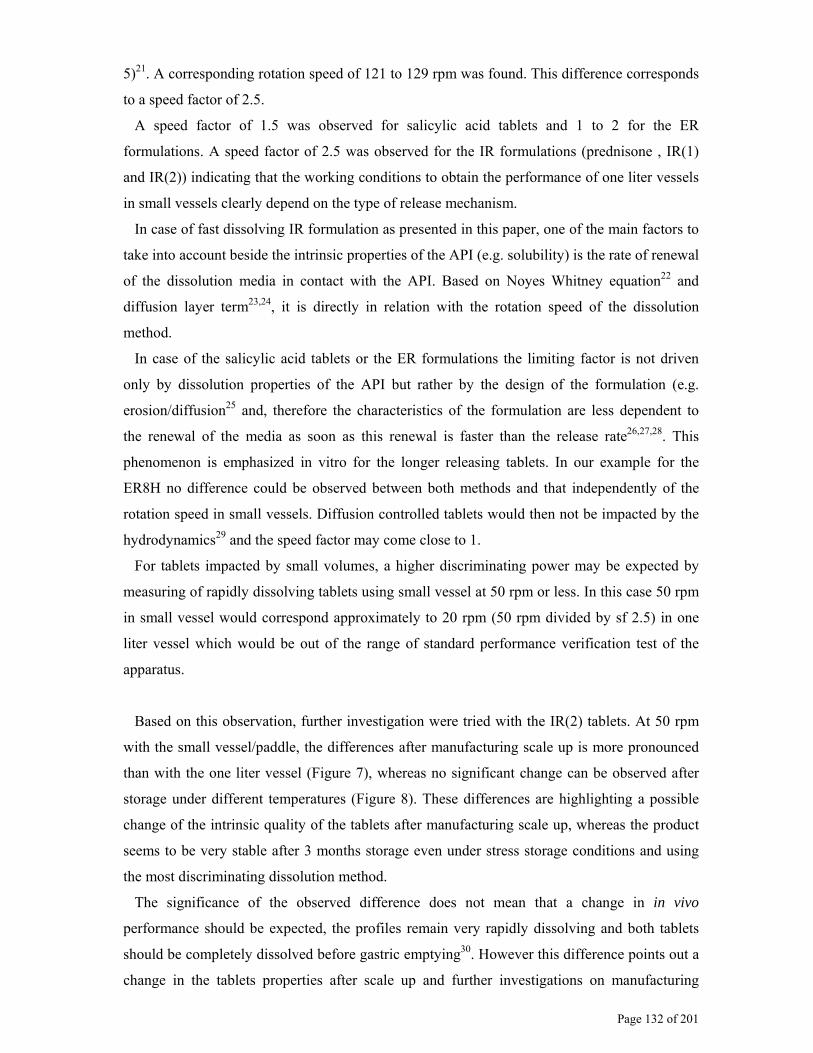
Page 132 of 201
5)21. A corresponding rotation speed of 121 to 129 rpm was found. This difference corresponds
to a speed factor of 2.5.
A speed factor of 1.5 was observed for salicylic acid tablets and 1 to 2 for the ER
formulations. A speed factor of 2.5 was observed for the IR formulations (prednisone , IR(1)
and IR(2)) indicating that the working conditions to obtain the performance of one liter vessels
in small vessels clearly depend on the type of release mechanism.
In case of fast dissolving IR formulation as presented in this paper, one of the main factors to
take into account beside the intrinsic properties of the API (e.g. solubility) is the rate of renewal
of the dissolution media in contact with the API. Based on Noyes Whitney equation22 and
diffusion layer term23,24, it is directly in relation with the rotation speed of the dissolution
method.
In case of the salicylic acid tablets or the ER formulations the limiting factor is not driven
only by dissolution properties of the API but rather by the design of the formulation (e.g.
erosion/diffusion25 and, therefore the characteristics of the formulation are less dependent to
the renewal of the media as soon as this renewal is faster than the release rate26,27,28. This
phenomenon is emphasized in vitro for the longer releasing tablets. In our example for the
ER8H no difference could be observed between both methods and that independently of the
rotation speed in small vessels. Diffusion controlled tablets would then not be impacted by the
hydrodynamics29 and the speed factor may come close to 1.
For tablets impacted by small volumes, a higher discriminating power may be expected by
measuring of rapidly dissolving tablets using small vessel at 50 rpm or less. In this case 50 rpm
in small vessel would correspond approximately to 20 rpm (50 rpm divided by sf 2.5) in one
liter vessel which would be out of the range of standard performance verification test of the
apparatus.
Based on this observation, further investigation were tried with the IR(2) tablets. At 50 rpm
with the small vessel/paddle, the differences after manufacturing scale up is more pronounced
than with the one liter vessel (Figure 7), whereas no significant change can be observed after
storage under different temperatures (Figure 8). These differences are highlighting a possible
change of the intrinsic quality of the tablets after manufacturing scale up, whereas the product
seems to be very stable after 3 months storage even under stress storage conditions and using
the most discriminating dissolution method.
The significance of the observed difference does not mean that a change in in vivo
performance should be expected, the profiles remain very rapidly dissolving and both tablets
should be completely dissolved before gastric emptying30. However this difference points out a
change in the tablets properties after scale up and further investigations on manufacturing

Page 133 of 201
parameters and resulting solid state properties may be initiated. In this regard the small vessel
dissolution method supports a better process understanding and is in line with a QbD approach.
Results from the present series of tests indicated that the small paddle apparatus might be a
useful tool in characterizing drug release profiles under standard test conditions mainly to IR
and disintegrating tablets as it was shown to be more discriminant.
Takano et al31 showed that small volumes can also be applied for low soluble molecules even
under non sink conditions
During development of small volume method, it is important to take into account that the
current small or low volume vessels are non compendial. The commercially available vessels
are well defined32 but there are still differences from supplier to supplier. It was demonstrated
that differences in the actual compendia apparatuses existed between suppliers even if within
the standardized dimensions and that those differences affected marginally the results33. In case
of small volume vessels there is no currently fixed dimension between suppliers. This means
that each investigation should be carry out specifically and that transfer is more complicated
than using classical pharmacopeia one litre vessel.
The discriminating power of the small volume method seems more pronounced for IR
compared to ER formulations. It is therefore recommended to systematically integrate small
volume methods in the screening of new methods for IR formulation.
4. Conclusion
This limited set of data clearly showed that the small volume apparatus is a useful tool in the
characterization of solid drug product dissolution profiles. It can be easily installed in a
standard laboratory, it uses standardised working conditions and can be set up to fit to the
common one litre vessel performance when the dissolution method is not rugged enough for
instance with an analytical method having an improper sensitivity. In addition beside the
advantage of using smaller volumes of media, it potentially allows to expand the discriminating
power of a method by applying gentle agitation which is particularly important for IR and
disintegration tablets. Only two IR tablets within sink conditions were exemplified and further
tests should be initiated to consolidate these first outcomes. Nevertheless these data taken as
starting point showed that this approach improves know how about formulations, the process
and is a method of choice in case for instance of screening for CQA of rapidly dissolving
tablets where it is often difficult to detect difference using standard working conditions.
Conflict of Interest
There is no conflict of Interest.

Page 134 of 201
Acknowledgement
The authors acknowledge: C. Keiflin, P. Wininger, C. Maureta, M. Brach, Y. Ducommun
for technical assistance and Dr. B. Fischer for managerial support.
References and Notes
12 ICH. Harmonised Tripartite Guideline. International committee of harmonisation of technical requirements for registration of pharmaceuticals for human use. Q8: Pharmaceutical Development. 2004 (EMEA/CHMP/167068/2004)
13 EP. European Pharmacopoeia. 2.9.3: Dissolution for solid oral dosage forms. Strasbourg, France: The Council of Europe (European Directorate for the Quality of Medicines & Healthcare) 2009.
14 United States Pharmacopeia in U.S. General Chapters <711> Dissolution and <724> Drug Release in The United States Pharmacopeia 2009 (USP 32). Convention, Inc., Rockville, MD.
15 Gu, C. H.; Gandhi, R. B.; Tay, L. K.; Zhou, S.; Raghavan, K. Importance of using physiologically relevant volume of dissolution medium to correlate the oral exposure of formulations of BMS-480188 mesylate. Int J Pharm. 2004, 269(1), 195-202.
16 Avdeef, A. Solubility of Sparingly Soluble Ionizable Drugs. Adv. Drug Deliv. 2007, 59, 7, 568–590.
17 Klein, S.; Shah, V. The Mini Paddle Apparatus a Useful Tool in the Early Developmental Stage? Experiences with Immediate-Release Dosage Forms. Dissolution Technologies 2006, 13, 6-11.
18 Wyttenbach, N.; Alker, A.; Grassmann, O.; Scheubel, E. Tenoxicam-Methhylparaben Cocrystal Formation in Aqueous Suspension Formulation. Poster AAPS 2009, Annual meeting.
19 Amidon, G.; Lennernas, L.H.; Shah, VP.; Crison, JR. A Theoretical Basis for a Biopharmaceutic Drug Classification: The Correlation of In Vitro Drug Product Dissolution and In Vivo Bioavailability. Pharm. Res. 1995, 12, 3, 413–420.
20 FDA. Guidance for Industry. Immediate Release Solid Oral Dosage Forms. Scale-up and Postapproval Changes:Chemistry, Manufacturing, and Controls, In vitro Dissolution Testing and In vivo Bioequivalence Documentation. US Food and Drug Administration, Center for Drug Evaluation and Research, 1995 USA, http://www.fda.gov/cder/guidance/cmc5.pdf.
21 Cornelius Lentner. Geigy Scientific Tables, Vol. 1: Units of Measurement, Body Fluid, Composition of Body, and Nutrition. 1981. Angular acceleration. ISBN-10: 0-914168-50-9
22 Noyes, A.; Whithney, W.R. The rate of solution of solid substances in their own solutions. J. Am. Chem. Soc. 1897, 19, 930-934.
23 Brunner, E. Velocity of reaction in non-homogeneous systems. Zeit. physikal. Chem. 1904, 47, 56–102.

Page 135 of 201
24 Emami, J. In vitro - in vivo correlation: from theory to applications. J Pharm Pharm Sci. 2006, 9(2), 169-189.
25 Royce, A.; Li, S.; Weaver, M.; Shah, U. In vivo and in vitro evaluation of three controlled release principles of 6-N-cyclohexyl-2'-O-methyladenosine. J Control Release 2004, 97, 1, 79-90.
26 Morihara, M.; Aoyagi, N.; Kaniwa, N.; Katori, N.; Kojim, S. Hydrodynamic flows around tablets in different pharmacopeias dissolution tests. Drug Dev. Ind. Pharm. 2002, 28, 655–662.
27 D’Arcy, D.M.; Corrigan, O.I.; Healy, A.M. Hydrodynamic simulation (CFD) of asymmetrically positioned tablets in the paddle dissolution apparatus: impact on dissolution rate and variability. J. Pharm. Pharmacol. 2005, 57, 1243–1250.
28 D’Arcy, D.M.; Corrigan, O.I.; Healy, A.M. Evaluation of hydrodynamics in the basket dissolution apparatus using computational fluid dynamics-Dissolution rate implications. Eur. J. Pharm. Sci. 2006, 27,259-267.
29 Royce, A. In vivo and in vitro evaluation of three controlled release principles of 6-N-cyclohexyl-2'-O-methyladenosine. J Control Release 2004. 97(1), 79-90.
30 Dickinson, P. A.; Lee, W. W.; Stott, P. W.; Townsend, A. I.; Smart, J. P.; Ghahramani, P.; Hammett, T.; Billett, L.; Behn, S.; Gibb, R. C.; Abrahamsson, B. Clinical relevance of dissolution testing in quality by design. Aaps J. 2008, 10, 2, 380-390.
31 Takano, R.; Sugano, K.; Higashida, A.; Hayashi, Y.; Machida, M.; Aso, Y.; Yamashita, S. Oral absorption of poorly water-soluble drugs: computer simulation of fraction absorbed in humans from a miniscale dissolution test. Pharm Res. 2006, 23, 6, 1144-1156.
32 Crist. G.B. Trends in small-Volume Dissolution Apparatus for Low Dose Compounds. Dissolution Technologies 2009, 16, 1.
33 Deng, G.; Ashley, A. J., Brown, W. E.; Eaton, J. W.; Hauck, W. W.; Kikwai, L. C.; Liddell, M. R.; Manning, R. G.; Munoz, J. M.; Nithyanandan, P.; Glasgow, M. J.; Stippler, E.; Wahab, S. Z. and Williams, R. L. The USP Performance Verification Test, Part I: USP Lot P Prednisone Tablets: quality attributes and experimental variables contributing to dissolution variance. Pharm Res. 2008, 25, 5, 1100-1109

Page 136 of 201
Figure 14 : Small volume vessel setup with small Paddle. On left side, the compendial one liter
vessel with paddle.

Page 137 of 201
Figure 15: Prednisone tablets with small vessel / paddle versus USP method with one liter
vessel.
0
10
20
30
40
50
60
70
80
90
100
0 10 20 30 40 50 60
time (min)
% d
isso
lved
P0E203 - Paddle 50 rpm in 200 ml P0E203 - Paddle 75 rpm in 200 ml P0E203 - Paddle 100 rpm in 200 ml
P0E203 - Paddle 125 rpm in 200 ml P0E203 - Paddle 110 rpm in 200 ml P0E203 - Paddle 50 rpm in 500 ml
Figure 16 : Salicylic acid tablets with small vessel / paddle versus USP method with one liter
vessel.
0
5
10
15
20
25
30
35
40
0 10 20 30 40 50 60 70
time (min)
% d
isso
lved
Q0D200 - Paddle 150 rpm in 150 ml Q0D200 - Paddle 100 rpm in 150 ml Q0D200 - Paddle 100 rpm in 900 ml

Page 138 of 201
Figure 17 : ER4H and ER8H tablets: comparison of small vessel/paddle versus one liter Vessel
0
20
40
60
80
100
0 100 200 300 400 500 600 700 800
time (min)
% d
isso
lved
ER4H Paddle 50 rpm in 500 ml ER4H Paddle 50 rpm in 150 ml ER4H Paddle 100 rpm in 150 ml
ER8H Paddle 50 rpm in 500 ml ER8H Paddle 50 rpm in 150 ml ER8H Paddle 100 rpm in 150 ml
Figure 18 : IR(1) tablets: comparison of small vessel/paddle versus one liter Vessel
0
20
40
60
80
100
0 5 10 15 20 25 30 35 40 45 50
time (min)
% d
isso
lved
Paddle 50 rpm in 500 ml Paddle 50 rpm in 150 ml Paddle 75 rpm in 150 ml Paddle 100 rpm in 150 ml Paddle 120 rpm in 150 ml

Page 139 of 201
Figure 19 : IR(2) tablets: comparison of small vessel/paddle versus one liter Vessel
0
10
20
30
40
50
60
70
80
90
100
0 5 10 15 20 25 30
time (min)
% d
isso
lved
Paddle 50 rpm in 900 ml Paddle 50 rpm in 150 ml Paddle 75 rpm in 150 ml Paddle 100 rpm in 150 ml Paddle 125 rpm in 150 ml
Figure 20 : IR(2) tablets: comparison after scale up using small vessel/paddle
0
20
40
60
80
100
0 10 20 30 40 50 60 70
time (min)
% d
isso
lved
pilot scale Paddle 50 rpm in 900 ml small scale Paddle 50 rpm in 900 ml
small scale Paddle 50 rpm in 150 ml pilot scale Paddle 50 rpm in 150 ml

Page 140 of 201
Figure 21 : IR(2) tablets: comparison after storage using small vessel/paddle
0
10
20
30
40
50
60
70
80
90
100
0 5 10 15 20 25 30
time (min)
% d
isso
lved
25°C @ 60% r.h. Paddle 50 rpm in 150 ml 40°C @ 75% r.h. Paddle 50 rpm in 150 ml
25°C @ 60% r.h. Paddle 50 rpm in 900 ml 40°C @ 75% r.h. Paddle 50 rpm in 900 ml

Page 141 of 201
List of Tables
Table 5: Dissolution – Difference in Dimension (mm) of the small and USP Vessels and Paddle.
USP one liter vessel Small volume
Apparatus
Vessel
Height 168 ± 8 185
Internal diameter 102 ± 4 4
Paddle
Blade Upper chord 74.0 ± 0.5 29
Blade Lower chord 42.0 ± 1.0 18
Height 19.0 ± 1.0 7.5
Distance from the bottom 25 ± 2 10
Table 6: Overview of the tablets and release mechanisms tested using both dissolution methods
Product Strength
(mg)
BCS
class
Dissolution method
with one liter vessel
Release
mechanism
Tablets
types
Prednisone 10 mg 1 500 mL Paddle 50 rpm IR Disintegrating
Salicylic acid 300 mg 3 900 mL Paddle 100 rpm ER Non-disintegrating
ER4H / ER8H 1 mg 2 500 mL Paddle 50 rpm ER Erosion-Diffusion
IR(1) 0.075 mg 1 500 mL Paddle 50 rpm IR Disintegrating
IR(2) 50 mg 2 900 mL Paddle 50 rpm IR Disintegrating
ER = Extended Release; IR = Immediate Release

Page 142 of 201
Table 3: Mean of ratio (Өmean) percent dissolved between small and one liter dissolution at different rotation speeds. Best values are in bold
Small vessel rotation speed Product Reference Method
50 rpm 75 rpm 100 rpm 110 rpm 125 pm 150 rpm
Prednisone Paddle 50 rpm 0.39 0.48 0.67 0.85* 1.05* -
Salicylic acid Paddle 100 rpm - - 0.76* - - 0.96*
ER4H Paddle 50 rpm 0.93* - 0.98* - - -
ER8H Paddle 50 rpm 1.01* - 1.05* - - -
IR(1) Paddle 50 rpm 0.59 0.79 0.95* - 0.98* -
IR(2) Paddle 50 rpm 0.57 0.71 0.86 - 0.99* -
* indicates the f2 factors between small and one liter vessel with a value above 50.
Table 4: Found rotation speed factors using small vessel versus one liter vessel to reach the same performance.
Tablet type Product Dissolution
method
Rotation
speed using
one liter
vessel
Rotation
speed
using
small vessel
Rotation
speed Factor
(sf)
disintegrating Prednisone Paddle 50 125 2.5
disintegrating IR(1) Paddle 50 125 2.5
disintegrating IR(2) Paddle 50 125 2.5
Non-disintegrating Salicylic acid Paddle 100 150 1.5
Non disintegrating ER4H Paddle 50 50-100 1-2
Non disintegrating ER8H Paddle 50 50-100 1-2

Page 143 of 201
Table 5: Theoretical calculation of hydrodynamics difference between small paddle and large paddle.
Equation Length on top of the
paddle
Length on bottom of
the paddle
small large small large units
Rotation R 100.00 50.00 100.00 50.00 rpm
Frequency F R/60 1.67 0.83 1.67 0.83 Hz
Periodicity T 1/F 0.60 1.20 0.60 1.20 s
Angular velocity W 2pi/T 10.51 5.25 10.51 5.25 rad.s-1
1/2 lenght R 14.50 37.25 8.70 21.00 mm
Linear speed on
top of the paddle V R*W 152.33 195.66 91.40 110.31 cm s-1
Calculation of
the angular
velocity for the
small paddle W 13.49 12.68 rad.s-1
Periodicity T 0.47 0.50 s
Frequency F 2.15 2.02 Hz
128.86 =>129 121.07 =>121 rpm

Page 144 of 201
Small Volume Dissolution Testing as Powerful Method during
Pharmaceutical Development
Supplement 1:” Small Volume Dissolution Testing using Basket method”.
Introduction
In connection with the investigations performed with small volume associated with small
paddle (resp. USP2) as described in paper 3, additional testing’s were initiated for the basket
method (resp. USP1). A difference between paddle and basket was observed in the literature
using classical one liter vessel where the mixing ability of the paddle is higher than basket at
the same operating speed (Morihara et al., 2002; D’Arcy et al., 2005;D’Arcy et al., 2006).The
goal of the study was as sought for the paddle, to explore if a relationship small – large volume
can be found.
Materiel and methods
The tablets defined for the PVT were investigated using the basket method as reference.
Dissolution experiments were performed using a Sotax AT7 smart apparatus (Sotax,
Allschwill, CH). The small volume vessels described in paper 3 were further utilised. Standard
USP baskets fitted at 10 mm from bottom of the vessel have been used. An overview of the
small volume set up for the basket (and paddle for comparison) is presented Figure 1 and the
different sizes of the small volume equipments are listed in Table 1 of paper 3 (data not
repeated). The tests were conducted in 150 mL that allowed providing sink condition for all
tested products. In order to match the reference profile performed in a one liter vessel, working
conditions were screened by varying the rotation speed from 50 rpm up to 150 rpm depending
on the found profiles. An overview of the dissolution working conditions for the classical one
liter dissolution set up is presented Table 1. All the tests were performed in triplicates. The
samples were collected semi automatically, filtrated and measured according to USP or by
validated UV or HPLC methods. For all the tests the same dissolution apparatus was used.
The similarity of the profiles were assessed using the ratio mentioned in paper 3 and the f2
similarity factor (as well with the limitations mentioned in paper 3)

Page 145 of 201
Results
The Figures 2 and 3 show the mean dissolutions profiles of both variants and Table 2 shows the
mean of the ratios calculated for each drug product resp. the f2 factors, using the one liter
method as reference.
Similar curves shapes for small volume and one liter vessel were observed for prednisone and
salicylic acid respectively.
For all dissolution experiments, the observed standard deviations (SD) are low (maximum of
5% at first sampling point and below for the next sampling points). The SD are similar for both
small volume and one liter methods through the entire profiles. The triplicate determination
allows therefore performing a reasonable profile comparison using the mean values with
enough confidence for a screening.
For prednisone (Figure 2) a similar profile to the basket 50 rpm USP method can be achieved
using a rotation speed of 75 rpm using the small volume vessel (speed factor 1.5). The data are
summarized Table 1 and Table2.
For salicylic acid non-disintegrating tablets (Figure 3), with the USP basket method at 100 rpm,
comparable profiles can be observed for 100 rpm and 150 rpm using the small vessels (speed
factor 1 or 1.5). The results are summarized in the Table 1.
Table 1: Mean of ratio percent dissolved between small and one liter dissolution at different
rotation speeds. Best values are in bold
Small vessel rotation speed Product Reference Method
50 rpm 75 rpm 100 rpm 150 rpm
Prednisone basket 50 rpm 0.82 1.09* - -
Salicylic acid basket 100 rpm - - 0.94* 1.10*
* indicated the f2 factors between small and one liter vessel where a value above 50 can be
found.

Page 146 of 201
Table 2: Found rotation speed factors using small vessel versus one liter vessel to reach the
similar performance (best matched).
Tablet type Product Dissolution
method
Rotation speed
using
one liter vessel
Rotation
speed
using
small vessel
Rotation
speed
Factor
desintegrating Prednisone basket 50 75 1.5
Non
desintegrating Salicylic acid basket 100 100 1
Figure 1 : Small volume vessel setup with small Paddle and Basket. On left side, the
compendial one liter vessel with paddle.

Page 147 of 201
Figure2: Prednisone tablets with small volume vessels and basket versus USP method with one
liter vessel.
0
10
20
30
40
50
60
70
80
90
100
0 10 20 30 40 50 60
time (min)
% d
isso
lved
POE203 - Basket 50 rpm in 500 ml POE203 - Basket 50 rpm in 150 ml POE203 - Basket 75 rpm in 150 ml
Figure 3 : Salicylic acid tablets with small volume vessel and basket versus USP method with
one liter vessel.
0
10
20
30
40
50
60
0 10 20 30 40 50 60 70
time (min)
% d
isso
lved
Q0D200 - Basket 100 rpm in 150 ml Q0D200 - Basket 150 rpm in 150 ml Q0D200 - Basket 100 rpm in 900 ml

Page 148 of 201
Discussion
These investigations clearly showed that using the small vessel set up, equivalent or higher
rotational speeds are necessary to obtain similar dissolution rates when compared to the one
liter vessel.
For test performance tablets (prednisone) a common speed factor of 1.5 could be estimated
between the two vessels using basket. For test performance tablets (salicylic acid) no clear
difference can be observed. As for the paddle investigations, the observed response clearly
depends on the tablets type. For the prednisone however, the difference observed is primary
due to
Conclusion
The use the small volume vessel associated with basket can be easily installed in all standard
laboratories. However it shows less advantage in view of discriminating power in comparison
to the mini paddle. This approach using basket needs definitively further investigations with
broader type of products. As well new testing on small basket recently available should be
initiated to fine tune this approach.
Acknowledgement
The authors acknowledge: C. Keiflin, P. Wininger, C. Maureta, M. Brach, Y. Ducommun for
technical assistance and Dr. B. Fischer for managerial support.
Reference supplement 1
D’Arcy, D.M., Corrigan, O.I., Healy, A.M., 2006. Evaluation of hydrodynamics in the basket dissolution apparatus using computational fluid dynamics-Dissolution rate implications. Eur. J. Pharm. Sci., 27,259-267. D’Arcy, D.M., Corrigan, O.I., Healy, A.M.,2005. Hydrodynamic simulation (CFD) of asymmetrically positioned tablets in the paddle dissolution apparatus: impact on dissolution rate and variability. J. Pharm. Pharmacol., 57,1243–1250. Morihara, M., Aoyagi, N., Kaniwa, N., Katori, N., Kojim, S.,2002. Hydrodynamic flows around tablets in different pharmacopeial dissolution tests. Drug Dev. Ind. Pharm., 28:655–662.
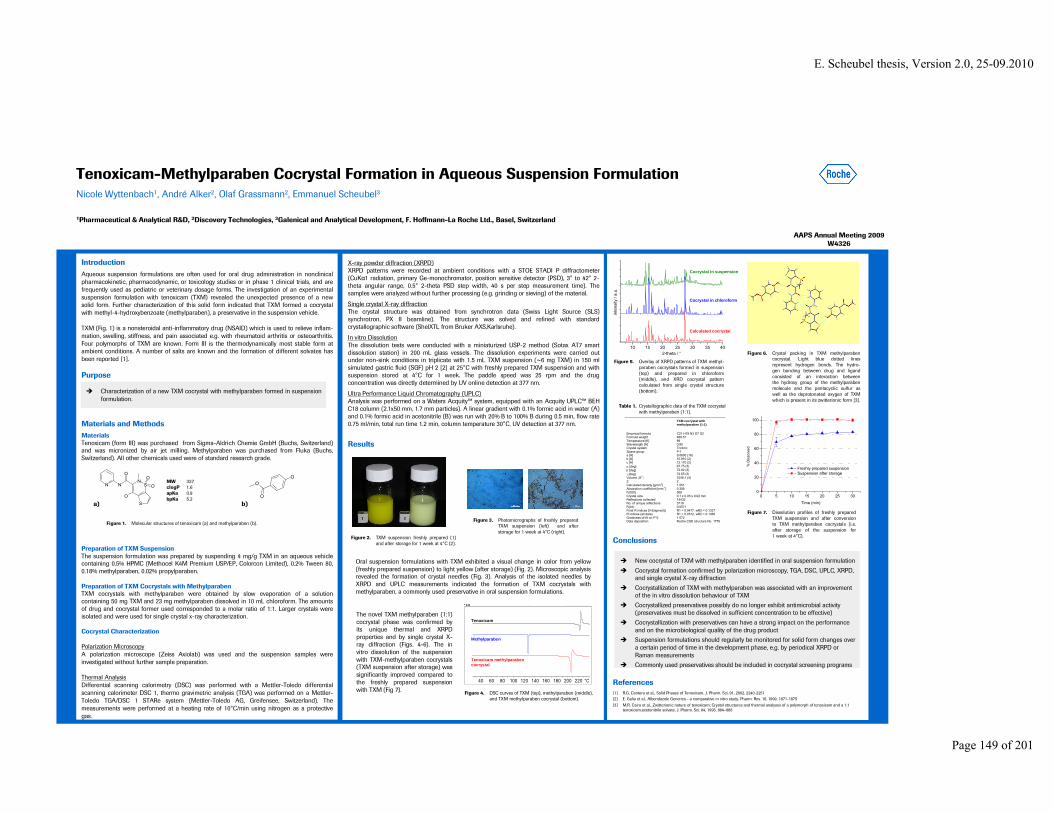
E. Scheubel thesis, Version 2.0, 25-09.2010
Page 149 of 201
IntroductionAqueous suspension formulations are often used for oral drug administration in nonclinical pharmacokinetic, pharmacodynamic, or toxicology studies or in phase 1 clinical trials, and are frequently used as pediatric or veterinary dosage forms. The investigation of an experimental suspension formulation with tenoxicam (TXM) revealed the unexpected presence of a new solid form. Further characterization of this solid form indicated that TXM formed a cocrystalwith methyl-4-hydroxybenzoate (methylparaben), a preservative in the suspension vehicle.
TXM (Fig. 1) is a nonsteroidal anti-inflammatory drug (NSAID) which is used to relieve inflam-mation, swelling, stiffness, and pain associated e.g. with rheumatoid arthritis or osteoarthritis.Four polymorphs of TXM are known. Form III is the thermodynamically most stable form at ambient conditions. A number of salts are known and the formation of different solvates has been reported [1].
Purpose
Materials and MethodsMaterialsTenoxicam (form III) was purchased from Sigma-Aldrich Chemie GmbH (Buchs, Switzerland) and was micronized by air jet milling. Methylparaben was purchased from Fluka (Buchs, Switzerland). All other chemicals used were of standard research grade.
Preparation of TXM SuspensionThe suspension formulation was prepared by suspending 4 mg/g TXM in an aqueous vehiclecontaining 0.5% HPMC (Methocel K4M Premium USP/EP, Colorcon Limited), 0.2% Tween 80, 0.18% methylparaben, 0.02% propylparaben.
Preparation of TXM Cocrystals with MethylparabenTXM cocrystals with methylparaben were obtained by slow evaporation of a solution containing 50 mg TXM and 23 mg methylparaben dissolved in 10 mL chloroform. The amounts of drug and cocrystal former used corresponded to a molar ratio of 1:1. Larger crystals were isolated and were used for single crystal x-ray characterization.
Cocrystal Characterization
Polarization MicroscopyA polarization microscope (Zeiss Axiolab) was used and the suspension samples were investigated without further sample preparation.
Thermal AnalysisDifferential scanning calorimetry (DSC) was performed with a Mettler-Toledo differential scanning calorimeter DSC 1, thermo gravimetric analysis (TGA) was performed on a Mettler-Toledo TGA/DSC 1 STARe system (Mettler-Toledo AG, Greifensee, Switzerland). The measurements were performed at a heating rate of 10°C/min using nitrogen as a protective gas.
X-ray powder diffraction (XRPD)XRPD patterns were recorded at ambient conditions with a STOE STADI P diffractometer(CuKα1 radiation, primary Ge-monochromator, position sensitive detector (PSD), 3° to 42° 2-theta angular range, 0.5° 2-theta PSD step width, 40 s per step measurement time). The samples were analyzed without further processing (e.g. grinding or sieving) of the material.
Single crystal X-ray diffractionThe crystal structure was obtained from synchrotron data (Swiss Light Source (SLS) synchrotron, PX II beamline). The structure was solved and refined with standard crystallographic software (ShelXTL from Bruker AXS,Karlsruhe).
In vitro DissolutionThe dissolution tests were conducted with a miniaturized USP-2 method (Sotax AT7 smart dissolution station) in 200 mL glass vessels. The dissolution experiments were carried out under non-sink conditions in triplicate with 1.5 mL TXM suspension (~6 mg TXM) in 150 ml simulated gastric fluid (SGF) pH 2 [2] at 25°C with freshly prepared TXM suspension and with suspension stored at 4°C for 1 week. The paddle speed was 25 rpm and the drug concentration was directly determined by UV online detection at 377 nm.
Ultra Performance Liquid Chromatography (UPLC)Analysis was performed on a Waters Acquity™ system, equipped with an Acquity UPLC™ BEHC18 column (2.1x50 mm, 1.7 mm particles). A linear gradient with 0.1% formic acid in water (A) and 0.1% formic acid in acetonitrile (B) was run with 20% B to 100% B during 0.5 min, flow rate 0.75 ml/min, total run time 1.2 min, column temperature 30°C, UV detection at 377 nm.
Results
Conclusions
References[1] R.G. Cantera et al., Solid Phases of Tenoxicam. J. Pharm. Sci. 91, 2002, 2240-2251[2] E. Galia et al., Albendazole Generics - a comparative in vitro study. Pharm. Res. 16, 1999, 1871-1875
[3] M.R. Caira et al., Zwitterionic nature of tenoxicam: Crystal structures and thermal analyses of a polymorph of tenoxicam and a 1:1 tenoxicam:acetonitrile solvate. J. Pharm. Sci. 84, 1995, 884–888
Tenoxicam-Methylparaben Cocrystal Formation in Aqueous Suspension FormulationNicole Wyttenbach1, André Alker2, Olaf Grassmann2, Emmanuel Scheubel3
1Pharmaceutical & Analytical R&D, 2Discovery Technologies, 3Galenical and Analytical Development, F. Hoffmann-La Roche Ltd., Basel, Switzerland
Characterization of a new TXM cocrystal with methylparaben formed in suspension formulation.
New cocrystal of TXM with methylparaben identified in oral suspension formulation
Cocrystal formation confirmed by polarization microscopy, TGA, DSC, UPLC, XRPD, and single crystal X-ray diffraction
Cocrystallization of TXM with methylparaben was associated with an improvement of the in vitro dissolution behaviour of TXM
Cocrystallized preservatives possibly do no longer exhibit antimicrobial activity (preservatives must be dissolved in sufficient concentration to be effective)
Cocrystallization with preservatives can have a strong impact on the performance and on the microbiological quality of the drug product
Suspension formulations should regularly be monitored for solid form changes over a certain period of time in the development phase, e.g. by periodical XRPD or Raman measurements
Commonly used preservatives should be included in cocrystal screening programs
Figure 1. Molecular structures of tenoxicam (a) and methylparaben (b).
AAPS Annual Meeting 2009W4326
S
S
O
NO
ON
O
NMW 337clogP 1.6apKa 0.9bpKa 5.2
a) b)
Oral suspension formulations with TXM exhibited a visual change in color from yellow (freshly prepared suspension) to light yellow (after storage) (Fig. 2). Microscopic analysis revealed the formation of crystal needles (Fig. 3). Analysis of the isolated needles by XRPD and UPLC measurements indicated the formation of TXM cocrystals with methylparaben, a commonly used preservative in oral suspension formulations.
Table 1. Crystallographic data of the TXM cocrystalwith methylparaben (1:1).
Figure 2. TXM suspension freshly prepared (1) and after storage for 1 week at 4°C (2).
Figure 3. Photomicrographs of freshly prepared TXM suspension (left) and after storage for 1 week at 4°C (right).
The novel TXM methylparaben (1:1) cocrystal phase was confirmed by its unique thermal and XRPDproperties and by single crystal X-ray diffraction (Figs. 4-6). The in vitro dissolution of the suspension with TXM-methylparaben cocrystals(TXM suspension after storage) was significantly improved compared to the freshly prepared suspension with TXM (Fig 7).
Figure 5. Overlay of XRPD patterns of TXM methyl-paraben cocrystals formed in suspension(top) and prepared in chloroform(middle), and XRD cocrystal pattern calculated from single crystal structure (bottom).
Figure 6. Crystal packing in TXM methylparabencocrystal. Light blue dotted lines represent hydrogen bonds. The hydro-gen bonding between drug and ligandconsisted of an interaction between the hydroxy group of the methylparabenmolecule and the pentacyclic sulfur as well as the deprotonated oxygen of TXMwhich is present in its zwitterionic form [3].
Figure 7. Dissolution profiles of freshly prepared TXM suspension and after conversion to TXM methylparaben cocrystals (i.e. after storage of the suspension for 1 week at 4°C).
O
O
O
TXM cocrystal with methylparaben (1:1)
Empirical formula C21 H19 N3 O7 S2 Formula weight 489.51 Temperature [K] 89 Wavelength [A] 0.80 Crystal system Triclinic Space group P-1 a [Å] 9.0600 (18) b [Å] 10.910 (2) c [Å] 12.170 (2) α [deg] 67.75 (3) β [deg] 72.92 (3) γ [deg] 74.65 (3) Volume[Å3] 1048.1 (4) Z 2 Calculated density [g/cm3] 1.551 Absorption coefficient [mm-1] 0.306 F(000) 508 Crystal size 0.1 x 0.05 x 0.02 mm Reflections collected 14432 No. of unique reflections 3719 R(int) 0.0571 Final R indices [I>2sigma(I)] R1 = 0.0477, wR2 = 0.1327 R indices (all data) R1 = 0.0512, wR2 = 0.1360 Goodness-of-fit on F^2 1.072 Data deposition Roche CSD structure No. 1776
0 5 10 15 20 25 300
20
40
60
80
100
Freshly prepared suspension Suspension after storage
% D
isso
lved
Time (min)
10 15 20 25 30 35 40
inte
nsity
/ a.
u.
2-theta / °
Cocrystal in suspension
Cocrystal in chloroform
Calculated cocrystal
&NWcoco 50964B076-13 DSC Wyt 090108NWcoco 50964B076-13 DSC Wyt 090108, 2.0640 mg
&TXMNWcoco RO0120068-000_A_DSC Wyt 090108, 1.8670 mg
&NWcoco methylparaben DSC Wyt 090824 BNWcoco methylparaben DSC Wyt 090824 B, 1.1620 mg
mW50
°C40 60 80 100 120 140 160 180 200 220
^ e xo T XM 2 5 . 0 8 . 2 0 0 9 0 9 : 5 5 : 1 9
S T A R e S W 9 . 2 0P R T P - B _ 9 3 / 7 5 0 : Ro c he
Tenoxicam
Methylparaben
Tenoxicam methylparabencocrystal
Figure 4. DSC curves of TXM (top), methylparaben (middle), and TXM methylparaben cocrystal (bottom).

Page 150 of 201
The poster , presented at the AAPS annual meeting 2009 (W4326) , was enlarged in three parts
for a better visibility

Page 151 of 201

Page 152 of 201

Page 153 of 201
Conclusion of part 3
The present series of tests indicate that the small volume dissolution is a useful tool for the
characterization of immediate release drug product and can be applied as well already in early
phase development on API. By increasing the discriminating power of the dissolution method,
it potentially improves know how about formulations on typical events which occur during
pharmaceutical development as aging, dose change or scale up.
The accessories investigated in the scope of this third experimental part have very low cost, are
easy to set up and can be used in most of the laboratory where a standard system already exists.
It allows having a robust and reproducible system that can be particularly of interest in early
development phases where during screening, the formulation is often developed for studies in
animals and dissolution should be ideally conducted using media volumes in line with the
animal physiology.
In addition is it to note that the ER4H and ER8H mentioned in the paper 3, correspond to the
ER4H and Er8H investigated in the paper 2. It was shown that the change in hydrodynamics
did not strongly impact the release rate of these tablets, in particular for the Er8H. This was
expected since the main drivers of the release (CQA) was identified as the diffusion
mechanism. The small dissolution equipment does then serve indirectly as well as a good
confirmation of this hypothesis.
With this regard small volume dissolution is a method of choice in case of screening for critical
quality attribute and represents a nice alternative to classical compendial pharmacopeia
systems.
Page 154 of 201
3.4. Experimental part 4
In sharp contrast to the branded pharmaceutical market, which has stalled in recent year, the
generics market is enjoying a period of unprecedented success. In 2005 the world generics
market was worth $45bn, a growth of 14% on the previous year. It is expected this level of
growth to continue. The loss of patent protection by 2009 of almost $80bn worth of top selling
drugs will be the major driving force for this generic market growth.
In the scope of this thesis, the question arose internally at Roche if dissolution can be a good
tools to detect difference between Mycophenolate Mofetil (MMF) formulations.
The aim of this 4th experimental part was to compare the original brand CellCept® 500 mg
tablets with generic products which are commercially available around the World using in vitro
dissolution testing. In addition to the ANDA method, investigation were undertaken to simulate
in vitro the difference in performance due for instance to food intake or to highlight any other
difference in view of in vitro performance.
For the same API, differences in solid state properties, formulation and / or manufacturing can
lead to differences in bioavailability from one finished product to another. As the in vivo drug
dissolution is the rate-limiting factor in drug absorption, for BCS class II drugs, the use of
appropriate designed in vitro dissolution tests can potentially discriminate between
formulations with different bioavailability. Different kind of dissolution methods were
investigated based on the physico-chemical properties of the MMF and the data are presented
in paper 4 and its supplements.
The paper 4 entitled “Mycophenolate mofetil: use of simple dissolution technique to assess
difference between innovator and generic formulations” ” was submitted to Pharmaceutical
Technologies.
The data are also well abstracted in a poster entitled “In vitro dissolution of mycophenolate
mofetil: comparison between innovator and generic formulations “which was presented
twice. At BPS Winter meeting 2008, Abstract 0225 and at the ACCP/ESCP International
Congress 2009, Presentation 114E. In conclusion of these investigations, important differences exist between the different generic
formulations with regard to in vitro performance.

Page 155 of 201
In a next step, an exploratory clinical testing was set up to evaluate the pharmacokinetics of
different generics that showed the more pronounced difference. The data are presented as a
supplement 1 to paper 4 entitled “Confirmation of the hypothesis in human “
All the studies and the importance of having a strong discriminating dissolution methods,
IVIVC/R and QbD as well as the general need of having a strategy for brand protection for all
drugs already in the early development is discussed shortly in the conclusion of this 4th parts of
the thesis.
This effort was made by Roche in order to have brand names of products not associated with
therapeutic failure.

Page 156 of 201
Original Article
Mycophenolate mofetil: use of simple dissolution technique to assess
difference between generic formulations
E. Scheubel1,2 *, L. Adamy2 and JM. Cardot1
1 Biopharmaceutical department, Faculty of Pharmacy, University of Auvergne
28 Place H. Dunant, BP 38, 63001 Clermont-Ferrand France 2 F. Hoffmann-La Roche Ltd. Pharmaceutical Division, Galenical & Analytical Development.
CH-4070, Basel, Switzerland
*Author to whom correspondence should be addressed e.mail: [email protected]
Tel: +41616886357 ; Fax +41616870280.

Page 157 of 201
Abstract
Purpose: Mycophenolate mofetil (MMF) is an immunosuppressive agent indicated for the
prophylaxis of acute rejection in patients receiving allogeneic renal, cardiac or hepatic
transplants. It’s a Biopharmaceutics Classification System class II substance that has a strong
pH-dependent solubility profile. Consequently, differences in solid-state properties,
formulation and/or manufacturing processes of MMF can lead to disparities in bioavailability
between brands of the same drug. This study was conducted to compare the in vitro dissolution
profile of the original MMF innovator brand (CellCept*, Roche) with available generic
products. Methods: Two representative batches of CellCept 500 mg tablets and 14 different
generic formulations were tested using different dissolution testing scenarios simulating
conditions in the proximal gastrointestinal tract. These scenarios took into account stomach
and/or small intestine media composition, surface tension, pH, increased buffer capacity and
osmolarity after food intake. Results: Eight of the generic formulations tested passed the
quality control dissolution test (pH 1.1) according to specification Q=75% after 5 min (i.e. all
single units >80% dissolved), and 12 passed the specification Q=85% after 15 min (i.e. all
single units >90% dissolved). This suggests an almost homogenous dissolution rate in an acidic
environment between formulations. However, at pH 4.5, large variations in in vitro dissolution
performance between generic formulations were observed (extremes resulting in more than
60% dissolved difference after 30 mins). Marked variability was seen among the different
generic formulations and between the innovator brand, CellCept.
Conclusion: Important differences exist between the different generic formulations with regard
to in vitro performance. As MMF is required for life-long use, changes in drug performance as
a result of switching between formulations may have serious clinical consequences (e.g. organ
rejection). Therefore, clinical testing is necessary to evaluate the pharmacokinetics and the
impact on clinical safety of a switch between brands.
* CellCept is a registered trade name of Roche Products Ltd.

Page 158 of 201
Key words
Mycophenolate mofetil, generics, dissolution in vitro, switchability.
Short title
Use of dissolution to assess difference between generic formulations
Previous presentation
An abstract of this original paper has been presented at British Pharmacological Society
(BPS) Winter Meeting 2008, Abstract 0225.

Page 159 of 201
Introduction
After patent protection of original brand is expired, healthcare systems are encouraging the use
of generic medicines. While the economic need to limit healthcare costs using generics is not
questioned, it is important to ensure that patient health is not compromised. Equivalence has to
be shown usually based on bioequivalence on healthy volunteers1. However, as generic
products are approved based on comparison with the innovator only2, one could argue that
switching from one generic product to another might give rise to complications due to the
potentially greater disparity between two generic products than between any single generic
product and the innovator. In particular switch from innovator to generic for life long treatment
like immunosuppressive prescription may be of consequence3,4.
Mycophenolate Mofetil (MMF) is an immunosuppressive agent indicated for the prophylaxis
of acute rejection in adult recipients of renal, cardiac or hepatic transplants as well as paediatric
recipients of renal transplants. MMF is currently being prescribed for life long use. MMF is a
weak base classified as a BCS class II5 substance, exhibiting a strong pH dependent solubility
profile (solubility decreases when pH increases). It is absorbed rapidly and hydrolyzed by
esterases to the active metabolite mycophenolic acid (MPA)6. The maximum of absorption
(Cmax) in man is observed after approx 30 minutes in fasted state
For the same API, differences in solid state properties, formulation, excipients and or
manufacturing can lead to differences in bioavailability from one finished product to another7.
As the in vivo drug dissolution can be the rate-limiting factor in drug absorption for BCS class
II8 drugs, the use of appropriate designed in vitro dissolution tests can potentially discriminate
between formulations with different bioavailability. In case of Mycophenolate Mofetil (MMF),
differences in dissolution profiles can potentially be useful predictors of clinical differences9,
since the absorption of this drug with a very short Tmax in fasted state is limited by the
dissolution rate.

Page 160 of 201
The aim of this study was to compare, using classical in vitro dissolution testing, the original
brand CellCept 500 mg tablets with generic drug products which were commercially available
around the world in 2008. In addition to the registered NDA10 (QC) method, investigations
were undertaken to simulate in vitro various conditions which are accounted in vivo.
Material and methods:
Material
Egg lecithin (E PC S, purity >96%) was obtained from Lipoid (Ludwigshafen, Germany) and
sodium taurocholate (NaTC, 97% pure) was used as received from Prodotti Chimici e
Alimentari SpA, Basaluzzo, Italy.
Phosphate buffer, sodium chloride (ACS), 37% hydrochloric acid (fumed), 85% ortho-
phosphoric acid, ethanol (99.9%), acetic acid as well as HPLC grade methanol and acetonitrile
were purchased from Merck (Darmstadt, Germany). Water was obtained from a Milli-Q
(Millipore, Milford, MA, USA) water purification system. Commercial milk (UHT) with at
least 3.5% fat was used.
Two representative marketed batches of Roche CellCept 500 mg tablet and 14 MMF generic
samples from different origins other the world were tested (please note that the generics were
purchased in 2008 from countries where patent was expired.)
Method
The dissolution profiles were conducted using a Sotax AT7 smart apparatus (Sotax, Allschwill,
CH). In addition to the suggested ANDAs method for release (Paddle 50 rpm in HCL10),
different media taking into account stomach and or small intestine media composition, surface
tension, pH, increased buffer capacity, osmolarity and pH change after food intake were
investigated11. The different working conditions are presented in Table 1.
Paddle speed was set at 50 rpm and temperature at 37°C, with n=3 to 12 units depending on the
working conditions or the screening activity. Samples were withdrawn at predefined time

Page 161 of 201
intervals from each vessel and not replaced. Sampling was automated and dissolution samples
were directly filtered and subsequently measured by a validated UV detection method.
The solubility of the MMF was assessed in each dissolution medium mentioned in table 1.
Duplicate samples were incubated with an excess of compound in a 10 ml volumetric flask at
37°C with constant rotation for 4 hours and the dissolved quantity was measured with a
validated HPLC-UV detection method.
To simulate the impact of the pH variations or medium composition on the dissolution behavior
of the 500 mg MMF tablets, the comparisons listed in Table 2 were investigated. The
dissolution profiles were measured independently in each media according to Table 1. For this
first screening only two generics, which have shown the highest difference with regard to
performance using the NDA method were investigated in comparison to CellCept 500 mg.
For comparison of the dissolution profiles, the curves were estimated equivalent in HCl if they
fulfilled the ANDAs specification, The comparison of various CellCept batches allows to fix
the limits at Q=75% after 5 minutes [i.e. Stage 1, all single units greater than 80% dissolved]
and Q= 85% after 15 minutes [i.e. Stage 1, all single units greater than 90% dissolved]. This
first selection step will allow selecting the formulations studied afterward: a generic fulfilling
the requirements and one that does not pass the requirements.
In the other tested media, the similarity factor f212 was calculated for each MMF generic versus
CellCept, where applicable (at least 3 points in the ascending part of the curve with maximum
one above 85%). The FDA13 and EMEA14 recommended that two dissolution profiles are
similar if f2 is between 50 and 100.

Page 162 of 201
Table 1: Dissolution in vitro working conditions used for screening of MMF
Medium pH Volume n= comments
HCL 0.1 N 1.1 900 ml 12 QC method, pH of fasted state stomach
Acetate buffer
0.05 M
4.5 900 ml 6 pH of fed state stomach
FaSSIF 6.5 500 ml 3 Fasted State Simulated Intestinal Fluid
FeSSIF 5.0 500 ml 3 Fed State Simulated Intestinal Fluid
FeSSGF 5.0 500 ml 3 Fed State Simulated Gastric Fluid
Table 2: Overview of the in vitro methods simulating change after food intake.
Test# Simulated food
intake
Compared media
and pH comments
1 Stomach
HCL pH 1.2
FeSSGF pH 5.0
Gastric pH decreases continuously after
meal ingestion from pH 6.4 to 2.7. Middle
condition was chosen.
2 Small intestine
FaSSIF pH 6.5
FeSSIF pH 5.0
To simulate pre and postprandial bile
secretion, in upper small intestine before
and after food intake
3 pH variation in
stomach
HCL pH 1.1
Acetate pH 4.5
pH 4.5 was chosen as non sink method,
allowing to dissolve 1 tablet 500 mg into
900 ml.

Page 163 of 201
Results:
Solubility
Table 3 summaries the results of the solubility study, sink conditions being reached only in HCl
0.1N.
Dissolution
The dissolution of the various formulations in HCl 0.1N are presented in Figure 1. The Table 4
presents the main results according to ANDA specifications.
Four generics over 14 did not pass the S1 ANDA requirements (28%) and 2 out of 14 are out of
specifications (OOS) according to the ANDA method after 15 minutes (14%). Generic 2 which
was the more close to reference formulation and generic 4 that dramatically failed were
selected for further investigations to select a media alternative to HCl 0.1N.
The Table 5 and figures 2 to 5 summarized the finding observed in various media.
A similar rank order was observed in all media for the three formulations, generic 2 being
always equivalent to reference and generic 4 being always lower that reference. Figure 6 and
Table 6 summarized the differences observed in acetate buffer (the simplest media that
emphasizes differences). The dissolution under non strictly sink conditions could be
questionable but highlights differences that could have a clinical relevance.
Table 3: Solubility of MMF in different media according to in vitro working conditions.
Medium Solubility of MMF
FeSSGF pH 5.0 290 mg/500 mL
FaSSIF pH 6.5
Blank FaSSIF
38 mg/500 mL
35 mg/500 mL
FeSSIF pH 5.0
Blank FeSSIF
548 mg/500 mL
324 mg/500 mL
HCL 0.1N pH 1.1 4270 mg/L
Acetate pH 4.5 600 mg/L

Page 164 of 201
Table 4: Dissolution results according to NDA method CellCept generic #
sample ID# 1 2 1 2 3-A 3-B 4 5 6 7 8 9 10 11 12 13 14
Result in HCl 0.1N
at 5’ S1 S1 OOS S1 S2 S1 OOS S1 OOS S1 OOS OOS OOS S2 S2 S1 S1
Result in HCl 0.1N
at 15’ S1 S1 S2 S1 S1 S1 OOS S1 S2 OOS S1 S2 S1 S1 S1 S2 S1
S1, S2 correspond to the USP stage of acceptance according to USP <711>. OOS means Out Of Specification.
Table 5: Comparison of dissolution profiles using similarity factor f2 in various media Medium Cellcept 2 generic 2 generic 4
FaSSIF * * *
FeSSIF ref 71 19
FeSSGF ref 60 29
HCl ref ** 26
Acetate ref 71 15
* all three profiles lie under 10 % release and are
super imposable
** not applicable but profile are super imposable
Table 6: Dissolution results according to acetate method. CellCept generic #
sample
ID# 1 2 1 2 3-A 3-B 4 5 6 7 8 9 10 11 12 13 14
f2 in
acetate 81 ref 52 71 47 83 15 26 37 23 24 36 53 67 89 73 25
Verdict P P P P F P F F F F F F P P P P F
P correspond to the Pass and F corresponds to fail the f2 acceptance criteria
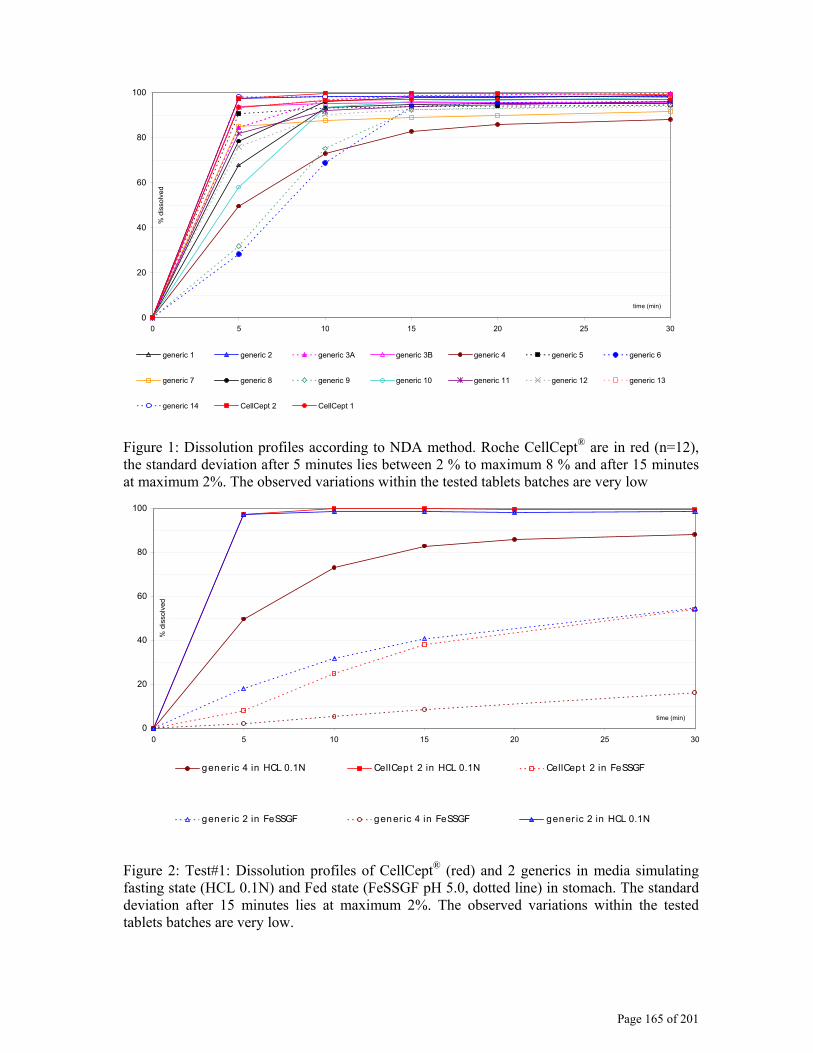
Page 165 of 201
0
20
40
60
80
100
0 5 10 15 20 25 30
time (min)
% d
isso
lved
generic 1 generic 2 generic 3A generic 3B generic 4 generic 5 generic 6
generic 7 generic 8 generic 9 generic 10 generic 11 generic 12 generic 13
generic 14 CellCept 2 CellCept 1
Figure 1: Dissolution profiles according to NDA method. Roche CellCept® are in red (n=12), the standard deviation after 5 minutes lies between 2 % to maximum 8 % and after 15 minutes at maximum 2%. The observed variations within the tested tablets batches are very low
0
20
40
60
80
100
0 5 10 15 20 25 30
time (min)
% d
isso
lved
gener ic 4 in HCL 0.1N CellCep t 2 in HCL 0.1N CellCep t 2 in FeSSGF
gener ic 2 in FeSSGF gener ic 4 in FeSSGF gener ic 2 in HCL 0.1N
Figure 2: Test#1: Dissolution profiles of CellCept® (red) and 2 generics in media simulating fasting state (HCL 0.1N) and Fed state (FeSSGF pH 5.0, dotted line) in stomach. The standard deviation after 15 minutes lies at maximum 2%. The observed variations within the tested tablets batches are very low.

Page 166 of 201
0
20
40
60
80
100
0 5 10 15 20 25 30
time (min)
% d
isso
lved
gener ic 2 in FaSSIF gener ic 4 in FaSSIF CellCep t 2 in FeSSIF
gener ic 2 in FeSSIF gener ic 4 in FeSSIF CellCep t 2 in FaSSIF
Figure 3: Test#2 : Dissolution profiles of CellCept® (red) and 2 generics in media simulating fasting state (FaSSIF, dotted line) and Fed state (FeSSIF) in small intestine. The standard deviation after 15 minutes lies at maximum 2%. The observed variations within the tested tablets batches are very low.
0
20
40
60
80
100
0 5 10 15 20 25 30
time (min)
% d
isso
lved
gener ic 2 in Acet at b u f f er p H 4.5 gener ic 4 in HCL 0.1N
gener ic 4 in Acet at b u f f er p H 4.5 CellCep t 2 in HCL 0.1N
gener ic 2 in HCL 0.1N CellCep t 2 in Acet at b u f f er p H 4.5
Figure 4: Test#3: Dissolution profiles of CellCept® (red) and 2 generics in media simulating pH variation in stomach: HCL 0.1N and Acetate pH 4.5 (dotted line).

Page 167 of 201
0
20
40
60
80
100
0 5 10 15 20 25 30
time (min)
% d
isso
lved
gener ic 2 in Acet at b u f f er p H 4.5 gener ic 4 in Acet at b u f f er p H 4.5
CellCep t 2 in FeSSIF gener ic 2 in FeSSIF
gener ic 4 in FeSSIF CellCep t 2 in Acet at b uf f er p H 4.5
Figure 5: Dissolution profiles of CellCept® (red) and 2 generics in acetate pH 4.5 (dotted line)
and FeSSIF pH 5.0.
0
20
40
60
80
100
0 5 10 15 20 25 30 35 40 45
time (min)
% d
isso
lved
gener ic 1 gener ic 2 gener ic 3A gener ic 3B gener ic 4 gener ic 5
gener ic 6 gener ic 7 gener ic 8 gener ic 9 gener ic 10 gener ic 11
gener ic 12 gener ic 13 gener ic 14 CellCep t 1 CellCep t 2
Figure 6: Dissolution profiles of all tested generics at pH 4.5. Roche CellCept® are in red. The standard deviation after 5 minutes lie at maximum 5 % and after 15 minutes at maximum 2% and after 45 minutes at 2 %.

Page 168 of 201
Discussion:
Mycophenolate Mofetil exhibited a typical pH dependent solubility profile. Sink condition (3
times saturation in dissolution volume) are fulfilled only in HCL 0.1N. In the 900 ml of acetate
buffer pH 4.5 the entire tablet dose can be dissolved. Comparison of the solubility of the blank
FaSSIF and blank FeSSIF versus FaSSIF and FeSSIF respectively suggested that the impact of
bile salt and lecithin were well pronounced and consequently food intake can impact the
solubility of MMF in vivo.
According to the ANDA method (see figure 1), different profiles for the generics in
comparison to the reference CellCept 500 mg can be observed. 9 out of 14 tested generics have
successfully passed the ANDA dissolution test (see table 1) according to our current
specification Q=75% after 5 minutes and 12 have successfully passed according to the
specification Q= 85% after 15 minutes. Four of them only fulfilled the acceptance criteria after
USP stage 2 and 2 out of the 14 were out of our current specifications. These results suggest an
almost homogenous dissolution rate in acidic environment even if at least 2 formulations are
not complying with the dissolution specifications of FDA suggesting that they could not be on
the market in US. Due to the limited amount of available tablets for each generic, two generics
(2 and 4) representing the highest and the lowest value found after 15 minutes with the NDA
method, were selected for dissolution method screening. The impact of food intake and or pH
change on MMF dissolution performance was evaluated by comparison of the obtained profiles
measured in different media independently as mentioned in table 2.
The simulation of pH change and impact of medium composition in the stomach as observed in
figure 2 (test#1), suggested similar impact of dissolution media for both CellCept and tested
generics (i.e. after 15 minutes decrease of approx 60 % from HCL to FeSSGF) the ranking
observed in HCl 0.1N being respected. The similarity factor f2 confirmed that generic 4 is not
comparable to CellCept whereas generic 2 resulted in similar profile (see table 5).

Page 169 of 201
The impact of pH change and medium composition in upper small intestine before and after
food intake, to simulate pre and postprandial bile secretion, as simulated in figure 3 (test#2),
suggested similar behavior for CellCept and generic 2 (e.g. after 15 minutes decrease of approx.
50 % from FeSSIF to FaSSIF). Generic 4 showed a significant lower profile in FeSSIF and
consequently a less pronounced decrease in FaSSIF. In fact at pH 6.5 (FaSSIF), the maximum
solubility is reached (37.5 mg in 500 ml), that resulted in a plateau at approx 7 - 8 % for all
tested samples. At pH 5.0 (FeSSIF) conditions in which the complete dose can theoretically be
solubilized (500 mg in 500 ml), a significant difference in performance for generic 2 and 4 is
observed. The f2 factor being significantly lower than 50 for generic 4.
Simulation of pH change was further investigated by using common dissolution media as
figured out in figure 4 (test#3). Generic 2 showed a decrease of approx. 30 %, slightly greater
than CellCept, whereas generic 4 resulted in 20 % dissolved only after 15 minutes. The f2
factor being the lowest observed in table 6 for generic 4.
Based on this screening, the highest discriminatory power is observed with FeSSIF pH 5.0 and
acetate buffer pH 4.5. At these pH’s and with the working conditions used, comparable
solubility exists and similar profiles can be observed (see figure 5). In practice, the acetate
buffer is advantageous since it is simple to prepare and in comparison to more complex
approaches using simulated intestinal fluids as often seen in literature reports 15,16,17 , it has the
potential to serve both as a robust dissolution method and a biorelevant method with a high
discrimination power. This method was therefore set up for further investigations on the
available generics.
Large variations of in vitro dissolution performance from generic to generic were observed (see
figure 6 and table 6). The acetate pH 4.5 method identified clearly two levels of performance in
vitro from 15 minutes onwards. Extremes resulting in less than 50% dissolved after 30 minutes
for 4 generics and less than 30 % dissolved for one generic out of the 14 tested variants.
Significant inter batches variability (generic 3A and 3B) was also found among generics in

Page 170 of 201
comparison to CellCept tablets 500 mg (CellCept 1 and 2 resulted in very similar profiles with
f2 = 82).
PH 4.5 being a natural pH in fasting state of the stomach18, a direct consequence of this marked
difference of performance at this pH could result in strong decrease of release rate for some
generics whereas CellCept tablets and other generics remain fast dissolving tablet (> 80 % after
30 minutes). Under fasting conditions, release of MMF in patients having high variation of
gastric pH or achloridia could be directly impacted depending on the generics quality. As well
high performance variations in fed state stomach (with pH from 6 to 311) can then be
anticipated. In addition, with a drug having a Tmax of approx 30 minutes, the difference
observed on figure 6 for some generics would result in significant delay of the absorption
kinetic (Tmax and Cmax) at higher pH since the drug is potentially not completely dissolved at
gastric emptying (after 15-30 minutes in fasting conditions). It can be clearly shown that
different qualities of generics exist and that variable performance can be associated from
generic to generic even if the therapeutic impact could not be anticipated from those results, a
special attention should be given to the generics with the lower results. As generic drugs are
approved based on comparison with the innovator brand only, it is possible that switching
between generic products may lead to greater disparity than switching between a single generic
product and the innovator brand – with unknown clinical consequences. In view of these
uncertainties, further research should be done to evaluate the pharmacokinetic and safety
profiles of generics with lower dissolution results and to determine if they are all
therapeutically equivalent. In the case of MMF, change in performance can dramatically affect
the risk associated to the medication (e.g.: acute rejection in patients).
The notions developed in the US FDA draft Guidance for Industry; Average, Population, and
Individual Approaches to Establishing Bioequivalence, Aug 199919 (which was never adopted)
defined the two interesting concepts of switchability and prescribability could be of interest for
typical drugs like anti rejection drugs. Prescribability refers to the clinical setting in which a
Page 171 of 201
practitioner prescribes a drug product to a patient for the first time. In this setting, the
prescriber relies on an understanding that the average performance of the drug product has been
well characterized and relates in some definable way to the safety and efficacy information
from clinical trials.
Switchability refers to the setting in which a practitioner transfers a patient from one drug
product to another. This situation arises with generic substitution, as well as with certain post
approval changes by an innovator or generic firm in the formulation and/or manufacture of a
drug product. Under these circumstances, the prescriber and patient should be assured that the
newly administered drug product will yield comparable safety and efficacy to that of the
product for which it is being substituted.
In our case MMF could be considered as a prescribability drug. These investigations highlight
the importance of developing discriminating dissolution methods, taking into account the
physico-chemical properties of the drug as well as the characteristic of the formulation. The
methods do not necessarily require a complex setting; they need to match the key parameter
likely to impact the performance. The results reported here were generated with a limited
number of tablets from only one or two lots of each generics or manufacturer. It is unknown
whether these results are representative for other lots. Nevertheless, huge differences were
observed some of them being even out of specifications using the current method proposed by
NDA. The acetate buffer media highlights the differences and is able simply to discriminate
between batches that fully comply in HCL. Acetate pH 4.5 method discriminated 8 variants out
of 14 whereas HCL method identified 2 OOS variants after 15 minutes. Considering the nature
of the drug, a bioequivalence study is mandatory according to FDA note of guidance (Guidance
for Industry Bioavailability and Bioequivalence Studies for Orally Administered Drug
Products; General Considerations 03/03) as a therapeutic failure could not be allowed. Anyway
a simple dissolution using a standard acetate buffer medium could help to insure a greater
quality of generic development and quality control that insure a better efficacy and safety.

Page 172 of 201
Conclusion:
In summary the generics and CellCept tablets 500 mg dissolution profiles obtained with an
alternate dissolution method, suggest that important differences may exist between the different
generics with regard to in vitro performance. In case of Mycophenolate Mofetil (MMF),
differences in dissolution profiles can potentially be useful predictors of clinical differences,
since the absorption of this drug with a very short Tmax in fasted state is limited by the
dissolution rate. Taking into account that MMF is currently being prescribed for life long use,
additional clinical testing may be necessary to evaluate the pharmacokinetics and clinical safety
impact of a switch from one generic quality to another.
If these in vitro findings are confirmed by clinical studies, and significant implications for
safety and effectiveness are proven, they should be considered by clinicians to potentially
safeguard patients who choose to purchase generics drugs. In this case, MMF formulations
should be similar in HCL as well as in acetate pH 4.5 before being further developed by new
formulators. This prior in vitro knowledge should be leveraged as a resource to aid in the
development, justification of tests and specifications for new products and ensure safety and
similarity of generic for the patients.
Transparency
Declaration of funding. This research was funded by F. Hoffmann-La Roche Ltd. Assistance
and review in the preparation of this article was provided by Professor Jean Michel Cardot
from Faculty of Pharmacy, Biopharmaceutical Department, University of Auvergne 63001
Clermont-Ferrand France. Professor Jean Michel Cardot received no financial support for this
study.
Declaration of financial/other relationships. Both authors Emmanuel Scheubel and Laurent
Adamy are employed by Roche Basel, Switzerland. There is no competitive interest

Page 173 of 201
Acknowledgements: The authors acknowledge: C. Keiflin, P. Wininger, C. Maureta, M. Brach,
Y. Ducommun for technical assistance and Dr. B. Fischer for managerial support
Reference
1 Masri M.A, Rizk S, Attia M.L, et al. Bioavailability of a New Generic Formulation of
Mycophenolate Mofetil MMF 500 Versus CellCept in Healthy Adult Volunteers.
Transplantation Proceedings 2007;39(4):1233-6 2 FDA Office of Generic Drugs.
http://www.fda.gov/AboutFDA/CentersOffices/cder/ucm119100.htm [last accessed 7 October
2010] 3 Sabatini S, Ferguson RM, Helderman, JH, et al. Drug substitution intransplantation: a
National Kidney Foundation White Paper. American Journal of Kidney Diseases 1999;33:389–
397 4 Henderson JD, Esham RH, Generic substitution: issues for problematic drugs. Southern
Medical Journal 2001:94;16–21 5 Yu LX, Amidon GL, Polli JE, et al. Biopharmaceutics, classification system: the scientific
basis for biowaiver extensions. Pharmaceutical Research 2002;19:921–925 6 European Mycophenolate Mofetil Cooperative Study Group, Placebo-controlled study of
mycophenolate mofetil combined with cyclosporin and corticosteroids for prevention of acute
rejection. Lancet 345 1995:1321. 7 Videau J-Y. Making medicines safe. Bull World Health Org 2001;79:87. 8 Emami J. In vitro–in vivo correlation: from theory to applications. Journal of Pharmacy and
Pharmaceutical Sciences 2006;9:169–89. 9 Benet LZ, Goyan JE. Bioequivalence and narrow therapeutic index drugs. Pharmacotherapy
1995;15: 433–40 10 FDA/Center for Drug Evaluation and Research, Office of Generic Drugs, Division of
Bioequivalence
http://www.accessdata.fda.gov/scripts/cder/dissolution/dsp_SearchResults_Dissolutions.cfm.
[last accessed 7 October 2010] 11 Jantratid E, Janssen N, Reppas C, et al. Dissolution Media Simulating Conditions in the
Proximal Human Gastrointestinal Tract: An Update; Pharmaceutical Research 2008;
25(7):1663-76 12 Moore J.W, Flanner H.H. Mathematical comparison of dissolution profiles. Pharm. Tech.
1996;20:64–74

Page 174 of 201
13 Center for Drug Evaluation and Research. Guidance for Industry Immediate Release Solid
Oral Dosage Forms Scale-Up and Postapproval Changes: Chemistry, Manufacturing, and
Controls, In Vitro Dissolution Testing and In Vivo Bioequivalence Documentation, CMC5
1995 14 European Agency for the Evaluation of Medicinal Products, Human Medicines Evaluation
Unit. Note For Guidance on Quality of Modified Release Products: A. Oral Dosage Forms; B.
Transdermal Dosage Forms; Section I (Quality), CPMP/QWP/604/96 1999 15 Lue BM. Using biorelevant dissolution to obtain IVIVC of solid dosage forms containing a
poorly-soluble model compound. European Journal of Pharmaceutics and Biopharmaceutics
2008;69:648–57 16 Dressman JB, Amidon GL, Reppas C, et al. Dissolution testing as a prognostic tool for oral
drug absorption: immediate release dosage forms. Pharm Res 1998; 15(1):11-22 17 Galia E, Nicolaides E, Horter D, et al. Evaluation of various dissolution media for predicting
in vivo performance of class I and II drugs. Pharm Res 1998;15(5): 698-705 18 Kararli TT. Comparison of the gastrointestinal anatomy, physiology, and biochemistry of
humans and commonly used laboratory animals. Biopharm Drug Dispos 1995;16 (5):351-80 19FDA/Center for Drug Evaluation and Research, Office of Generic Drugs, Division of
Bioequivalence http://www.fda.gov/OHRMS/DOCKETS/98fr/3657gd1.pdf [last accessed 7
October 2010]

Page 175 of 201
The data were abstracted in form of a poster entitled “In vitro dissolution of mycophenolate
mofetil: comparison between innovator and generic formulations “which was presented
twice. At BPS Winter meeting 2008, Abstract 0225 and at the ACCP/ESCP International
Congress 2009, Presentation 114E.
The poster is presented enclosed, ones completed and ones enlarged in 3 parts dor a better
visibility.
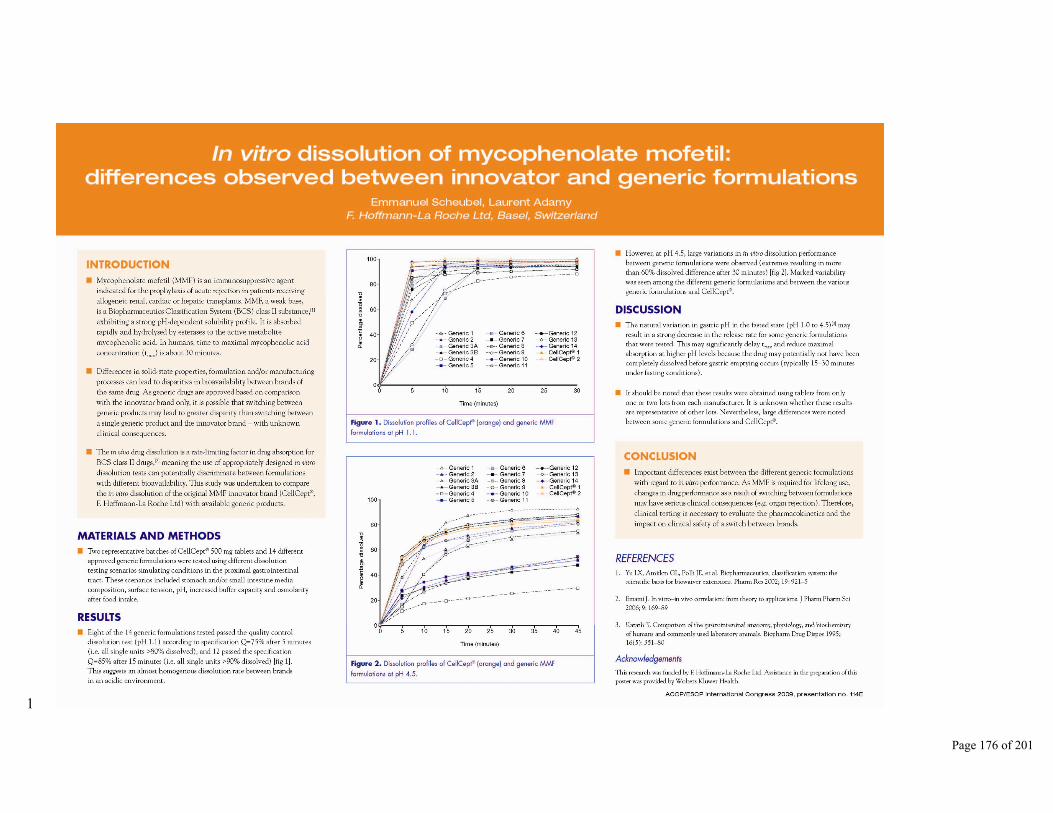
Page 176 of 201
1

Page 177 of 201
The poster was enlarged in three parts for a better visibility

Page 178 of 201

Page 179 of 201

Page 180 of 201
Mycophenolate mofetil: use of simple dissolution technique to assess
difference between innovator and generic formulations.
Supplement 1 : confirmation of the hypothesis on human
Introduction
CellCept is available as a sterile powder for intravenous administration and as a powder for
oral suspension, 250 mg capsules, and 500 mg tablets for oral administration. Recently, generic
capsule and tablet formulations of MMF have received regulatory approval in various
countries. Approvals have been based on demonstration of bioequivalence between each
individual generic product and the originator product (CellCept) but there are no data available
on the relative performance of generic formulations against each other. In order to confirm the
difference observed in vitro with the proposed dissolution method at pH 4.5 as showed in paper
4, an exploratory study was intended to compare the pharmacokinetics of mycophenolate
mofetil (MMF) from selected tablet formulations in healthy subjects as PoC.
Due to some IP limitations, the name of the generic are blinded and only some of the data are
presented. The purpose of the study was to explore if the difference observed in vitro are
relevant in vivo for three of the generics. CellCept tablets were included in the study for
reference.
This approach shows the importance of in vitro in vivo relationship (IVIVR) for the
determination of mycophenolate mofetil (MMF) performance and highlights the general need
of having a strategy for brand protection for all drugs already in the early development by
developing discriminating dissolution methods. The approach proposed to assess the quality of
a product via a simple in vitro dissolution and so help companies to propose high quality
products.
Material and Method
The three generics were selected out of 14 MMF generics based on the dissolution behavior in
the discriminating medium explored in the paper 4. The three generics are. A representative
marketed batch of CellCept® 500 mg tablet (F. Hoffman-La Roche Ltd) and MMF generic’s 1-
5-8 (please note that the generics were purchased in 2008 from countries where patent was
expired). All study drug supplies were stored and handled according to the instructions on the
product labelling.
Page 181 of 201
In vivo bioavailability, bioequivalence assessment
An exploratory study to compare the pharmacokinetics of mycophenolate mofetil (MMF) from
four 500 mg tablet formulations in healthy subjects was set up.
While it is recommended that CellCept be administered on an empty stomach in vitro
dissolution data suggest that differences in formulation performance are greatest in media
mimicking fed conditions. Therefore, to maximize the likelihood of being able to detect a
difference between formulations in vivo, drug administration in this study were done with food.
It was a randomized, open label, four treatments, four periods, four sequence, four-way
crossover design and was conducted at a single centre. In each treatment period, subjects
received a single 500 mg oral dose of MMF from one of four possible MMF tablet
formulations with a high fat, high calorie meal.
In each period, blood samples for measurement of mycophenolic acid (MPA), the active
metabolite, plasma concentrations were collected before (-0.5 h) and 0.33, 0.66, 1, 1.33, 1.66,
2, 2.5, 3, 3.5, 4, 4.5, 5, 6, 8, 10, 12, 16, 24, 36 and 48 h after drug administration. A total of 32
subjects were enrolled to ensure providing evaluable pharmacokinetic data.
Criteria for bioequivalence (ie, upper and lower 90% CIs within 0.80–1.25 for both Cmax and
AUC) for one generic against other generic tablets were evaluated (FDA 2003).
The geometric means and associated two-sided 90% confidence intervals (CIs) were calculated
by ANOVA for comparisons of the three generic formulations between each other (i.e. generic
8 vs. generic 5, generic 5 vs. generic 1 and generic 8 vs. generic 1). CellCept was monitored as
reference.
In Vivo-In Vitro Correlation
Various approaches of relationship between in vitro and in vivo data based either on values
(IVIVC) or rank (IVIVR), were tried on the main bioavailability parameters (Cmax and AUC)
Linear regressions were primary sought. Calculations were performed with Microsoft Excel©.
Results
The dissolution in vitro profiles in acetate buffer pH 4.5 using paddle at 50 rpm are presented
figure 1. CellCept and generic 1 showed similar performance with fast dissolving tablet with a
plateau after 15 minutes and more than 85 % dissolved whereas generic 5 and 8 exhibited
between 30 and 40 % after 15 minutes and less than 60% after 60 minutes.
Arithmetic means MPA blood concentration vs. time profiles are shown in Figure 2 (0–48 h)
and Figure 3 (0–6 h). Derived pharmacokinetic parameters for MPA and corresponding mean
relative ratio (90% CI) are summarized in Table 1.

Page 182 of 201
Comparisons of pharmacokinetic parameters between the 3 generics treatments showed
apparent differences in peak MPA exposure (). Cmax from generic 5 tablets was 22% lower on
average than that from generic 1 tablets and the 90% CIs did not fulfill standard BE criteria
(Cmax ratio 0.78, 90% CI 0.64, 0.94). Cmax from generic 8 tablets was also 16% lower on
average compared with Cmax from generic 1 tablets, while the 90% CIs did not fulfill standard
BE criteria (Cmax ratio 0.84, 90% CI 0.69, 1.02). Generic 8 and generic 5 showed comparable
Cmax.
Total MPA exposure (AUC) was similar between all three generic tablet formulations () and
the associated 90% CIs all lay within the range 80–125% for both AUCinf and AUClast.
Variability in exposure parameters was similar between formulations (mean AUCinf CV% 25–
30%, mean Cmax CV% 42–77%). Other pharmacokinetic parameters were also similar between
formulations. Tmax lay between 0.67 hour to 1.33 hour.
No point to point relationship between the in vitro data and the PK parameters were found.
Level C was attempted between Cmax and AUC and percent of the dose dissolved in vitro at
various times. The results are presented in Figure 4 for the % dissolved after 60 minutes
(reflecting a mean Tmax) and Cmax. A strong relationship was found having a R2 above 0.99.
No relationship between the AUC versus in vitro dissolution was found.
Figure 1 Dissolution profiles of the 4 MMF tablets in acetate pH 4.5 buffer at 50 rpm.
0
20
40
60
80
100
0 5 10 15 20 25 30 35 40 45
time (min)
% d
isso
lved
generic 1 generic 5 generic 8 CellCept

Page 183 of 201
Figure 2 Mean MPA plasma concentration vs. time profiles (0-48h)
Figure 3 Mean MPA plasma concentration vs. time profiles (0-6h)

Page 184 of 201
Figure 4 IVIVC level C, Cmax versus % dissolved at 60 minutes
Cmax vs % dissolved
y = 16.612x - 11.915R2 = 0.9903
0
20
40
60
80
100
120
4.5 5 5.5 6 6.5 7
Cmax µg/ml
% d
isso
lved
at 6
0'
Table 1 Summary of MPA pharmacokinetic parameters
Unadjusted means Mean relative ratio (90% CI)
Generic 8
(N=31)
Generic 5
(N=32)
Generic 1
(N=32)
CellCept*
(N=32)
Generic 8
vs.
Generic 5
Generic 8
vs.
Generic 1
Generic 5
vs.
Generic 1
AUClast
(μg.h/mL)
20.72 20.40 21.10 21.13 1.01
(0.96,
1.07)
0.98
(0.93,
1.04)
0.97
(0.92,
1.02)
AUCinf
(μg/h/mL)
24.33 24.19 25.38 26.5 1.00
(0.94,
1.06)
0.96
(0.90,
1.02)
0.96
(0.90,
1.02)
Cmax
(μg/mL)
5.624 5.175 6.647 6.312 1.08
(0.89,
1.31)
0.84
(0.69,
1.02)
0.78
(0.64,
0.94)
Tmax (h) 0.67 1.17 1.33 0.67 - - -
Geometric mean for AUClast, AUCinf, Cmax, t1/2
* for monitoring purpose only.
Discussion
The apparent differences in the peak exposures suggest there could be differences in the rate of
absorption of MMF between the generic formulations. It is therefore possible that some generic
tablets might not meet the accepted criteria for bioequivalence (ie, upper and lower 90% CIs
within 0.80–1.25 for both Cmax and AUCinf) if tested against other generic tablets.

Page 185 of 201
The apparent differences in clinical performance are consistent with observed differences in in
vitro performance between generic 500 mg MMF tablet formulations. Dissolution testing in
media simulating the environment in the proximal gastrointestinal tract showed marked
variability in dissolution between generic formulations in some conditions. At pH 4.5 there was
more than 60% difference in the amount dissolved after 30 minutes between the best and worst
performing formulations.
Based on the IVIVC level C obtained with Cmax, (figure 4) the dissolution can serve as a good
surrogate for the in vivo performance.
This strong correlation would enable researcher to better understand and appreciate the likely
contributions that the formulations may produce in an in vivo study. For instance, if clear low
performance in dissolution is observed for a new formulation, it may be reasonable to
hypothesize that the in vivo peak concentration attainment could be lower.
Therefore, the rapidly dissolving properties of the MMF IR tablets in different pH can be
considered as the CQA. Other examples concerning generics and IVIVC are reported in the
literature (Bush 2009, Rouini 2008). This approach is in line with QbD strategy.
In our case the use of a simple and cost effective media allows additionally placing the
dissolution as a more meaningful QC testing.
Conclusions
The dissolution tests in HCL used in routine and based on internal know-how of the company,
is not enough to guaranty the quality of products which exhibiting similar quantity of API but
different quality and/or quality of excipients. The tests performed had allowed setting up a
simple technique that demonstrated differences between generic batches. Those differences
were confirmed in vivo on one of the BE parameters. This approach which is a help for line
extension and generic companies showed also that the simple dissolution test could
discriminate between products. It shows as well the importance of having the right method
early as possible to take the right decision. The example of Cellcept shows clearly the role of
dissolution to identify the CQA, in this case the “rapidly dissolution” behavior.

Page 186 of 201
Reference for supplement 2
Bioavailability and bioequivalence studies for orally administered drug products — General
considerations. U.S. Department of Health and Human Services, Food and Drug
Administration, Center for Drug Evaluation and Research. March 2003 Buch P, Langguth P, Kataoka M, Yamashista S. IVIVC in oral absorption for fenofibrate
immediate release tablets using a dissolution/permeation system. J Pharm Sci 2009;98:2001-9.
Rouini MR, Ardakani YH, Mirtazaelian A, Hakemi L, Baluchestani M. Investigation on
different levels of in vitro-in vivo correlation: Gemfibrozil immediate release capsule.
Biopharm Drug Dispos 2008;29:349-55.

Page 187 of 201

Page 188 of 201
Conclusion experimental part 4
The central role of dissolution is well highlighted in this 4th part of the experiment. The
identification of the rapidly dissolving behavior of the formulation at different pH is clearly the
CQA. Therefore, differences in dissolution profiles can be useful predictors of clinical
problems when drugs exhibit dissolution rate-limited absorption, particularly for BCS class II
drugs.
As showed with this example of MMF formulations, the general need of having a strategy for
brand protection for all drugs by developing discriminating dissolution methods is essential.
Currently, generic applicants are required to utilize the compendial dissolution method when it
exists. For non-USP products, generic applicants are frequently required to use an “OGD”
(Office of Generic Drugs, FDA) method and associated specifications. Whether the method is a
USP or OGD method, it may be not suited for the particular formulation. Generic products are
often manufactured using excipients that are different than the brand counterpart.
Manufacturing processes may also differ significantly. As such, dissolution methods and
specifications that are appropriate for the brand product may not be suitable for the generic
product.
Therefore, moving to a regulatory process that encourages quality by design principles, process
understanding, dissolution methods and specifications that are based on product relevant
characteristics is well acknowledged. This method helps then during the entire development
and allows in this case by having an IVIVC in place to act as a strong surrogate for in vivo
performance. Later for the generic industry, the quality by design approach creates the
advantage of using “prior knowledge” that might include the following: (a) in vivo and in vitro
performance of the reference product obtainable from the literature and/or experimental studies
by the firm; (b) Biopharmaceutics, physico-chemical, formulation and dissolution
characteristics of structurally related representatives of the same class of drugs. Many generic
firms also have a large portfolio consisting of a wide range of product families. This prior
knowledge should be leveraged as a resource to aid in the development, justification of tests
and specifications for new products and ensure safety and similarity of generic for the patients.
This effort was made by Roche in order to have brand names of products not associated with
therapeutic failure.

Page 189 of 201
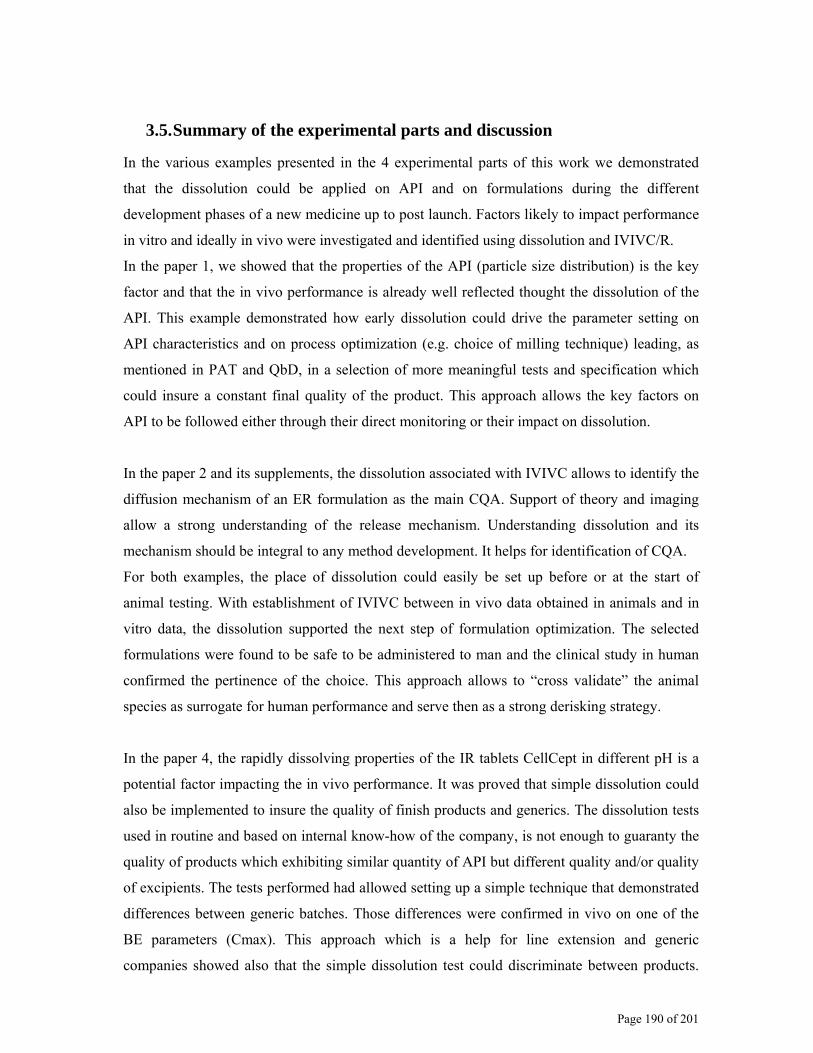
Page 190 of 201
3.5. Summary of the experimental parts and discussion
In the various examples presented in the 4 experimental parts of this work we demonstrated
that the dissolution could be applied on API and on formulations during the different
development phases of a new medicine up to post launch. Factors likely to impact performance
in vitro and ideally in vivo were investigated and identified using dissolution and IVIVC/R.
In the paper 1, we showed that the properties of the API (particle size distribution) is the key
factor and that the in vivo performance is already well reflected thought the dissolution of the
API. This example demonstrated how early dissolution could drive the parameter setting on
API characteristics and on process optimization (e.g. choice of milling technique) leading, as
mentioned in PAT and QbD, in a selection of more meaningful tests and specification which
could insure a constant final quality of the product. This approach allows the key factors on
API to be followed either through their direct monitoring or their impact on dissolution.
In the paper 2 and its supplements, the dissolution associated with IVIVC allows to identify the
diffusion mechanism of an ER formulation as the main CQA. Support of theory and imaging
allow a strong understanding of the release mechanism. Understanding dissolution and its
mechanism should be integral to any method development. It helps for identification of CQA.
For both examples, the place of dissolution could easily be set up before or at the start of
animal testing. With establishment of IVIVC between in vivo data obtained in animals and in
vitro data, the dissolution supported the next step of formulation optimization. The selected
formulations were found to be safe to be administered to man and the clinical study in human
confirmed the pertinence of the choice. This approach allows to “cross validate” the animal
species as surrogate for human performance and serve then as a strong derisking strategy.
In the paper 4, the rapidly dissolving properties of the IR tablets CellCept in different pH is a
potential factor impacting the in vivo performance. It was proved that simple dissolution could
also be implemented to insure the quality of finish products and generics. The dissolution tests
used in routine and based on internal know-how of the company, is not enough to guaranty the
quality of products which exhibiting similar quantity of API but different quality and/or quality
of excipients. The tests performed had allowed setting up a simple technique that demonstrated
differences between generic batches. Those differences were confirmed in vivo on one of the
BE parameters (Cmax). This approach which is a help for line extension and generic
companies showed also that the simple dissolution test could discriminate between products.

Page 191 of 201
This effort was made by Roche in order to have brand names of products not associated with
therapeutic failure.
All these examples highlight the strong advantage of having an IVIVC/R to support the
development and post launch phases.
More complex methods, apparatus or non compendial instrument may be developed to aid in
IVIVC/R discovery. In vitro this characteristic can be further challenged by changing the
working condition as showed by using small volume vessel in paper 3 and its supplement. The
small volumes dissolution exhibited the advantage to be more discriminant than the large
volumes and to have a simple scaling factor. It’s seems particularly interesting for BCS Class 1
and very rapidly disintegrating IR tablets where practically no alternative (apart disintegration)
is available.
To predict in vivo behavior of BCS class II-IV drugs, simple and cost effective conventional
media (HCl in paper 2 and acetate buffer in paper 4) or media with surfactant (HCL + 0.2%
SDS in paper 1) were shown to be potential substitutes for the more complex, physiologically
based Fa/FeSSIF. The use of simple buffer or biorelevant amounts of conventional surfactants
in dissolution media will not only be economic during the various steps of drug development,
but could also place the quality control dissolution tests into a more meaningful context.
All these applications highlight the central role of the dissolution.
There are several clear applications for dissolution during pharmaceutical development:
Dissolution is a mandatory QC testing for DP. It allows to address batch to batch
reproducibility, ageing. It can monitor CQA.
Dissolution is used in early phase for screening of formulation performance in vitro.
In later phases, dissolution serves as support for SUPAC, rules are followed even
during development.
In vitro dissolution results may be used as surrogate to predict the in vivo performance
of drugs and formulations by either having an IVIVC or identifying CQA likely to
impact in vivo performance.
It supports waiver for bioequivalence (mainly BCS class1 and some class 3).
Other applications for dissolution testing are :
the screening and characterization of salts, co crystals and polymorphic forms for
appropriate selection during development.

Page 192 of 201
the screening for excipients (polymers, surfactants, etc.). These studies are useful to
identify formulations with enhanced dissolution rates, crystallization/precipitation
inhibitors or stabilizers.
Dissolution testing has become an important tool in development for testing of
powders. This can be applied for API and the galenical intermediates as pre blend and
final blend to reflect the performance through the manufacturing process. This is well in
line with the QbD and process understanding.
In summary, it is important to understand the mechanism that governs the release and
solubilisation of the drug while developing a dissolution method; this is one of the primary
goals during formulation development, along with the other goals of achieving bioavailability,
uniformity, stability, and processability.
In practice the questions that arise at beginning of the development of a new dissolution
method is “how should I start for a suitable method?” and “for what purpose?”
Even if we showed during this work some examples of a dissolution method addressing QC
goals, QbD and biorelevance in once, in most of the cases it is acknowledged that QC
dissolution tests (and purpose) may not reflect in-vivo physiological conditions. Furthermore,
for drugs that exhibit low aqueous solubility (BCS II, BCS IV), surfactants are incorporated
into the QC dissolution test in order to maintain sink condition during testing. The addition of
surfactant to the dissolution media can reduce the discriminating capability of the dissolution
test. What why the development of alternative methods in addition to classical QC is a current
practice in the pharmaceutical industry. Several apparatus (USP1/2 and USP4) as well as
several setups (pH change) are often applied in parallel during development.
It has to be kept in mind, that alternative dissolution methods may be highly sensitive to small
perturbations in the drug product. This is particularly true for BCS category II and IV
compounds. Therefore, variability inherent in these alternative dissolution methods may make
them unsuitable for QC applications.
Decision trees are presented as synthesis of this work to foster the set-up of a dissolution
method with regard to QbD and IVIVR/C for IR tablets (most frequently late phase formulation
developed at Roche). Decision trees purely build on physicochemical properties such as logD,
solubility, dissolution, solid state properties are rare (Lee 2003). More recently, the BCS
classification scheme has been used for the selection and design of formulations (Ku 2008,
2010). The BCS (chapter 2.3.1) combines dose with solubility, permeability, and dissolution

Page 193 of 201
and the derived parameters dose number (Do), dissolution number (Dn), and absorption
number (An) may be used as more easily accessible decision criteria for building up simplified
decision trees (Lennernäs 2005, Cook 2008). A decision tree for dissolution method
development and for the selection of appropriate dissolution media for different categories of
drugs has been proposed by Li et al. (Li 2005) based on the work from Dressman (Dressman
2000).The general issue with decision trees is that it tightly couples knowledge and the use of
knowledge in individual decision paths and hence all possible decision paths and criteria have
to be present in the tree. If information is missing, decisions can not be easily made. Therefore,
the subsequent figure only intends to provide some basic insight and guidance to the reader on
the rational behind dissolution method development to foster the set-up of individual method
(Figure A).
In a first step, the compounds are classified according to their BCS properties. For Class 1 and
3 compounds, most simple yet reliable medium should be used, and no surfactant is needed.
For compounds belonging to Class 2 and 4 SGF or SIF with suitable surfactant may be used.
Fa/FeSSIF could be explored for API exhibiting sufficient solubility in such media or having a
high logP value. PH-dependent solubility, dissolution of salt versus free form, and the
distinction between weak acids and bases are then the key drivers when choosing the pH of a
dissolution testing medium. A well USP3/4 apparatus can be an alternative to high amount of
surfactant using USP 1-2 or by providing different hydrodynamics. At early stage (Phase 0-1) a
worst case approach with regard to dose strength should be favored, since the final dose will
not be known till end of phase 2 and the strength can vary. The method choice and rational
should be justified so that it can be easily revisited as late phase changes occur.
In a second step the discriminatory power of the method is challenged by seeking relationship
with API characteristics, granules particles size or tablets properties. The aim is to have the
first inside of the CQA. A strong supportive database is a key for this step. Example of
analytical methods to assess the quality of API, intermediate and DP is provided table A. These
experiments should be designed on a case-by-case basis in consultation with the galenist,
chemist and analytical specialist.

Page 194 of 201
Figure A: Decision Tree: Dissolution development for IVIVC/R based on BCS approach.

Page 195 of 201
Table A: Example of methods that can support better process understanding for an IR tablet.
Intermediates
API
Pre beld
Final blend
Cores
Film-coated
tablets Main impact
Bulk/tapped density x x x Granulation, flowability etc…
Particle size distribution (PSD) x x DR API
Microscopy, Photos x
Shape factor x
SEM x
DSC/TG x x ( x )
Specific surface area (BET) x (x) DR API
Dynamic vapor sorption x API moisture sorption
XRPD x x x x API amorph/crystall
NIR, IR, Raman x x x API quality
Wettability / sinkability x DR API
Intrinsic dissolution x (x) DR API, polymorph
P1
Apparent Dissolution USP 4 x x x x x DR all factors P1
Dissolution QC ( x ) x x DR all factors P2
Dissolution alternative non sink, x x DR P4
Dissolution alternative small volume x x DR P3
Dissolution alternative 2 phases, x x DR
Chemical imaging
(NIR, raman, µTC….) x x x x x Qualitative DP,
process
P2
Stability (aggregation) x DR API
Etc….
In bracket corresponds to optional tests
DR = Dissolution rate. DR All factors shows the dissolution as holistic testing.
Px indicates the main method used in the corresponding paper (Paper 1 to 4)
It is noted that due to the limitless range of conditions that may be employed in dissolution
testing, a limitless range of dissolution results may be generated for the same product; results
for which interpretation cannot readily be drawn with respect to inferences on quality. In an
effort to simplify the analysis of data generated from multiple methods, the principle of risk
analysis is applied to alternative dissolution testing. Dissolution testing may discriminate for
variations in the drug substance, excipients, manufacturing process, storage conditions. The
main risk is that any change from one or more of these parameters may result in a change in in-
vivo drug release, thereby posing a safety risk to the patient. Therefore, correlation of the

Page 196 of 201
dissolution method(s) to in vivo drug release is a necessary component of dissolution test
development (i.e. IVIVC). A general approach to establishing an IVIVC is provided in Figure
B.
Figure B: Decision Tree : Dissolution development for IVIVC/R attempt
Prepare batch variants based on
correlated properties
Evaluate w/ QC method and Alternative method(s)
Conduct relative bioavailability
studyIV PK dataSimulation
data *
De-convolutePK data
CorrelateIn vivo absorption
to in vitro dissolutionId of CQA
Is a correlation made?
Modify dissolution conditions to
satisfy correlation requirements
Adopt IVIVC method as single
Alternative Dissolution
method
Monitor batches & establish controls for properties & parameters that
correlate to IVIVC method
No Yes
* see Chapter 2.4.3 for detailed approach.
Page 197 of 201
Finally, it should be emphasized that an understanding of the design of the pharmaceutical
dosage form is critical to facilitate the design of an appropriate test, and to avoid artifacts
created by a poorly designed test. Considerations of the dosage form design may include:
an immediate release versus modified release product; eroding versus disintegrating dosage
form, expected behavior of excipients used in the formulation under agitated, non-agitated,
or minimally agitated condition
Reference for Summary and Discussion
Cook J, Addicks W, Wu YH. Application of the biopharmaceutical classification system in clinical drug development-an industrial view. AAPS Journal, 2008; 10; 306-310.
Dressman JB. 2000. Dissolution testing of immediate-release products and its application to forecasting in vivo performance. In: Dressman JB, Lennernas H, editors. Oral drug absorption: Prediction and assessment, New York: Marcel Dekker Inc., pp 155–181
Ku MS. Salt and polymorph selection strategy based on the biopharmaceutical classification system for early pharmaceutical development. American Pharmaceutical Review, 2010; 13; 22, 24-30.
Ku MS. Use of the biopharmaceutical classification system in early drug development. AAPS Journal, 2008; 10; 208-212.
Lee Y-C, Zocharski PD, Samas B. An intravenous formulation decision tree for discovery compound formulation development. International Journal of Pharmaceutics, 2003; 253; 111-119.
Lennernaes H, Abrahamsson B. The use of biopharmaceutic classification of drugs in drug discovery and development: current status and future extension. Journal of Pharmacy and Pharmacology, 2005; 57; 273-285.
Li P, Zhao L. Developing early formulations: Practice and perspective. International Journal of Pharmaceutics, 2007; 341; 1-19. Li, S., et al., IV-IVC considerations in the development of immediate-release oral dosage form. J Pharm Sci, 2005. 94(7) 1396-417.

Page 198 of 201
4. Conclusion
Page 199 of 201
The value of in vitro dissolution testing as a quality control tool is demonstrated by its long
history of regulatory acceptance (it is included in Pharmacopeia since 1970). In the present
work we tried to demonstrate that the dissolution tests exhibit a broader range of possibilities
starting from preclinical research up to post launch surveillance of product quality. In early
phases focus is on screening where it is important to select the right API, the right formulation
and to identify the critical manufacturing parameter whereas for release consistent batch
manufacturing and stability testing are the main focus. During development, dissolution testing
can be a sensitive and a reliable predictor of bioavailability and tool for biowaiver. As exemplified in this thesis, simple and cost effective dissolution methods were shown to be
potential surrogate for in vivo performance and serve as well for strong QC method.
Dissolution was used as a surrogate marker or a supra indicator of all processes which are
involved in the quality of the API or the formulation as well as in manufacturing process. With
this regard the dissolution acts as strong tools for QbD. In all these examples the central role of
the dissolution during development up to post launch phases was perfectly shown.
Although success has been achieved as showed during these investigations, further effort and
more expertise need to be invested in the development of dissolution methods. Tools like DoE
or simulation as well as the BCS/BDDCS and new regulatory QbD directives will lead to more
innovative and science-based approaches in order to ensure the dissolution consistency of the
oral dosage forms. All those examples demonstrated that more investment on dissolution
already in early stage, and in particular for API, is valuable, it is easy to set up, fast and cheap
compared to full development or even to a BE study and allow taking the right decision earlier
with minimum risks insuring a global safety and efficacy of the products. Pharmaceutical
industries should even further optimize their organizations in this direction, for instance by
centralization of the dissolution activities and by putting emphasis on cross functional effort,
having pharmaceutical scientists, chemist and analytical specialists working together.
There is an expectation that the changing paradigm in dissolution method development will
lead to an increased of IVIVC/R attempts. With the challenges associated with IVIVC,
especially for IR dosage forms, IVIVR should be increasingly leveraged to support QbD and
design-space development. Even if these investigations are not fully successful in term of bio
relevance or prognostic, the efforts invested will gain enough information to be more confident
on all critical aspects that may impact the quality of the drug product (CQA, manufacturing). In
summary dissolution is a strong tool to fasten development and increase quality when properly
associated with IVIVC/R and QbD.

Page 200 of 201
The efforts to improve the dissolution testing will allow for increasingly rational drug
development, sound specification setting and strong regulatory and derisking tools. It is
valuable if academia, industry and regulatory agencies could put more emphasis on devising
predictive dissolution testing and if pharmaceutical scientists could work together further in
this pursuit.

Page 201 of 201
Résumé
La dissolution est considérée comme une des méthodes clés durant le développement d’une forme pharmaceutique et pour le suivi de la qualité après mise sur le marché. En phase de développement précoce l’étude de la vitesse de dissolution est utilisée dans la sélection des formulations avant les études toxicologiques et les premiers tests sur l’homme. En phases de développement avancées la dissolution est réalisée principalement pour comparer de nouveaux prototypes, optimiser le procédé de fabrication, s’assurer la reproductibilité de lot à lot et évaluer le suivie de stabilité. Bien que la dissolution in vitro soit une méthode précisément décrite et largement utilisée dans l’industrie pharmaceutique, plusieurs défis existent encore dans ce domaine d’application. En particulier en ce qui concerne l’identification et de la compréhension des différents paramètres critiques qui contrôlent la libération du principe actif (PA) pure et à partir de sa forme pharmaceutique. Avec l’établissement de corrélations in vitro/in vivo (IVIVC) la dissolution se place alors comme un indicateur sensible et fiable des performances in vivo. Ce travail se concentre sur l’utilisation optimum des méthodes de dissolution existantes et explore quelques alternatives simples pour poser les fondations des approches de « Quality by Design » (QbD) et des corrélations in vitro/in vivo (IVIVC). La dissolution appliquée au PA et à différentes formes pharmaceutiques (libération immédiate et retardée) et ceci à différentes phases du développement ainsi que pour les génériques a été explorée. Les résultats obtenus ont permis la sélection de méthodes de dissolution de control qualité simples et peu couteuses qui idéalement peuvent aussi servir de test de substitution pour la prédiction de la performance in vivo. Les perspectives futures et le rôle central de la dissolution sont présentés et discutés. Mots-clés: dissolution in vitro; correlation in vitro/in vivo (IVIVC).; relation vitro/in vivo (IVIVR); Biopharmaceutical Classification System (BCS); Quality by Design (QbD); générique.
Abstract
Dissolution has emerged as a key method during development of medicines and for quality control of marketed products. At the early stage of development, dissolution guides the selection of toxicology and first test in man formulations. At later stages of development, dissolution tests are performed to compare prototype formulations, the robustness of the manufacturing process, to indicate stability and to assure safe release and reproducibility of the products to the market. However despite they wide use in pharmaceutical development, several challenges still exist. In particular, there is a lack of thorough identification and understanding of the critical quality attributes that control dissolution of Active Pharmaceutical Ingredient and Drug Product. Dissolution exhibits clearly a higher predictability if it can be extrapolated directly to in vivo behavior. The present work focuses on the optimization of the existing and alternative dissolution techniques to lay a foundation for Quality by Design (QbD) principles, In Vitro/In Vivo Correlation (IVIVC) and In Vitro/In Vivo Relationship (IVIVR). The dissolution applied on API and on different formulations types (Immediate release and extended release form) during the different development phases as well as for generic has been explored. Simple and cost effective dissolution methods were shown to be potential surrogate for in vivo performance and serve as well for strong quality control method. The future perspectives and central role of dissolution testing are presented and discussed. Key words: In vitro dissolution; In Vitro/In Vivo Correlation (IVIVC); In Vitro/In Vivo Relationship (IVIVR); Biopharmaceutical Classification System (BCS); Quality by Design (QbD); generic.