predictive analytics retention
TRANSCRIPT

Predictive analytics (Webinar 1) Customer retention May 19th 2015

we look at simple
‣ What are we trying to solve?
‣ How can we use predictive analytics?
‣ What data are we talking about?
‣ Demo
‣ Q&A
David Hitt
Director, Strategic Accounts Qubit
Stephen Pavlovich
CEO & Founder conversion.com
Agenda

Qubit is a global leader in digital optimisation
Global
• Segmentation
• Analytics
• Personalisation
• Testing

we look at simple
What is the retention problem?
80% of future revenue will come from as little as 20% of existing customer
(Gartner).
Yet most companies don’t have effective retention
programs.
Consider conversion rates online which can be as low as 3% for new visitors. Existing customers on the other hand can renew at volumes greater than 80% depending upon the brand and industry.
If we look at a wireline provider who tends to have a churn rate of between 2 - 2.5% per month even with a modest customer base of 5 million, that means an estimated 1.3m customers or $2b in revenue is lost every year. Frightening numbers. The revenue opportunities associated with an increase in retention can be massive.
EXAMPLE

What are the causes of churn?
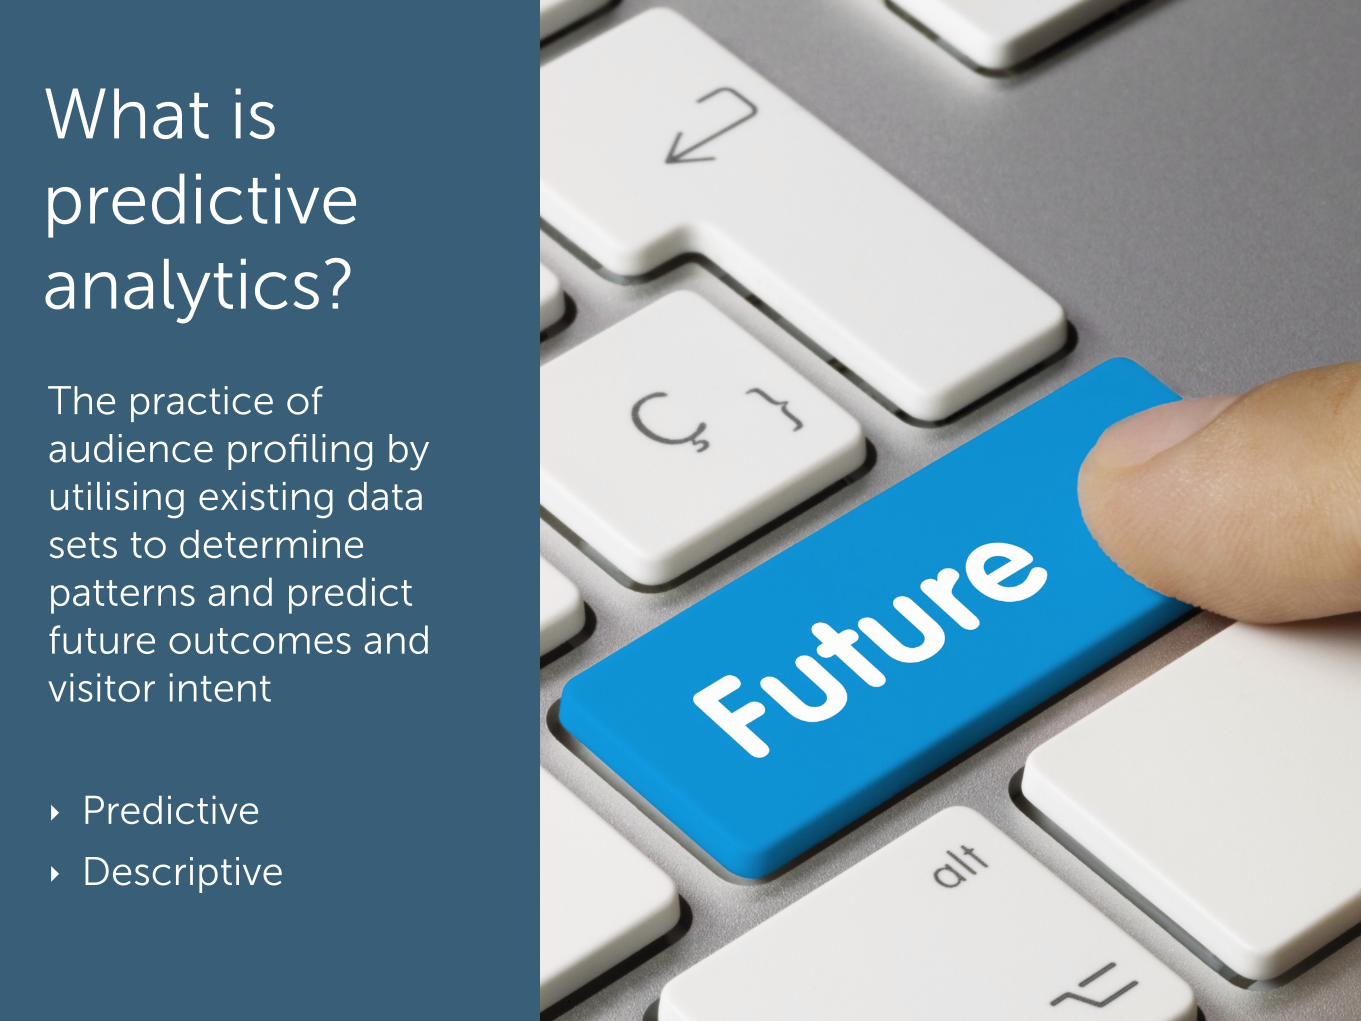
What is predictive analytics?
The practice of audience profiling by utilising existing data sets to determine patterns and predict future outcomes and visitor intent
‣ Predictive
‣ Descriptive

Purchase scenario
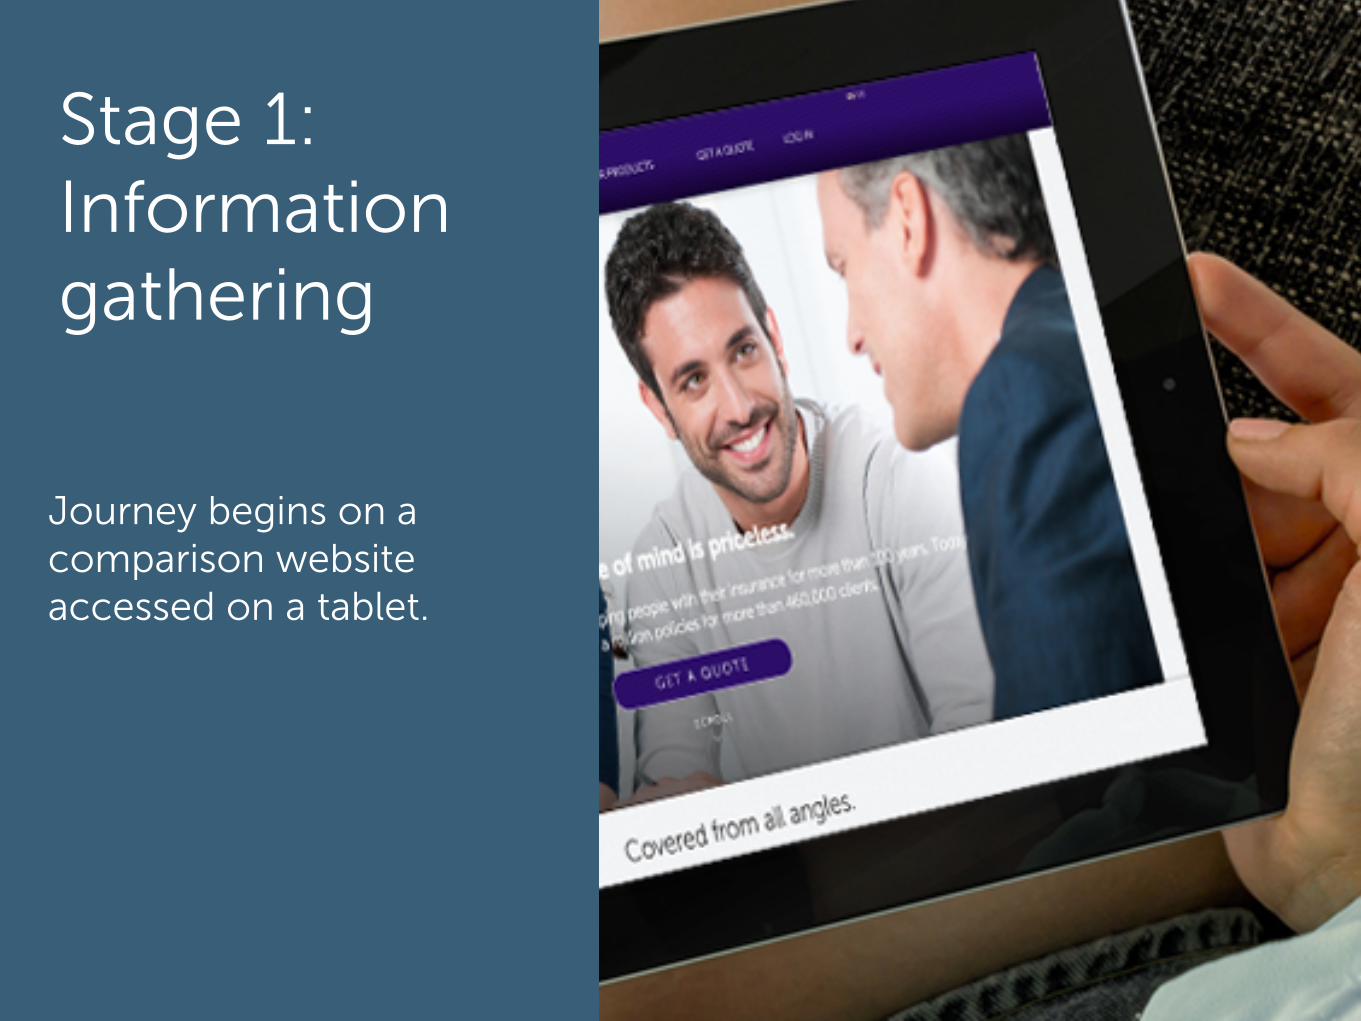
Stage 1: Information gathering
Journey begins on a comparison website accessed on a tablet.

Stage 2: Purchase processUser selects the right product, and completes the purchase online with the selected provider.

Stage 3: In-life customer support
Customer will have a number of experiences during the period of service that will impact their propensity to churn or renew.

What data can be collected and analysed?
‣ First party digital:
‣ Device
‣ Location
‣ Channel
‣ Products
‣ Price
‣ Quotes
‣ Current providers
‣ Subscription length
‣ Browsing history
‣ Keywords
‣ Demographics
‣ First party:
‣ Contact history
‣ Claim history
‣ Fault history
‣ Billing issues
‣ Address changes
‣ Third party:
‣ DMP
‣ Credit score
‣ Geographic

EXAMPLE

Qubit Decipher Dashboard using Tableau for visualisation using dummy data.
Using predictive analytics we can select a channel (highlighted)
and determine propensity to churn
(risk)
Red is churn, green is renewal. Here Direct
has a very low chance of churn, but vertical
search (highlighted) is high.
Highest risk channel
Lowest risk channel

Qubit Decipher Dashboard using Tableau for visualisation using dummy data.
In the Vertical Search channel, we can click on a specific affiliate and
drill down a list of contacts who entered the site through that channel, and determine their risk of churning

Qubit Decipher Dashboard using Tableau for visualisation using dummy data.
Here we can click on Paid Search, and see the risk associated with
certain key words. From there, we could also drill down the visitor information to determine which
visitors are at risk.
‘Cheap Car Insurance” in this example has a 30% chance of
churning, so we would adapt our marketing spend accordingly.

Qubit Decipher Dashboard using Tableau for visualisation using dummy data.
Next we can go to the Visitor Page Dashboard to analyse how a user’s
actions on the site 30 days after signup can signal their intent to
churn.
In this example, we see that homepage visits have a low risk of
churn, where as FAQ has a high risk.
So, users visiting the FAQ page within 30 days of signing up
represent a great opportunity to reduce churn.
Highest risk behaviour

Qubit Decipher Dashboard using Tableau for visualisation using dummy data.
Finally, we can have a look at all the data to
determine the size of our problem. From there, we can drill down on entry
points to determine which present the
biggest risk, and exactly what that risk is.
This analysis will inform what brands, affiliates,
keywords etc we should be spending our
marketing budget on.

we look at simple
Personalising the experience
The next 2 slides we look at how to personalise the
experience for at risk users.
1) Personalising by cross-selling a product that reduces
propensity to churn
2) Targeting users on the FAQ page with a rang of
personalised and relevant discounts to lock them in and
reduce churn.

Personalised experience to drive retention
Standard Personalised

Personalised experience to drive retention
Standard Personalised

Example recap
Predictive Analytics Onsite optimisation
Visitor Cloud
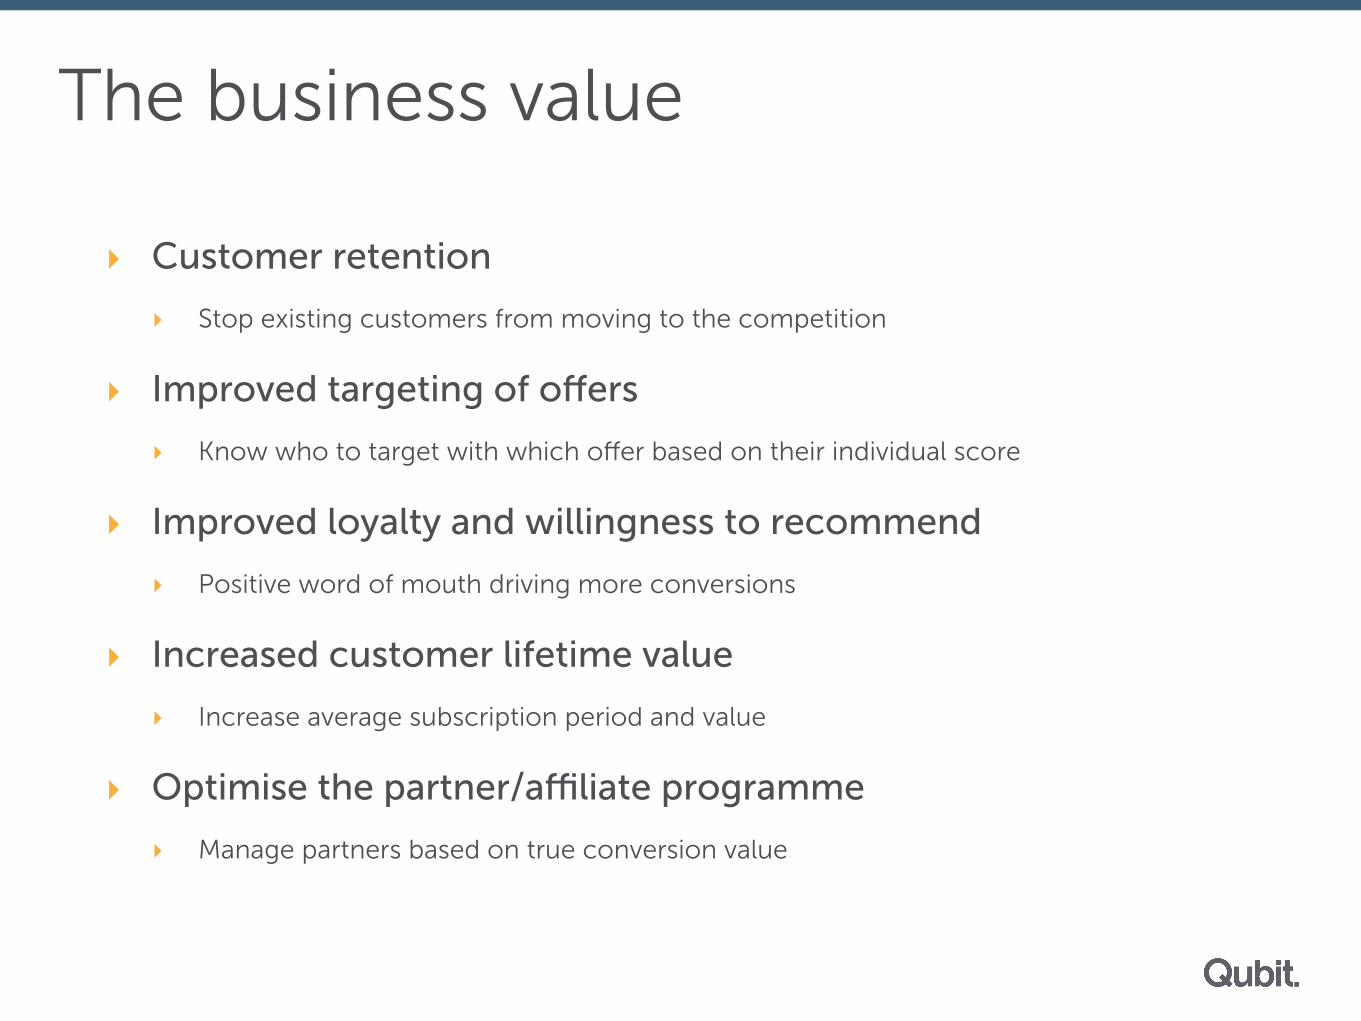
The business value
‣ Customer retention
‣ Stop existing customers from moving to the competition
‣ Improved targeting of offers
‣ Know who to target with which offer based on their individual score
‣ Improved loyalty and willingness to recommend
‣ Positive word of mouth driving more conversions
‣ Increased customer lifetime value
‣ Increase average subscription period and value
‣ Optimise the partner/affiliate programme
‣ Manage partners based on true conversion value
