predictions of professional economists …/67531/metadc501259/m2/1/high... · do predictions of...
TRANSCRIPT

/0 I
DO PREDICTIONS OF PROFESSIONAL BUSINESS ECONOMISTS CONFORM
TO THE RATIONAL EXPECTATIONS HYPOTHESIS?
TESTS ON A SET OF SURVEY DATA
THESIS
Presented to the Graduate Council of the
University of North Texas in Partial
Fulfillment of the Requirements
For the Degree of
MASTER OF SCIENCE
By
Russell Edward Dabbs, B.A.
Denton, Texas
August, 1989

Dabbs, Russell Edward, Do Predictions of Professional
Business Economists Conform to the Rational Expectations
Hypothesis? Tests on a Set of Survey Data. Master of
Science (Economics), August, 1989, 110 pp., 11 tables,
bibliography, 25 titles.
A set of forecast survey data is analyzed in this paper
for properties consistent with the Rational Expectations
Hypothesis. Standard statistical tests for "rational
expectations" are employed utilizing consensus forecasts
generated by an interest rate newsletter. Four selected
variables (Fed Funds rate, M1 rate of growth, rate of change
in CPI, and real GNP growth rate) are analyzed over multiple
time horizons. Results tend to reject "rational
expectations" for most variables and time horizons.
Forecasts are more likely to meet "rationality" criteria the
shorter the forecast horizon, with the notable exception of
forecasts of real GNP growth.

TABLE OF CONTENTS
LIST OF
Chapter
PageTABLES i............v................... iv
iii
1. INTRODUCTION .............. .. ........... 1
Hypotheses and Organization of the Paper
2. SURVEY OF RELATED LITERATURE ................ 8
BackgroundSurvey Data on ExpectationsEmpirical ResearchConsensus ForecastsSummary
3. METHODOLOGY ........................... 28
DataProperties of Rational ExpectationsStatistical Tests for RationalityAdaptive Expectations
4. FINDINGS . . . . . . . . . .. . . . . . . . .42
Preliminary Accuracy MeasuresUnbiasedness and Error OrthogonalityEfficiencyAdaptive ExpectationsSummary
5. SUMMARY AND CONCLUSIONS ..................... 82
APPENDIX A ..................... 85
APPENDIX B ..................... 90
APPENDIX C .......................... ...... 100
BIBLIOGRAPHY...................................109

LIST OF TABLES
Table Page
1. Preliminary Accuracy Measures .................. 43
2. OLS Unbiasedness Test Results .................. 46
3. Theil U Statistic and Decompositionof Mean Squared Error ....................... 51
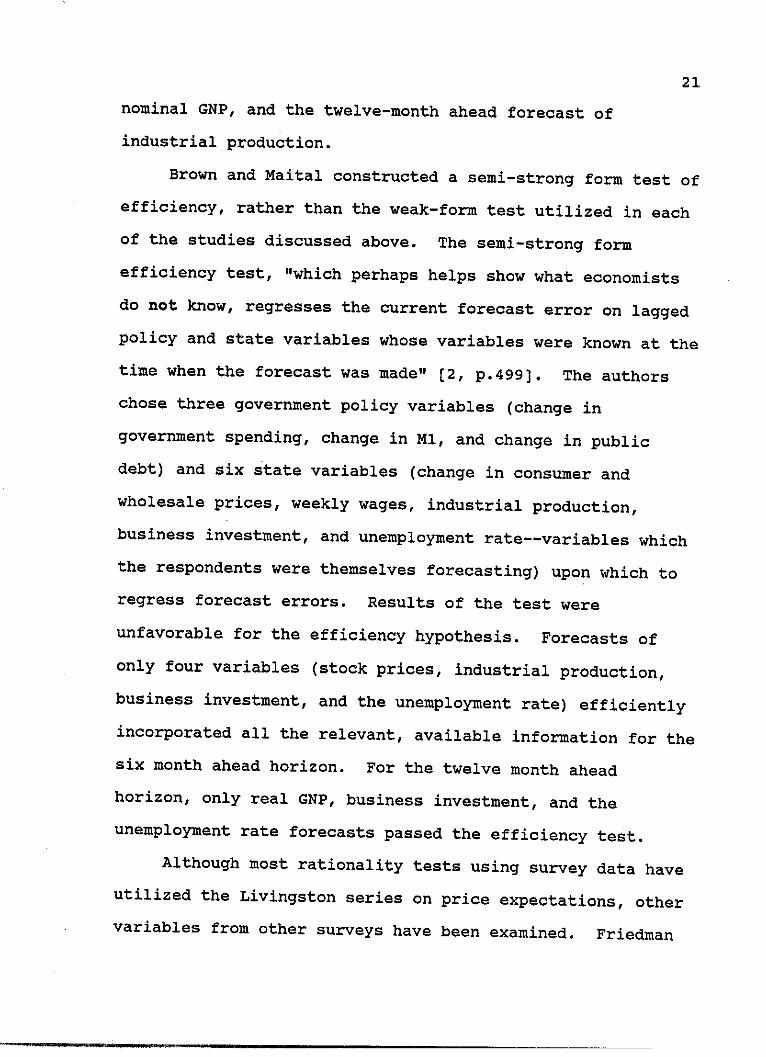
4. GLS Unbiasedness Test Results .................. 54
5. OLS Efficiency Test Results .................... 59
6. GLS Efficiency Test Results ................... 66
7. Adaptive Forecast Revision ..................... 71
8. GLS Results: Adaptive Forecast Revision ....... 75
9.0 Actual Data .................................... 0 0 0 0 00 000 8 7
10. Consensus Data ................................. 88
11. Autocorrelation Functions ...................... 92
iv

CHAPTER 1
INTRODUCTION
This study tests a set of forecast survey data for
"rationality." The purpose of such a study is twofold.
First, it will provide an opportunity to analyze predictions
of professional business forecasters, the accuracy of which
is an important consideration for forecast consumers. The
determinative bases of forecast accuracy may take various
forms. Forecasts may "be evaluated relative either to an
alternative forecasting procedure (traditionally a naive
method), or to a desired statistical property... " (3,
p.301]. This study will utilize standard statistical
properties associated with rationality as the criteria for
judging the forecast accuracy of the survey data used
herein.
The second purpose behind this study is to provide
additional evidence as to whether the "rational expectations
hypothesis" is a credible assumption to apply when analyzing
the actual behavior of economic agents. That is, are
expectations, as Muth suggested, "essentially the same as
the predictions of the relevant economic theory" [4, p.316]?
Since Muth's original hypothesis is now the fundamental
tenet upon which much contemporary macroeconomic modelling
1

2
is based, it is of interest to conduct direct tests of it.
Unfortunately, the testing of the rational expectations
hypothesis (or simply "rational expectations") is highly
problematic, due to the fact that the expectations of future
economic variables and economic conditions are unobservable.
Since reliable data on expectations are relatively scarce,
rational expectations is prone to be accepted or dismissed
on the basis of indirect tests of joint hypotheses, or even
simply on grounds of faith.
The intent of this study is to examine expectations
by analyzing a recent set of survey data generated by a
monthly interest rate newsletter. In this newsletter,
entitled Blue Chip Financial Forecasts, various professional
business economists provide monthly forecasts of several
important macroeconomic variables over multiple time
horizons. Because these forecasts represent expectations of
sophisticated observers of the economy, this data set
affords an opportunity to test observable "expert"
expectations data for accuracy and conformity with the
rational expectations hypothesis.
Three points illustrate the importance of the topic.
First, a pertinent question to ask of professional
forecasters is "How accurate are your predictions?" That
is, those who regularly employ the services of "experts"
should be interested in how well these experts' predictions
fare over time. Does the information they possess enable

3
them to forecast accurately? Which variables are "easier"
to predict accurately, and which are "harder"? What happens
to accuracy as forecast horizons lengthen? These issues
ought to be of concern to consumers of "expert" forecasts
such as those supplied by the Blue Chip newsletter.
Secondly, is there an alternative explanation to
"rationality" with regard to the structure of expectations?
The most compelling feature of rational expectations is its
ability to furnish an explanation of expectations formation
explicitly in line with economic theory. Other expectations
theories (such as "extrapolative expectations" and "adaptive
expectations") have been routinely criticized as
theoretically inadequate, or "ad hoc." Rational
expectations, on the other hand, offers the chance to
appropriate a theory of expectations formation in which
agents act upon all relevant, readily available information,
not just past, selective information, as is the case with
other expectations theories. However, if Milton Friedman's
dictum is true, that the value of a theory lies in its
ability to predict, what is to become of a theoretically
compelling model of expectations, such as rational
expectations, if it fails to attract empirical support?
Further, even if one of these so-called ad hoc models is
empirically satisfying, shall it nevertheless be disregarded
on the grounds of being less theoretically compelling than
rational expectations?

4
Finally, the testing of observable data on expectations
is important in terms of the implications of rational
expectations for macroeconomic theory in general.
Expectations of economic agents are a vital component of
macroeconomic modelling. Static models which do not include
the role of expectations have long been dismissed as
unsatisfactory representations of general macroeconomic
phenomena. As a result, the search for a suitable
explanation for expectations and a workable procedure for
incorporating expectations into macro models has been of
tremendous interest.
Emphasis on the role of expectations is largely
traceable to Keynes' General Theory ;f Employment, Interest,
and Money [2]. Indeed, much work in macroeconomics since
that book's publication has been devoted to translating
Keynes' "theoretical and discursive... expectations-based
theory into an operational theory with testable hypotheses"
[1, p.14]. Non-Keynesian macroeconomic theory has also
stressed the importance of expectations. "New Classical"
economics, in particular, has fashioned macroeconomic models
around endogenously formed expectations. However, macro
models with endogenous expectations depend upon a precise
specification of how those expectations are formed,
otherwise they cannot be tested. Yet a satisfactory,
sufficiently general specification is elusive, largely due
to the difficulty of performing direct tests on expectations

5
data to confirm or reject various expectations hypotheses.
It is for these reasons--examining forecast accuracy
and expectations formation, and the wider implications of
expectations for macroeconomic theory in general--that the
present study will be of interest. By no means will the
tests to be conducted herein, or even a series of such
tests, provide conclusive evidence whether rational
expectations should be accepted or rejected as a tenable
assumption underlying actual behavior. Nevertheless, the
intent is to provide an incremental indication of the
soundness of the theory.
Hypotheses and Organization of the Paper
The general hypotheses to be analyzed in this paper are
explicitly stated as follows:
Hypothesis I. Surveyed forecasts of a set of
professional business economists conform to the Rational
Expectations Hypothesis as defined in the literature, in
accordance with the standard statistical tests for its
validity. The following properties should hold for
forecasts to be deemed "rational":
(a) Forecasts should be unbiased predictors of
realized values.
(b) Forecasts should make efficient use of readily
available, relevant information.
(c) Forecast errors should exhibit no serial
correlation.

6
Hypothesis II. Surveyed forecasts of a set of
professional business economists exhibit an alternate form
of expectations formation, . adaptive expectations.
The organization of the paper is as follows. The
second chapter contains a survey of relevant literature
pertaining to expectations formation, specifically, the
Rational Expectations Hypothesis. The third chapter
outlines the methodological procedures of the study. The
fourth chapter presents the results of the methodological
procedures. The fifth chapter contains a summary of, and
conclusions drawn from, the study.
RI-mmm - - - -I,-,-- - 11 somplim

CHAPTER BIBLIOGRAPHY
1. Carter, Michael, and Maddock, Rodney. 1984. Rationalexpectations: macroeconomics for the 1980s? HongKong: Macmillan Publishers, Ltd.
2. Keynes, John Maynard. 1937. The general theory gfemployment, interest, and money. New York:Harcourt, Brace, & World, Inc.
3. McNees, Stephen K. 1978. The rationality of economicforecasts. American Economic Review 68 (May): 301-05.
4. Muth, John F. 1961. Rational expectations and the theoryof price movements. Econometrica 29 (July): 315-35.
7

CHAPTER 2
SURVEY OF RELATED LITERATURE
Background
In The General Theory of Employment, Interest, and Money,
Keynes outlined the importance of expectations in employment
determination, liquidity preference, and, especially, with
respect to investment. It is, he stated, "natural and
reasonable that expectations of the future should play a
dominant part in the scale on which new investment is deemed
advisable" [8, p.315]. Further, Keynes attributed the
"Trade cycle" primarily to investment volatility, which
itself could be largely traced to the "precarious" nature of
expectations. As a result, some understanding of
expectations and how they are formed was crucial to the
development of a satisfactory explanation of how the economy
operates. Yet the very "precariousness" of expectations
contributed to the difficulty of incorporating this crucial
element into economic models.
In addressing the problem of expectations, Keynes first
distinguished between short term and long term expectations.
In the "short term" (that period of time in which firms make
decisions regarding "daily" output of the goods they
produce, given existing capital),, Keynes suggested that
8

9
expectations most often follow a "naive" pattern--i.e.,
normally "it is sensible for producers to base their
expectations on the assumption that the most recently
realized results will continue...1" [8, p.51]. The "state of
long term expectation," however, could not be so easily
modelled. Long term expectations, according to Keynes, were
those upon which producers based their decisions about
whether or not to enter into business, or to increase or
reduce investment in new physical capital. It was unlikely
that long term expectations followed a naive pattern (or
"conventional rule," as he termed it). Was there then an
alternative generalization that could be made for the long
term? Not really, Keynes concluded. The reason for this
was that the long term was clouded by too much uncertainty.
A sound mathematical expectation could not be generated
based upon ignorance and uncertainty [8, p.152]. Keynes was
thus skeptical of attempts to discover "the" mathematical
structure of expectations. Human knowledge and behavior was
too varied, the future too uncertain. "[H]uman decisions
regarding the future... cannot depend on strict mathematical
expectation since the basis for making such calculations
does not exist" [8, p.162]. Thus, Keynes did not seriously
attempt to find an operational explanation of expectation
formation. Behavior was simply too complicated and the
future too uncertain to allow for any significant, widely
applicable generalization as to how expectations are formed.

10
A subsequent attempt to make a more precise
generalization regarding expectations was the extrapolative
model, which is essentially an extension of the naive model
(The naive model states that the forecast of the next value
of a variable will be the same as the last realized value.)
Extrapolative expectations can be expressed as follows:
EX- = Xt.1 + A(Xt.1 - Xt-2 ) (1)
where EX is the forecasted value of X. This suggests that
expectations are formed not only on the basis of the last
realized value, but also upon the direction of change of
that value, as well as upon the value of A, the coefficient
of expectation. A negative value of A suggests that
forecasts are regressive, i.e., the forecaster expects any
trend in X to be reversed, whereas if A is positive, the
forecaster expects any trend in X to continue. The
expression is reduced to the naive model when the
coefficient of expectation equals zero [4, p.19].
Another attempt to explain how expectations are formed
is the adaptive expectations model. In essence, adaptive
expectations asserts that forecasters revise their
expectations on the basis of prior forecast errors. The
model can be expressed as
EXt = EXt. 1 + A (Xt. 1 - EXt.1) (2)
where A is the "learning coefficient," which displays the
degree to which the forecaster adjusts his forecasts to
prior forecast error. Further, it is possible that

11
additional lagged terms of forecast error may be included,
suggesting that forecast revision is based not only on the
last period's error, but also on preceding forecast errors.
The advantage of utilizing the adaptive approach to
expectations is that it relies on the appealing assumption
that forecasters learn from their mistakes. As a result, a
proxy for unobservable expectations can be generated based
upon past actual observed values. This is more satisfying
than the naive "tomorrow will be the same as today" model,
which does not allow for learning on the part of the
forecaster. The adaptive model has been widely used in
various macroeconomic models which require. some explicit
form of expectation specification (for instance, with
respect to the Permanent Income Hypothesis and models
regarding inflationary expectations [1, p.10)).
A number of disadvantages accompany adaptive
expectations. The primary criticism of the adaptive model
is that it does not allow for the ability of individuals to
make predictions based upon rational behavior, or upon all
the information available to them. Rather, forecasts are
based solely upon observations of past errors--individuals
may learn from past errors, but cannot draw upon any other
information to help render more accurate forecasts.
The Rational Expectations Hypothesis addresses the
information problem inherent in models such as adaptive
expectations by suggesting that forecasters form predictions

12
based not only on past actual values and prediction errors
of a particular variable, but also upon all readily
available, relevant information. The explicit origin of the
hypothesis is traced to John Muth's "Rational Expectations
and the Theory of Price Movements" (14]. In that article,
Muth proposed that economic agents make efficient use of
information available to them, including knowledge of the
underlying structure of the economic system, such that
expectations of particular variables are, in the aggregate,
unbiased predictors of realized values. Rationality in this
sense means that forecasters will generate subjective
predictions of future values--conditional on available
information--consistent with the objective expected outcomes
generated by the system. Forecast accuracy is thus
primarily dictated by the extent of information available.
Situations characterized by a high degree of unpredictable
uncertainty and lack of information will engender erroneous
predictions (16, p.9]. At the other extreme, perfect
information will enable forecasters to make perfect
predictions. In either case, rationality presumes that
forecasters' predictions are unbiased estimates with respect
to given information, and that the available information is
efficiently utilized.
As a result, the rational expectations approach
represents a model which is appealing in the sense that it
assumes forecasters have information available to them

13
beyond simply knowledge of past values of the variable, or
of prior prediction errors for that variable. At the same
time, the main criticism of rational expectations is also
with respect to information: the theory appears to assume
too much information. Forecasters are assumed to know the
underlying economic structure generating the actual outcome
of the variable, and react correctly, over time, to any
unpredictable change in that structure. In essence,
rational expectations is usually criticized for assuming
that economic agents know more than they actually do. (See,
for instance, Friedman [6].)
Survey Data on Expectations
Testing hypotheses as to how expectations are formed is
difficult due to the unobservability of expectations. There
do not exist wide-ranging, reliable time-series data on
expectations, and it would be prohibitively expensive to
generate such data. Even if a large-scale effort to measure
expectations were to be conducted, serious reliability
problems would emerge. One problem is that actual market
expectations are not identical with sample surveyed
expectations. For instance, Hafer and Resler [8] address
the issue of surveys of experts who are not actually engaged
in those market activities about which their forecasts
pertain. "[E]conomic theory typically calls for the use of
the 'market's' expectations. Thus, only the expectations of
those participating either directly or indirectly in the

14
market should be considered appropriate" [8, p.1050].
A related problem is that not all respondents are
equally interested or equally equipped to provide consistent
responses. For one respondent, expectations concerning the
price level one year hence may be of intense interest, and
much calculation may go into forming his expectation. For
another respondent, prices may be of only limited interest,
and his forecast may be made very casually. Yet the
predictions of both are weighted equally. These and other
problems may exist with respect to survey data.
Still, survey data provide the only means for directly
testing expectations models. Most tests regarding rational
expectations are indirect, joint tests of expectations and
the rest of the model [1, p.29]. (In such cases, failure of
the model may be blamed on some other aspect of the model,
rather than its expectations specification.) Further,
criticisms of survey data are rendered less severe the more
homogeneous the surveyed group is. Most of the empirical
tests of rationality based on survey data utilize responses
from a relatively similar set of respondents. For instance,
the most widely known set of expectations survey data is the
"Livingston" index, in which professional business
economists are surveyed twice yearly for inflationary
expectations. (The present study also utilizes a set of
survey data consisting of forecasts of business economists.)
Thus, survey data provide a useful, if problematic, method

15
of directly testing forecast rationality.
Empirical Research
A number of studies on inflationary expectations exist
using the Livingston data, a survey of business economists
conducted by Joseph Livingston for the Philadelphia Bulletin
and later for the Philadelphia Inquirer. This data,
compiled since 1946, consists of forecasts of several
economic variables for both six-month ahead and twelve-month
ahead time horizons. The predictions for the Consumer Price
Index (after converting from levels to rates of change in
the CPI) has been most frequently used in empirical studies.
The earliest such study was by Turnovsky [17]. Turnovsky
analyzed the Livingston data for extrapolative and adaptive
expectations, predictive accuracy, and, "incidentally," for
rationality.
Turnovsky gathered thirty-one observations stretching
from 1954 to 1969 to test various propositions. The first
question the author addressed was whether or not there
existed a structural break in the data over the observed
period. Since inflation appeared to be systematically
underpredicted in the 1950s but more accurately predicted in
the 1960s, Turnovsky proposed that businessmen might have
adjusted their expectational procedures over that period,
such that the entire period should not be pooled together
[17, p.1447]. A Chow test for equality between two sub-
periods (an "early" [1954-1964] period, and a "later" [1962-
'I R-Iffil I I , , , , - .-. , .", -,

16
1969] period) was performed, the results of which tended to
confirm Turnovsky's hypothesis.
Next, Turnovsky analyzed the structure of expectations
of the early and later periods for both six month ahead
("short term") and twelve month ahead ("longer term") time
horizons. The findings were that both extrapolative and
adaptive models performed much better in explaining
expectations for the later period than for the early period,
for both the short- and longer-term forecast horizons.
Further, the extrapolative model was found to be superior to
the adaptive model for both periods, especially for the
longer term horizon.
Results of rationality tests tended toward rejection of
rationality for this data set. The early period clearly
suggested that expectations were biased, for both the short-
and longer-term; the later period performed much better, in
that unbiasedness could not be rejected. However, the
efficiency property of rational expectations was violated
for all but the short term, later period model.
Overall, the study emphasized that a significant change
in the content of the expectations data occured from the
1950s to the 1960s. Specifically, Turnovsky noted that
improvement of rationality and forecast accuracy and the
change in how expectations were formed over the two periods
served as strong indications of the increased importance of
accuracy for businesses and of the increased awareness of

17
the cost of inaccurate predictions during periods
characterized by inflation (such as the mid- to late 1960s).
Pesando [15) examined the Livingston data for
rationality for the expressed purpose of discussing its
appropriateness as a proxy for market price expectations.
For instance, if the Livingston data were not found to be
rational, then models which used it to stand for market
inflationary expectations (for instance, with respect to the
impact of expectations on nominal interest rates) would
necessarily incorporate irrational market expectations. Yet
he noted that a growing literature pointed to efficiency and
rationality in the equity and capital markets. Pesando
suggested that this latter point tends to engender
skepticism of the rationality of the Livingston data, rather
than skepticism of the rationality of unobserved market
expectations.
Pesando's findings were that the Livingston data did
not on the whole adhere to the properties of rationality.
Tests of two sub-periods (1959:1-1962:2 and 1962:1-1969:2)
indicated that efficient use of past information concerning
inflation ("weak-form efficiency"), but "consistency" was
rejected--i.e., "the information utilized in generating the
[six month ahead] forecasts [was not] applied consistently
to generate the [twelve month ahead] forecasts" [15, p.854].
Further, while unbiasedness for the short term forecasts
were not rejected, it was rejected for the longer, twelve

18
month ahead forecasts. Theil's decomposition of mean square
error (MSE) into bias, regression, and disturbance
components depicted a dramatic increase in the bias
proportion from the short- to longer term forecasts.
Pesando proposed that the significant downward bias
(systematic underprediction) in the longer term forecasts
largely accounted for the difference between the rationality
results of the two forecast horizons.
Carlson (3] analyzed the Livingston data more closely
and reformulated it to derive a series adjusted for some
problems existent in the original survey. Appropriating
Pesando's methodology, Carlson found that the reformulated
series was not consistent with rationality. Nevertheless,
while Carlson's findings substantially agreed with
Pesando's, his conclusions did not. Whereas Pesando
maintained that it was unlikely that the Livingston sample
accurately reflected actual market expectations, Carlson
stated that there was no reason to reject the Livingston
data as "representative of informed opinion about the state
and direction of the economy in the near future" (3, p.50].
Evidence that rationality does not hold could not be
dismissed simply due to skepticism about the data set.
Mullineaux [13] criticized the efficiency and
consistency tests employed by Pesando and Carlson as
generating "ambiguous" results. Consequently, Mullineaux
retested Pesando's data set, as well as Carlson's
WIN -mk I-W wljA-wIw4

19
"reformulated" Livingston data, using an alternative method.
He concluded that the rationality criteria was met using the
Carlson data, whereas Pesando's data exhibited inefficiency.
(The present study will adopt Mullineaux's formulation of
the efficiency test; this will be outlined formally in
Chapter 3.)
Hafer and Resler [8] addressed the question of
homogeneity of forecasters within the Livingston survey in a
1982 article. There is no reason to presume that all
forecasters surveyed possessed identical backgrounds, or
that each had identical incentives to generate precise
predictions. Using the consensus forecast of the Livingston
data, then, would call into question the reliability of the
survey to stand for "market expectations" (8, p.1050]. As a
result, Hafer and Resler attempted to disaggregate the
Livingston data according to groups, specifically into
responses made by: (1) non-financial businesses; (2)
academic institutions; (3) commercial banks; (4) investment
banks; (5) the Federal Reserve system; and (6) unspecified.
The authors suggested, for instance, that business
economists should be more consistent with rationality than
the academicians, on the presumption that their livelihood
is much more closely linked to their forecast accuracy--
"they undoubtedly have a stronger incentive to gather and
process relevant information in the forecasting process than
do their academic counterparts" [8, p.1051].

20
Results of the rationality tests employed by Hafer and
Resler, using the Mullineaux methodology, indicate that only
one of the categories, non-financial businesses,
consistently adhered to the rationality standards. A
possible explanation offered by the authors is that
forecasters in this group are closer to the actual
production processes of goods and services, and are thus
more aware of changes in raw material prices and production
costs. This gives them an advantage in spotting
inflationary trends.
Figlewski and Wachtel [5] disaggregated the Livingston
data according to individual responses. Pooling 1,864
observations obtained from seventy-one respondents who
answered a certain number of surveys conducted between 1946
and 1975, Figlewski and Wachtel tested for unbiasedness and
efficiency using weighted least squares. Their results
indicated that forecast bias was present, and that
forecasters did not make efficient use of their most recent
forecast errors.
Brown and Maital [2] analyzed the whole range of
expectations series compiled by Livingston, including such
variables as real and nominal GNP, weekly wages,
unemployment rate, and industrial production. Over the
sample period 1961:1 to 1977:4, most forecasted variables
exhibited unbiasedness. Bias was detected for only the six-
and twelve-month ahead forecasts of weekly wages and nominal
21
nominal GNP, and the twelve-month ahead forecast of
industrial production.
Brown and Maital constructed a semi-strong form test of
efficiency, rather than the weak-form test utilized in each
of the studies discussed above. The semi-strong form
efficiency test, "which perhaps helps show what economists
do not know, regresses the current forecast error on lagged
policy and state variables whose variables were known at the
time when the forecast was made" [2, p.499]. The authors
chose three government policy variables (change in
government spending, change in M1, and change in public
debt) and six state variables (change in consumer and
wholesale prices, weekly wages, industrial production,
business investment, and unemployment rate--variables which
the respondents were themselves forecasting) upon which to
regress forecast errors. Results of the test were
unfavorable for the efficiency hypothesis. Forecasts of
only four variables (stock prices, industrial production,
business investment, and the unemployment rate) efficiently
incorporated all the relevant, available information for the
six month ahead horizon. For the twelve month ahead
horizon, only real GNP, business investment, and the
unemployment rate forecasts passed the efficiency test.
Although most rationality tests using survey data have
utilized the Livingston series on price expectations, other
variables from other surveys have been examined. Friedman

22
[7] tested interest rate expectations for rationality using
the Goldsmith-Nagan Bond and Money Market Letter. Friedman
tested six interest rates for both three- and six-month
ahead forecast horizons. Using thirty quarterly
observations compiled over the period 1969-1976, Friedman
concluded that the results on the rationality of interest
rate expectations were "mixed" to "unfavorable." Ordinary
Least Squares (OLS) estimates tended to support
unbiasedness, but also exhibited serial correlation of the
disturbances which "constitutes a prima facie contradiction
of rationality." In addition, "the evidence of serial
correlation per se invalidates the F-tests that are
generally favorable to the unbiasedness hypothesis" [7,
p.457-458]. As a result, Friedman tested the data for
unbiasedness using a "seemingly unrelated regression" (SURE)
procedure. The SURE tests indicated that the forecasts were
biased. Further, Friedman concluded that forecasts in the
Goldsmith-Nagan letter did not efficiently incorporate
readily available, relevant information.
Urich and Wachtel [18] tested expectations survey data
available on the weekly money supply announcement. Money
Market Services supplied this data, consisting of forecasts
of the change in M1 for ninety-five weeks from March, 1978
to January, 1980. Urich and Wachtel conducted rationality
tests on 20 individual respondents in the survey, on the
mean (or consensus) forecast, and on the pooled data of all

23
individuals over the entire series. The authors assert that
tests on the mean forecast introduces an aggregation bias
which distorts the test; "the survey mean may not be a
rational forecast even when all individual forecasts are
rational" [18, p.186]. In addition, a pooled cross section-
time series test may tend toward the rejection of
unbiasedness even when individual responses are rational,
due to very large sample size. As a result, the preferred
approach, according to Urich and Wachtel, are tests on
individual respondents. Standard rationality tests applied
to twenty individuals led to the rejection of unbiasedness
in about half of the cases, while all respondents met the
efficiency criterion.
Rationality tests have also been applied to specific
forecasting models as a method of determining forecast
accuracy. McNees [12] tested three notable forecast series
(those generated in the early 1970s by Chase Econometrics,
Wharton Econometrics, and Data Resources, Inc.) of the GNP
deflator, real GNP, and the unemployment rate, for multiple
(1-4 quarters ahead) forecast horizons.
Due to the presence of serial correlation, McNees
tested his data set for unbiasedness and efficiency using
both OLS and Generalized Least Squares (GLS). Results were
mixed. With GLS, rationality was not rejected (forecasts
were unbiased and efficient) in seventeen of the thirty-six
(3 forecasters times 3 variables times 4 forecast horizons)
wwvlw*"MwwwAw -4,. -6 quo

24
forecasts; rationality was rejected (due to evidence of bias
or inefficiency or both) with the remaining forecasts.
Consensus Forecasts
The data set analyzed in the present study will utilize
the consensus forecast of panelists surveyed by the interest
rate forecast newsletter Blue Chip Financial Forecasts. A
consensus forecast is simply the average of a set of
individual forecasts. Several articles (eg., Zarnowitz
[19], Makridakis and Winkler (10], McNees (11]) have
addressed forecast accuracy of consensus forecasts vis a vis
the individual forecasts of which they are composed.
Findings indicate that consensus forecasts "are more
accurate than most, sometimes virtually all, of the
individual forecasts that constitute the consensus" [11,
p.15]. The consensus forecast can be thought of as a
vehicle by which various forecasting methods of numerous
individuals are incorporated into one information set.
Hence, the consensus forecast should be more accurate
(unbiased and efficient) relative to most--if not all--of
the individual forecasts. A formal test of this proposition
(i.e.,, "Is the consensus forecast more accurate than the
individual forecasts within the Blue Chip survey?") is
beyond the scope of this paper. Nevertheless, from previous
empirical work, it is not unreasonable to suggest that the
Blue Chip consensus forecast should represent predictions of
economic variables which are more accurate than most of the

25
individual forecasts of which the consensus is composed.
Summary
Expectations of future values of economic variables is
a vital consideration both for the business sector, which
seeks accurate predictions of future economic conditions, as
well as for economic theory, which seeks an operational
explanation of expectations and how they are formed.
Various explanations of expectation formation have been
offered such as the naive model, extrapolative expectations,
and adaptive expectations. The Rational Expectations
Hypothesis suggests that, in the aggregate, individuals'
subjective expectations are consistent with the objective
probability distributions which generate the actual values
of economic variables. In other words, expectations are
unbiased and efficient predictors of realized values.
Empirical research has utilized survey data on expectations
to directly test the hypothesis, as well as evaluate
forecast accuracy based upon the statistical properties of
rationality. Such tests, on various sets of survey data,
have been generally unfavorable to the rational expectations
hypothesis.
The next chapter will discuss the data and methodology
used in the present study, which tests a recent set of
forecast survey data for accuracy and conformity to the
rational expectations hypothesis.

CHAPTER BIBLIOGRAPHY
1. Attfield, C., Demery D., and Duck, N. W. 1985. Rationalexpectations 'in macroeconomics: An introductionto theory and evidence. New York: Basil Blackwell,Inc.
2. Brown, Bryan W., and Maital, Schlomo. 1981. What doeconomists know? An empirical study of experts'expectations. Econometrica 49 (March): 491-504.
3. Carlson, John A. 1977. A study of price forecasts.Annals of Economic and Social Measurement 6: 27-56.
4. Carter, Michael, and Maddock, Rodney. 1984. Rationalexpectations: Macroeconomics for the 1980s? HongKong: Macmillan Publishers, Ltd.
5. Figlewski, Stephen, and Wachtel, Paul. 1981. Theformation of inflationary expectations. The Reviewof Economics and Statistics 58 (February): 1-10.
6. Friedman, Benjamin M. 1979. Optimal expectations and theextreme information assumptions of rationalexpectations models. Journal of MonetaryEconomics 5: 23-41.
7. Friedman, Benjamin M. 1980. Survey evidence on therationality of interest rate expectations.Journal of Monetary Economics 6: 453-65.
8. Hafer, R. W., and Resler, David H. 1982. On therationality of inflation forecasts: A new lookat the Livingston data. Southern EconomicJournal 48 (April): 1049-55.
9. Keynes, John Maynard. 1937. The general theory ofemployment, interest, and money. New York:Harcourt, Brace, & World, Inc.
10. Makridakis, Spyros, and Winkler, Robert L. 1983.Averages of forecasts: Some empirical results.Management Science 29 (September): 987-96.
11. McNees, Stephen K. 1987. Consensus forecasts: Tyranny ofthe majority? New England Economic Review (November/December): 15-21.
26

27
12. McNees, Stephen K. 1978. The rationality of economicforecasts. American Economic Review 68 (May): 301-05.
13. Mullineaux, Donald J. 1978. On testing for rationality:Another look at the Livingston price expectationsdata. Journal of Political Economy 86:329-36.
14. Muth, John F. 1961. Rational expectations and the theoryof price movements. Econometrica 29 (July): 315-35.
15. Pesando, James E. 1975. A note on the rationality of theLivingston price expectations. Journal of PoliticalEconomy 83: 849-57.
16. Sheffrin, Steven M. 1983. Rational expectations. NewYork: Cambridge University Press.
17. Turnovsky, Steven J. 1970. Some empirical evidence onthe formation of price expectations. Journal of theAmerican Statistical Association 65: 1441-54.
18. Urich, Thomas, and Wachtel, Paul. 1984. The structure ofexpectations of the weekly money supplyannouncement. Journal of Monetary Economics 13: 183-94..
19. Zarnowitz, Victor. 1984. The accuracy of individual andgroup forecasts from Business Outlook surveys.Journal of Forecasting 3: 11-26.

CHAPTER 3
METHODOLOGY
Data
The survey data on expectations for this study is
obtained from a monthly newsletter called Blue Chip
Financial Forecasts, subtitled "What Top Analysts Are Saying
About Interest Rates and Monetary Policy." The publication
is primarily devoted to forecasts of various interest rates;
over a dozen different rates are currently forecasted. In
addition, however, a handful of other variables are
forecasted on the grounds that they are "key assumptions"
underlying the interest rate forecasts (i.e., they may have
a significant determining influence on interest rates).
This study will conduct rationality tests on one of the
interest rate forecasts--the Federal Funds rate (FFR)--and
three of the "key assumption" variables: quarterly changes
in M1, in the Consumer Price Index (CPI), and in real Gross
National Product (GNP).
The forecast data is organized in the following manner.
Respondents are asked to forecast selected variables over
expanding time horizons; specifically, respondents make
monthly forecasts of quarterly data 1-5 quarters ahead. The
participants are approximately 40-45 professional business
economists employed by various companies, primarily large
28

29
commercial banks and other financial institutions. The
monthly mean of individual forecasts constitutes the Blue
Chip consensus forecast used in this study. The size and
composition of respondents in the consensus vary over the
sample period.
Ideally, the individual forecasts should be analyzed
as well. This would allow for comparisons between the
consensus forecast and the individual forecasts of which it
is composed. This is not feasible, however, because not
enough individuals are consistently identified throughout
the entire length of the data set; no meaningful conclusions
could be drawn from such an exercise. As a result, this
study will focus exclusively on the consensus forecast.
Reliance on the consensus should, nevertheless, provide
sufficient information as to how accurate this set of
professional forecasters are. Since previous studies (cited
in Chapter 2) indicate that a consensus or group mean
displays superior predictive accuracy to most of the
individuals within the group, a reasonable a priori
assumption is that the Blue Chip consensus will be more
accurate relative to most of the individual forecasts of
which it is composed. In essence, the Blue Chip consensus
may be thought of as equivalent to the more accurate of the
individual forecasters. This study will analyze the 1-4
quarter ahead consensus forecasts of the four variables
mentioned above. The relevant forecasts are those made

30
nearest the beginning of each quarter; as a result, the
forecast figures are obtained from the January 1, April 1,
July 1, and October 1 editions of the Blue Chip newsletter.
Thus, a one quarter ahead consensus forecast reported
January 1 represents the forecast for the first quarter of
that year; a two quarter ahead forecast represents the
forecast for the second quarter of that year; and so on.
Forecasts for the Fed Funds rate and Ml are obtained
beginning with the April 1, 1983 issue of the Blue Chip
newsletter. Forecasts for CPI and real GNP commenced with
the July 1, 1984 issue; hence, forecasts for these variables
are obtained from the July 1, 1984 issue onward. Actual
data is quarterly from 1983:2-1988:3 for FFR and M1, 1984:3-
1988:3 for CPI and GNP. Thus, the sample period for FFR and
M1 includes 22, 21, 20, and 19 observations, for one-, two-,
three-, and four-quarter ahead forecasts (respectively).
CPI and GNP forecasts include 17, 16, 15, and 14
observations for the 1-4 quarter ahead time horizons.
Analysis of multiple time horizons should provide some
of the most interesting results. It is reasonable to
hypothesize at the outset that accuracy should decay as
forecast horizons expand, regardless of whether the
forecasts conform to rationality or not. Thus, this study
also allows for a "test" to see if this very reasonable
presupposition holds for the variables selected from this
particular data set.

31
Properties of Rational Expectations
As a formal definition, expectations are said to be
rational if the conditional expectation of the variable in
question conforms to the mathematical expectation of the
actual value of the variable. This is to suggest that the
expectation, or forecast, of a variable X for time t, given
all the relevant information (I) readily available in time
t-1, should, on average, be correct. This may be expressed
as
E (X: It 1) = X . (1)
Should the forecaster possess "perfect foresight," the
information contained in It.. will not only be information
which is "readily available," but all possible information
concerning the variable in question--perfect information.
In this case, the actual value will always equal the
expected value. Without perfect information, some random
error should accompany expectations, i.e., the forecaster
will make efficient use of all information contained in I.,
such that any deviation of expectations from actual values
are attributable to some non-systematic, or random,
influences. This may be expressed as
Xt = E(Xt:It.1) +ct (2)
where et represents a random error term. Furthermore, the
expected value of the error term is zero. That is, if
Et = Xt - E(Xt:It-1) (3)
then

32
E(zt:It.1) = E(Xt:It-1 )
- E (Xt.1: It-,) = 0. (4)
For expectations to be "rational," all deviations of actual
X from predicted X must be captured in the error term. If
not, this indicates the presence of "systematic error" in
the forecasts--readily available information on which
predictions of X are based is not being used efficiently.
A further implication of rational expectations is that
all errors made in previous forecasts constitute readily
available information, and as such should be integrated into
the information set available to the forecaster, i.e., Ct-1
should be integrated into It... This leaves any forecast
error on Xt attributable to et alone. Thus, errors made in
time t should be orthogonal to both information available in
time t-1 and errors made in time t-1. This may be expressed
as
E(ct-It: It.1) = 0 (5)
and
E(C -Ct..) = 0 , where t>s. (6)
In essence, the focal question addressed in this study
--"Are the expectations of the surveyed forecasters
rational?"--may alternatively be posed as "Do these
forecasters make systematic (non-random) mistakes in their
predictions?" To be considered "rational," then, the Blue
Chip consensus forecasts should be consistent with the
properties outlined above.

33
Statistical Tests for Rationality
There exist several "standard" statistical tests for
the properties of rational expectations. The primary tests
are for unbiasedness, efficiency, and absence of
autocorrelation amongst the error terms.
1. Unbiasedness. From (2), it follows that a forecast
(EXt) is an unbiased estimator of the actual value (XJ) if a
regression equation is of the form
X = a + PEXt + Ct , (7)
where a=O, P=1.
That is, EXt is an unbiased predictor of X if the joint
null hypothesis (a,3) = (0,1) cannot be rejected.
2. Efficiency. From (5), it follows that forecast
errors generated in time t which are correlated with
information in time t-1 indicate an inefficient use of
readily available, relevant information. Theoretically,
such information should have been incorporated into the
forecast for time t to render a more accurate prediction.
Efficiency tests attempt to discover whether or not
information is being efficiently processed by forecasters.
Fully efficient incorporation of readily available,
relevant information suggests that the way the actual
process by which X is generated is equal to the process by
which forecasts are generated. That is, if X, behaves over
time as
Xt = ao + aiXt.1 + ... + angt.. + E (8(8)

34
then EXt should similarly evolve as
EXt = PO + 1Xt..1 + ... + PnXt.- + At (9)
such that ai=Pi, for all i. Following Mullineaux [3], we
subtract (9) from (8) to get
Xt'- EXt = 0o + - 1X. 1 + ... + Xt.. + . (10)
A "weak-form" efficiency test regresses forecast errors
of X (i.e., Xt-EXt) on lagged actual values of X. In this
instance, the forecast is weak-form efficient if H: '7 1= 72
= ... 0= 1, = 0 cannot be rejected. If H is rejected, then
efficiency is rejected. That is, "any non-zero coefficients
indicate that information was available the time the
forecasts were made which could have reduced forecast
errors, but was not properly incorporated into expectations"
[2, p.3].
This study will employ a semi-strong form efficiency
test, which includes more information on which forecast
errors of X are regressed than simply lagged values of X. A
semi-strong form test involves inclusion as independent
regressors lagged values of other variables which should
have been known to the forecaster at the time the forecast
was made. Specifically in regard to the present study, in
which four forecasted variables are analyzed, semi-strong
form efficiency tests will be constructed for each variable
using lagged values of itself and the other three as
independent regressors. For instance, forecast errors for
M1 (Mlerrort) should be unrelated to its own lagged value,

35
plus the lagged values of the Fed Funds rate, CPI, and real
GNP, i.e., for the regression equation
Mlerrort = 60 + 61Mlt.. + 62 FFRt..
+ 63 CPIt1 + 6 4GNPt.. (31)
forecasts for M1 are not semi-strong form efficient if the
joint hypothesis H.: 61 = 62 = 63 = 64 = 0 is rejected.
An important consideration remains with respect to
properly lagging the values of each independent variable.
That is, rejection of efficiency suggests that readily
available information was not incorporated into the
forecasters' information sets. Thus, it is crucial that the
independent variables be lagged far enough back so as to
ensure that such information was indeed readily available.
For example, (11) implies that a forecast made for the first
quarter of 1988 should be based upon an information set
which includes the actual values of each of the four
variables in the immediately previous quarter. However,
since a forecast published January 1, 1988 must necessarily
be made some time prior to January 1, actual values of those
variables for the previous period cannot be known to the
forecasters at the time the forecast is made, since final
figures for that period have not yet been generated. At
best, the forecaster will have access to preliminary data
indicating the approximate value of the variable for 1987:4.
However, all forecasters should have incorporated all final
realized values for 1987:3. As a result, the efficiency

36
test conducted herein will suggest that all forecasts, for
each (1-4) time horizon, should incorporate information
regarding realized values from at least two periods back,
i.e., the example characterized by (11) should be modified
to read
Mlerrort+, = So + S6M1..2 + 62FFRt-2
+ 63 CPIt-2 + 6 4GNPt-2 (12)
where s = 0,...,3 for forecast horizons 1-4, respectively.
3. Nonautocorrelation of error terms. Equation (6)
suggests that the forecast error generated in time t should
be serially uncorrelated with past forecast errors.
Autocorrelation indicates systematic errors by forecasters.
As a result, the presence of autocorrelation in the
unbiasedness regression equation (7) constitutes sufficient
evidence for rejection of rationality.
Adaptive Expectations
The Blue Chip forecast data set will also be tested to
determine the extent to which the consensus forecasts of the
four selected variables are formed adaptively. The Adaptive
Expectations Hypothesis asserts that individuals revise
their forecasts based upon their observations of past
forecasting errors. The adaptive model is in general
expressed as
EXt = EXt-1 + A (Xt-1 - EXt-1 ) (13)
where X and EX are the realized and forecasted values of the
variable, respectively. A represents the "learning

37
coefficient," i.e., indicates the degree to which the
forecaster adjusts his forecast to prior observed forecast
error. A learning coefficient of zero indicates, of course,
that past errors have no influence on forecast revision.
The greater the value of A, the greater the sensitivity of
subsequent forecasts to past forecast errors. A negative
value of A indicates that forecasts tend to exhibit
"regressivity," i.e., "survey respondents expect past errors
or actual changes to be reversed" [5, p.191].
Statistical investigation of adaptive influences is
facilitated by transforming (13) into the following
expression:
EXt - EXt.1 = AO + A1(Xt-1 - EXt-1 ) (14)
i.e., forecast revisions are regressed upon past forecast
errors. A value of A, statistically different from zero
indicates adaptive influences, the degree of which, again,
depends upon the size of A.
As with the efficiency test discussed earlier, the
issue of properly lagging past errors arises. Again, it is
vital that the information set contain realized values of
past errors. As a result, the form of the adaptive model as
expressed in (14) should be modified. Since forecasts are
made in the last month of each quarter, forecasters cannot
have access to final, actual figures for that quarter.
Consequently, they do not yet know the exact value of their
forecast error in that quarter. Strictly speaking, those

38
errors should not be included in their information sets.
The adaptive model should be altered to ensure that forecast
revision is based upon knowledge of realized forecast
errors.
However, at this point we will relax this constraint
with respect to two of the variables: the Fed Funds rate.and
Ml growth. Readily available actual data on these variables
exist throughout each quarter (weekly figures for M1, daily
figures for Fed Funds). As "sophisticated observers" of the
economy, these forecasters presumably keep abreast of such
information as it is disseminated, and thus have a
relatively accurate idea of the magnitude of their forecast
errors throughout that period. Further, we will assume
that, when forecasts are made, the most recent actual
figures on these two variables are not significantly
different from the final reported actual values for that
period. In other words, we will assume that actual data for
these variables is sufficiently available throughout the
quarter, and reasonably close to final quarterly figures
when forecasts are made, to enable forecasters to predict
future quarter values as if they knew the final, realized
values of forecast errors when they make their predictions.
For instance, a one-quarter ahead forecast for Fed
Funds published January 1, 1988 is generated sometime in
December, 1987. At that point, the forecaster does not know
the final actual value of the Fed Funds rate for 1987:4.

39
However, since the actual value of the Fed Funds rate is
published on a daily basis, the forecaster has access to a
current actual figure throughout December. It is reasonable
to suggest that this figure will not normally be
substantially different from the final actual value for
1987:4. As a result, forecast revision, with respect to M1
and Fed Funds, will be regressed on forecast errors in the
following fashion:
EXt+, - EXt- = A0 + xl(Xt-l - EXt. 1 ) (15)
where s = 0,...,3 for forecast horizons 1-4, respectively.
On the other hand, actual data regarding CPI and GNP
are not as frequently and efficiently issued as Fed Funds
and M1 figures are. Consequently, these variables will be
treated more conservatively by asserting that the last
realized forecast errors available to forecasters are those
of two periods back. For instance, multiple horizon
predictions published January 1, 1988 by Blue Chip may be
influenced by past prediction errors observed for 1987:3,
but not 1987:4. Forecasters do not have sufficient
information to assume they accurately know the final 1987:4
figure, and thus they cannot know their 1987:4 error. For
CPI and GNP, then, forecast revision will be regressed on
forecast errors according to (16):
EXt+S - EXt.. = A0 + X 1(Xt-2 - EXt-2 ) (16)
where s = O,...,3 for forecast horizons 1-4, respectively.

40
Notice that, in this instance, forecasters revise their
(t-1) predictions according to their (t-2) forecast errors,
which is not in the strictest sense consonant with the
adaptive model as expressed by (14). The modification
contained in equation (16), however, makes more intuitive
sense. Logically, forecasters should adjust their
immediately previous predictions (EXt.1), rather than their
forecasts of two periods back (EXt-2), to the most recent,
realized forecast errors (Xt-- - EXt-2) Forecasters will
always be concerned with their most recent prediction,
rather than any predictions which may have preceded it.

CHAPTER BIBLIOGRAPHY
1. Brocato, Joe, Kumar, Akhil, and Smith, Kenneth L. 1989.Individual versus group spot price forecasting inthe international petroleum market: A case study.Managerial and Decision Economics 10: 13-24.
2. Figlewski, Stephen, and Wachtel, Paul. 1981. Theformation of inflationary expectations. The Reviewof Economics and Statistics 58 (February): 1-10.
3. Mullineaux, Donald J. 1978. On testing for rationality:Another look at the Livingston price expectationsdata. Journal of Political Economy 83: 849-57.
4. Sheffrin, Steven M. 1983. Rational expectations. NewYork: Cambridge University Press.
5. Urich, Thomas, and Wachtel, Paul. 1984. The structure ofexpectations of the weekly money supplyannouncement. Journal of Monetary Economics. 13:183-94.
41

CHAPTER 4
FINDINGS
Preliminary Accuracy Measures
Examination of Table 1 provides a preliminary
indication of the forecast accuracy of the Blue Chip
consensus for the four variables analyzed in this study. In
Table 1, the Mean Error (ME), Mean Absolute Error (MAE),
Root Mean Squared Error (RMSE), and Root Mean Squared Error
divided the standard deviation of actual values (RMSE/SD)
are presented for each variable, for each of the 1-4 quarter
forecast horizons. On the basis of the first three
measures, forecasts of M1 growth appear to be the most
inaccurate. Yet this is somewhat misleading, since the
variance of M1 was substantially greater than it was for the
other variables.' It is clearly more difficult to accurately
predict a variable whose actual values "jump around" a great
deal than it is to predict one whose actual values exhibit
relatively little variability. As a result, the RMSE/SD
measure best facilitates inter-variable comparison. The Fed
Funds rate forecasts perform best over the 1-3 quarter ahead
time horizons. The RMSE/SD for real GNP growth is lowest
among the four-quarter ahead forecasts. Note that Ml growth
forecasts improve dramatically after accounting for the
variability of actual values.
42

43
TABLE 1
PRELIMINARY ACCURACY MEASURES
1 0 AHEAD 2 0 AHEAD 3 0 AHEAD 4 0 AHEAD
FED FUNDS RATE
ME -0.061 0.107 0.396 0.721MAE 0.455 0.926 1.212 1.428RMSE 0.622 1.193 1.558 1.825RMSE/SD 0.425 0.801 1.047 1.229
M1 GROWTH
ME -1.091 -1.214 -1.320 -1.611MAE 3.246 3.957 4.380 4.495RMSE 4.150 5.097 5.483 5.635RMSE/SD 0.871 1.059 1.111 1.129
RATE OF CHANGE IN CPI
ME 0.682 1.069 1.353 1.600MAE -0.965 1.281 1.487 1.643RMSE 1.657 1.934 2.195 2.502RMSE/SD 1.002 1.156 1.267 1.409
REAL GNP GROWTH
ME -0.247 -0.244 -0.407 -0.571MAE 1.659 1.506 1.327 1.229RMSE 1.906 1.774 1.551 1.468RMSE/SD 1.372 1.252 1.115 1.022
NOTE: ME=Mean Error, MAE=Mean Absolute Error,RMSE=Root Mean Squared Error,RMSE/SD=Root Mean Squared Error divided by standarddeviation of actual values.
Forecasts on the Fed Funds rate and Ml are for1983:2 to 1988:3. Forecasts on real GNP and the CPIare for 1984:3 to 1988:3.

44
The most interesting conclusion to draw from Table 1
concerns the question of what happens to accuracy as
forecast horizons lengthen. The multiple horizon
predictions of the Blue Chip consensus present an
opportunity to investigate the reasonable hypothesis that
forecast accuracy (and rationality) decays as forecast
horizons expand. Table 1 presents preliminary evidence to
show that this may not hold for all variables. For Fed
Funds, M1, and CPI forecasts, the hypothesis holds--accuracy
deteriorates as forecast horizons lengthen. This is not the
case for forecasts of real GNP growth. Forecast accuracy
actually improves as horizons lengthen for this variable, on
the basis of the MAE, RMSE, and RMSE/SD measures.
This result is in line with previous findings. While
it is true that, in general, forecast accuracy worsens as
time horizons lengthen, there are some variables (such as
both nominal and real GNP) that tend to exhibit the opposite
property. The reasoning behind this is that such variables
are often characterized by error "off-set," as opposed to
error "build-up". McNees characterizes the phenomenon in
this way:
Often, a surprise in real GNP growth in onequarter portends a surprise in the oppositedirection in the next quarter. Recall, forexample, the unexpected declines in real GNPfor in the second quarters of both 1979(energy shortage) and 1980 (credit controls).In each case, the unexpected weakness wasfollowed by unexpected strength in the sub-sequent quarter. Forecasts of the. half-yeartime span that included both quarters weremore accurate than those of either quarter

45
alone, thanks to errors of opposite signs inthe quarterly pattern [4, p.23].
Conversely, forecast errors of other variables tend to
accumulate, i.e., an unexpected change in one quarter is
often followed by an unexpected change in the next quarter
in the same direction, such that a one-quarter ahead
forecast error derived from the first unanticipated change
is less than a two-quarter ahead forecast error which is
composed of the cumulative changes of both periods.
The results arrayed in Table 1 give preliminary
indication as to how accurate the Blue Chip consensus
forecasts are for the four selected variables. The next two
sections present the results of tests outlined in Chapter 3
designed to- determine whether or not the Blue Chip forecasts
conform to the properties of rational expectations.
Unbiasedness and Error Orthogonality
The necessary conditions for rationality addressed in
Chapter 3 include unbiased forecasts, efficient use of
readily available information, and orthogonality of forecast
error terms. Discussion of test results will commence with
the Ordinary Least Squares (OLS) test for unbiasedness.
Table 2 presents the OLS unbiasedness test results.
Recall from Chapter 3, equation (7), that forecasts are
unbiased predictors of actual values if for the expression
Xt = a + PEXt + ft, (1)
(where X and EX are realized and forecasted values,

46
TABLE 2
OLS UNBIASEDNESS TEST RESULTS
ForecastHorizon aP1 Fl,..k DW R2
FED FUNDS RATE
1 Q ahead
2 Q ahead
3 Q ahead
4 Q ahead
1.243(1.889)
0.852(10.505)
2.780 0.644(2.394) (4.579)
3.850 0.489(2.657) (2.863)
4.464(2.791)
0.395(2.151)
1.793
3.325
1.717 0.839
0.776* 0.500
5.436* 0.512* 0.275
7*973* 0.372* 0.168
M1 GROWTH
1 Q ahead
2 Q ahead
3 Q ahead
4 Q ahead
. -5.373(-1.296)
1.855(3.453)
9.328 -0.117(1.193) (-0.109)
24.627(2.719)
-2.278(-1.800)
32.546 -3.413(3.241) (-2.395)
2.143
1.184
0.982* 0.374
0.620* -0.052
4.155* 0.692* 0.106
6.042* 1.023* 0.208
NOTES: Forecasts on Fed Funds rate and M1 are for 1983:2 to1988:3.T-statistics are in parentheses.DW is the Durbin-Watson statistic.2 is the adjusted R-square.The F-statistic is for the joint hypothesis(a=0,P=1) with k, n-k (k=2, n=19,...,22) degreesof freedom for forecast horizons 4, 3, 2, 1,repectively.
* Significant at the 5 percent level.+ Inconclusive at the 5 percent level.

47
TABLE 2 (Continued)
OLS UNBIASEDNESS TEST RESULTS
ForecastHorizon aP# Fk,n-k DW RK2
RATE OF CHANGE IN CPI
1 Q ahead
2 Q ahead
3 Q ahead
4 Q ahead
-0.728(-0.380)
0.113(0.042)
1.011(2.094)
0.718(1.139)
0.816 0.516(0.253) (0.723)
3.333(0.965)
-0.059(-0.081)
1.752
3.427
2.814+ 0.175
2.037 0.020
4.652* 1.940 -0.035
6.289* 1.883 -0.083
REAL GNP GROWTH
1 Q ahead
2 Q ahead
3 Q ahead
4 Q ahead
6.035(4.944)
-1.004(-2.448)
6.629 -1.169(3.768) (-1.990)
4.958 -0.573(1.682) (-0.567)
-0.347(-0.123)
1.431(1.287)
12.289* 2.170
7.101* 2.498
1.821 2.081
1.218 2.401
NOTE: Forecasts on1988:3.T-statistics
CPI and real GNP are for 1984:3 to
are in parentheses.DW is the Durbin-Watson statistic.k2 is the adjusted R-square.The F-statistic is for the joint hypothesis(a=0,P=1) with k, n-k (k=2, n=14,...,17) forforecast horizons 4, 3, 2, 1, respectively.
* Significant at the 5 percent level.+ Inconclusive at the 5 percent level.
0.238
0.165
-0.051
0.048

48
respectively), the joint null hypothesis (a,p) = (0,1)
cannot be rejected. Significant F-statistics in Table 2
warrant rejection of the joint null hypothesis, i.e.,
rejection of unbiasedness.
Unbiasedness is unambiguously rejected for the three-
and four-quarter ahead forecasts of CPI, and cannot be
rejected for the shorter one- and two-quarter ahead
forecasts. The opposite conclusions are drawn for real GNP.
As discussed above, the longer-horizon three- and four-
quarter ahead forecasts are actually more accurate than the
shorter-term one- and two-quarter ahead forecasts. The OLS
results reinforce this finding, since in this case the one-
and two-quarter ahead forecasts are biased, while the three-
and four-quarter ahead forecasts are not. CPI and real GNP
forecasts also meet the error orthogonality criterion of
rational expectations; the Durbin-Watson statistics
contained in Table 2 indicate the absence of any significant
serial correlation.
Results for the Fed Funds rate and M1 growth are less
clear. For both, the F-statistics indicate rejection of
unbiasedness for the three- and four-quarter ahead
forecasts, while the one- and two-quarter ahead forecasts
cannot be rejected. However, the Durbin-Watson statistic
indicates significant autocorrelation for both variables,
for all time horizons (with the exception of the one quarter
ahead Fed Funds forecast.) Since OLS F-statistics are not

49
reliable when autocorrelation is present, no meaningful
conclusions regarding unbiasedness can legitimately be
drawn. Yet, at the same time, the presence of serial
correlation violates a necessary condition for rationality.
Thus, we can at the very outset reject the notion that Blue
Chip consensus forecasts of these variables conform to the
rational expectations hypothesis. (Further evidence of
autocorrelation is given by the autocorrelation functions
[ACFs], which are presented in Appendix B.)
It is not desirable, however, to simply terminate the
discussion on these variables without further analysis. An
alternative to OLS which may shed more light on the nature
of forecast error is the Theil decomposition of mean squared
error (MSE). This procedure decomposes the MSE into bias,
regression, and disturbance components.
The Mean Squared Error (MSE) is given by (2):
MSE = (EX, - X,) 2 + (aE - r*ax) 2
+ (1 - r2) (UX) 2 (2)
where EX, and XA are the forecast and actual value means,
respectively, ao and ax are the forecast and actual value
standard deviations, respectively, and r is the Pearson
correlation coefficient between EX and X. Dividing (2) by
MSE yields the following:
[E(EXM - X)2 / MSE] = bias % of MSE (3)
[ (an - r*ax)2 / MSE] = regression % of MSE
[ (1 - r2) (a) 2 / MSE] = disturbance % of MSE.

50
The interpretation of the Theil decomposition is similar to
that for the OLS unbiasedness test expressed in equation
(1). That is, the bias proportion of MSE is a measure of
the tendency of forecasters to over- or underestimate actual
values; the interpretation of 0% bias in the Theil procedure
is analogous to a value of zero for the intercept in an OLS
regression of equation (1). The regression proportion of
MSE represents the extent to which forecasters over- or
underestimate changes in actual values. (For instance, with
respect to real GNP growth, we would expect that the one-
quarter ahead regression proportion of MSE should be greater
than the four-quarter ahead regression proportion. As
discussed previously, unexpected quarterly changes tend to
offset each other, over time, with real GNP. As a result,
one-quarter ahead forecast errors are often greater than
four-quarter ahead errors.) This is analogous to the
interpretation of the value of the slope coefficient ( ) in
equation (1). A large regression proportion of MSE is
similar to a value of 8 significantly different from one.
Finally, the disturbance proportion of MSE indicates the
degree to which forecast error is traceable to random
influences.
Table 3 presents the results of the Theil decomposition
of MSE (as well as another accuracy measure, the "Theil U"
statistic). We would expect that forecasts which are
consistent with the rational expectations hypothesis will

51
TABLE 3
THEIL U STATISTIC AND DECOMPOSITION OF MEAN SQUARED ERROR
1 Q AHEAD 2 0 AHEAD 3 0 AHEAD 4 0 AHEAD
FED FUNDS RATE
0.147
0.81%25.08%74. 11%
Ml GROWTH
0.526
5.68%5.16%
89.17%
RATE OF CHANGE IN CPI
0.462
16.96%5.93%
77.12%
0.550
30.53%0.98%
68. 49%
0.619
38. 02%2.12%
59. 86%
REAL GNP GROWTH
0.559
1.68%60.38%37.94%
0.511
1.89%48.41%49.71%
0.435
6.88%14.62%78.50%
NOTE: Forecasts on the Fed Funds rate are for 1983:2 to1988:3. Forecasts on CPI and real GNP are for 1984:3to 1988:3. Percentages may not sum to unity due torounding.
Theil U={MSE/ [ (1/n) ZX2] }4
Theil U
Bias %,Reg. %,Dis. %,
MSEMSEMSE
0.076
0.98%14.20%84.83%
0.194
6.44%30.90%62.65%
Theil U
0.229
14.81%33.17%52.03%
BiasReg.Dis.
%,
%,
MSEMSEMSE
0.422
6.91%10. 47%82.62%
0.565
5.80%25. 58%68.23%
0.569
8.17%33.11%58.72%
Theil U
Bias %,Reg. %,Dis. %,
MSEMSEMSE
0.285
40.90%8.74%
50.36%
Theil U
Bias %,Reg. %,Dis. %,
MSEMSEMSE
0.414
15.15%0.75%
84.10%

52
exhibit a large disturbance percentage (Dis. %, MSE), while
the bias percentage (Bias %, MSE) and regression percentage
(Reg. %, MSE) should be small.
Results of the Theil decomposition suggests a greater
justification for acceptance of rationality for Fed Funds
and M1 than do the OLS results. The one-quarter ahead Fed
Funds forecast displays a large disturbance percentage and
virtually no bias, and reinforces the OLS results in which
unbiasedness is not rejected. As time horizons increase,
the bias and regression proportions rise. Yet even the
four-quarter ahead forecast is composed largely of random
error. The results for M1 are similar; disturbance
proportions are high, though they decrease as time horizons
increase.
The CPI results show the highest degree of bias, and
the bias proportions vary directly with forecast horizons.
This is roughly consistent with the OLS results, in which
unbiasedness is rejected for the three- and four-quarter
ahead forecasts, and is not rejected for the one- and two-
quarter ahead forecasts.
The real GNP Theil results are consistent with initial
expectations. The one-quarter ahead regression percentage
is very high, indicating that forecasters experience some
difficulty in anticipating changes in real GNP; forecasters
clearly over- or underpredicted the variance of the actual
data in some systematic fashion. Yet the phenomenon of

53
offsetting errors enabled forecasters to more accurately
predict real GNP as forecast horizons increased, as is
demonstrated by the substantial reduction in the regression
proportions and increase in the disturbance proportions of
MSE as horizons lengthen. Since the OLS test statistics are
invalid in the presence of serial correlation, the data set
was re-tested using Generalized Least Squares (GLS), in the
manner of McNees [5]. An estimate of the first order
autocorrelation coefficient (p) was obtained through the
Cochrane-Orcutt procedure. The data set was then
transformed by p to, in essence, "filter out" the first
order serial correlation. This process reduced, but did not
eliminate, the autocorrelation problem, as is seen in Table
4. The Durbin-Watson statistic improved in each case, but
not enough to reject the hypothesis of autocorrelation at
the 5 percent level. Failure of GLS to substantially
eliminate the serial correlation in the residuals is a
likely indication of higher order serial correlation, or is
perhaps simply a statistical problem attributable to the
relatively small number of observations.
Nevertheless, using the GLS procedure as a first
approximation for correction of autocorrelation, Table 4
indicates a greater likelihood of acceptance of the
unbiasedness criterion for Ml, no significant change in
results for Fed Funds and real GNP, and a greater likelihood
of rejection for the CPI forecasts. However, undue emphasis

54
TABLE 4
GLS UNBIASEDNESS TEST RESULTS
ForecastHorizon a P Fk,n.k DW R2
FED
1.315 0.843(1.911) (9.947)
4.113 0.487(2.951) (2.884)
5.888 0.256(3.511) (1.293)
6.042 0.227(3.286) (1.074)
M
-3.774 1.649(-0.808) (0.603)
13.675 -0.730(1.661) (-0.651)
20.306 -1.709(2.073) (-1.246)
24.478 -2.286(2.219) (-1.460)
FUNDS RATE
1.834 1.814
4.637* 1.054*
7.279* 0.824*
7.412* 0.788*
1 GROWTH
1.129 1.441
1.514 1.181*
2.301 1.249+
2.861 1.286+
0.994
0.971
0.955
0.947
0.766
0.601
0.641
0.693
0.068
0.402
0.521
0.518
0.266
0.396
0.331
0.321
NOTES: Forecasts on Fed Funds rate and M1 are for 1983:2 to1988:3.T-statistics are in parentheses.DW is the Durbin-Watson statistic; p is the estimateof first order autocorrelation.R2 is the adjusted R-square.The F-statistic is for the joint hypothesis(a=0,P=1) with k, n-k (k=2, n=19,...,22) degreesof freedom for forecast horizons 4, 3, 2, 1,respectively.
* Significant at the 5 percent level.+ Inconclusive at the 5 percent level.
1
2
3
4
1
2
3
4
Q
Q
Q
Q
Q
Q
Q
Q
ahead
ahead
ahead
ahead
ahead
ahead
ahead
ahead
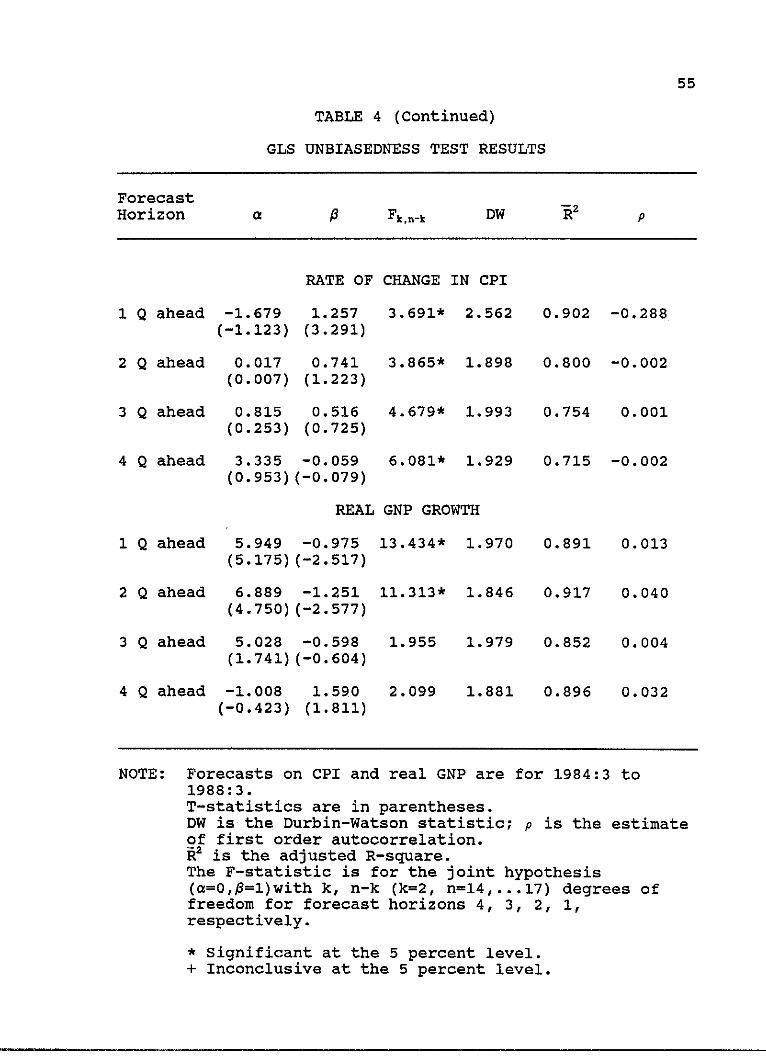
55
TABLE 4 (Continued)
GLS UNBIASEDNESS TEST RESULTS
ForecastHorizon a # Fk,..k DW R2
RATE OF CHANGE IN CPI
1 Q ahead
2 Q ahead
3 Q ahead
4 Q ahead
-1.679(-1.123)
1.257(3.291)
0.017 0.741(0.007) (1.223)
0.815(0.253)
0.516(0.725)
3.691* 2.562 0.902 -0.288
3.865* 1.898
4.679* 1.993
3.335 -0.059 6.081* 1.929(0.953)(-0.079)
0.800 -0.002
0.754 0.001
0.715 -0.002
REAL GNP GROWTH
1 Q ahead
2 Q ahead
3 Q ahead
4 Q ahead
5.949 -0.975 13.434* 1.970(5.175) (-2.517)
6.889 -1.251 11.313* 1.846(4.750)(-2.577)
5.028 -0.598(1.741)(-0.604)
-1.008 1.590(-0.423) (1.811)
0.891 0.013
0.917 0.040
1.955 1.979 0.852 0.004
2.099 1.881 0.896 0.032
NOTE: Forecasts on CPI and real GNP are for 1984:31988:3.
to
T-statistics are in parentheses.DW is the Durbin-Watson statistic; p is the estimateof first order autocorrelation.R2 is the adjusted R-square.The F-statistic is for the joint hypothesis(a=0,P=1)with k, n-k (k=2, n=14,...17) degrees offreedom for forecast horizons 4, 3, 2, 1,respectively.
* Significant at the 5 percent level.+ Inconclusive at the 5 percent level.

56
should not be placed on these results, since the presence of
autocorrelation is, again, sufficient evidence for rejection
of rationality. The GLS results may perhaps be interpreted
as an indication that the problem is not limited to first
order serial correlation. Forecasters are not only failing
to incorporate their most recent errors into their
information sets, but have difficulty identifying and
incorporating errors from preceding periods. Systematic
error is prevalent, then, for the 2-4 quarter ahead Fed
Funds forecasts, and for the 1-4 quarter ahead forecasts of
M1 growth.
In summary, the OLS unbiasedness tests are satisfactory
and highly illuminating for CPI and real GNP. Findings
suggest that unbiasedness is rejected (not rejected) for the
three- and four-quarter ahead (one- and two-quarter ahead)
CPI and the one- and two-quarter ahead (three- and four-
quarter ahead) real GNP. There is no evidence of
significant serial correlation, indicating that, for these
two variables, the criterion of orthogonality amongst the
error terms is met. Theil decomposition of MSE is
essentially consistent with OLS results.
Results for Fed Funds rate and M1 forecasts are less
clear. OLS estimates indicate substantial serial
correlation for all M1 forecasts, as well as the 2-4 quarter
ahead Fed Funds forecasts. Consequently, the error
orthogonality property is violated, and these forecasts are

57
not rational. Theil decomposition of MSE, on the other
hand, indicates that most of the forecast error is traceable
to random disturbances. Nevertheless, the real value of the
Theil decomposition lies primarily in its graphic depiction
of how the disturbance proportion falls as forecast horizons
lengthen.
Efficiency
A "semi-strong" form efficiency test is utilized in
this study to ascertain whether or not the Blue Chip
consensus forecasters efficiently incorporated readily
available, relevant information into their information sets
prior to generating their predictions.- On the basis of
reasoning outlined in Chapter 3, the form of the efficiency
test is as follows:
(X - EXt) = 60 + 61 (FFRt- 2 ) + 6 2(Mlt-2)
+ 6 3 (CPIt-2 ) + 6 4 (GNPt- 2) (4)
where (Xt - EXt) is the forecast error of each respective
variable, regressed upon lagged actual values of each
selected variable. As is discussed in Chapter 3, actual
values are lagged two periods back to ensure that such
information was indeed "readily available" (forecasters
would not have final actual quarterly values for period t-1
available at the time they form their forecasts).
OLS results for this test are contained in Table 5.
The efficiency hypothesis (HO: 61 = 62 = 63 = 64 = 0) is
rejected upon the basis of significant F-values at the

58
chosen 5 percent level. At first glance, the results of the
test appears to overwhelmingly support the efficiency
hypothesis. There are no significant F-values, regardless
of variable and forecast horizon. These results, however,
are very suspicious, particularly in the face of the
unbiasedness tests, in which rationality was rejected in
several instances on the basis of biasedness,
autocorrelation, or both. It would seem reasonable that
such variables should also exhibit some inefficient
processing of available information. (Nevertheless,
although this may be a curious result, evidence of
inefficiency is not a necessary consequence of biasedness,
or even of irrationality. Urich and Wachtel [8], for
instance, found evidence of individual forecasts which were
biased yet efficient.)
The Durbin-Watson statistics indicate little problem
with the OLS results for CPI and real GNP. The one-quarter
ahead results for both variables and the four-quarter ahead
result for CPI suggest the presence of some level of
negative autocorrelation. (However, the Durbin-Watson
estimates in these instances all fall into the
"inconclusive" range.)
The Durbin-Watson statistics for Fed Funds and Ml
growth are all (with the exception of the one-quarter ahead
Fed Funds) substantially lower than two. The 2-4 quarter
ahead M1 and the three-quarter ahead Fed Funds efficiency

59
TABLE 5
OLS EFFICIENCY TEST RESULTS1
FORECAST ERROR, FED FUNDS RATE
1 n AHEAD I n AETAD I3 AHErAD A f% 2~trr,~r~L.v lLnzw(S J 4* ' AHEAD
Intercept 0.051(0.553)
-0.118(-1.213)
0.041(1.391)
Ml
CPI 0.065(0.799)
GNP
F
DW
-0.019(-0.322)
1.355
2.034
0.063
1.938(0.997)
-0.267(-1.334)
0.037(0.603)
-0.006(-0.034)
-0.046(-0.405)
1.122
1.058+
0.024
1.942(0.722)
-0.328(-1.222)
0.061(0.734)
0.011(0.053)
-0.063(-0.444)
1.246
0. 806*
0.049
0.146(0.042)
-0.220(-0.684)
0.151(1.407)
-0.129(-0.628)
-0.047(-0.331)
2.417
0.892+
0.240
NOTES: 1(X,-EX,) = 60 + 61 (FFRt-2 ) + 62 (M1t- 2) + 63 (CPIt-2 )+ 6 4 (GNPt- 2) + Ct
FFR = Fed Funds rate; M1 = M1 growth rate;CPI = rate of change in CPI; GNP = real GNP growthrate. Sample period for FFR and Ml: 1983:2 to1988:3.
T-statistics are in parentheses.DW is the Durbin-Watson statistic.R2 is the adjusted R-square.The F-statistic is for HO: 61 = 62 = 63 = 64 = 0, withk, n-k-1 (k=4, n=19,...,22) degrees of freedom forforecast horizons 4, 3, 2, 1, respectively.
* Significant at the 5 percent level.+ Inconclusive at the 5 percent level.
I
FFR

60
TABLE 5 (Continued)
OLS EFFICIENCY TEST RESULTS1
FORECAST ERROR,l Ml GROWTH
1 ) AHEAD 2 ) AHEAD
Intercept -2.102(-0.376)
FFR 0.976(1.655)
Ml -0.022(-0.125)
CPI
GNP
-0.564(-1.116)
-0.697(-1.996)
2.113
1.194+
0.175
-3.329(-0.416)
1.260(1.526)
-0.207(-0.818)
-0.704(-1.041)
-0.416(-0.894)
1.245
0. 916*
0.047
-6.937(-0.716)
1.400(1.443)
-0.214(-0.716)
-0.024(-0.033)
-0.281(-0.548)
1.043
0. 602*
0.009
-5.920(-0.465)
1.081(0.922)
-0.226(-0.576)
0.533(0.712)
-0.195(-0.376)
1.082
0. 835*
0.018
NOTES: 1 (Xt-EXt) = 6( + 6 1 (FFRt- 2) + 62 (M1t- 2 ) + 63 (CPIt-2 )+ 6 4 (GNPt- 2 ) + Ct
FFR = Fed Funds rate; M1 = M1 growth rate;CPI = rate of change in CPI; GNP = real GNP growthrate. Sample period for FFR and M1: 1983:2 to1988:3.
T-statistics are in parentheses.DW is the Durbin-Watson statistic.A2 is the adjusted R-square.The F-statistic is for HO: 1 = 62 = 63 = 64 = 0, withk, n-k-1 (k=4, n=19,...,22) degrees of freedom forforecast horizons 4, 3, 2, 1, respectively.
* Significant at the 5 percent level.+ Inconclusive at the 5 percent level.
3 0 AH-EAD 4 0 AHEAD
F
DW
.40 Net 4dw"j6A-lA6jbA"f 46A %e %0 NAe X-A-L a 401 Z-1 I.Of "T, V Z'11.LJ.;IA-IJJ F

61
TABLE 5 (Continued)
OLS EFFICIENCY TEST RESULTS'
FORECAST ERROR, RATE OF CHANGE IN CPI
1 0 AHEAD 2 0 AHEAD 3 0 AHEAD
Intercept 2.084(0.827)
FFR -0.183(-0.671)
-0.119(-1.437)
0.124(0.512)
-0.175(-0.989)
0.796
2.763+
-0.054
2.385(0.728)
-0.331(-0.951)
-0.070(-0.657)
-0.010(-0.033)
-0.039(-0.184)
0.291
2.505+
-0.233
5.475(1.609)
-0.526(-1.488)
-0.156(-1.453)
-0.240(-0.866)
-0.102(-0.102)
1.175
2.014
0.048
-1.406(-0.245)
-0.186(-0.336)
0.138(0.756)
0.008(0.022)
-0.036(-0.147)
0.698
2.272+
-0.102
NOTES: (Xt-EXt) - 60 + 61(FFRt-2 ) + 62( M lt-2) + 63 (CPIt-2 )+ 6B4 (GNPt- 2 ) + Ct
FFR = Fed Funds rate; M11 = M41 growth rate;CPI = rate of change in CPI; GNP = real GNP growthrate. Sample period for CPI and GNP: 1984:3 to1988:3.
T-statistics are in parentheses.DW is the Durbin-Watson statistic.R2 is the adjusted R-square.The F-statistic is for HO: 61 = 62 = 63 = 64 = 0, withk, n-k-1 (k=4, n=14,...,17) degrees of freedom forforecast horizons 4, 3, 2, 1, respectively.
* Significant at the 5 percent level.+ Inconclusive at the 5 percent level.
4 o AHEAD
CPI
GNP
F
DW
J6 %e A-46A 46 4.J &--a Awf 494 jj Av" A Aj &-A Af %0 %A 4r-"Llj6jZ-&&w v w A-Ilx4;JA-I"
m1

62
TABLE 5 (Continued)
OLS EFFICIENCY TEST RESULTS1
FORECAST ERROR, REAL GNP GROWTH
1 0 AREAD 2 0 AHEAD 3 n AHEAD4 (4 71j ZAw n
Intercept 5.775(1.914)
-0.715(-2.188)
-0.053(-0.535)
0.256(0.887)
-0.063(-0.296)
1.464
2.745+
0.104
6.428(2.122)
-0.625(-1.938)
-0.117(-1.196)
0.187(0.688)
-0.191(-0.971)
1.471
2.013
0.117
4.008(1.192)
-0.345(-0.987)
-0.086(-0.810)
-0.058(-0.212)
0.048(0.238)
0.319
2.007
-0.241
3.814(0.912)
-0.206(-0.512)
-0.118(-0.890)
0.108(0.439)
-0.193(-1.100)
0.497
2.120+
-0.183
NOTES: (Xt-EXt) = 60 + 6I(FFRt-2 ) + 62 (M1t- 2 ) + 6 3 (CPIt-2 )+ 64 (GNPt- 2) + et
FFR = Fed Funds rate; M1 = M1 growth rate;CPI = rate of change in CPI; GNP = real GNP growthrate. Sample period for CPI and GNP: 1984:3 to1988:3.
T-statistics are in parentheses.DW is the Durbin-Watson statistic.R2 is the adjusted R-square.The F-statistic is for HO: 61 = 62 = 63 = 64 = 0, withk, n-k-1 (k=4, n=14,...,17) degrees of freedom forforecast horizons 4, 3, 2, 1, respectively.
* Significant at the 5 percent level.+ Inconclusive at the 5 percent level.
Ml
CPI
GNP
F
DW
4 AHEAD I
FFR

63
results all indicate a significant level of positive
autocorrelation. The two- and four-quarter ahead Fed Funds
and one-quarter ahead M1 Durbin-Watson statistics all fall
within the inconclusive range. (The inconclusive range is
very wide with respect to this particular test. This is due
to the relatively small number of observations used, and
because the form of the efficiency test that has been
constructed uses four independent variables. The
inconclusive range widens as observations decrease and
independent variables increase.)
Since the presence of autocorrelation invalidates the
OLS test statistics, the data is reestimated using
Generalized Least Squares. However, the expectation is that
conclusions drawn regarding efficiency for Fed Funds and Ml
will not change; GLS should only reinforce the OLS results.
The reasoning behind this assertion is as follows. The very
nature of the problem of positive serial correlation with
respect to OLS test statistics is that is that it tends to
underestimate the standard errors of OLS coefficients and
residuals. (Overestimation of standard errors is associated
with the less likely event that there exists negative
autocorrelation amongst the error terms in conjunction with
positive correlation amongst the independent variables, or
vice versa [2, p.313].) As a result, t-values and F-values
tend to be overestimated. This implies a greater likelihood
of rejecting a null hypothesis of no association (in this

64
instance HO: 61 = 0, for i = 1,...,4) when it is in fact
true. Thus, if GLS succeeds in "filtering out" some of the
serial correlation from the data, the expectation is that F-
values will fall. Since none of the OLS estimates show
significant F-statistics, it is most likely that
reestimation through GLS will not result in rejection of the
efficiency hypothesis for Fed Funds and M1 growth, which for
the most part exhibit positive autocorrelation. On the
other hand, F-values for CPI and real GNP may rise, since
Durbin-Watson estimates tend toward indication of negative
autocorrelation (in most cases) while the actual values of
the explanatory variables are most likely positively
autocorrelated for these variables.
Examination of Table 6 tends to validate these initial
expectations. F-values for Fed Funds and M1 all fall (with
the exception of the one-quarter ahead Fed Funds rate).
Conclusions for efficiency do not change as a result of
applying GLS; the null hypothesis of efficient processing of
readily available information is not rejected. As with the
unbiasedness tests discussed in the previous section of this
chapter, serial correlation does not appear to be eliminated
through GLS, only alleviated. Durbin-Watson values rise
enough, however, such that all cases for M1 and Fed Funds
are now in the inconclusive range (except the one-quarter
ahead Fed Funds rate, which displays no evidence of serial
correlation according to OLS). It is likely that further

65
data transformation to rid these of any higher order
autocorrelation which may exist will not alter the
efficiency results.
Any tendency toward serial correlation with respect to
CPI and real GNP, as estimated by the Durbin-Watson
statistic, appears to be negative serial correlation. Table
6 clearly depicts how reestimating the efficiency equation
in (4) with GLS raises the F-values in all cases for these
two variables. In one instance (one quarter ahead real GNP)
the efficiency hypothesis is rejected. Since GLS eliminates
most of the problem of autocorrelation for these variables,
it is likely that these results are adequate; further data
transformation would probably not cause any significant
change in the results of the efficiency test.
The efficiency test results tend to indicate that
forecasters efficiently process readily available
information concerning past levels of the Fed Funds rate, Ml
growth, CPI rate of change, and real GNP growth. As
"sophisticated observers" of market conditions, it is quite
likely that the professional business forecasters which
constitute the Blue Chip consensus do indeed adequately
incorporate this information into their information sets
prior to forming future predictions. This information is,
however, only a subset of all readily available, relevant
information, and only a very small subset of all relevant
information, including that which is not "readily

66
TABLE 6
GLS EFFICIENCY TEST RESULTS1
FORECAST ERROR, FED FUNDS RATE
1 0 AHEAD 2 o AHEAD 3 n AHEAD 4 AHEA4 W A-4a ;A1w
2.148(0.996)
-0.250(-1.109)
0.023(0.362)
0.004(0.028)
-0.096(-0.920)
0.894
1.342+
0.071
-0.264
2.261(0.800)
-0.307(-1.043)
0.029(0.369)
0.058(0.377)
-0.123(-0.035)
0.836
1.098+
-0.060
0.375
1.444(0.433)
-0.297(-0.907)
0.087(0.921)
-0.055(-0.353)
-0.083(-0.688)
1.260
1.154+
0.096
0.364
NOTES: (Xt-EXt) - 60 + 6 1(FFRt- 2) + 62 (Mlt- 2 ) + 63 (CPIt-2 )+ 6 4 (GNPt- 2 ) + Ct
FFR = Fed Funds rate; M1 = M1 growth rate;CPI = rate of change in CPI; GNP = real GNP growthrate. Sample period for FFR and Ml: 1983:2 to1988:3.
T-statistics are in parentheses.DW is the Durbin-Watson statistic.R2 is the adjusted R-square.The F-statistic is for HO: 61 = 62 = 63 = 64 = 0, withk, n-k-1 (k=4, n=19,...,22) degrees of freedom forforecast horizons 4, 3, 2, 1, respectively.
p is the estimate of first order autocorrelation.
* Significant at the 5 percent level.+ Inconclusive at the 5 percent level.
Inter-cept
FFR
Ml
CPI
GNP
F
DW
p
0.528(0.592)
-0.121(-1.287)
0.041(1.416)
0.062(0.745)
-0.015(-0.264)
1.428
1.949
0.041
-0.012
I

67
TABLE 6 (Continued)
GLS EFFICIENCY TEST RESULTS'
FORECAST ERROR, Ml GROWTH
1 0 AHEAD 2 0 AHEAD 3 0 AHEAD
-2.935(-0.469)
0.931(1.390)
-0.021(-0.110)
-0.267(-0.633)
-0.639(-2.003)
1.563
1..432+
0.105
0.280
-4.261(-0.483)
1.126(1.214)
-0.183(-0.733)
-0.493(-1.961)
-0.148(-0.378)
0.879
1.324+
0.035
0.333
-9.534(-0.994)
1.473(1.468)
-0.166(-0.647)
-0.027(-0.054)
-0.003(-0.007)
0.930
1.009+
0.038
0.465
-8.249(-0.705)
1.078(0. 928")
-0.051(-0. 158)
0.188(0.358:)
0.174(0.429')
0.510
1.127+
0.018
0.430
NOTES: 1(Xt-EXt) = 6s + 61(FFRt-2 ) + 62 (Mlt- 2) + 63 (CPIt-2 )+ 64 (GNPt- 2) + ct
FFR = Fed Funds rate; M1 = M1 growth rate;CPI = rate of change in CPI; GNP = real GNP growthrate. Sample period for FFR and Ml: 1983:2 to1988:3.
T-statistics are in parentheses.DW is the Durbin-Watson statistic.R2 is the adjusted R-square.The F-statistic is for HO: 61 = 62 = 63 = 64 = 0, withk, n-k-1 (k=4, n=19,...,22) degrees of freedom forforecast horizons 4, 3, 2, 1, respectively.p is the estimate of first order autocorrelation.
* Significant at the 5 percent level.+ Inconclusive at the 5 percent level.
4 AHEAD
Inter-cept
FFR
CPI
GNP
F
DW
p
-J6 Nor- ow Ne Ne F

68
TABLE 6 (Continued)
GLS EFFICIENCY TEST RESULTS
FORECAST ERROR, RATE OF CHANGE IN CPI
1 0 AHEAD 2 0 AHEAD 3 0 AHEAD 4 OAWAD
2.026(1.032)
-0.172(-0.837)
-0.105(-1.585)
0.028(0.121)
-0.136(-0.881)
0.819
2.511+
-0.229
-0.270
3.053(1.079)
-0.353(-1.194)
-0.096(-1.024)
-0.068(-0.234)
-0.059(-0.296)
0.544
2.315+
-0.257
-0.175
NOTES: (Xt-EXt) = 6S + 61 (FFR--2 ) + 62 (M1t- 2 ) ++ 64 (GNPt- 2) + Ct
63(CPIt-2)
FFR = Fed Funds rate; M1 = M1 growth rate;CPI = rate of change in CPI; GNP = real GNP growthrate. Sample period for CPI and GNP: 1984:3 to1988:3.
T-statistics are in parentheses.DW is the Durbin-Watson statistic.R2 is the adjusted R-square.The F-statistic is for HO: 61 = 62 = 3 = 64 = 0, withk, n-k-1 (k=4, n=14,...,17) degrees of freedom forforecast horizons 4, 3, 2, 1, respectively.p is the estimate of first order autocorrelation.
* Significant at the 5 percent level.+ Inconclusive at the 5 percent level.
Inter-cept
FFR
M1
GNP
F
DW
p
5.449(1.610)
-0.525(-1.495)
-0.155(-1.446)
-0.242(-0.871)
-0.099(-0.491)
1.178
2.002
0.390
-0.013
-0.519(-0.094)
-0.272(-0.526)
0.122(0.692)
-0.049(-0.144)
0.003(0.014)
0.979
2.191+
-0.431
-0.137
46 %,!t 40 %e- Ar-AAAj6j4Ll6j-f %0 Ne &-".L AJ 4C-A Aaf -9 %Z A-%44A;JA-IAJ

69
TABLE 6 (Continued)
GLS EFFICIENCY TEST RESULTS1
FORECAST ERROR, REAL GNP GROWTH
1 0 AHEAD 2 0 AHEAD
6.126(2.954)
-0.792(-3.687)
-0.076(-1.081)
0.553(2.182)
-0.184(-1.092)
4.965*
2..713+
0.481
-0.370
6.420(2.129)
-0.625(-1.949)
-0.117(-1.200)
0.189(0.695)
-0.190(-0.969)
1.481
2.003
0.074
-0.005
4.033(1.204)
-0.347(-0.997)
-0.087(-0.821)
-0.056(-0.203)
0.045(0.227)
0.323
1.993
-0.230
-0.001
3.595(0.872)
-0.186(-0.473)
-0.111(-0.848)
0.097(0.389)
-0.187(-1.074)
0.456
1.967
-0.055
-0.009
NOTES: (Xt-EXt) - So + 61 (FFRt-2) + 62(M1t-2 ) + 63 (CPIt- 2 )+ 6 4 (GNPt-2) + Ct
FFR = Fed Funds rate; M1 = M1 growth rate;CPI = rate of change in CPI; GNP = real GNP growthrate. Sample period for CPI and GNP: 1984:3 to1988:3.
T-statistics are in parentheses.DW is the Durbin-Watson statistic.R2 is the adjusted R-square.The F-statistic is for HO: 61 = 62 = 63 = 64 = 0, withk, n-k-1 (k=4, n=14,...17) degrees of freedom forforecast horizons 4, 3, 2, 1, respectively.p is the estimate of first order autocorrelation.
* Significant at the 5 percent level.+ Inconclusive at the 5 percent level.
3 0 AHEAD
Inter-cept
FFR
Ml
CPI
GNP
F
DW
p
.J6 Ne- d"A 46 J-JG-46 A.0f 4 0 AHERAD

70
available." Conclusions drawn on the question "Are
forecasts efficient?" would seem to be sensitive to the form
of the efficiency test chosen. A different specification of
the efficiency test form that of equation (4) may well
generate very different results.
Adaptive Expectations
Table 7 presents the results for a test of the
hypothesis that the Blue Chip consensus forecasts are
revised adaptively. For reasons discussed in Chapter 3, the
Fed Funds rate and M1 growth rate forecasts are analyzed
according to the following adaptive framework:
(EXt+s - EXtl) = A0 + Al(Xt-, - EXt. 1) , (5)
where s = 0,...,3 forforecast horizons 1-4,respectively.
That is, forecasts of these variables are revised according
to last period's forecast errors, with the implicit
assumption that the last period's errors are known at the
time forecasts are generated. This assumption is not made
for CPI and real GNP; as a result, (5) is modified such that
the right hand side includes forecast errors from two
periods back, i.e., (Xt- 2 - EXt.2) -
Results for the Fed Funds rate and Ml growth lend a
measure of credence to the adaptive hypothesis as expressed
by equation (5). The one-quarter ahead Fed Funds rate best
conforms to adaptive expectations. The value of the
coefficient on the forecast error is 1.273, which is very

71
TABLE 7
ADAPTIVE FORECAST REVISION: FFR AND M11
FED FUNDS RATE
ForecastHorizon A0 S 1 R2 F DW
1 Q AHEAD
2 Q AHEAD
3 Q AHEAD
4 Q AHEAD
-0.091(-1.311)
-0.021(-0.132)
1.273(11.269)
0.450(3.396)
0.014 0.299(0.076) (2.564)
0.086 0.242(0.368) (2.060)
0.863 126.980*
0.369
0.258
0.246
11.536*
6. 573*
4.240
Ml GROWTH
ForecastHorizon
1 Q AHEAD
2 Q AHEAD
3 Q AHEAD
4 Q AHEAD
A0
-0.319(-1.696)
-0.186(-1.375)
-0.220(-2.095)
-0.182(-1.522)
A,
0.182(4.022)
0.100(3.702)
0.080(4.359)
0.067(3.338)
R2
0.431
0.414
0.529
0.420
F
16.177*
13.702*
18.999*
11.142*
DW
1.373+
2.248
2.303
2.454
NOTES: (EX,,S - EXt..) = A0 + X,(Xt., - EXt. 1 )Sample period for Fed Funds and Ml: 1983:2 to1988:3.T-statistics are in parentheses.DW is the Durbin-Watson statistic.R2 is the adjusted R-square.The F-statistic tests HO: A, = 0, with k, n-k-1(k=l, n=15,17,19,21) degrees of freedom for forecasthorizons 4, 3, 2, 1, respectively.
* Significant at the 5 percent level.+ Inconclusive at the 5 percent level.
1.290+
2.878*
2.052
1.724

72
TABLE 7 (continued)
ADAPTIVE FORECAST REVISION: CPI AND REAL GNP2
RATE OF CHANGE IN CPI
ForecastHorizon A0 A1 F DW
1 Q AHEAD
2 Q AHEAD
3 Q AHEAD
4 Q AHEAD
-0.169(-0.935)
-0.184(-1.160)
-0.079(-0.666)
-0.255(-2.348)
-0.130(-1.660)
-0.052(-1.089)
0.046 0.005(0.357) (0.128)
REAL GNP GROWTH
ForecastHorizon
1 Q AHEAD
2 Q AHEAD
3 Q AHEAD
4 Q AHEAD
-0.082(-0.487)
-0.078(-0.435)
-0.062(-0.484)
0.040(0.438)
-0.002(-0.018)
-0.056(-0.660)
0.083 0.027(0.855) (0.415)
21NOTES: 2(EXt+s - EXt-) = A0 + Al(Xt 2 - EXt- 2 )
Sample period for CPI and real GNP: 1984:3 to1988:3.T-statistics are in parentheses.DW is the Durbin-Watson statistic.R2 is the adjusted R-square.The F-statistic tests HO: A = 0, with k, n-k-i(k=1, n=9,11,13,15) degrees of freedom for forecasthorizons 4, 3, 2, 1, respectively.
* Significant at the 5 percent level.+ Inconclusive at the 5 percent level.
0.244
0.128
0.018
-0.140
5. 515*
2.757
1.185
0.016
1.544
1.639
1.175+
1.198+
A0 A, R F DW
-0.061
-0.091
-0.598
-0.115
0.192
0.000
0.436
0.172
2.688+
2.484
1.412
1.541

73
high; subsequent forecasts are very sensitive to preceding
forecast errors. The adjusted R-square is also very high
(0.863); this indicates that over four-fifths of the
variation in forecast revision is "explained" by preceding
forecast errors. The F-statistic rejects the notion that
there is no statistical relationship between forecast errors
and forecast revision. However, there is evidence of first
order autocorrelation. Consequently, the one-quarter ahead
Fed Funds is reestimated using Generalized Least Squares.
The results of this procedure are shown in Table 8. There
is no significant change in the findings after running GLS.
The results for the two- and three-quarter ahead Fed
Funds rate are not quite so distinctly favorable to the
adaptive hypothesis, and the four-quarter ahead forecast
rejects it. Notice how the forecast error coefficients (or
the "learning coefficient," or "coefficient of adaptation")
falls as time horizons lengthen. This indicates that
immediately previous errors may be important for prediction
adjustment for short time-span, one-quarter ahead forecasts,
but are of diminishing importance for longer time-span
forecasts.
The results for M1 are somewhat more puzzling. The
adjusted R-squares all fall within the 0.40-0.50 range, and
the F-statistics all handily reject the hypothesis of no
statistical relationship between forecast errors and
forecast revision. However, the forecast error coefficients

74
are all fairly small. The four-quarter ahead coefficient,
for instance, is a very small 0.067, yet it nevertheless is
statistically different from zero. Again note how the
forecast error coefficient tends to fall as time horizons
lengthen, indicating that forecast revisions are less
sensitive to previous forecast errors for higher-order
forecast horizons. The one-quarter ahead Durbin-Watson
estimate falls within the inconclusive range. GLS results
are given in Table 8; conclusions are not substantially
affected. (Table 8 contains results of GLS procedure
applied only to those variables in which the Durbin-Watson
statistic in the OLS estimates shown in Table 7 was
significant or inconclusive at the 5 percent level.)
The results displayed in Table 7 for the rate of change
in CPI and for real GNP growth are not favorable to the
modified form of the adaptive forecast revision hypothesis.
Forecast revision for these two variables in general are not
sensitive to forecast errors generated two periods ago
(which are assumed to be the last available forecast errors
observed when subsequent forecasts are made). The only
forecast even remotely consistent with this formulation of
the adaptive model is the one-quarter ahead CPI forecast.
There are several possible explanations for this.
First of all, it is conceivable that the CPI and real GNP
forecasts should have been estimated according to the same
standard as the Fed Funds rate and M1. While this may have

75
TABLE 8
GLS RESULTS: ADAPTIVE FORECAST REVISION
Variable,ForecastHorizon A 0 A1 R F DW
1 Q AHEADFED FUNDS
2 Q AHEADFED FUNDS
1 Q AHEADMl
1 Q AHEADREAL GNP
3 Q AHEADCPI
4 Q AHEADCPI
-0.088(-1.060)
-0.010(-0.093)'
-0.328(-1.496)
-0.087(-0.729)
-0.112(-0.894)
0.012(0.097)
1.296(12.224)
0.498(5.041)
0.190(3.942)
0.086(1.136)
-0.071(-1.723)
-0.008(-0.195)
0.875 149.414*
0.564
0.396
-0.015
0.081
-0.260
25.410*
15.541*
1.291
2.968
0.038
1.552p=0 .2 0 6
2.456p=-0 .2 4 3
1.615p=0 .17 3
2.472p=-0 .2 9 3
1.574p=0 .2 1 2
1.384p=0 .1 5 5
NOTES: Sample period for Fed Funds and M1: 1983:2 to1988:3. Sample period for CPI and real GNP: 1984:3to 1988:3.T-statistics are in parentheses.DW is the Durbin-Watson statistic.R2 is the adjusted R-square.The F-statistic tests H0: AM = 0; for degrees offreedom, see Table 7.p is the estimate of first order autocorrelation.
* Significant at the 5 percent level.+ Inconclusive at the 5 percent level.

76
generated more statistically satisfying results, it seems
theoretically unjustifiable. The Fed Funds rate and Ml
forecasts were estimated using an adaptive model which
contained a special assumption, that forecasters revised
subsequent forecasts as if they knew the final, actual
forecast errors generated in the prior contiguous period.
Strictly speaking, this would not be true, since forecasters
generate their predictions before these values are
available. The assumption was made, however, on the basis
of an accompanying assumption that actual data on the Fed
Funds rate is sufficiently available throughout the quarter
and is not significantly different from the final actual
quarterly value when forecasts are made. This rationale,
however, should not be used when constructing adaptive
models for the CPI and real GNP; actual data is not
sufficiently available throughout the quarter. Therefore,
the "as if" assumption should not be applied to these
variables.
A second, more reasonable possibility explaining the
poor performance of the adaptive model for the CPI and real
GNP is that there may be a month' or two lag in the time it
takes to incorporate forecast errors. As a result, forecast
revision may not take place at the beginning of each
quarter, but rather sometime during each quarter. Since
forecasters make their predictions on a monthly basis, it is
likely that mid-quarter monthly forecasts would take into

77
account forecast errors. For instance, a forecast error for
1987:4 may not become apparent to the forecaster until mid-
January, 1988. As a result, the forecaster adjusts his
forecasts with respect to this information beginning with
the February, 1988 forecast. Forecast errors for 1987:4,
then, do not affect the January quarterly forecasts, because
they are not known. On the other hand, neither do they
affect the April, 1988 forecasts, because, by then, those
errors have already been taken into account by the
forecaster.
A third possible explanation is that forecast errors
affect subsequent forecasts only over time; in other words,
forecast errors should be lagged farther back than two
periods. This would suggest that forecasters react to
forecast errors very slowly. This may perhaps be reasonable
with respect to real GNP. Recall that this variable tends
to exhibit the property of error off-set rather than error
accumulation. Consequently, forecast accuracy actually
improved as time horizons lengthened. As McNees has stated,
this suggests the following:
Suppose a forecaster has overestimated lastquarter's real GNP. Does this imply that,other things equal, the next forecast shouldbe reduced? Without further reasons for theerror, the answer is no: last quarter's errorcontains no information useful for revisingthe previous forecast [4, p.23].
It is only after the reasons for the error become more clear
that forecast error may provide justification for revising

78
subsequent forecasts. Yet, by then, it is those reasons
themselves which would provide the impetus for forecast
revision, not simply observed forecast errors. Thus, it
does not seem reasonable that the adaptive model could be
improved by assuming that forecast revision is made on the
basis of forecast error only over greater time spans.
The McNees statement above suggests that perhaps the
implications of the adaptive expectations test as
constructed in this study (that last observed forecast
errors do not substantially influence subsequent forecasts)
is not unreasonable, at least for real GNP. In addition,
the 2-4 quarter ahead CPI forecasts are not sensitive to
prior forecast errors. However, the one-quarter ahead CPI
does display regressive expectations. This implies that
forecasters tended to expect reversals of changes in last
observed actual values. These forecasters did, in fact,
consistently overestimate the rate of change in the CPI over
the sample period (1984:3 to 1988:8) in their one-quarter
ahead forecasts. (CPI was overpredicted 80% of the time
over the sample period used, contrasted with one quarter
ahead Fed Funds and M1, which were overpredicted only 33%
and 43% of the time, respectively, over their sample
periods.) In the adaptive equation for the one-quarter
ahead CPI forecast
(EXt.. 1 - EXA) = O + A1 (Xt-2 - EXt.2), (6)
the term (Xt-2 - EXt-2 ) on the right hand side is most often

79
negative. Nevertheless, the negative coefficient on this
term indicates that forecasters continue to revise their
forecasts upward, despite their consistent overprediction.
The following conclusions are drawn from the adaptive
forecast revision tests. With respect to the Fed Funds rate
and M1 growth, there appears to be varying degrees of
adaptive expectations. The one-quarter ahead Fed Funds rate
is most sensitive to prior forecast error; this sensitivity
diminishes as forecast horizons lengthen. With respect to
Ml, forecast revision is influenced by prior forecast error,
but the degree of sensitivity is relatively small.
Test results indicate that the rate of change in CPI
and real GNP, for the most part, do not appear subject to
adaptive influences. This is not true of the one-quarter
ahead CPI, which exhibits regressive tendencies. Each of
the other instances with respect to CPI and real GNP
probably suggest either that there is, indeed, little
sensitivity to prior forecast error, or that forecasts are
revised according to forecast error at mid-quarter, rather
than in the first month of each quarter.
Summary
Test results point to the one-quarter ahead Fed Funds
rate as the variable which is most consistent with rational
expectations properties. It is also the variable which
exhibits the greatest sensitivity to adaptive influences.
Forecast accuracy (and conformity with rational

80
expectations properties) tends to deteriorate as forecast
horizons lengthen, except for real GNP. The results with
respect to real GNP reinforce previous findings which
suggest that, due to the "off-setting errors" phenomenon, a
four-quarter ahead forecast for this variable is actually
more accurate than a one-quarter ahead forecast.
It is difficult to make a blanket generalization as to
whether test results indicate that forecasters in this
particular data set are "rational," or "irrational."
Conclusions regarding this are highly dependent upon both
the variable and forecast horizon in question, and the data
is an aggregation on many forecasts, such that quite a few
individual forecasters could be "rational," even while the
consensus forecast is not. Nevertheless, on the basis of
the consensus data, M1 forecasts do not appear to conform to
rationality, if simply on the basis of violation of the
error orthogonality criterion. The three- and four-quarter
Fed Funds forecasts also violate this property. Further,
all CPI forecasts violate the unbiasedness criteria, as well
as the one- and two-quarter ahead real GNP forecasts. The
"best" forecasts appear .to be the one-quarter ahead Fed
Funds rate and the three- and four-quarter ahead real GNP
forecasts.

CHAPTER BIBLIOGRAPHY
1. Brocato, Joe, Kumar, Akhil, and Smith, Kenneth L. 1989.Individual versus group spot price forecasting inthe international petroleum market: A case study.Managerial and Decision Economics 9: 13-24.
2. Johnston, J. 1984. Econometric methods. New York:McGraw-Hill, Inc.
3. Maddala, G.S. 1977. Econometrics. NewYork: McGraw-Hill,Inc.
4. McNees, Stephen K. 1988. How accurate are macroeconomicforecasts? New England Economic Review,(July/August): 15-36.
5. McNees, Stephen K. 1978. The rationality of economicforecasts. American Economic Review 68 (May): 301-05.
6. Pindyck, R.S., and Rubenfeld, Daniel L. 1981.Econometric models and economic forecasts. NewYork: McGraw-Hill, Inc.
7. Studenmund, A.H., and Cassidy, H.J. 1987. Usingeconometrics: A practical guide. Boston: Little,Brown and Company.
8. Urich, Thomas, and Wachtel, Paul. 1984. The structure ofexpectations of the weekly money supplyannouncement. Journal of Monetary Economics 13:183-94.
81

CHAPTER 5
SUMMARY AND CONCLUSIONS
This study has analyzed a set of forecast survey data
for conformity to "rational expectations." The data
utilized was the consensus forecasts on four variables (Fed
Funds rate, M1 growth, rate of change in CPI, real GNP
growth) of multiple time horizons generated by a monthly
newsletter entitled Blue Chip Financial Forecasts. Standard
statistical tests for rationality were applied to determine
whether the properties of unbiasedness, efficiency, and
error orthogonality were exhibited. The data was also
tested for adaptive expectations.
Results, while not clear-cut, were generally not
favorable to the rational expectations hypothesis. One
variable, the one-quarter ahead Fed Funds rate performed
very well. Higher-order forecast horizons on this variable
did not perform well. In general, forecast accuracy (and
adherence to rational expectations properties) deteriorated
as time horizons expanded. This was not true of real GNP
which, in line with previous findings, performed better as
forecast horizons increased. The three- and four-quarter
ahead CPI forecasts were not rational, and none of the 1-4
quarter ahead M1 forecasts were rational.
82

83
The primary difficulty associated with this data set is
the relatively small number of observations available. The
Fed Funds rate and M1 forecasts consisted of 22 observations
at most (with respect to the one-quarter ahead forecasts),
down to 19 observations (for the four-quarter ahead
forecasts). The number of observations for CPI and real GNP
ranged from 17 for one-quarter ahead forecasts, to 14 for
the four-quarter ahead forecasts. Clearly, additional
observations would be desirable.
A second problem with this data set is that the
relatively small number of consistently identified
individual forecasts prevents tests of rationality for
individuals which compose the consensus forecast. As a
result, the consensus forecast must be relied upon to
provide evidence as to whether or not individuals form
rational expectations, rather than individuals themselves.
This may introduce aggregation bias into the study
(individual forecasts may be rational, but the consensus may
not be). Further, the small number of consistently
identified individuals prevents meaningful comparison
between the those individuals and the survey consensus.
Nevertheless, this study has analyzed a recent data
set, on several economic variables, and thus provided some
incremental evidence as to the soundness of the rational
expectations theory. This data set, particularly as more
observations become available, is a good source of

84
information regarding how expectations are formed. Future
research may beneficially be undertaken along the lines of
this study. Specifically, analysis of and comparisons
between the various interest rates forecasted by this
newsletter may be the most fruitful avenue of future study.

APPENDIX A
85

86
Definitions and Sources.
of Actual Data
The four selected variables to be tested are the
quarterly average Federal Funds rate (denoted here as FFR),
the quarterly change in M1 (Ml), the quarterly change in the
Consumer Price Index (CPI), and the quarterly change in Real
Gross National Product (GNP). The actual data is arrayed in
Table 9.
The variable FFR is defined as the quarterly average
Federal Funds rate as reported in the Business Conditions
Digest (CD),, Series 119. Forecasts are made of this
quarterly average.
The variable Ml is the seasonally adjusted annual rate
(SAAR) of change of M1, measured 3 months over the prior 3
months. The actual data can be found in the weekly Federal
Reserve Statistical Release, H.6, Table 2; or as reprinted
in the Federal Reserve Bulletin (FRB). Quarterly Ml (SAAR)
here is taken from FRB series 1.10.
The variable CPI is the seasonally adjusted annual rate
of change as reported by the U.S. Bureau of Labor Statistics
in its monthly CPI Detailed Report. The CPI (SAAR) is for
all urban consumers, all items. The specific data for
present purposes is taken from Table 2 of the CPI Detailed
Report for each three months ending in March, June,
September, and December (inclusive), i.e., the quarterly
seasonally adjusted annual rate of change.

87
The variable GNP is the quarterly SAAR of Real GNP,
given in terms of 1982 dollars, taken from BCD Series 50.
TABLE 9
ACTUAL DATA
Fed Funds
8.809.469.43
9.6910.5611.399.26
8.487.927.908.10
7.836.926.216.27
6.226.656.846.92
6.667.167.98
Ml
12.29.54.8
6.26.54.53.4
10.110.514.510.6
7.715.817.317.2
13.16.40.83.9
3.86.25.3
CPI Real GNP
4.53.1
4.13.32.35.3
Quarter
1983:234
1984:1234
1985:1234
1986:1234
1987:1234
1988:123
-1.91.52.22.7
3.63.23.93.2
4.24.54.8
Table 10 on the next two pages contains the Blue Chip
consensus data used in this study.
2.31.5
3.82.14.13.1
5.40.61.41.5
4.42.54.34.8
3.64.23.7

TABLE 10
CONSENSUS DATA
Quarterly Forecast HorizonsForecastsPublished
FED FUNDS RATE
2Q Q2 42 0
8.38.99.2
9.510.111.111.3
8.58.87.67.8
7.77.36.85.8
5.76.06.87.2
6.86.67.5
8.28.99.1
9.510.111.411.7
9.19.17.87.9
7.77.36.85.9
5.76.16.97.3
6.86.8
8.39.09.2
9.510.111.711.9
9.59.38.18.0
7.87.46.96.1
5.96.47.07.3
8.69.19.4
9.710.411.812.1
9.89.48.28.1
7.97.67.06.4
6.26.46.97.3
Ml GROWTH
LQ 2Q 42 0
8.28.16.9
6.57.67.46.2
6.06.87.28.5
4/1/837/1/83
10/1/83
1/1/844/1/847/1/84
10/1/84
1/1/854/1/857/1/85
10/1/85
1/1/864/1/86:7/1/86
10/1/86
1/1/874/1/877/1/87
10/1/87
1/1/884/1/887/1/88
6.9 5.95.76.0
7.27.27.3
6.87.17.06.4
6.56.26.47.2
7.47.57.69.6
9.69.27.66.3
6.36.2
6.67.17.7
7.17.06.86.2
6.15.86.37.0
7.27.17.38.7
8.88.77.56.7
6.5
6.57.47.6
6.87.06.46.4
6.05.76.26.9
7.36.97.18.2
8.28.37.46.9
88
7.67.69.3
11.3
10.79.77.45.7
Source: Blue Chip Financial Forecasts, Robert J. Eggert,editor.

89
TABLE 10 (continued)
CONSENSUS DATA
ForecastPublished Quarterly Forecast Horizons
RATE OF CHANGE IN CPI
5.2 5.8 6.1 6.34.5 5.0 5.5 5.9
4.23.73.93.6
3.61.83.03.4
3.63.84.54.3
4.04.05.0
4.64.04.34.0
3.72.83.63.6
3.84.14.64.6
4.24.4
4.74.54.54.2
3.93.53.93.9
4.14.34.84.7
4.6
REAL GNP GROWTH
2... .... Q 3L.Q 4_.0
3.9 3.3 3.0 2.63.8 3.0 2.8 2.3
5.04.74.64.3
4.23.94.04.1
4.34.34.74.9
3.13.93.43.3
2.93.33,52.8
1.92.52.32.6
1.41.92.6
3.43.63.23.0
2.93.93.62.6
2.52.92.52.7
1.62.4
3.23.02.52.5
2.93.83.33.0
2.93.02.72.5
2.3
2.82.22.02.2
2.93.03.03.1
3.13.02.72.8
7/1/8410/1/84
1/1/854/1/857/1/85
10/1/85
1/1/864/1/867/1/86
10/1/86
1/1/874/1/877/1/87
10/1/87
1/1/884/1/887/1/88
Source: Blue Chip Financial Forecasts, Robert J. Eggert,editor.

APPENDIX B
90

91
Autocorrelation Functions
Table 11 contains autocorrelation functions (ACFs) of
the forecast errors of each of the selected variables. This
serves as supplemental evidence as to the extent of first
order autocorrelation. ACFs characterized by exponential
decay of autocorrelation coefficients as lags increase
indicate that the series follows a first order
autoregressive process.

92
TABLE 11
AUTOCORRELATION FUNCTIONS
FFR ERROR, 1 QUARTER AHEAD FORECASTS
ARIMA PROCEDURE
NAME OF VARIABLE = ECNSMEAN OF WORKING SERIES= 0.0613636STANDARD DEVIATION = 0.604854NUMBER OF OBSERVATIONS= 22
AUTOCORRELATIONS
COVARIANCE0.3658480.03195140.0126996-0.0938932-0.03217450.02018990.02464970.0201434-0.118773-0.0572439-0.02571550.0250582
0.00925002
CORRELATION1.000000.087340.03471-0.25665-0.087940.055190.067380.05506-0.32465-0.15647-0.070290.068490.02528
-1
i** .
1 * -. !
S * **i .!
MARKS TWO STANDARD ERRORS -!
FFR ERROR, 2 QUARTER AHEAD FORECASTS
ARIMA PROCEDURE
NAME OF VARIABLE = ECNSMEAN OF WORKING SERIES= -0.107143STANDARD DEVIATION = 1.15883NUMBER OF OBSERVATIONS= 21
AUTOCORRELATIONS
COVAR ANCE1.342880.66383
-0.019996-0.212564-0.184711-0.06561010.023448
-0.0652599-0.354511-0.376155-0.241047-0.0665750.0283083
CORRELATION1. 000000.49433
-0.01489-0.15829-0.13755-0.048860.01746-0.04860-0.26399-0.28011-0.17950-0.049580.02108
-1
I****AAA**
***I .AAAi . !
*i !
*5 !A* A*I -.
A**IAiA- 5
MARKS TWO STANDARD ERRORS -!
LAG0
*123456789
101112
STD0
0.2132010.2148210.2150760.2285720.2301050.2307060.2315990.2321930.2519830.2563610.2572360.258063
LAG
123456789
101112
STD0
0.2182180.2662550.2662950.2707390.2740460.27446
0.2745130.2749230.286740.2994870.3045670.304951

93
TABLE 11 (continued)
AUTOCORRELATION FUNCTIONS
FFR ERROR, 3 QUARTER AHEAD FORECASTS
ARIMA PROCEDURE
NAME OF VARIABLE =MEAN OF WORKING SERIES=STANDARD DEVIATIONNUMBER OF OBSERVATIONS=
AUTOCORRELATIONS
ECNS-0.39551.47013
20
COVARIANCE2.161271.37999
0.353784-0.326358-0.452872-0.274375-0.157047-0.197741-0.577867-0.689185-0.592085-0.29156
0.00130135
CORRELATION1.000000.638510.16369
-0.15100-0.20954-0.12695-0.07266-0.09149-0.26737-0.31888-0.27395-0.134900.00060
-1 98 7 6 5 4
MARKS TWO
3 2 1 0 1 2 3 4 5 6 7 8 911**********R******ERR
** * * * ** *i
i*** j
STADAR ERROR
FFR ERROR, 4 QUARTER AHEAD FORECASTS
ARIMA PROCEDURE
NAME OF VARIABLE = ECNSMEAN OF WORKING SERIES= -0.702105STANDARD DEVIATION = 1.63911NUMBER OF OBSERVATIONS= 19
AUTOCORRELATIONS
COVARIANCE2.686681.98711
0.941703-0.120907-0.620188-0.604426-0.48865
-0.464971-0.788747-0.94243-0.91068
-0.600805-0.319465
CORRELATION1.000000.739620.35051
-0.04500-0.23084-0.22497-0.18188-0.17307-0.29358-0.35078-0.33896-0.22362-0.11891
-1 9 8 7 6 5
'MARKS TWO
4 3 2 1 0 1 2 3 4 5 6 7 89 1I****A*****E**R S
A****I .
*** .
STANDARD ERRORS . !
LAG0123456789
101112
STD0
0.2236070.3012790.305693
0.30940.3164160.3189530.31978
0.3210860.3320310.3470060. 3576570. 360192
LAG0123456789
101112
STD0
0.2294160.3319850.3509220.3512250.3591220.3664640.3711850.3754080.3873030.4036770.4183890.424633
!!!iiiiiiiii

94
TABLE 11 (continued)
AUTOCORRELATION FUNCTIONS
Ml ERROR, 1 QUARTER AHEAD FORECASTS
ARIMA PROCEDURE
NAME OF VARIABLE =MEAN OF WORKING SERIES=STANDARD DEVIATION 2NUMBER OF OBSERVATIONS=
AUTOCORRELATIONS
ECNS1.090913.91151
22
COVAR IANCE15.29998.786282.79049
-0.864144-2.62919-2.17147-2.56345-5.19965-5.71788-4.28954-3.53004
-0.3336781.58859
CORRELATION1.000000.574270.18239-0.05648-0.17184-0.14193-0.16755-0.33985-0.37372-0.28036-0.23072-0.021810.10383
-1 9 8 7 6 5 4 3 2 1 0 1 2 3 4 5 6 7 8 91
MARKS TWO STANDARD ERRORS
Ml ERROR, 2 QUARTER AHEAD FORECASTS
ARIMA PROCEDURE
NAME OF VARIABLE =MEAN OF WORKING SERIES=STANDARD DEVIATIONNUMBER OF OBSERVATIONS=
AUTOCORRELATIONS
ECNS1. 214294.83118
21
COVARIANCE23.340315.19245.95148-1.10166-3.49841-3.05991-4.22047-8.67245-9.51436-7.84369-5.38581-1.007730.612536
CORRELATION1.000000.650910.25499
-0.04720-0.14989-0.13110-0.18082-0.37157-0.40764-0.33606-0.23075-0.04318
0.02624
-1 9 8 7 6 5 4 3 2 1 0 1 2 3 4 5 6 7 8 9
1 *TSA A ER
i ~~*i-!MAKSTW*SANAR ERRRS
LAG0123456789
101112
STD0
0.2132010.2746540.2801060.2806230.2853660.2885570.2929450.3103490.3301720.3408220.3478490.347911
LAG0123456789
101112
STD0
0.2182180.2965970.3068590.3072040.3106670.3132910.3182220.3382510.3608870.3754930.3821860.382418

95
TABLE 11 (continued)
AUTOCORRELATION FUNCTIONS
Ml ERROR, 3 QUARTER AHEAD FORECASTS
ARIMA PROCEDURE
NAME OF VARIABLE =MEAN OF WORKING SERIES=STANDARD DEVIATION =NUMBER OF OBSERVATIONS=
AUTOCORRELATIONS
ECNS1.32
5.1870620
COVARIANCE26.905619.278
9.121460.30144
-4.04808-4.6393
-6.30492-10.3004-11.6421-10.5088-7.1737-2.343120.26116
CORRELATION1.000000.716500.339020.01120
-0.15045-0.17243-0.23433-0.38284-0.43270-0.39058-0.26662-0.087090.00971
-1 9 8 7 6 5 4 3 2 1 0 1 2 3 4 5 6 7 8 9 1
I .SA .RR S
I ** I iMARKS TW*SANAR ERROR
Ml ERROR, 4 QUARTER AHEAD FORECASTS
ARIMA PROCEDURE
NAME OF VARIABLEMEAN OF WORKING SERIES=STANDARD DEVIATION =NUMBER OF OBSERVATIONS=
AUTOCORRELATIONS
ECNS1. 610535.25526
19
COVARIANCE27.617820.169210.52831.12234
-4.72844-6.14524-7.7704
-10.9979-12.2027-IC.9797-6.58352-1.220011.69256
CORRELATION1.000000.730300.381220.04064-0.17121-0.22251-0.28135-0.39822-0.44184-0.39756-0.23838-0.044170.06129
19 8 7 6 5 4 3 2 1 0 1 2 3 4 5 6 7 8 9 1
MARKS TWO STANDARD ERRORS
LAG0123456789
101112
STD00. 223607
0. 3183360. 3359030. 3359220. 3392750.3436280.3515280.37179
0.3961710.414978
0.4234560.424351
LAG0123456789
101112
STD0
0.2294160.3298060.3522350.3524810.3568310.3640610.3753310.3969450.4220370.4413080.4480340.448263

96
TABLE 11 (continued)
AUTOCORRELATION FUNCTIONS
CPI ERROR, 1 QUARTER AHEAD FORECASTS
ARIMA PROCEDURE
NAME OF VARIABLE = ECNSMEAN OF WORKING SERIES= -0.682353STANDARD DEVIATION = 1.41181NUMBER OF OBSERVATIONS= 17
AUTOCORRELATIONS
COVARIANCE1.99322
-0.8698110.338925
0.00399349-0.4025990.338905
-0.06145940.151913-0.26416-0.202622
-0.0269306.0005597390.0413719
CORRELATION1.00000
-0.436390.170040.00200
-0.201980.17003-0.030830.07622-0.13253-0.10166-0.013510.000280.02076
-1 9 8 7 6
MARKS *T
54 3 2 0 2 3 4 5 6 7 891g ** **** *********** ' I
.* * * ** !.i
Al * i
***
WO STANDARD ERRORS
CPI ERROR, 2 QUARTER AHEAD FORECASTS
ARIMA PROCEDURE
NAME OF VARIABLE = ECNSMEAN OF WORKING SERIES= -1.06875STANDARD DEVIATION = 1.56114NUMBER OF OBSERVATIONS= 16
AUTOCORRELATIONS
COVAR ANCE2.43715
-0.1843580.03183110.198997-0.4115720.534226
0.02951660.140706-0.345488-0.534182-0.3267430.0341724-0.0369043
CORRELATION1. 00000-0.075640.013060.08165-0.168870.219200.012110.05773
-0.14176-0.21918-0.134070.01402-0.01514
-1 9 8 7 6 5 4 3 2 1 0 1 2 3 4 5 6 7 8 9 1
. MARKS TWO STANDARD ERRORS
LAG0123456789
101112
STD0
0.2425360. 2850040. 29091
0.2909110.2990470.3046810.3048640.3059830.309341
0. 31130. 3113340.311334
LAG0.123456789
101112
STD0
0.250.2514260.251469
0.253120.2600670.2713690.2714020.2721690.2767450.28739
0.2912730.291315

97
TABLE 11 (continued)
AUTOCORRELATION FUNCTIONS
CPI ERROR, 3 QUARTER AHEAD FORECASTS
ARIMA PROCEDURE
NAME OF VARIABLE = ECNSMEAN OF WORKING SERIES= -1.35333STANDARD DEVIATION = 1.66968NUMBER OF OBSERVATIONS= 15
AUTOCORRELATIONS
COVARIANCE2.78782
0.03678810.3965540.1484530.189419
0.0374519-0.27256
-0.0855496-0.519295-0.530284-0.47363
0.0890696-0.205964
CORRELATION1.000000.013200.142250.053250.067950.01343-0.09777-0.03069-0.18627-0.19021-0.169890.03195-0.07388
-1 9 8 7 6 5 4 3 2 1 0 1 2 3 4 5 6 7 8 9 1
S T AA
! i*** * i2 AK W STNDR ERROR
CPI ERROR, 4 QUARTER AHEAD FORECASTS
ARIMA PROCEDURE
NAME OF VARIABLEMEAN OF WORKING SERIES=STANDARD DEVIATIONNUMBER OF OBSERVATIONS=
AUTOCORRELATIONS
ECNS-1.6
1.8531814
COVARIANCE3.43429
0.4028570.9671430.778571
0.00785714-0.015-0.545
-0.432857-0.951429-0.668571
-0.61-0.146429-0.354286
CORRELATION1.000000.117300.281610.226710.00229-0.00437-0.15869-0.12604-0.27704-0.19468-0.17762-0.04264--0.10316
-1 987 6 5
MARKS TWO
4 3 2 1 0 123456789
SA ARDER S******
I- .I- I
A' . I** i - !
STADAR ERROR
LAG0123456789
101112
STD0
0.2581990.2582440.2634150.2641320.265295
0.265340.2677310.2679650.2764630.2850540. 2917270. 29196
LAG0123456789
101112
STD0
0.2672610.2709140.2910740.3034240.303425
0.303430.3093010.3129480.3300010.3381050.3447060.345082

98
TABLE 11 (continued)
AUTOCORRELATION FUNCTIONS
REAL GNP ERROR, 1 QUARTER AHEAD FORECASTS
ARIMA PROCEDURE
NAME OF VARIABLE = ECNSMEAN OF WORKING SERIES= 0.247059STANDARD DEVIATION = 1.83339NUMBER OF OBSERVATIONS= 17
AUTOCORRELATIONS
COVARIANCE3.361310.75987
0.868632-0.326342
0.64941-0.709648
-0.0626155-0.134130.357089
-0.262245-0.285143-0.386658-0.655508
CORRELATION1.000000.22606Q.25842-0.097090.19320-0.21112-0.01863-0.039900.10624
-0.07802-0.08483-0.11503-0.19502
-1 9 8 7 6 5 4 3 2 1 0 1 2 3 4 5 6 7 8
MARKS~ TWO STANDARD ERRORS
REAL GNP ERROR, 2 QUARTER AHEAD FORECASTS
ARIMA PROCEDURENAME OF VARIABLE =MEAN OF WORKING SERIES=STANDARD DEVIATION zNUMBER OF OBSERVATIONS.
AUTOCORRELATIONS
ECNS0. 243751.70183
16
COVARIANCE2.896210.509880.574839
-0.4293430.223975
-0.622434-0.04021
-0.295916-0.115957-0.150374
-0.0248291-0.12448
-0.450264
CORRELATION1.000000.176050.19848-0.148240.07733-0.21491-0.01388-0.10217-0.04004-0.05192-0.00857-0.04298-0.15547
-1 9 8 7 6 5 4 3 2 1 0 1 2 3 4 5 6 7 8 9 1
2-SA RMAKSTW SADAD RRR !
LAG0123456789
101112
STD0
0.2425360.2546290.2696150.271664
0.279630.2888540.2889250.2892490.291535
0.292760.2942030.296837
LAG0123456789
101112
STD0
0.250.2576320.2670180.2721130.2734830.2838420.2838850.2861740.2865240.2871110.2871270.287529

99
TABLE 11 (continued)
AUTOCORRELATION FUNCTIONS
REAL GNP ERROR, 3 QUARTER AHEAD FORECASTS
ARIMA PROCEDURE
NAME OF VARIABLE ECNSMEAN OF WORKING SERIES= 0.406667STANDARD DEVIATION = 1.44567NUMBER OF OBSERVATIONS=15
AUTOCORRELATIONS
COVARIANCE2.08996
0.1665750.486661-0.6368980.115588-0.592859-0.108284-0.360154-0.15389
.0009066670.07814810.0223674
-0.0498133
CORRELATION1.000000.079700.23286-0.304740.05531
-0.28367-0.05181-0.17233-0.073630.000430.037390.01070
-0.02383
-1 987
MARKS
6 54 321 0 12 34 5 678 9 1AA AA A AAAA AAAAA
IAAiAA*A* -
AAA*AAiA-IA -
AAA-
TWO STANDARD ERRORS .
REAL GNP ERROR, 4 QUARTER AHEAD FORECASTS
ARIMA PROCEDURE
NAME OF VARIABLE = ECNSMEAN OF WORKING SERIES= 0.571429STANDARD DEVIATION- = 1.30298NUMBER OF OBSERVATIONS= 14
AUTOCORRELATIONSCOVARIANCE
1.69776-0.3042420.407128-0.6851750.100073-0.4585570.089344
-0.0989796-0.04230320.178455
-0.04017490.07293
-0.0422303
CORRELATION1.00000
-0.179200.23980-0.403580.05894
-0.270100.05262
-0.05830-0.024920.10511-0.023660.04296
-0.02487
-JAAAAA* *A*AAA * AAA
jI . I
I . I
I . I
'MARKS TWO STANDARD ERRORS -.
LAG0123456789
101112
STD0
0.2581990.2598340.2733920.2951710.2958610.3134690.3140390.3202810.3214080.3214080.3216980.321722
LAG0123456789
101112
STD0
0.2672610.27571
0.2902260.3278710.3286270.3441180.3446920.3453960.3455240.3478010.3479160.348294
!!!!
!!!!!!!!
-!!!!

APPENDIX C
100

Graphical Depiction of Forecasted
and Actual Values
Fed Funds Rate (1983:2 to 1988:3)
.070
0 0
- @ 0
4
d F dsRatGUAMMA :3U
Fed Funds Rate (1983:3 to
S S
TWOQRERIADFQtR~CAST
9
U
1988:3)
I
101
U
U
I
C,C
3
S
S
7
S
S
4
(7
3
I-
g-
6-
4
0
S0
000 0
000 0
0 00
| | || |I
I

Graphical Depiction of Forecasted
and Actual Values (continued)
Fed Funds Rate (1983:4 to 1988:3)
0
0
0 0
a a 0
0 00 0
4 s e 4 o
Fed Funds Rate (1984:1 to 1988:3)
S
FOUR QUAM kM ORECASs
102
U
3.
3-
3-
g.
S.
7.
S.
S.
U4
-I4I.04
3.-
3.-
3-
5-
00
00
B o 0
08 o0 00
If
4

103
Graphical Depiction of Forecasted
and Actual Values (continued)
M1 Growth (1983:2 to 1988:3)
3 .
3-0 -
4 0-
5 -S-
0'1 i , I I I I I I I I I I I I I I I
0 2 4 S S 3 1 9 a a
K*UVM WAFO.CA1U
M1 Growth (1983:3 to 1988:3)
5.
3.
4 S.7-S.
4.
2-
0 2 4 S S 3 1 5 1
TWO RTERAWA FORECAST3
0
0
o 0
0
S
0
0
S0
6o 0

104
Graphical Depiction of Forecasted
and Actual Values (Continued)
Ml Growth (1983:4 to 1988:3)
I I V T I - I I f I T I 1 1 J I
2 4 S S 6 & a a 5
Ml Growth (1984:1 to 1988:3)
a1
2 4 S S 3 1 14 F O
FRXJoAR1UAICADCAST
4-
5-4-3-
7.S-
0
0
00 0 0
00 0
0O 00
0
4
04
3
3-I-3-
7-6-5-4-
3 -
00
a-
00
0
00
0
0
0
0
0o
0I
w Im -...
a Fv -r-
I I I I I I I I . I I I I I I 1 9 1i1c

105
Graphical Depiction of Forecasted
and Actual Values
Rate of Change in CPI (1984:3 to 1988:3)
0
0 0
4-a
%
20 000
00
.2-
-3 1 3 5 7
EO(MQAWM(FOMCATS
Rate of Change in CPI (1984:4 to 1988:3)
7
S
04.
3, 0 8 0
2- 0U
0
0-
-2 0
-3 -1 1 3 5 7
TWOQUARTEMD FORECASTS

106
Graphical Depiction of Forecasted
and Actual Values (continued)
Rate of Change in CPI (1985:1 to 1988:31
7
S
4- 000
-a 0
0
-3 3
Rate of Change in CPI (1985:2 to 1988:3)
0
-2 00
ar
0
0-0
.3-
.9 1 3
FOUR QUARTER IMADFORECASTS
6 7I

107
Graphical Depiction of Forecasted
and Actual Values (continued)
Real GNP*Growth (1984:3 to 1988:3)
0 G 4 S
Real GNP Growth (1984:4 to 1988:3)
2 4
TWOQWUARMEADfORECASTS
6
S
5.
of3-
0
0
000 0
00 0
0
00
0
0r.
0 CaII I
I
J
4
5.-
4-
3-A
0
0
0 00 0
0
000
0
0
I
r
4
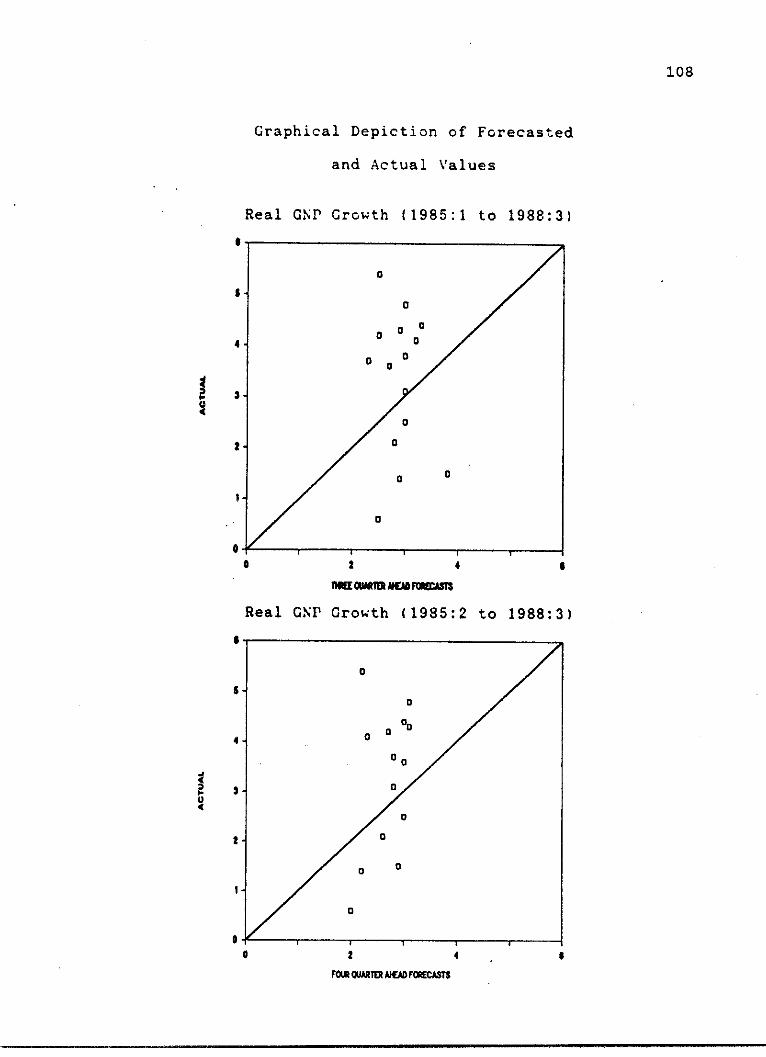
108
Graphical Depiction of Forecasted
and Actual Values
Real GNP Growth (1985:1 to 1988:3)
$ I
1-.
U,,
0 2 4 67 0 N FA CAsasts
Real GNP Growth (1985:2 to 1988:3)
I-
0-0 2 4 I
FOUR 4UARTE AECAFORECASTS
3-U4
0
0
000
00
0
0
0 0
0
4
U4
w
5 -
0
0
0
00
00
S . 0
0
I I
a .

BIBLIOGRAPHY
Attfield, C., Demery D., and Duck, N. W. 1985. Rationalexpectations i_ macroeconomics: An introduction totheory and evidence. New York: Basil Blackwell, Inc.
Brocato, Joe, Kumar, Akhil, and Smith, Kenneth L. 1989.Individual versus group spot price forecasting in theinternational petroleum market: A case study.Managerial and Decision Economics 9: 13-24.
Brown, Bryan W., and Maital, Schlomo. 1981. What doeconomists know? An empirical study of experts'expectations. Econometrica 49 (March): 491-504.
Carlson, John A. 1977. A study of price forecasts. Annals ofEconomic and Social Measurement 6: 27-56.
Carter, Michael, and Maddock, Rodney. 1984. Rationalexpectations: Macroeconomics for the 1980s? Hong Kong:Macmillan Publishers, Ltd.
Figlewski, Stephen, and Wachtel, Paul. 1981. The formationof inflationary expectations. The Review of Economicsand Statistics 58 (February): 1-10.
Friedman, Benjamin M. 1979. Optimal expectations and theextreme information assumptions of rationalexpectations models. Journal of Monetary Economics 5:23-41.
Friedman, Benjamin M. 1980. Survey evidence on therationality of interest rate expectations. Journal ofMonetary Economics 6: 453-65.
Hafer, R. W., and Resler, David H. 1982. "On the rationalityof inflation forecasts: A new look at the Livingstondata. Southern Economic Journal 48 (April): 1049-55.
Johnston, J. 1984. Econometric methods. New York: McGraw-Hill, Inc.
Keynes, John Maynard. 1937. The general theory ofemployment, interest, and money. New York: Harcourt,Brace, & World, Inc.
Maddala, G.S. 1977. Econometrics. New York: McGraw-Hill,Inc.
109

110
Makridakis, Spyros, and Winkler, Robert L. 1983. Averages- offorecasts: Some empirical results. Management Science29 (September): 987-96.
McNees, Stephen K. 1987. Consensus forecasts: Tyranny of themajority? New England Economic Review (November/December): 15-21.
McNees, Stephen K. 1988. How accurate are macroeconomicforecasts? New England Economic Review (July/August):15-36.
McNees, Stephen K. 1978. The rationality of economicforecasts. American Economic Review 68 (May): 301-05.
Mullineaux, Donald J. 1978. On testing for rationality:Another look at the Livingston price expectationsdata. Journal of Political Economy 86: 329-36.
Muth, John F. 1961. Rational expectations and the theory ofprice movements. Econometrica 29 (July): 315-35.
Pesando, James E. 1975. A note on the rationality of theLivingston price expectations. Journal of PoliticalEconomy 83: 849-57.
Pindyck, R.8., and Rubenfeld, Daniel L. 1981. Econometricmodels and economic forecasts. New York: McGraw-Hill,Inc.
Sheffrin, Steven M. 1983. Rational expectations. New York:Cambridge University Press.
Studenmund, A.H., and Cassidy, H.J. 1987. Usingeconometrics: A practical guide. Boston: Little, Brownand Company.
Turnovsky, Steven J. 1970. Some empirical evidence on theformation of price expectations. Journal of theAmerican Statistical Association 65: 1441-54.
Urich, Thomas, and Wachtel, Paul. 1984. The structure ofexpectations of the weekly money supply announcement,.Journal of Monetary Economics 13: 183-94.
Zarnowitz, Victor. 1984. The accuracy of individual andgroup forecasts from Business Outlook surveys. Journalof Forecasting 3: 11-26.