prediction of the rheological behavior of ldpe · both long and short side chains are present ......
TRANSCRIPT
IntroductionModeling
Numerical experiments
Prediction of the Rheological Behavior of LDPE
Volha Shchetnikava1
J.J.M. Slot1, E. van Ruymbeke2
1Department of Mathematics and Computer Science,TU Eindhoven2Bio and Soft Matter, IMCN, Universite Catholique de Louvain
April 09, 2014
Volha Shchetnikava J.J.M. Slot, E. van Ruymbeke Prediction of the Rheological Behavior of LDPE

IntroductionModeling
Numerical experiments
LDPE resins are made by high pressure autoclave or tubular process and mainly usedfor blown film extrusion and injection molding applications.
They are widely used for
Shrink film for books, bundling and pallets
Overwrap film for towels, tissues
Film for bakery goods, meat, coffee, frozen foods
Liquid packaging (milk cartons and bag-in-box applications)
Liners, bags, shoppers and foams
Greenhouse and tunnels
Insulation and semiconductive layers
Presentation Outline
• Introduction
• Open Problems in Molecular Rheology
– Complex Architectures
– Nonlinear Flows
• DYNACOP Progress on Theory and Simulation
• Conclusions
Volha Shchetnikava J.J.M. Slot, E. van Ruymbeke Prediction of the Rheological Behavior of LDPE
IntroductionModeling
Numerical experiments
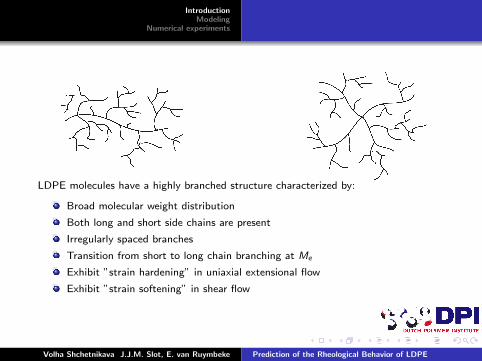
LDPE molecules have a highly branched structure characterized by:
Broad molecular weight distribution
Both long and short side chains are present
Irregularly spaced branches
Transition from short to long chain branching at Me
Exhibit ”strain hardening” in uniaxial extensional flow
Exhibit ”strain softening” in shear flow
Volha Shchetnikava J.J.M. Slot, E. van Ruymbeke Prediction of the Rheological Behavior of LDPE

IntroductionModeling
Numerical experiments
QuantumMechanics
Molecular Dynamics
Mesoscale Dynamics
Finite Elem.Analysis
Engineering
years
hours
minutes
seconds
microsec
nanosec
picosec
femtosec
1 A 1 nm 10 nm micron mm m
Time
Distance
Electrons Atoms Clusters Continuum (grids)
Population balances
with Monte Carlo for
stochastic nature
SEC/MALLS
Validation
G’(),
G’’()
DPI #674 Rheology Control by Branching Modelling
UNIVERSITEIT VAN AMSTERDAM
Modeling of LDPE polymerization process is based on the original algorithm of Tobita and produce a datastructure by Monte Carlo simulation. The algorithm takes into account all processes occurring in a batch reactorduring free-radical polymerization:
initiation of free radicals
propagation or polymerization
termination by disproportionation and combination
chain transfer by long-chain branching to small molecules and by scission
Volha Shchetnikava J.J.M. Slot, E. van Ruymbeke Prediction of the Rheological Behavior of LDPE
IntroductionModeling
Numerical experiments
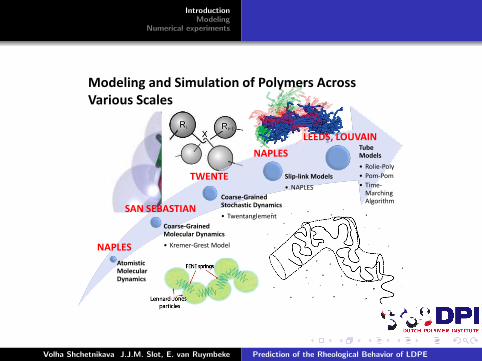
Modeling and Simulation of Polymers Across Various Scales
Atomistic Molecular Dynamics
Coarse-Grained Molecular Dynamics
• Kremer-Grest Model
Coarse-Grained Stochastic Dynamics
• Twentanglement
Slip-link Models
• NAPLES
Tube Models
• Rolie-Poly
• Pom-Pom
• Time-Marching Algorithm
NAPLES
NAPLES
SAN SEBASTIAN
TWENTE
LEEDS, LOUVAIN
Volha Shchetnikava J.J.M. Slot, E. van Ruymbeke Prediction of the Rheological Behavior of LDPE

IntroductionModeling
Numerical experiments
The degree of branching and average molecular weight of the strand of themacromolecules determine the linear rheology and extension hardening of LDPE.
calculated the nonlinear transient response instrong shear and extension of the test materials.Theoretical predictions and experimental dataare given over a wide range of deformation ratesin Fig. 3 for the first three samples. Using thenew algorithm for assigning effective segmentpriorities, for all three melts the technologicallyessential extensional response is predicted withremarkable accuracy. The onset, slope, and max-imum of the extensional hardening are consistentwith the data in each case. [Note that for the highermolecular weight (LDPE 2 and 3) materials, theextensional sample always breaks before the max-imum stress is reached.] Notably, we also capturein the case of LDPE 1 the rate at which harden-ing sets in (as well as its much reduced scale).In shear, the model predicts the existence andposition of a transient stress maximum in eachcase, and the qualitatively different thinning be-havior in contrast to the hardening in extension.
The successful nonlinear predictions are un-expected. The phenomenon is highly sensitive todetails of the long-chain branching still under-determined by the solution measurements andlinear rheology. Might the nonlinear predictionsbe fortuitous and other numerical ensembles equal-ly consistent with the linear measurements giveradically different nonlinear predictions?We testedthis by constructing examples of these alternativedistributions. The dashed curves in Fig. 3 forLDPE 2 show the extensional and shear pre-dictions for an ensemble constructed from a blendof two, rather than three, degrees of conversion
(parameter values in SOM). MWD, g(M), andlinear rheology are essentially identical, but thereaction parameters in the two fractions differmarkedly from any of the three in the first mod-el. Yet we see that the nonlinear predictions arerobust. The reason for this commercially vitalfeature is subtle, however; it is sensitive to thebranched structure only though the relaxationtime/priority distribution. Providing that this iscorrect, variations in structure within that ensem-ble will not result in variation of rheologicalresponse. The additional constraints from thepolymerization scheme are sufficient to ensurethat the ensemble belongs to the correct region ofrelaxation time/priority space. Figure S1 showsan example of a time-dependent correlation mapof relaxation time and priority (for LDPE 1). Italso indicates the two extreme structures of per-fect combs and perfect Cayley trees that consti-tute bounds for such maps. At the latest time, theouter structures and lowest molecular weightsresemble comblike topologies, but at longer timesthe larger structures acquire a more ramifiedtopology of branching, although an importantfinding is that the ensemble is always very farfrom being accurately represented by Cayleytrees (20).
We are now in a position to start exploringhypothetical variations in reaction conditionswith a view toward molecular design of newmelts. We chose to tackle the important ques-tion of independent tuning of the linear andnonlinear rheology and created different single-
batch ensembles (Table 1) with near-identicallinear rheology.
The predicted MWD, branching structure,and linear rheology spectrum for the two meltsare shown in Fig. 4. Also shown is the predictedtransient response in strong extension of two resins.The first is predicted to show much strongerextension hardening (similar in magnitude toLDPE 2 and 3) than the second (similar toLDPE 1). This is a result of its higher degree ofbranching (largerCb), compensated in the secondby a smaller strand molecular weight (the pa-rameter t is also larger for melt 1). This exampleserves to illustrate that, by separately controlling thedegree of branching and strandmolecular weight,independent control can in principle be exercisedover the linear rheology and extension hardeningof LDPE resins. This is a vital principle for thedesign of custom materials.
References and Notes1. P.-G. de Gennes, Scaling Concepts in Polymer Physics
(Cornell Univ. Press, Ithaca, NY, 1980).2. P. A. Small, Adv. Polym. Sci. 18, 1 (1975).3. J. M. Dealy, R. G. Larson, Structure and Rheology of
Molten Polymers (Hanser, Munich, 2006).4. H. Tobita, Journal of Polymer Science Part B 39, 391
(2001).5. M. Doi, S. F. Edwards, The Theory of Polymer Dynamics
(Oxford Univ. Press, Oxford, 1986)6. P.-G. de Gennes, J. Chem. Phys. 55, 572 (1971).7. P.-G. de Gennes, J. Phys. (Paris) 36, 1199 (1975).8. J. Klein, D. Fletcher, L. J. Fetters, Nature 304, 526
(1983).9. K. R. Shull, E. J. Kramer, L. J. Fetters, Nature 345, 790
(1990).10. D. S. Pearson, E. Helfand, Macromolecules 17, 888
(1984).11. T. C. B. McLeish et al., Macromolecules 32, 6734
(1999).12. N. J. Inkson, R. S. Graham, T. C. B. McLeish, D. J. Groves,
C. M. Fernyhough, Macromolecules 39, 4217(2006).
13. J. Juliani, L. A. Archer, Macromolecules 35, 10048(2002).
14. E. van Ruymbeke et al., Macromolecules 40, 5941(2007).
15. T. C. B. McLeish, Adv. Phys. 51, 1379 (2002).16. C. Das, N. J. Inkson, D. J. Read, M. A. Kelmanson,
T. C. B. McLeish, J. Rheol. 50, 207 (2006).17. D. K. Bick, T. C. B. McLeish, Phys. Rev. Lett. 76, 2587
(1996).18. T. C. B. McLeish, R. G. Larson, J. Rheol. 42, 81 (1998).19. R. J. Blackwell, T. C. B. McLeish, O. G. Harlen, J. Rheol.
44, 121 (2000).20. P. Stanescu, J. C. Majesté, C. Carrot, J. Polym. Sci. B
Polym. Phys. 43, 1973 (2005).Acknowledgments: We thank the Engineering and Physical
Sciences Research Council (UK) for funding under the“Microscale Polymer Processing” (MuPP) consortiumand the European Union Framework Programme 7 PeopleProgramme for funding under the Marie Curie InitialTraining Network Dynamics of Architecturally ComplexPolymers. The data described in this work are archived onthe MuPP project online materials database at www.irc.leeds.ac.uk/mupp2.
Supporting Online Materialwww.sciencemag.org/cgi/content/full/333/6051/1871/DC1Materials and MethodsFig. S1Tables S1 to S3
15 April 2011; accepted 27 July 201110.1126/science.1207060
Table 1. The reaction model parameters of the hypothetical materials. xs1, the degree of conversion ofcomponent 1; w1, the weight fraction of component 1 (there is only one component used in this case).
Resin t b Cb Cs xs1 w1
Batch 1 1 × 10⁻³ 8 × 10⁻⁵ 2 × 10⁻² 0 0.15 1Batch 2 8.5 × 10⁻⁴ 8 × 10⁻⁵ 5 × 10⁻³ 0 0.15 1
Fig. 4. Two reaction models (Batch 1 and Batch 2)with parameters as in Table 1 were used to calculate(A) molecular weight (and branching; g) distributions,(B) linear rheology (solid curves are G′′; dashed curvesare G′), and (C) extensional rheology at a range ofrates (black curves are Batch 1; red curves are Batch2). All rheology calculations use the parameters fromtable S2. Although they have very similar linear rhe-ology, this has been achieved through different com-
binations of branching and molecular weight distributions. As a result, the degree of extension hardeningfor the two hypothetical resins is quite different.
30 SEPTEMBER 2011 VOL 333 SCIENCE www.sciencemag.org1874
REPORTS
on
June
20,
201
2w
ww
.sci
ence
mag
.org
Dow
nloa
ded
from
Batch1∗ Mn Batch2∗ MnMax seniority 53 14
Weight fr. % g/mol Weight fr. % g/molLinears 14 6221 39 16030
Seniority 1 56 6389 48.5 16101Seniority 2 13.8 6499 9 16491Seniority 3 6.4 6639 2.4 16971Seniority 4 3.6 6568 0.7 17992Seniority 5 2.19 6867 0.2 15180
Total 96.17 99.9
*Read, D. J.; Auhl, D.; Das, C.; den Doelder, J.; Kapnistos, M.; Vittorias, I.; McLeish. T. C. B. ”Linking Models of Polymerization and Dynamics to Predict Branched Polymer Structure and Flow” Science, 333, 1871-1874 (2011)
Volha Shchetnikava J.J.M. Slot, E. van Ruymbeke Prediction of the Rheological Behavior of LDPE

IntroductionModeling
Numerical experiments
Our approachLDPE analysisRheological behavior of LDPETime-marching algorithm
What we want to do:
Understand the role of each generation of segments within molecules in therelaxation of the total ensemble
Consider the effect of taking a limited number of generations into account,because hierarchical relaxation is only active down to a certain molecular depth
Assume that the rest of the ensemble will relax automatically due to dynamictube dilation (disentanglement relaxation)
What we need to do for that:
Choose a representative ensemble of molecules
Analyse the distribution of generations of segments in the ensemble
Find all topologically different architectures belonging to a given generation
Pruning the ensemble of molecules by considering only fractions of senioritiesand several molecular weights in MWD
Extend the time-marching model to treat the relaxation of high enoughgenerations (up to 6 ?)
Find a total stress relaxation which is a sum of the contributions from thesegments of increasing seniority
Volha Shchetnikava J.J.M. Slot, E. van Ruymbeke Prediction of the Rheological Behavior of LDPE

IntroductionModeling
Numerical experiments
Our approachLDPE analysisRheological behavior of LDPETime-marching algorithm
Representative ensemble
Macromolecules are described by graphs (trees) and represented by:
Vertices - branch points and arm ends
Weight of the edge - molecular weight of the strand
The adjacency matrix of a weighted graph
We specify an ensemble of a large number of branched molecules byintroducing the following parameters:
α labels the molecular species 1, . . . ,Ns
cα indicates the concentration of particular species
Volha Shchetnikava J.J.M. Slot, E. van Ruymbeke Prediction of the Rheological Behavior of LDPE
IntroductionModeling
Numerical experiments
Our approachLDPE analysisRheological behavior of LDPETime-marching algorithm
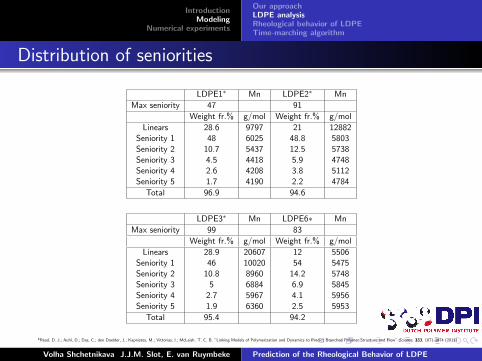
Distribution of seniorities
LDPE1∗ Mn LDPE2∗ Mn
Max seniority 47 91
Weight fr.% g/mol Weight fr.% g/mol
Linears 28.6 9797 21 12882Seniority 1 48 6025 48.8 5803Seniority 2 10.7 5437 12.5 5738Seniority 3 4.5 4418 5.9 4748Seniority 4 2.6 4208 3.8 5112Seniority 5 1.7 4190 2.2 4784
Total 96.9 94.6
LDPE3∗ Mn LDPE6∗ Mn
Max seniority 99 83
Weight fr.% g/mol Weight fr.% g/mol
Linears 28.9 20607 12 5506Seniority 1 46 10020 54 5475Seniority 2 10.8 8960 14.2 5748Seniority 3 5 6884 6.9 5845Seniority 4 2.7 5967 4.1 5956Seniority 5 1.9 6360 2.5 5953
Total 95.4 94.2
*Read, D. J.; Auhl, D.; Das, C.; den Doelder, J.; Kapnistos, M.; Vittorias, I.; McLeish. T. C. B. ”Linking Models of Polymerization and Dynamics to Predict Branched Polymer Structure and Flow” Science, 333, 1871-1874 (2011)
Volha Shchetnikava J.J.M. Slot, E. van Ruymbeke Prediction of the Rheological Behavior of LDPE

IntroductionModeling
Numerical experiments
Our approachLDPE analysisRheological behavior of LDPETime-marching algorithm
MWD of seniorities
0 2 4 6
x 104
0
2
4
6
8x 10
−5 Linears
M [g/mol]
W(M
)
DataFlory
0 2 4 6 8
x 104
0
2
4
6
8x 10
−5 Seniority 2
M [g/mol]W
(M)
DataFlory
0 2 4 6 8
x 104
0
2
4
6
8x 10
−5 Seniority 3
M [g/mol]
W(M
)
DataFlory
0 5 10
x 104
0
2
4
6
8x 10
−5 Seniority 4
M [g/mol]
W(M
)
DataFlory
0 2 4 6 8
x 104
0
2
4
6
8x 10
−5 Seniority 5
M [g/mol]
W(M
)
DataFlory
0 2 4 6 8
x 104
0
2
4
6
8x 10
−5 Seniority 6
M [g/mol]
W(M
)
DataFlory
Volha Shchetnikava J.J.M. Slot, E. van Ruymbeke Prediction of the Rheological Behavior of LDPE
IntroductionModeling
Numerical experiments
Our approachLDPE analysisRheological behavior of LDPETime-marching algorithm
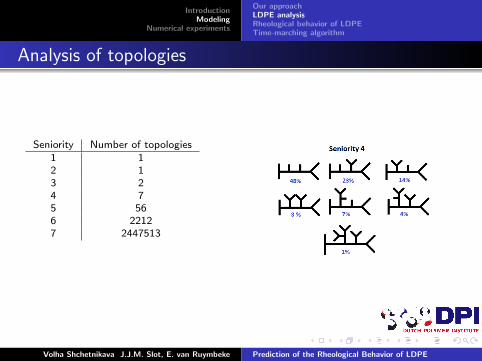
Analysis of topologies
Seniority Number of topologies1 12 13 24 75 566 22127 2447513
Volha Shchetnikava J.J.M. Slot, E. van Ruymbeke Prediction of the Rheological Behavior of LDPE
IntroductionModeling
Numerical experiments
Our approachLDPE analysisRheological behavior of LDPETime-marching algorithm
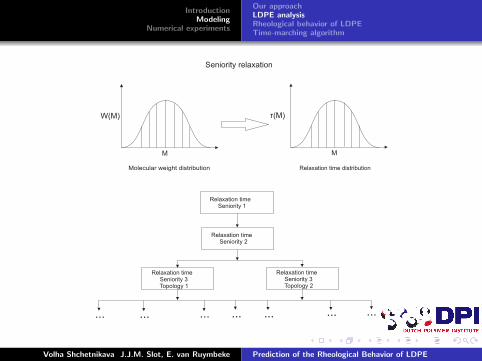
M
W(M)
M
τ(M)
Molecular weight distribution Relaxation time distribution
Seniority relaxation
Relaxation timeSeniority 1
Relaxation timeSeniority 2
Relaxation timeSeniority 3Topology 1
Relaxation timeSeniority 3Topology 2
... ... ... ... ... ... ...
Volha Shchetnikava J.J.M. Slot, E. van Ruymbeke Prediction of the Rheological Behavior of LDPE

IntroductionModeling
Numerical experiments
Our approachLDPE analysisRheological behavior of LDPETime-marching algorithm
LDPE2 Mn LDPE6 Mn
Max seniority 91 83
Weight fr.% g/mol Weight fr.% g/mol
Linears 21 12882 12 5506Seniority 1 48.8 5803 54 5475Seniority 2 12.5 5738 14.2 5748Seniority 3 5.9 4748 6.9 5845Seniority 4 3.8 5112 4.1 5956Seniority 5 2.2 4784 2.5 5953
Total 94.5 94.2
Volha Shchetnikava J.J.M. Slot, E. van Ruymbeke Prediction of the Rheological Behavior of LDPE

IntroductionModeling
Numerical experiments
Our approachLDPE analysisRheological behavior of LDPETime-marching algorithm
LDPE6 Mn
Max seniority 83
Weight fr.% g/mol
Linears 12 5506Seniority 1 54 5475Seniority 2 14.2 5748Seniority 3 6.9 5845Seniority 4 4.1 5956Seniority 5 2.5 5953
Total 94.2
Volha Shchetnikava J.J.M. Slot, E. van Ruymbeke Prediction of the Rheological Behavior of LDPE
IntroductionModeling
Numerical experiments
Our approachLDPE analysisRheological behavior of LDPETime-marching algorithm
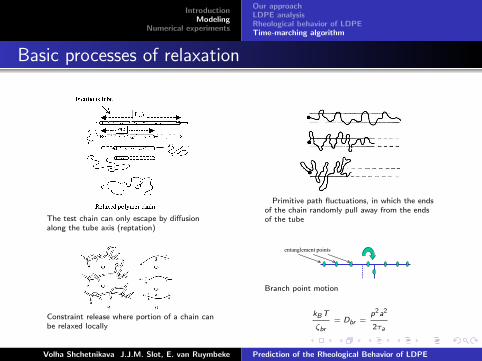
Basic processes of relaxation
Reptation
Relaxation Mechanisms (by motion of the chain)
d L3
Pierre de Gennes
The test chain can only escape by diffusionalong the tube axis (reptation)
Primitive path fluctuations, in which the endsof the chain randomly pull away from the endsof the tube
Constraint release where portion of a chain canbe relaxed locally
Hierarchical Relaxation of Asymmetric Star
Asymmetric Star: Hierarchical Relaxation Processes
1. When t<a,, all arms retract while the branch
point remains anchored.
kBT
brDbr
p2a2
2a
Branch Point Motion:
McLeish et al., Macromolecules, 32, 1999.
Arm Retraction Time:
a 0Za1.5
exp(Za )
a
entanglement points
2. When t=a, the short arm has relaxed and
branch point takes a random hop along the
confining tube.
3. When t>a, the whole polymer reptates with
the branch point as a ``fat’’ friction bead.
Branch point motion
kB T
ζbr
= Dbr =p2a2
2τa
Volha Shchetnikava J.J.M. Slot, E. van Ruymbeke Prediction of the Rheological Behavior of LDPE
IntroductionModeling
Numerical experiments
Our approachLDPE analysisRheological behavior of LDPETime-marching algorithm
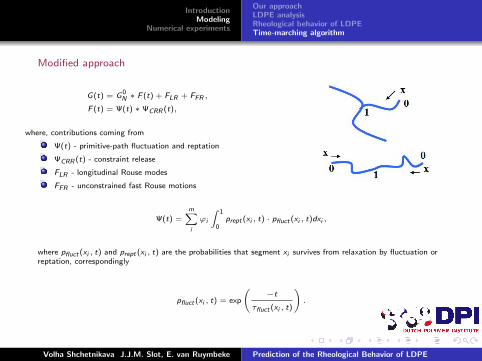
Modified approach
G(t) = G 0N ∗ F (t) + FLR + FFR ,
F (t) = Ψ(t) ∗ ΨCRR (t),
where, contributions coming from
Ψ(t) - primitive-path fluctuation and reptation
ΨCRR (t) - constraint release
FLR - longitudinal Rouse modes
FFR - unconstrained fast Rouse motions
Ψ(t) =m∑i
ϕi
∫ 1
0prept (xi , t) · pfluct (xi , t)dxi ,
where pfluct (xi , t) and prept (xi , t) are the probabilities that segment xi survives from relaxation by fluctuation orreptation, correspondingly
pfluct (xi , t) = exp
(−t
τfluct (xi , t)
).
Volha Shchetnikava J.J.M. Slot, E. van Ruymbeke Prediction of the Rheological Behavior of LDPE

IntroductionModeling
Numerical experiments
Our approachLDPE analysisRheological behavior of LDPETime-marching algorithm
Relaxation of stars
For t < τe the chain doesn’t feel the tube and stress isrelaxed by fast Rouse motion inside the tube, at slightlylonger time stress is relaxed by redistribution of chainsegments along the tube via longitudinal Rouse motion.
FFR =∑
i
5ϕi
4Za,i
N∑j=Za,i
exp
(−2j2t
τRouse,i
),
FLR =∑
i
ϕi
4Za,i
Za,i −1∑j=1
exp
(−j2t
τRouse,i
).
For t > τe star chains relax their stress by deep armretractions that can be analyzed as a thermally activatedprocess in an effective potential U(x). For shallowfluctuations where U(x) < kT , the potential is irrelevant
τearly (xi ) =9π3
16τe Z 4x4
i ,
Z = MMe
-number of entanglements in the star arm.
The tube theory doesn’t take into account that for t < τe the chain partially relaxes its stress via a Rouse process.Modification of the coordinate system is needed!
x=1x=0
xeq=0
x=xstart
x =1eq
τearly (xstart ) = τe and xeq =x−xstart1−xstart
.
Volha Shchetnikava J.J.M. Slot, E. van Ruymbeke Prediction of the Rheological Behavior of LDPE

IntroductionModeling
Numerical experiments
Our approachLDPE analysisRheological behavior of LDPETime-marching algorithm
Relaxation of stars
Fixed tube
The entropic barrier for the deeper fluctuations is givenby:
U(xi ) =3kT
2Zx2
i .
Such fluctuations require exponentially increasing time
τlate (x) = τ0exp(U(x)
kbT)
The transition between shallow and deep fluctuationshappens at xtr , such that U(xtr ) = kT
τfluct (xi ) = τearly (xi ) xi ≤ xtr ,
τfluct (xi ) = τearly (xtr ) exp
(U(xi ) − U(xtr )
kT
)xi > xtr
Tube dilation(DTD)
At long times the outer parts of the arms act as”solvent”. This means that the number of entanglementconstraints effective during relaxation of star armsdiminishes with time.
Leq (t) = Leq (0) ∗ (Φ(t))α/2, a(t) =
a(0)
(Φ(t))α/2,
Me (t) =Me (0)
(Φ(t))α,
U(xi , t) =3kT
2Zx2
i Φ(t)α xi > 1 − Φ(t)α,
where Φ(t) is the unrelaxed polymer fraction whichdetermines the speed of tube dilation.
The global effect of CRR process is to limit the maximumrate at which the entanglement density can decrease:
ΨCRR (ti ) = Φ(ti )
(ti−1
ti
)1/2
,
Φ(ti ) = max(Ψ(ti−1),ΨCRR (ti−1)).
Volha Shchetnikava J.J.M. Slot, E. van Ruymbeke Prediction of the Rheological Behavior of LDPE
IntroductionModeling
Numerical experiments
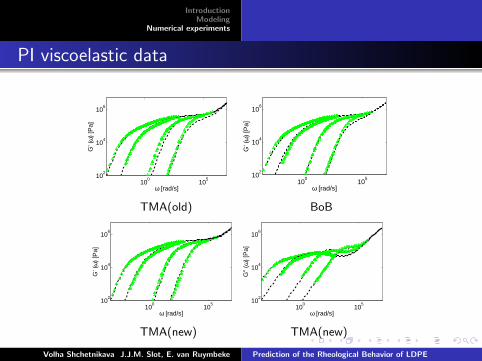
PI viscoelastic data
100
105
102
104
106
ω [rad/s]
G’ (
ω)
[Pa]
TMA(old)
100
105
102
104
106
ω [rad/s]
G’ (
ω)
[Pa]
BoB
100
105
102
104
106
ω [rad/s]
G’ (
ω)
[Pa]
TMA(new)
100
105
102
104
106
ω [rad/s]
G"
(ω)
[Pa]
TMA(new)
Volha Shchetnikava J.J.M. Slot, E. van Ruymbeke Prediction of the Rheological Behavior of LDPE
IntroductionModeling
Numerical experiments
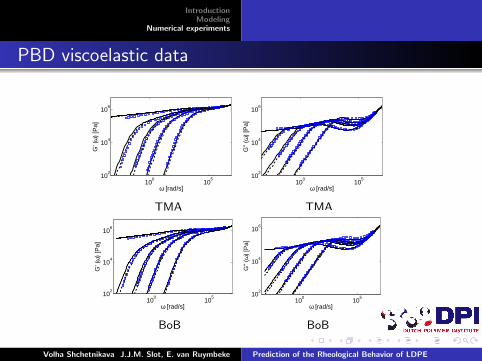
PBD viscoelastic data
100
105
102
104
106
ω [rad/s]
G’ (
ω)
[Pa]
TMA
100
105
102
104
106
ω [rad/s]
G"
(ω)
[Pa]
TMA
100
105
102
104
106
ω [rad/s]
G’ (
ω)
[Pa]
BoB
100
105
102
104
106
ω [rad/s]
G"
(ω)
[Pa]
BoB
Volha Shchetnikava J.J.M. Slot, E. van Ruymbeke Prediction of the Rheological Behavior of LDPE
IntroductionModeling
Numerical experiments
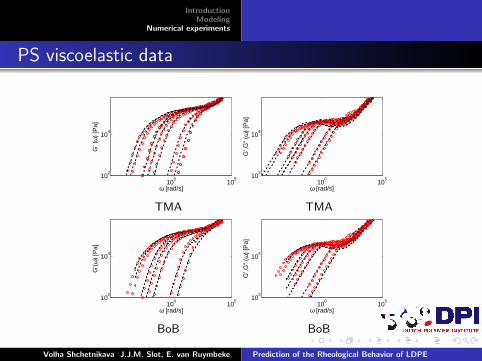
PS viscoelastic data
100
105
102
104
ω [rad/s]
G’ (
ω)
[Pa]
TMA
100
105
102
104
ω [rad/s]
G’,G
" (ω
) [P
a]
TMA
100
105
102
104
ω [rad/s]
G’(ω
) [P
a]
BoB
100
105
102
104
ω [rad/s]
G’,G
" (ω
) [P
a]
BoB
Volha Shchetnikava J.J.M. Slot, E. van Ruymbeke Prediction of the Rheological Behavior of LDPE

IntroductionModeling
Numerical experiments
PS viscoelastic data
100
105
102
104
ω [rad/s]
G’ (
ω)
[Pa]
TMA
100
105
102
104
ω [rad/s]
G"
(ω)
[Pa]
TMA
100
105
102
104
ω [rad/s]
G’ (
ω)
[Pa]
BoB
100
105
102
104
ω [rad/s]
G"
(ω)
[Pa]
BoB
Volha Shchetnikava J.J.M. Slot, E. van Ruymbeke Prediction of the Rheological Behavior of LDPE

IntroductionModeling
Numerical experiments
Relaxation of a branched polymer
How does this molecular section relax?
Additional friction
Relaxation of a branched polymer
Reptation Contour length Fluctuations
xb=0 xb=1
Leq xb=0 xb=1
xb=xbr
Leq
Relaxed branches
xbranch=0
xbranch=1
U(x)
x
U(x)
2 Fluctuations modes:
Coordinate system:
EVR et al., Macromol. 06
Volha Shchetnikava J.J.M. Slot, E. van Ruymbeke Prediction of the Rheological Behavior of LDPE

IntroductionModeling
Numerical experiments
Relaxation of a branched polymer
10−5
100
105
100
101
102
103
104
105
106
107
ω [rad/s]
G’,G
" (ω
) [P
a]
Sample A2 (BoB (red) vs TMA (blue))
10−5
100
105
100
101
102
103
104
105
106
107
ω [rad/s]
G’,G
" (ω
) [P
a]
Sample A3Data from Roovers,J. Macromalecules 1984, 17, 1196
Volha Shchetnikava J.J.M. Slot, E. van Ruymbeke Prediction of the Rheological Behavior of LDPE

IntroductionModeling
Numerical experiments
Relaxation of PBD H-polymer (TGIC)
10−5
100
105
100
101
102
103
104
105
106
107
ω [rad/s]
G’,G
" (ω
) [P
a]
H12B100
10−5
100
105
100
101
102
103
104
105
106
107
ω [rad/s]
G’,G
" (ω
) [P
a]
H12B40
10−5
100
105
100
101
102
103
104
105
106
107
ω [rad/s]
G’,G
" (ω
) [P
a]
H40B40
10−5
100
105
100
101
102
103
104
105
106
107
ω [rad/s]
G’,G
" (ω
) [P
a]
H30B40
Volha Shchetnikava J.J.M. Slot, E. van Ruymbeke Prediction of the Rheological Behavior of LDPE

IntroductionModeling
Numerical experiments
Thank You! Questions?
Volha Shchetnikava J.J.M. Slot, E. van Ruymbeke Prediction of the Rheological Behavior of LDPE