prediction of the melting points for two kinds of room temperature ionic liquids
TRANSCRIPT

Fluid Phase Equilibria 246 (2006) 137–142
Prediction of the melting points for two kinds of roomtemperature ionic liquids
Ning Sun, Xuezhong He, Kun Dong, Xiangping Zhang,Xingmei Lu, Hongyan He, Suojiang Zhang ∗
Group for Green Chemistry and Technology, Institute of Process Engineering, Chinese Academy of Sciences, Beijing 100080, China
Received 5 July 2005; received in revised form 19 May 2006; accepted 19 May 2006Available online 26 May 2006
Abstract
Melting points are significant properties for the design and application of ionic liquids (ILs) as green solvents. In this work, the meltingpoints of two kinds of room temperature ionic liquids, imidazolium tetrafluoroborates and imidazolium hexafluorophosphates, were investigatedby using a quantitative structure–property relationship (QSPR) approach. The employed descriptors were firstly selected by studying the opti-mw0if©
K
1
e[s[
cIcct
cto
0d
ized geometries of four ILs: EmimBF4, BmimBF4, EmimPF6 and BmimPF6. Electrostatic, quantum mechanical and topological descriptorsere considered efficient to describe melting points of ionic liquids. A three-parameter model with the squared correlation coefficient, R2, of.9047 is developed for 16 kinds of imidazolium tetrafluoroborates, and a six-parameter equation with R2 of 0.9207 is obtained for 25 kinds ofmidazolium hexafluorophosphates. The proposed models can be useful for the prediction of the melting points of ILs with similar structuraleatures.
2006 Elsevier B.V. All rights reserved.
eywords: Ionic liquids; Melting point; Prediction; QSPR
. Introduction
Ionic liquids (ILs) have been the subject of considerable inter-st as media for a wide range of reaction and separation processes1–3]. They are considered as potentially environmental benignolvents due to their negligible vapor pressure and easy recycling3,4].
Most of the recent work with ILs is focused on the synthesis,haracterization and application of ILs [5–8]. Many differentLs can be synthesized having a wide range of physical andhemical properties. The physical properties of the resulting ILsan be fine tuned by using different cations and anions to meethe requirement of specific applications [9–12].
The melting point is a fundamental physical property ofompounds, which has been found wide use in chemical iden-ification, as a criterion of purity and for the calculation ofther physicochemical properties such as vapor pressure, aque-
∗ Corresponding author. Tel.: +86 10 82627080; fax: +86 10 82627080.E-mail address: [email protected] (S. Zhang).
ous solubility and phase equilibrium properties [11]. For ILs,melting points have a special significance because ILs havelarge liquidus range determined by their low melting pointsas well as high decomposition points, and the solubility ofILs in water or organic solvents is strongly correlated withtheir melting points [12]. Although innumerable ILs are pos-sible, even basic data of melting points exist only for rel-atively few ILs. Development of melting point-quantitativestructure–property relationship (QSPR, models that relate chem-ical structure descriptors to physical properties) for ILs willprovide great aid in molecular design [13] and help to screen can-didate lead compounds in search for new room temperature ionicliquids.
In the open literature [14–16], it can be found that theresearches on the correlation or prediction of melting points ofILs are focused on bromide systems probably because for thesesystems’ more data are available. Here, we attempt to use QSPRmodels to correlate the melting points of two kinds of roomtemperature ionic liquids, imidazolium tetrafluoroborates andimidazolium hexafluorophosphates, which are the most exten-sively studied ILs at present.
378-3812/$ – see front matter © 2006 Elsevier B.V. All rights reserved.oi:10.1016/j.fluid.2006.05.013
138 N. Sun et al. / Fluid Phase Equilibria 246 (2006) 137–142
2. Data and methodology
2.1. Training data
The melting points of both the training sets and the test setwere obtained from the Ionic Liquids Database (ILDB) that wasdeveloped by GCT (Group of Green Chemistry and Technology,Institute of Process Engineering, Chinese Academy of Sciences)[17]. ILDB comprises all the data from available literatures onILs from 1984 to 2004. The cations in set A and set B are alldisubstituted imidazolium analogues. The anions of set A aretetrafluoroborates and the anions of set B are hexafluorophos-phates.
In total 19 disubstituted imidazolium tetrafluoroborates and29 disubstituted imidazolium hexafluorophosphates were con-sidered. The training sets, 16 compounds in set A and 25 com-pounds in set B, were produced randomly leaving 3 compoundsas the test set for set A and 4 compounds as test set for setB. Some entries in ILDB, which listed several melting points
reported from different sources for the same compound, werethrown out as they explicitly indicated impurities, and then themost recent data entries were used. Most of the entries originat-ing from different literature sources were reasonably close.
2.2. Computational method
The geometries of the cations were optimized by the semiem-pirical quantum chemical method AM1 (Austin Model 1) pro-grams. These output files are necessary for QSPR analysis usingthe CODESSA program. CODESSA is a comprehensive pro-gram for developing quantitative structure/activity and struc-ture/property relationships (QSAR/QSPR) [18] and has beensuccessfully applied in the studies of physical properties such asboiling points, melting points, vapor pressure, densities, toxicityand partition [19–21].
The best multilinear regression method (BMLR) wasemployed to search for the best correlations. The search for themulti-parameter regression with the maximum predicting ability
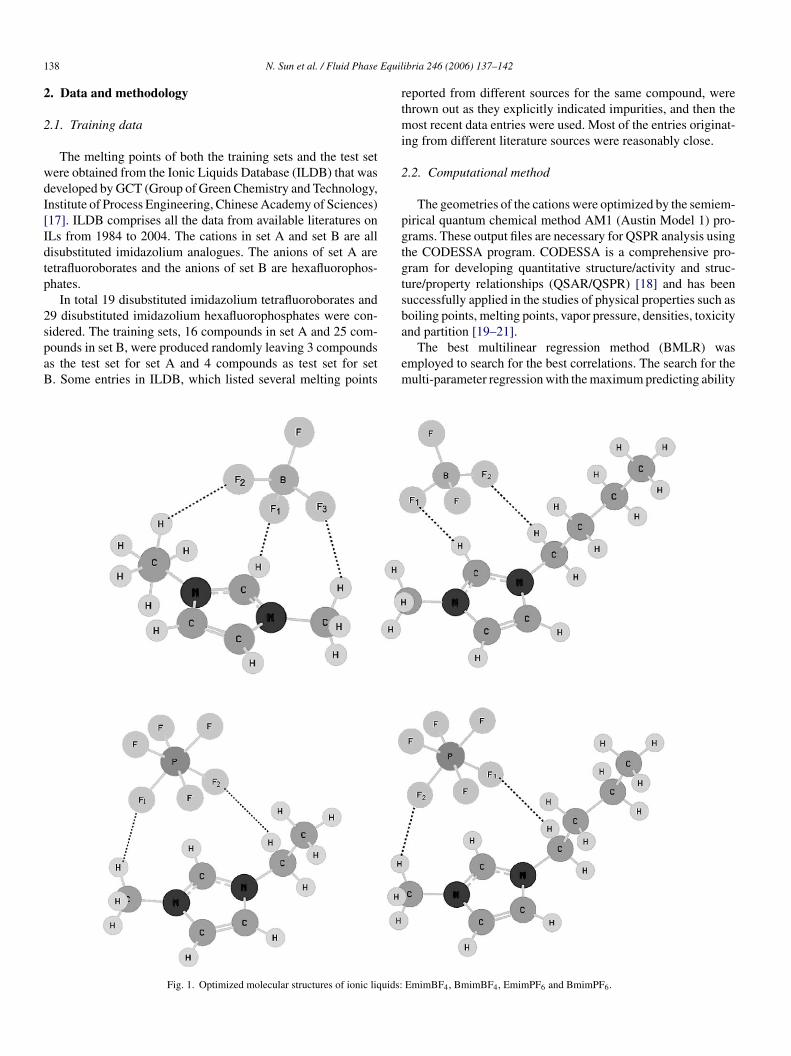
Fig. 1. Optimized molecular structures of ionic liquids:
EmimBF4, BmimBF4, EmimPF6 and BmimPF6.
N. Sun et al. / Fluid Phase Equilibria 246 (2006) 137–142 139
Table 1Uncertainties and t values for Eqs. (1) and (2)
DX t-Test
(a) Eq. (1)Intercept 367.88 −4.632HDSAQ–C 0.79641 5.7576Emin,e–e,C–C 2.9269 5.5163EOnsager 553.5 −4.7719
(b) Eq. (2)Intercept 1313.9 −10.6072Emin,e–e,C–C 2.0345 11.0191Emax,R,C–H 74.561 10.9952qmin,H 1227.5 7.2193RNCSQ–C 3.2791 −3.4765PN 598.43 4.0286BCmax,MO 181.43 −1.648
is performed using the following strategy:
1. All orthogonal pairs of descriptors i and j (with R2ij < R2
min,
R2min = 0.1) are found in a given data set.
2. The property analyzed is treated by using the two-parameterregression with the pairs of descriptors, obtained in step 1.The Nc (≤400) pairs with highest regression correlation coef-ficients are chosen for performing the higher-order regressiontreatments.
3. For each descriptor pair, obtained in the previous step, a non-collinear descriptor scale, k (with R2
ik < R2nc and R2
kj < R2nc,
R2nc = 0.65), is added, and the respective three-parameter
regression treatment is performed. If the Fisher criterion at agiven probability level, F, is smaller than that for the best two-parameter correlation, the latter is chosen as the final resultand the program proceeds to the printout section (step 5).Otherwise, the Nc (≤400) descriptors with highest regressioncorrelation coefficients are chosen for the next step.
4. For each descriptor set, chosen in the previous step, an addi-tional non-collinear descriptor scale is added, and the respec-
tive (n + 1)-parameter regression treatment is performed. Ifthe Fisher criterion at the given probability level, F, is smallerthan for the best two-parameter correlation, the latter is cho-sen as the final result and the program proceeds to the printoutsection (step 5). Otherwise, the Nc (≤400) sets descriptor setswith highest regression correlation coefficients are chosen,and this step repeated with n = n + 1.
5. The final result, with the maximum value of the Fisher crite-rion and with the highest cross-validated correlation coeffi-cient is chosen for use in the following prediction part of theprogram.
Since not all the calculated descriptors (457 for set A and 471for set B) can be involved in BMLR [22], we first studied thestructures of EmimBF4, EmimPF6, BmimBF4 and BmimPF6 asrepresentations for the two sets. The structures were optimizedby using Gaussian 03 at B3LYP/6-31+G* level. The most stablegeometries are shown in Fig. 1. In optimizing process the BF4
−anion moved towards the top of the ring plane. N-alkyl sidechains changed conformation due to electrostatic attraction. Itis found that three fluoride atoms (labeled F1, F2 and F3) haveformed hydrogen bonds with adjacent H atoms in EmimBF4but when it comes to BmimBF4 only two F atoms have formedhydrogen bonds with adjacent H atoms. F1 atom couples withH*–C*(* represent atoms of cations in hydrogen bonds) frag-mobFdcbhe
fd
Table 2Comparison between calculated values and experimental data of melting points for im
ID 1-Substituent 3-Substituent
1 –CH –CH
1111111
T ints.
3 3
2 –C2H5 –CH3
3 n-C4H9 –CH3
4 n-C10H21 –CH3
5 n-C11H23 –CH3
6 –CH2OC10H21 –CH3
7 –CH2OC11H23 –CH3
8 n-C13H27 –CH3
9 n-C14H29 –CH3
0 n-C15H31 –CH3
1 n-C16H33 –CH3
2 –CH2OC10H21 n-C6H13
3 –CH2OC11H23 –CH2OC4H9
4 n-C18H37 –CH3
5 n-C9H19 –CH3
6 n-C3H7 –CH3
calm , calculated values of melting points; T
expm , experimental data of melting po
ent in the imidazolium ring, F2 couples with H*–C* fragmentf n-alkyl side chain. Interactive energies are close to each otherut have a decreasing tendency as n-alkyl side chains are longer.or EmimPF6 and BmimPF6 two out of six F atoms formedihydrogen bonds with C*–H* fragments of two n-alkyl sidehains due to electrostatic interaction. The weak hydrogen bondsetween F atom and C*–H* fragment in EmimPF6 ionic liquidsave been experimentally confirmed by Fuller et al. [23] throughxperiment methods.
Based on the structure analysis we inferred that the mainactors that influence the melting points of ILs are the chargeistribution, H-bonding ability and the atomic connectivity
idazolium tetrafluoroborates
T calm (K) T
expm (K) Deviation (K)
384.00 376.55 7.45263.61 286.15 −22.54183.50 192.15 −8.65210.42 195.65 14.77311.19 294.55 16.64317.26 329.50 −12.24300.30 334.50 −34.20317.99 322.25 −4.26294.10 315.55 −21.45320.44 328.35 −7.91321.43 319.15 2.28337.39 311.15 26.24308.27 295.15 13.12338.11 339.95 −1.84215.46 195.95 19.51269.22 256.15 13.07

140 N. Sun et al. / Fluid Phase Equilibria 246 (2006) 137–142
Table 3Comparison between calculated values and experimental data of melting points for imidazolium hexafluorophosphates
ID 1-Substituent 3-Substituent T calm (K) T
expm (K) Deviation (K)
1 –CH3 –CH3 383.58 388.15 −4.572 –C3H7 –CH3 318.63 313.15 5.483 i-C3H7 –CH3 366.81 375.15 −8.344 –C2H4OCH3 –CH3 244.88 247.15 −2.275 –C4H9 –CH3 258.67 283.15 −24.486 n-C6H13 –CH3 255.50 212.15 43.357 –CH2C6H5 –CH3 405.53 403.15 2.388 n-C8H17 –CH3 196.93 203.15 −6.229 –C2H4C6H5 –CH3 365.68 376.15 −10.47
10 –CH2OC4H9 –CH2OC3H7 331.61 321.15 10.4611 n-C9H19 –CH3 282.97 287.15 −4.1812 –C3H6C6H5 –CH3 344.74 325.15 19.5913 –CH2OC4H9 –CH2OC4H9 327.90 330.15 −2.2514 n-C10H21 –CH3 295.90 305.15 −9.2515 –CH2OC5H11 –CH2OC4H9 317.68 311.15 6.5316 –CH2OC10H21 –CH3 309.18 319.5 −10.3217 –CH2OC6H13 –CH2OC4H9 311.59 323.15 −11.5618 n-C12H25 –CH3 334.11 333.15 0.9619 –CH2OC11H23 –CH3 332.77 325.5 7.2720 –CH2OC7H15 –CH2OC4H9 331.55 330.15 1.4021 n-C14H29 –CH3 336.15 346.15 −10.0022 –CH2OC9H19 –CH2OC4H9 329.30 323.15 6.1523 –CH2OC10H21 –CH2OC4H9 337.44 327.15 10.2924 –CH2OC11H23 –CH2OC4H9 318.62 333.15 −14.5325 –CH2OC11H23 –C6H5 307.70 303.15 4.55
T calm , calculated values of melting points; T
expm , experimental data of melting points.
which is similar to other literature [24]. Thus, the electrostatic,quantum mechanical and topological descriptors computed byCODESSA were selected to reflect the above characteristics.
3. Results and discussions
Good correlations with the experimental melting point datawere selected based on the squared correlation coefficient (R2),Fisher criterion (F), squared cross-validated correlation coeffi-cient (R2
cv) and standard error (s) of the regression. Set A wascorrelated using the three-parameter equation:
Tm(K) = −1704 − 2641.2EOnsager + 16.146Emin,e–e,C–C
+ 4.5854HDSAQ−C, N = 16, R2 = 0.9047,
R2cv = 0.7763, F = 37.99, s = 19.18 (1)
The correlation obtained for set B is given below.The uncertainties and t values for the intercepts and descrip-
tors in Eqs. (1) and (2) are reported in Table 1. The comparisonbetween the experimental data and calculated values of meltingpoints is presented in Table 2 for set A and Table 3 for set B. Asseen from the plots of
Tm(K) = −13936 + 22.418Emin,e–e,C–C + 819.81Emax,R,C–H
calculated versus experimental melting point values(Figs. 1 and 2), no outliers are evident. Correlations betweendescriptors appearing in Eqs. (1) and (2) are weak as seenin Table 4. The cross-validated correlation coefficientsR2
cv = 0.7763, 0.8423 indicate the stability of the regressionequations. In Eq. (1), the most important descriptor is HDSAQ–Cwhich represents the H-donors surface area. It serves here toquantify hydrogen bond donating ability of the cation indicatingthe significance of hydrogen bonding in the melting points ofthis kind of ionic liquids. Emin,e–e,C–C, is the minimum e–erepulsion for a C–C bond which relates to the conformational(rotational, inversional) changes or atomic reactivity in the
Fz
+ 8861.6qmin,H − 11.4RNCSQ–C + 2410.8PN
− 299.01BCmax,MO, N = 25, R2 = 0.9207,
R2cv = 0.8423, F = 34.85, s = 15.23 (2)
ig. 2. Plot of calculated vs. experimental values of melting points for imida-olium tetrafluoroborates.
N. Sun et al. / Fluid Phase Equilibria 246 (2006) 137–142 141
Table 4Max correlation coefficient of descriptors with the remaining descriptors in thetwo equations
Descriptor R2
(a) Eq. (1)HDSAQ–C 0.1275Emin,e–e,C–C 0.1275EOnsager 0.0931
(b) Eq. (2)RNCSQ–C 0.4993BCmax,MO 0.4993PN 0.2782qmin,H 0.2099Emin,e–e,C–C 0.0862Emax,R,C–H 0.0862
molecules [25]. Such energy can be quite significant andis dependent on the size and shape of the molecules, theirorientation in the crystal and the temperature. The energycan change the structure of a crystal and affect its meltingpoint [26]. EOnsager = (ε − 1)µ2/(2ε + 1), is the image of theOnsager-Kirkwood solvation energy. Where ε is the macro-scopic dielectric constant of the solvent where experimentaldata are obtained and µ is the total dipole moment of themolecule. In Eq. (2) the first important descriptor is Emin,e–e,C–Cwith the same meaning in Eq. (1). Emax,R,C–H is the maximumresonance energy for a C–H bond which relates to the formationof hydrogen bond. qmin,H is the minimum partial charge for
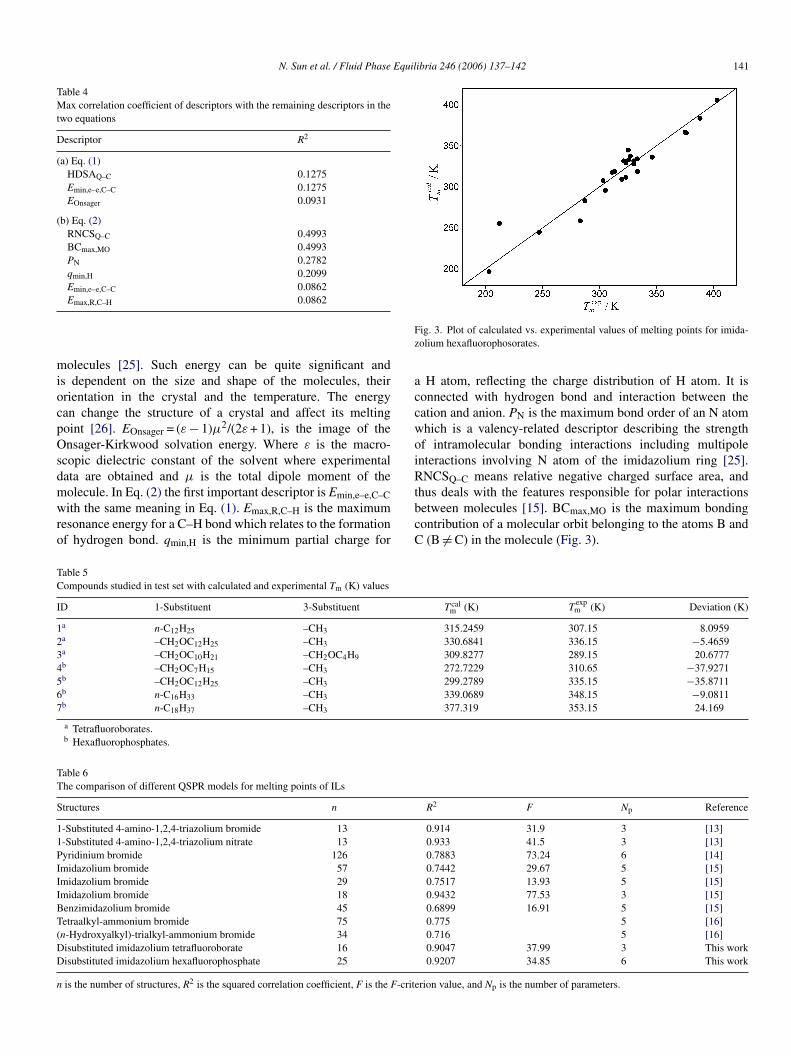
Fig. 3. Plot of calculated vs. experimental values of melting points for imida-zolium hexafluorophosorates.
a H atom, reflecting the charge distribution of H atom. It isconnected with hydrogen bond and interaction between thecation and anion. PN is the maximum bond order of an N atomwhich is a valency-related descriptor describing the strengthof intramolecular bonding interactions including multipoleinteractions involving N atom of the imidazolium ring [25].RNCSQ–C means relative negative charged surface area, andthus deals with the features responsible for polar interactionsbetween molecules [15]. BCmax,MO is the maximum bondingcontribution of a molecular orbit belonging to the atoms B andC (B �= C) in the molecule (Fig. 3).
Table 5Compounds studied in test set with calculated and experimental Tm (K) values
ID 1-Substituent 3-Substituent T calm (K) T
expm (K) Deviation (K)
1a n-C12H25 –CH3 315.2459 307.15 8.09592a –CH2OC12H25 –CH3 330.6841 336.15 −5.46593a –CH2OC10H21 –CH2OC4H9 309.8277 289.15 20.67774b –CH2OC7H15 –CH3 272.7229 310.65 −37.92715b –CH2OC12H25 –CH3 299.2789 335.15 −35.87116b n-C16H33 –CH3 339.0689 348.15 −9.08117b n-C18H37 –CH3 377.319 353.15 24.169
a Tetrafluoroborates.b Hexafluorophosphates.
TT
S
11PIIIBT(DD
n
able 6he comparison of different QSPR models for melting points of ILs
tructures n
-Substituted 4-amino-1,2,4-triazolium bromide 13-Substituted 4-amino-1,2,4-triazolium nitrate 13yridinium bromide 126midazolium bromide 57midazolium bromide 29midazolium bromide 18enzimidazolium bromide 45etraalkyl-ammonium bromide 75n-Hydroxyalkyl)-trialkyl-ammonium bromide 34isubstituted imidazolium tetrafluoroborate 16
isubstituted imidazolium hexafluorophosphate 25is the number of structures, R2 is the squared correlation coefficient, F is the F-crite
R2 F Np Reference
0.914 31.9 3 [13]0.933 41.5 3 [13]0.7883 73.24 6 [14]0.7442 29.67 5 [15]0.7517 13.93 5 [15]0.9432 77.53 3 [15]0.6899 16.91 5 [15]0.775 5 [16]0.716 5 [16]0.9047 37.99 3 This work
0.9207 34.85 6 This workrion value, and Np is the number of parameters.

142 N. Sun et al. / Fluid Phase Equilibria 246 (2006) 137–142
The melting points of the seven compounds, which are listedin Table 5, can be predicted by using the two models. The corre-lations obtained are fairly good though the maximum deviationof 38 K is somewhat larger than would be desirable. The meltingpoints of compounds no. 1–3 (imidazolium tetrafluoroborates)are predicted by using the three-parameter model, and for com-pounds no. 4–7 (imidazolium hexafluorophosphates) the meltingpoints are predicted by using the six-parameter model. The twocorrelations are expected to perform well due to the satisfactoryresults.
In Table 6 the comparison of the models developed for corre-lation and prediction of melting points of ILs are summarized.Compared to the models developed for imidazolium bromides inRef. [15], the descriptors of the models for imidazolium tetraflu-oroborates and imidazolium hexafluorophosphates in this workare not completely similar. Some descriptors in Ref. [15] arecomparable to our models such as descriptor relating to hydro-gen bond (HDSAQ–C) and electrostatic descriptor reflectingthe effect of electrostatic attraction (RNCSQ–C). Besides that,some topological descriptors and electrostatic descriptors arenot included in our models indicating the difference of anioneffects on the melting points of ILs.
4. Conclusions
Two correlations have been developed for prediction of themzcigt
A
(ga
R
[2] J. Dupont, R.F. Souza, P.A.Z. Suarez, J. Chem. Rev. 102 (2002)3667–3692.
[3] (a) T. Welton, Chem. Rev. 99 (1999) 2071–2083;(b) T. Welton, Coord. Chem. Rev. 248 (2004) 2459–2477.
[4] I. Hemeon, N.W. Barnett, N. Gathergood, P.J. Scammells, R.D. Singer,Aust. J. Chem. 2 (2004) 125–128.
[5] P. Bonhote, A.-P. Dias, N. Papageorgiou, K. Kalyanasundaram, M.Gratzel, Hydrophobic, Inorg. Chem. 35 (1996) 1168–1678.
[6] J. Sun, D.R. MacFarlane, M. Forsyth, Electrochim. Acta 48 (2003)1707–1711.
[7] S.J. Zhang, Y.H. Chen, R.X. Ren, J.M. Zhang, Y.Q. Zhang, X.P. Zhang,J. Chem. Eng. Data 50 (2005) 230–233.
[8] P.A.Z. Suarez, J.E.L. Dullius, S. Einloft, R.F. Souza, J. Dupont 15 (1996)1217–1219.
[9] S.N.V.K. Aki, J.F. Brennecke, A. Samanta, Chem. Commun. 5 (2001)413–414.
[10] M. Muldoon, C.M. Gordon, I.R. Dunkin, J. Chem. Soc., Perkin Trans.2 (2001) 433–435.
[11] A.R. Katritzky, R. Jain, A. Lomaka, R. Petrukhin, U. Maran, M. Karel-son, Crystal Growth Design 1 (2001) 261–265.
[12] R. Abramowitz, S.H. Yalkowsky, Pharm. Res. 7 (1990) 942–947.[13] S. Trohalaki, R. Pachter, G.W. Drake, T. Hawkins, Energy & Fuels 19
(2005) 279–284.[14] A.R. Katritzky, A. Lomaka, R. Petrukhin, R. Jain, M. Karelson, A.E.
Visser, R.D. Rogers, J. Chem. Inf. Comput. Sci. 42 (2002) 71–74.[15] A.R. Katritzky, R. Jain, A. Lomaka, R. Petrukhin, M. Karelson, A.E.
Visser, R.D. Rogers, J. Chem. Inf. Comput. Sci. 42 (2002) 225–231.[16] D.M. Eike, J.F. Brennecke, E.J. Maginn, Green Chem. 5 (2003) 323–
328.[17] (a) N. Sun, S.J. Zhang, X.P. Zhang, J.M. Zhang, Proceedings of the 18th
IUPAC International Conference on Chemical Thermodynamics, 2004,
[
[
[
[
[
[
[
[
[
elting points of imidazolium tetrafluoroborates and imida-olium hexafluorophosphates. The descriptors involved in theorrelations reflect both the intermolecular interactions and thentramolecular interactions. The developed QSPR models canive a fair estimate of unknown or unavailable compounds ofhe same class.
cknowledgements
The financial support of National Scientific Funding of ChinaNo. 20436050) and HI-Tech Research and Development Pro-ram of China (863 project, No. 2004AA649030) are gratefullycknowledged.
eferences
[1] P. Wasserscheid, W. Keim, Angew. Chem., Int. Ed. 39 (2000)3772–3789.
p. 458;(b) Ionic Liquids Database, World Wide Web, http://www.159.226.63.140.
18] A.R. Katritzky, V.S. Lobanov, M. Karelson, CODESSA User Manual.Version 2.0, University of Florida, 1996.
19] M.T.D. Cronin, T.I. Netzeva, J.C. Dearden, R. Edwards, A.D.P. Worgan,Chem. Res. Toxicol. 17 (2004) 545–554.
20] A.R. Katritzky, K. Tamm, M. Kuanar, D.C. Fara, J. Chem. Inf. Comput.Sci. 44 (2004) 136–142.
21] M. Karelson, U. Maran, Y. Wang, Collect. Czech. Chem. Commun. 64(1999) 1551–1571.
22] A.R. Katritzky, V.S. Lobanov, M. Karelson, CODESSA Training Man-ual. Version 2.0, University of Florida, 1996.
23] J. Fuller, R.T. Carlin, H.C. Long, D. Haworth, J. Chem. Soc., Chem.Commun. (1994) 299–300.
24] K.N. Marsh, J.A. Boxall, R. Lichtenthaler, Fluid Phase Equilibria 219(2004) 93–98.
25] A.R. Katritzky, V.S. Lobanov, M. Karelson, CODESSA Reference Man-ual. Version 2.0, University of Florida, 1996.
26] A.I. Kitaigorodsky, in: E.M. Loebl (Ed.), Molecular Crystals andMolecules, Academic Press, New York, 1973.