prediction and validation of cloudless ... 2006 conference, american solar energy society, denver,...
TRANSCRIPT

Solar 2006 Conference, American Solar Energy Society, Denver, CO (July 2006)
PREDICTION AND VALIDATION OF CLOUDLESS SHORTWAVE IRRADIANCE SPECTRA
FOR HORIZONTAL, TILTED, OR TRACKING RECEIVERS
C. A. Gueymard
Solar Consulting Services P.O. Box 392
Colebrook, NH 03576, USA [email protected]
ABSTRACT
The SMARTS spectral model can advantageously be used
to predict clear-sky irradiance spectra on surfaces of any tilt
and orientation, e.g., for the simulation of spectrally-
selective technologies. To evaluate the intrinsic accuracy of
the model, its current version undergoes here a sophisticated
three-step validation exercise, involving reference radiative
transfer codes, and two series of sophisticated spectral and
ancillary measurements performed at different locations.
Provided that the most important inputs are known with
sufficient accuracy, it is concluded that the model perform-
ance is very high, with typical differences of 1–2% when
compared to reference models, and uncertainties largely
within the overall experimental error when compared to
spectroradiometric measurements.
1. INTRODUCTION
Many biological, chemical and physical processes are acti-
vated more powerfully at some wavelengths than at others.
This is especially true and important in the field of solar
energy engineering, where spectrally-selective systems such
as PV devices, coated glazings, and biological reactors play
an increasing role. For such systems, spectral radiation data
are more appropriate than the more common broadband
irradiance data. Unfortunately, spectral irradiance is not
measured routinely, but only sporadically at a few experi-
mental sites in the world. Consequently, the only way to
accurately simulate the instantaneous energy production or
overall performance of a spectrally-selective system is to
rely on appropriate modeling. (For system rating considera-
tions, it is possible to use some pre-determined reference
spectra, usually imposed by an ad-hoc standard, but this
method cannot be used to simulate a system under variable
conditions, which is the purpose of this contribution.)
Most spectral radiation models have been developed for
atmospheric research (e.g., MODTRAN and SBDART).
Even though they are highly considered in the climate
change community because of their accuracy and physical
capabilities, it appears that their complexity (conducive to
slow execution), specialized inputs, and their lack of support
for the prediction of spectral irradiance on tilted surfaces
make their utilization inappropriate for energy applications.
Engineering models (e.g., SPCTRAL2) are much simpler
and more adapted to the problem at hand. However, they
have not been updated since the early ‘80s and their accu-
racy has not been tested against modern atmospheric mod-
els. In the last few years, the more recent and sophisticated
SMARTS model (1, 2) has gained acceptance in both the
atmospheric and engineering fields, due to its versatility (3),
ease of use, execution speed, and various refinements.
MODTRAN, SBDART and SMARTS are three of six mod-
els that have been recently chosen to conduct an innovative
radiative closure experiment (4). This study demonstrated
that: (i) when detailed and accurate input data are available,
such models can predict the clear-sky direct and diffuse
broadband irradiances with great accuracy; and (ii)
SMARTS’s broadband irradiance predictions are compara-
ble to those of reference radiative transfer codes.
These results also suggest that the current breed of radiative
models can be used for quality control purposes, to test the
consistency of long time series of broadband irradiance
measurements made with different instruments, for instance.
However, the present study is aimed at determining to what
extent these same models can be useful in predicting spec-
tral irradiance on surfaces of various geometries.
Because spectrally-selective technologies such as PV and
thin-film coatings are very sophisticated and require consid-
erable investments to develop and put into application, it is
2
of paramount importance that the models used to predict the
performance of these systems be of dependable accuracy
under a variety of atmospheric conditions. The validation
methodology followed here is threefold and consists in
comparing the spectral predictions of SMARTS to: (i) those
of four reference atmospheric models, under common and
ideal atmospheric conditions for direct normal irradiance
and global or diffuse horizontal irradiance; (ii) experimental
spectroradiometric measurements of direct normal irradi-
ance and global or diffuse horizontal irradiance; and (iii)
experimental spectroradiometric measurements of global
tilted irradiance that have been conducted specifically for
this project.
0
0.3
0.6
0.9
1.2
1.5
-10
0
10
20
30
300 400 500 600 700 800
ASTM G173 Atmospheric Conditions:
U.S. Standard AtmosphereAir mass = 1.5 (Z = 48.236°)
Ozone = 0.3438 atm-cmPrecipitable water = 1.416 cm
Rural aerosols, AOD = 0.084 at 500nm
MODTRAN 4v1r1
SMARTS 2.9.5SBDART 2.4COARTlibRadtran 1.01
Direct Ir
radia
nce (
W m
-2 n
m-1
)
% D
iff. v M
OD
TR
AN
Wavelength (nm)
Direct Normal Irradiance
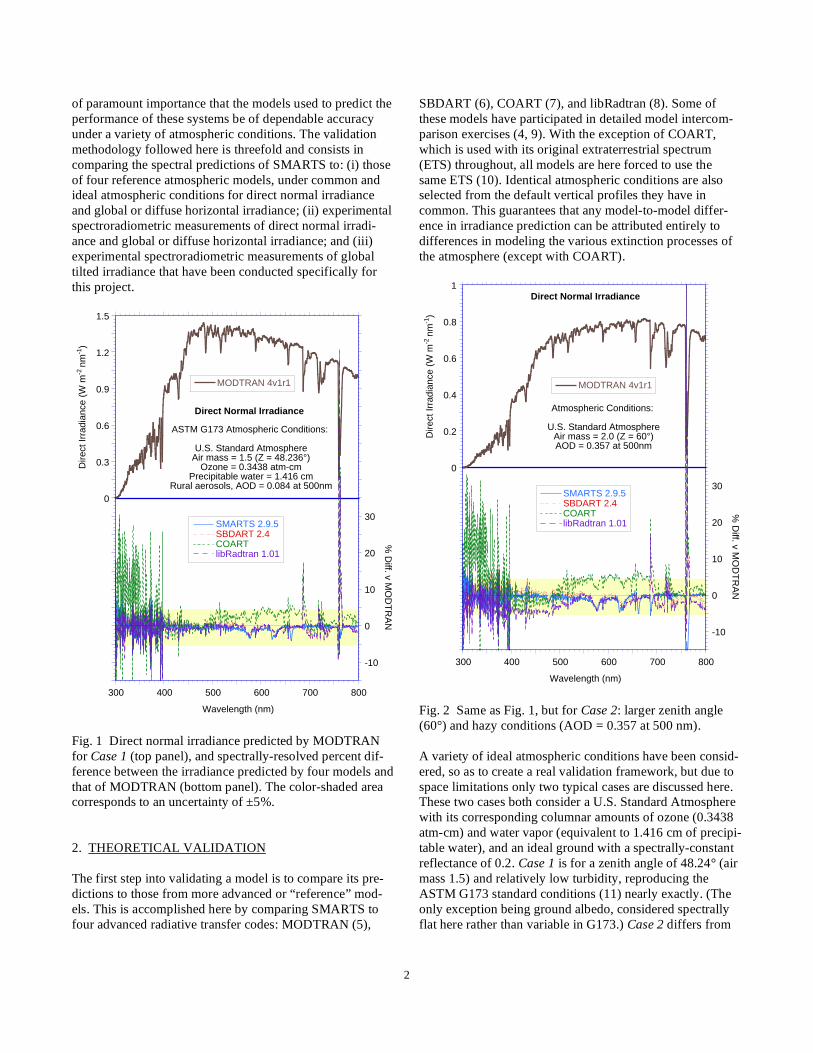
Fig. 1 Direct normal irradiance predicted by MODTRAN
for Case 1 (top panel), and spectrally-resolved percent dif-
ference between the irradiance predicted by four models and
that of MODTRAN (bottom panel). The color-shaded area
corresponds to an uncertainty of ±5%.
2. THEORETICAL VALIDATION
The first step into validating a model is to compare its pre-
dictions to those from more advanced or “reference” mod-
els. This is accomplished here by comparing SMARTS to
four advanced radiative transfer codes: MODTRAN (5),
SBDART (6), COART (7), and libRadtran (8). Some of
these models have participated in detailed model intercom-
parison exercises (4, 9). With the exception of COART,
which is used with its original extraterrestrial spectrum
(ETS) throughout, all models are here forced to use the
same ETS (10). Identical atmospheric conditions are also
selected from the default vertical profiles they have in
common. This guarantees that any model-to-model differ-
ence in irradiance prediction can be attributed entirely to
differences in modeling the various extinction processes of
the atmosphere (except with COART).
0
0.2
0.4
0.6
0.8
1
-10
0
10
20
30
300 400 500 600 700 800
Atmospheric Conditions:
U.S. Standard AtmosphereAir mass = 2.0 (Z = 60°)AOD = 0.357 at 500nm
MODTRAN 4v1r1
SMARTS 2.9.5SBDART 2.4COARTlibRadtran 1.01
Direct Ir
radia
nce (
W m
-2 n
m-1
)
% D
iff. v M
OD
TR
AN
Wavelength (nm)
Direct Normal Irradiance
Fig. 2 Same as Fig. 1, but for Case 2: larger zenith angle
(60°) and hazy conditions (AOD = 0.357 at 500 nm).
A variety of ideal atmospheric conditions have been consid-
ered, so as to create a real validation framework, but due to
space limitations only two typical cases are discussed here.
These two cases both consider a U.S. Standard Atmosphere
with its corresponding columnar amounts of ozone (0.3438
atm-cm) and water vapor (equivalent to 1.416 cm of precipi-
table water), and an ideal ground with a spectrally-constant
reflectance of 0.2. Case 1 is for a zenith angle of 48.24° (air
mass 1.5) and relatively low turbidity, reproducing the
ASTM G173 standard conditions (11) nearly exactly. (The
only exception being ground albedo, considered spectrally
flat here rather than variable in G173.) Case 2 differs from

3
Case 1 in two respects only: zenith angle increases to 60°
(air mass 2) and turbidity increases 4.25 times, to an aerosol
optical depth (AOD) of 0.357 at 500 nm.
Figures 1–4 illustrate some results of this first step, using
MODTRAN’s spectral predictions (downgraded to match
SMARTS’s resolution) as the reference. This selection of
MODTRAN as the reference is based on the fact that, by
default, it has the highest resolution among all models. It is
still an arbitrary decision, which does not imply that MOD-
TRAN is closer to the truth than any other model. There-
fore, the relative results presented here cannot provide the
absolute accuracy of SMARTS, but can at least address its
consistency relative to more advanced models.
0
0.1
0.2
0.3
0.4
0.5
-30
-20
-10
0
10
20
30
40
300 400 500 600 700 800
ASTM G173 Atmospheric Conditions:
U.S. Standard AtmosphereAir mass = 1.5 (Z = 48.236°)
AOD = 0.084 at 500nm
MODTRAN 4v1r1
SMARTS 2.9.5
SBDART 2.4
COART
libRadtran 1.01
Diffu
se Irr
adia
nce (
W m
-2 n
m-1
)
% D
iff. v M
OD
TR
AN
Wavelength (nm)
Diffuse Horizontal Irradiance
Fig. 3 Same as Fig. 1, but for diffuse irradiance.
Figures 1 and 2 pertain to direct normal irradiance, and
show excellent agreement between all four models that
share the same ETS. The SMARTS-predicted spectrum is
normally well within ±2% of MODTRAN’s, and often
closer to it than SBDART’s or libRadtran’s. The disagree-
ment between these three models and MODTRAN is only
noticeable in strong absorption bands (due particularly to
ozone, oxygen and water vapor), but these high-frequency
spikes would disappear with moderate spectral smoothing.
The differing COART results suggest that the uncertainty in
ETS may far outweigh modeling differences in this class of
models.
Results for diffuse irradiance appear in Figs. 3 and 4, show-
ing slightly larger relative differences than in Figs. 1 and 2.
This could be expected because diffuse irradiance is more
difficult to model and involves more variables than direct
irradiance. In both figures, the spectra predicted by
SMARTS are close to those by libRadtran, whereas
SBDART agrees more closely with MODTRAN. With the
exception of COART, all irradiances are within ±5% of
each other over the main part of the spectrum, at least out-
side of the main absorption features.
Results for global irradiance are not shown, but are similar
to those for direct irradiance since, under clear skies, global
irradiance is mostly made of its direct component.
0
0.1
0.2
0.3
0.4
0.5
-30
-20
-10
0
10
20
30
40
300 400 500 600 700 800
Atmospheric Conditions:
U.S. Standard AtmosphereAir mass = 2.0 (Z = 60°)AOD = 0.357 at 500nm
MODTRAN 4v1r1
SMARTS 2.9.5
SBDART 2.4
COART
libRadtran 1.01
Diffu
se Irr
adia
nce (
W m
-2 n
m-1
)
% D
iff. v M
OD
TR
AN
Wavelength (nm)
Diffuse Horizontal Irradiance
Fig. 4 Same as Fig. 2, but for diffuse irradiance.
3. EXPERIMENTAL VALIDATION
3.1 Conventional measurements
Conventional measurements and validation refer here to
direct normal irradiance and diffuse or global irradiance on
a horizontal surface. Most, if not all, spectral measurements
currently performed are of this type. Comparisons between
SMARTS’s predictions and measured spectra have always
been an important part of the model’s development process
to guarantee its relevance and accuracy (1–3, 11). This ear-

4
lier work already demonstrated the high level performance
of the model. Therefore only a few recent and more ad-
vanced sources of data are discussed here.
The main difficulty in any experimental validation undertak-
ing of this type is that, ideally, very stringent requirements
must be met if one wants to evaluate the accuracy of the
model alone: (i) the spectrometer must have a better abso-
lute accuracy than the model under scrutiny (otherwise the
model actually tests the performance of the instrument); (ii)
all the inputs required by the model must be measured si-
multaneously with independent instrumentation; and (iii)
these inputs should be “perfectly” accurate to avoid propa-
gation of errors.
Conditions for this ideal closure experiment unfortunately
almost never happens, due to various limitations. For most
validation exercises, only a few important input variables
can be measured independently, and their accuracy is not
always excellent nor well known.
In recent years, the Southern Great Plains (SGP) facility of
the Atmospheric Radiation Measurement (ARM) program
(located near Lamont, OK) has maintained a wealth of col-
located radiometric and meteorological instruments. The
high-quality and redundant measurements obtained during
the Aerosol Intensive Operational Period (AIOP) of May
2003 currently offer one of the best opportunities to com-
pare model predictions to irradiance measurements (4). The
AIOP ancillary measurements include AOD from various
sensors, aerosol single-scattering albedo, aerosol asymmetry
parameter, and precipitable water.
0.0
0.1
0.2
0.3
0.4
0.5
0.6
0.7
0.8
0.9
1.0
300 400 500 600 700 800 900 1000
ARM Central FacilitySMARTS predictions
vs RSS measurements
Global RSS
Diffuse RSS
Direct RSS
Global SMARTS
Diffuse SMARTS
Direct SMARTS
Atm
ospheric T
ransm
itta
nce
Wavelength (nm)
12 May 2003 0950Z = 38.9°
Fig. 5 Predicted vs measured direct normal, global and dif-
fuse transmittances at ARM-SGP for a clear day.
SMARTS predictions are here compared to rotating shad-
owband spectroradiometer (RSS) measurements at the SGP
site. This instrument uses a 1024-pixel CCD, measures
global and diffuse horizontal irradiances alternatively
(nearly simultaneously), and calculates direct irradiance by
difference between them, in the spectral range 360–1070 nm
(12). A sophisticated calibration technique, based on fre-
quent Langley plots and detailed statistical analysis (13), has
recently produced a method to obtain highly accurate
transmittances from the irradiance dataset available from
http://iop.archive.arm.gov, thus avoiding uncertainties in the
instrument’s absolute calibration and in the ETS. To better
simulate the RSS, the SMARTS predictions are smoothed
with a Gaussian filter of variable bandwidth, increasing
(0.38–3.8 nm) non linearly as a function of wavelength (13).
For all these comparisons, the most important atmospheric
variables were determined from collocated instruments, as
summarized in (4).
0.0
0.1
0.2
0.3
0.4
0.5
0.6
0.7
0.8
0.9
1.0
300 400 500 600 700 800 900 1000
ARM Central FacilitySMARTS predictions
vs RSS measurements
Global RSS
Diffuse RSS
Direct RSS
Global SMARTS
Diffuse SMARTS
Direct SMARTS
Atm
ospheric T
ransm
itta
nce
Wavelength (nm)
27 May 2003 1300Z = 16.9°
Fig. 6 Same as Fig. 5, but for a hazy day and higher sun.
Typical results appear in Figs. 5 and 6 for two of the 30
cases that were studied in (4), covering a day with low AOD
(12 May 2003) and a day with high AOD (27 May 2003),
respectively. Both figures show a nearly perfect agreement
over most of the spectrum. Nevertheless, such a match can
happen only if the main aerosol optical properties are known
with sufficient accuracy. This may not be perfectly the case
in Fig. 5, explaining the slight biases below 700 nm, where
aerosol scattering is most intense.
5
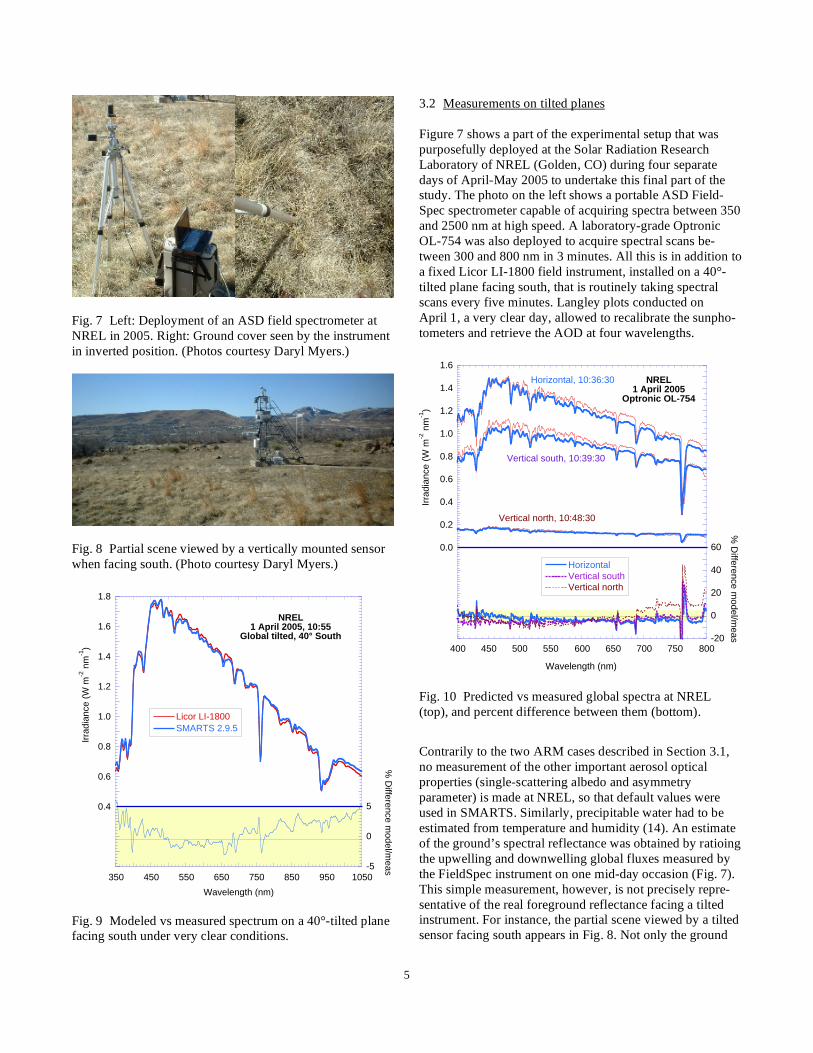
Fig. 7 Left: Deployment of an ASD field spectrometer at
NREL in 2005. Right: Ground cover seen by the instrument
in inverted position. (Photos courtesy Daryl Myers.)
Fig. 8 Partial scene viewed by a vertically mounted sensor
when facing south. (Photo courtesy Daryl Myers.)
0.4
0.6
0.8
1.0
1.2
1.4
1.6
1.8
-5
0
5
350 450 550 650 750 850 950 1050
NREL1 April 2005, 10:55
Global tilted, 40° South
Licor LI-1800
SMARTS 2.9.5
%diff
Irra
dia
nce
(W
m-2
nm
-1)
% D
iffere
nce
mo
de
l/me
as
Wavelength (nm)
Fig. 9 Modeled vs measured spectrum on a 40°-tilted plane
facing south under very clear conditions.
3.2 Measurements on tilted planes
Figure 7 shows a part of the experimental setup that was
purposefully deployed at the Solar Radiation Research
Laboratory of NREL (Golden, CO) during four separate
days of April-May 2005 to undertake this final part of the
study. The photo on the left shows a portable ASD Field-
Spec spectrometer capable of acquiring spectra between 350
and 2500 nm at high speed. A laboratory-grade Optronic
OL-754 was also deployed to acquire spectral scans be-
tween 300 and 800 nm in 3 minutes. All this is in addition to
a fixed Licor LI-1800 field instrument, installed on a 40°-
tilted plane facing south, that is routinely taking spectral
scans every five minutes. Langley plots conducted on
April 1, a very clear day, allowed to recalibrate the sunpho-
tometers and retrieve the AOD at four wavelengths.
0.0
0.2
0.4
0.6
0.8
1.0
1.2
1.4
1.6
-20
0
20
40
60
400 450 500 550 600 650 700 750 800
NREL1 April 2005
Optronic OL-754
corr horiz uvvis,"Irradiance [W/(m^2 nm)]",050401,250.00,800.00,1.00 start 10:35 end 10:39Horiz SMARTS295 10:36:30 2nm corr south vert,"Irradiance [W/(m^2 nm)]",050401,250.00,800.00,1.00, start 10:38 end 10:42South SMARTS295 10:39:30 2nmcorr north,"Irradiance [W/(m^2 nm)]",050401,250.00,800.00,1.00, start 10:47 end 10:51North SMARTS295 10:48:30 2nm
HorizontalVertical southVertical north
Irra
dia
nce
(W
m-2
nm
-1)
% D
iffere
nce
mo
de
l/me
as
Wavelength (nm)
Horizontal, 10:36:30
Vertical south, 10:39:30
Vertical north, 10:48:30
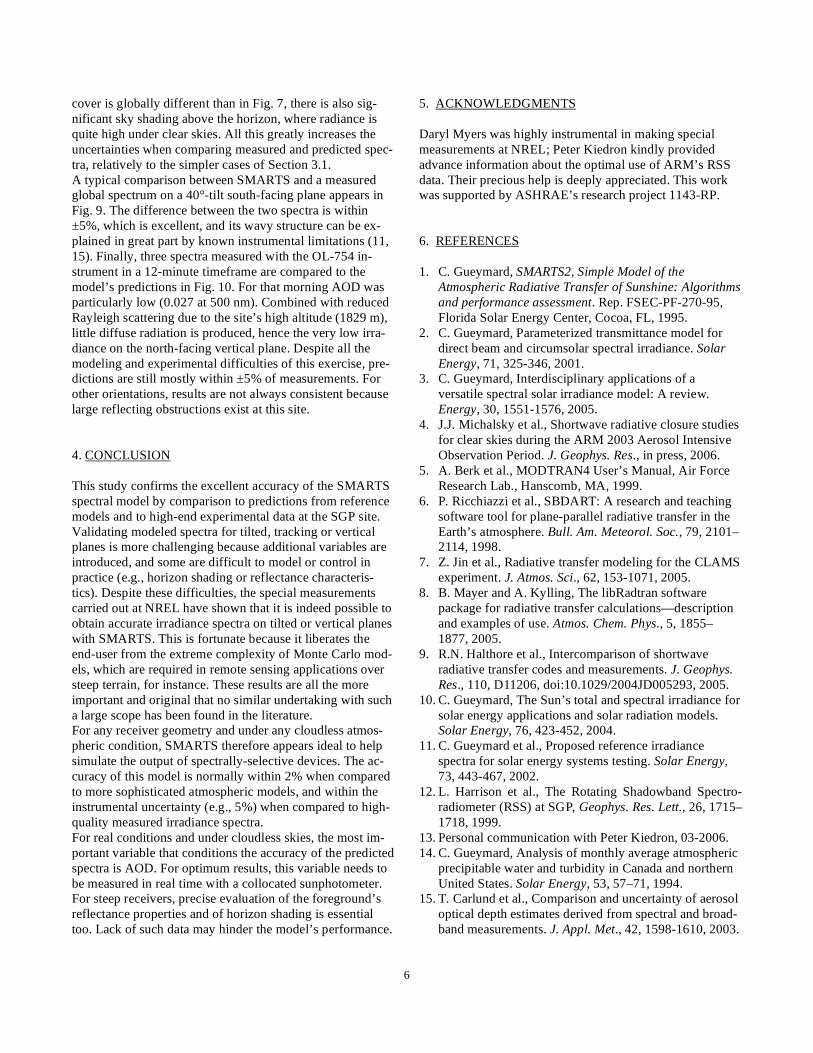
Fig. 10 Predicted vs measured global spectra at NREL
(top), and percent difference between them (bottom).
Contrarily to the two ARM cases described in Section 3.1,
no measurement of the other important aerosol optical
properties (single-scattering albedo and asymmetry
parameter) is made at NREL, so that default values were
used in SMARTS. Similarly, precipitable water had to be
estimated from temperature and humidity (14). An estimate
of the ground’s spectral reflectance was obtained by ratioing
the upwelling and downwelling global fluxes measured by
the FieldSpec instrument on one mid-day occasion (Fig. 7).
This simple measurement, however, is not precisely repre-
sentative of the real foreground reflectance facing a tilted
instrument. For instance, the partial scene viewed by a tilted
sensor facing south appears in Fig. 8. Not only the ground
6
cover is globally different than in Fig. 7, there is also sig-
nificant sky shading above the horizon, where radiance is
quite high under clear skies. All this greatly increases the
uncertainties when comparing measured and predicted spec-
tra, relatively to the simpler cases of Section 3.1.
A typical comparison between SMARTS and a measured
global spectrum on a 40°-tilt south-facing plane appears in
Fig. 9. The difference between the two spectra is within
±5%, which is excellent, and its wavy structure can be ex-
plained in great part by known instrumental limitations (11,
15). Finally, three spectra measured with the OL-754 in-
strument in a 12-minute timeframe are compared to the
model’s predictions in Fig. 10. For that morning AOD was
particularly low (0.027 at 500 nm). Combined with reduced
Rayleigh scattering due to the site’s high altitude (1829 m),
little diffuse radiation is produced, hence the very low irra-
diance on the north-facing vertical plane. Despite all the
modeling and experimental difficulties of this exercise, pre-
dictions are still mostly within ±5% of measurements. For
other orientations, results are not always consistent because
large reflecting obstructions exist at this site.
4. CONCLUSION
This study confirms the excellent accuracy of the SMARTS
spectral model by comparison to predictions from reference
models and to high-end experimental data at the SGP site.
Validating modeled spectra for tilted, tracking or vertical
planes is more challenging because additional variables are
introduced, and some are difficult to model or control in
practice (e.g., horizon shading or reflectance characteris-
tics). Despite these difficulties, the special measurements
carried out at NREL have shown that it is indeed possible to
obtain accurate irradiance spectra on tilted or vertical planes
with SMARTS. This is fortunate because it liberates the
end-user from the extreme complexity of Monte Carlo mod-
els, which are required in remote sensing applications over
steep terrain, for instance. These results are all the more
important and original that no similar undertaking with such
a large scope has been found in the literature.
For any receiver geometry and under any cloudless atmos-
pheric condition, SMARTS therefore appears ideal to help
simulate the output of spectrally-selective devices. The ac-
curacy of this model is normally within 2% when compared
to more sophisticated atmospheric models, and within the
instrumental uncertainty (e.g., 5%) when compared to high-
quality measured irradiance spectra.
For real conditions and under cloudless skies, the most im-
portant variable that conditions the accuracy of the predicted
spectra is AOD. For optimum results, this variable needs to
be measured in real time with a collocated sunphotometer.
For steep receivers, precise evaluation of the foreground’s
reflectance properties and of horizon shading is essential
too. Lack of such data may hinder the model’s performance.
5. ACKNOWLEDGMENTS
Daryl Myers was highly instrumental in making special
measurements at NREL; Peter Kiedron kindly provided
advance information about the optimal use of ARM’s RSS
data. Their precious help is deeply appreciated. This work
was supported by ASHRAE’s research project 1143-RP.
6. REFERENCES
1. C. Gueymard, SMARTS2, Simple Model of the
Atmospheric Radiative Transfer of Sunshine: Algorithms
and performance assessment. Rep. FSEC-PF-270-95,
Florida Solar Energy Center, Cocoa, FL, 1995.
2. C. Gueymard, Parameterized transmittance model for
direct beam and circumsolar spectral irradiance. Solar
Energy, 71, 325-346, 2001.
3. C. Gueymard, Interdisciplinary applications of a
versatile spectral solar irradiance model: A review.
Energy, 30, 1551-1576, 2005.
4. J.J. Michalsky et al., Shortwave radiative closure studies
for clear skies during the ARM 2003 Aerosol Intensive
Observation Period. J. Geophys. Res., in press, 2006.
5. A. Berk et al., MODTRAN4 User’s Manual, Air Force
Research Lab., Hanscomb, MA, 1999.
6. P. Ricchiazzi et al., SBDART: A research and teaching
software tool for plane-parallel radiative transfer in the
Earth’s atmosphere. Bull. Am. Meteorol. Soc., 79, 2101–
2114, 1998.
7. Z. Jin et al., Radiative transfer modeling for the CLAMS
experiment. J. Atmos. Sci., 62, 153-1071, 2005.
8. B. Mayer and A. Kylling, The libRadtran software
package for radiative transfer calculations—description
and examples of use. Atmos. Chem. Phys., 5, 1855–
1877, 2005.
9. R.N. Halthore et al., Intercomparison of shortwave
radiative transfer codes and measurements. J. Geophys.
Res., 110, D11206, doi:10.1029/2004JD005293, 2005.
10. C. Gueymard, The Sun’s total and spectral irradiance for
solar energy applications and solar radiation models.
Solar Energy, 76, 423-452, 2004.
11. C. Gueymard et al., Proposed reference irradiance
spectra for solar energy systems testing. Solar Energy,
73, 443-467, 2002.
12. L. Harrison et al., The Rotating Shadowband Spectro-
radiometer (RSS) at SGP, Geophys. Res. Lett., 26, 1715–
1718, 1999.
13. Personal communication with Peter Kiedron, 03-2006.
14. C. Gueymard, Analysis of monthly average atmospheric
precipitable water and turbidity in Canada and northern
United States. Solar Energy, 53, 57–71, 1994.
15. T. Carlund et al., Comparison and uncertainty of aerosol
optical depth estimates derived from spectral and broad-
band measurements. J. Appl. Met., 42, 1598-1610, 2003.