predicting the toxicity of chemicals to aquatic animal species · pdf filetools for predicting...
TRANSCRIPT

Tools for Predicting the Toxicity of Chemicals to
Aquatic Animal Species
Stakeholder meeting, Washington DC, December 1, 2010 1
Dale Hoff4 Wade Lehmann1 Anita Pease2 Sandy Raimondo3
Chris Russom4 Tom Steeger2
1Office of Water, Washington, DC2Office of Pesticide Programs, Washington, DC
3Office of Research and Development, Gulf Ecology Division4Office of Research and Development, Mid-Continent Ecology Division
Wade Lehmann, presenter


Present an overview of predictive tools thatmay be useful to U.S. EnvironmentalProtection Agency (USEPA) risk assessorsalong with States, Regional and Tribal riskassessors in estimating data to address alevel of adverse effect (toxicity) of pesticideactive ingredients and degradates to aquaticanimals.
Purpose Statement
3

What is Predictive Toxicology?
An in-depth survey of strategies to characterize chemical structures and biological systems-covering prediction methods and algorithms, sources of high-quality toxicity data, the most important commercial and noncommercial predictive toxicology programs, and advanced technologies in computational chemistry and biology, statistics, and data mining.
Predictive Toxicology The Book, CRC Press, 2005
4

Role of Tools for Predicting Species Sensitivity
• Key Role – potential to reduce uncertainty
• Reduce reliance on “safety factors”
• Ability to derive estimated data
• Rationale for inclusion or exclusion of minimum acceptable datarequirements (OW)
• Rationale for determining whether or not degradates of achemical should be of toxicologic concern (OPP)
5

Source
EnvironmentalConcentration
Exposure
Dose
BiologicalEvent
Effect/Outcome
Ultimate goal is linked, predictive models for each aspect of the
continuum.
6

Mode of Action (MOA)
Considerations
An understanding of selected key events and/or processes, starting with interaction of an agent with a cell, proceeding through operational and anatomical changes, and resulting in a disease state or other adverse effect.
National Research Council report “Toxicity Testing in the 21st Century”
7

ChemicalProperties
Receptor/LigandInteraction
DNA Binding
Protein Oxidation
Gene Activation
Protein Production
Altered Signaling
Protein Depletion
Altered Physiology
Disrupted Homeostasis
Altered Tissue Developmentor Function
Lethality
Impaired Development
Impaired Reproduction
Cancer
Toxicant
Macro-MolecularInteractions
Cellular Responses
OrganResponses
OrganismResponses
Structure
Recruitment
Extinction
PopulationResponses
Toxicity Pathway
Anchor 1(initiating event)
Anchor 2(adverse outcome at the organism- or population-
level)
Adverse Outcome Pathway (AOP)
Considerations
8
modified from Ankley et al., 2010

Exposure
Tissue Dose
Biologic Interaction
Perturbation
Biological Inputs
Normal BiologicalFunction
Early CellularChanges
CellInjury
Morbidity &Mortality
Adaptive Stress Response
NRC, 2007
9
Toxic Effect Pathway

• Current Data Requirements
• Predictive Tool Identification and Usage
10
Usage of Tools
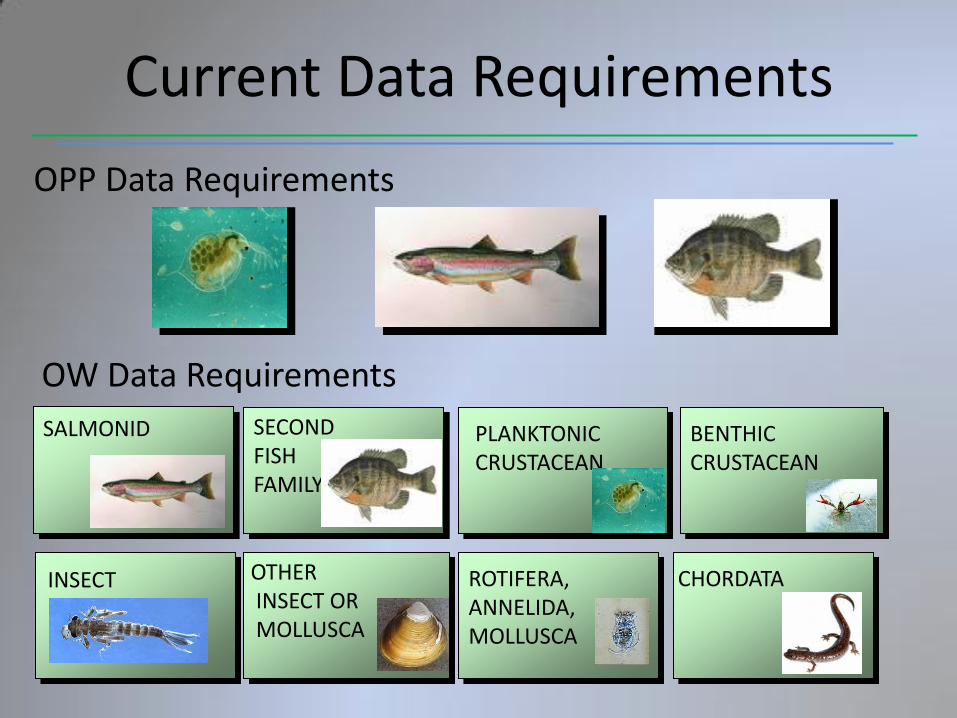
OPP Data Requirements
Current Data Requirements
11 11
SALMONID SECONDFISHFAMILY
CHORDATA
PLANKTONICCRUSTACEAN
BENTHIC CRUSTACEAN
INSECT ROTIFERA, ANNELIDA, MOLLUSCA
OTHERINSECT ORMOLLUSCA
OW Data Requirements

Compile empirical
toxicity data
Determine adverse outcome
pathway
Can empirical toxicity data be supplemented with
predicted data?
If yes, use appropriate tools for chemical to predicted toxicity
data
If no, acute toxicity database is represented by empirical data
only.
Acute toxicity database is represented by empirical and
predicted data.
Use appropriate method (extrapolation factor or sensitivity distribution) to derive ALSV.
(1)
(2)
(3)
(5)
(4)
(6)
(7)
12
Proposed Method

• These methods are one element in a multiple lines of evidence approach.
• Output should be weighted (qualitative vs quantitative) according to reliability and risk assessment context
• Has the approach followed the appropriate validation principles?
• How consistent is the prediction based on what is known about the chemical being evaluated?
• Identify uncertainties associated with the prediction
• What are the limitations of the selected models?
Considerations in Approach
13

[Quantitative] Structure Activity Relationships
Read-Across/Bridging
webICE (Interspecies Correlation Estimates)
TCE (Time-Concentration Effect) models
ACRs
Predictive Tools
14

Chemical 1 Chemical 2 Chemical 3 Chemical 4
Property 1
Property 2
Property 3
Property 4
Activity 1
Activity 2
Activity 3
Activity 4
SAR / read-across
Interpolation
Extrapolation
Trend analysis / QSAR
Empirical data
Missing data
15

Endpoint information for one chemical is used to predict the same endpoint for another chemical, which is considered to be “similar”.
Read-across process involves:The identification of a chemical substructure or MOA that is common to two substances (analogues); and
The assumption that toxicological effects of each analogous substance in the set will show common behavior in relation to AOP (i. e., organophosphate pesticides)
Read-Across / BridgingPredictive Tools
16

17
Parameter ALLETHRIN DIMETHRIN DELTAMETHRIN RESMETHRIN PERMETHRIN BIFENTHRIN
Fathead
minnow
LC50 values
(ug/L)
53.0 62.0 ?? 6.16 16.0 ??
Log P 5.52 6.57 7.02 7.11 7.61 8.15
Read-Across / BridgingPredictive Tools

18
Parameter ALLETHRIN DIMETHRIN DELTAMETHRIN RESMETHRIN PERMETHRIN BIFENTHRIN
Fathead
minnow
LC50 values
(ug/L)
53.0 62.0 27 6.16 16.0 7.9
Log P 5.52 6.57 7.02 7.11 7.61 8.15
Read-Across / BridgingPredictive Tools

Rainbow trout toxicity shows no relationship to KOW.
0
50
100
150
200
250
300
350
400
450
0 1 2 3 4 5 6
S
M
A
V
KOW
O. mykiss
SMAV=108.7+6.784(KOW)R2=0.002P=0.96
Rainbow trout toxicity increases significantly (decreasing LC50) with increasing Ki.
-100
0
100
200
300
400
500
0 100 200 300 400 500 600 700
S
M
A
V
Ki
O. mykissSMAV=515.2-0.852(Ki)R2=0.93P=0.04
Read-Across / BridgingPredictive Tools

Chemical structure is [quantitatively] correlated with a well defined action, e.g., biological activity or chemical reactivity.
Example: EPA ECOSAR (Ecological Structure Activity Relationships)
Assumptions
[Quantitative] Structure Activity Relationships
Predictive Tools
20

OECD Principles for QSAR Validation
• A defined endpoint
• An unambiguous algorithm
• A defined domain of applicability
• Appropriate measures of goodness-of-fit, robustness, and predictive capacity.
• A mechanistic interpretation
Predictive Tools
21

Scientifically valid (Q)SAR model
(Q)SAR model relevant to
regulatory purpose
QSAR model applicable to
target chemical
Reliable (Q)SAR result
Relevant & Reliable (Q)SAR
Modified from ECHA 2010
Reliable (Q)SAR resultRelevant (Q)SAR
result
22

Web-based tool that estimates acute toxicity (LC50 or EC50)for a species, genus or family from a surrogate species.
Uses of web-ICE in ecological effects assessment:Populates toxicity database;Allows for species sensitivity comparisons ;Taxa sensitivity estimation for endangered species;Quantifiable model confidence
Interspecies Correlation EstimationPredictive Tools
23

ICE Models are Log-linear models of the relationship between the acute toxicity (eg. LC50) of chemicals tested in two species.
Predictive ToolsInterspecies Correlation Estimation
24

• Use time-course to mortality data from acute toxicity tests to extrapolate to a prediction of chronic lethality
• Several different types
• Validated to predict chronic mortality
Time-Concentration Effects Models (TCE)Predictive Tools
25

Used to estimate chronic toxicity in aquatic organisms for which acute toxicity is known, but chronic data are limited or absent
ACR = ratio of acute effect to chronic measure
eg. ACR= LC50 (or EC50) ÷ NOEC (or MATC)
Acute-Chronic Ratios (ACR)Predictive Tools
26

Acute-Chronic Ratios (ACR)Predictive Tools
Similarities in approaches by both OPP and OW:
Use of same assessment endpoints (survival, growth, and reproduction);
Control performance;
Dilution water quality and potential impacts on toxicity; and
Chronic data based on similar exposure duration and type of exposure.
OPP use of ACRs
OW use of ACRs
27

• Using OECD validation principles as a framework for guidance([Q]SAR and beyond)– Defined endpoint– An unambiguous algorithm– Defined domain of applicability– Appropriate measures of goodness of fit, robustness, and
predictive capacity– Mechanistic interpretation if possible
• Using guidance provided by tool developers– Defined criteria: Positive vs negative vs inconclusive
associations and/or correlations
• Strengths and weaknesses of existing data estimation techniques for pesticide active ingredients
Interpretation Framework For Predictive Tools
28

• Only one element in a multiple lines-of-evidence approach
– Considered according to reliability, data availability/reliability for tool interpretation, and assessment context
• Ideally will have multiple predictions from multiple tools
– Evaluate strengths and limitations of concordance approach
• Reliability
• Predictive performance
• Domain of applicability
Considerations for Use of Predictive Tools
29

• Obtain predictions for test compound and similar (chemical category or class/MOA) data rich compounds, parent compound, and possibly metabolites
• Documentation of predictions and interpretations
– Dependent on assessment context:
• Screening – limited documentation
• Criteria development – comprehensive documentation
Considerations for Use of Predictive Tools (cont’d)
30

Weight of Evidence and use of Best Professional Judgment– Output from these predictive methods should be weighted (qualitative/quantitative)
according to reliability, availability of specific data types (e.g., in vivo study results), and assessment context (e.g., identification of data requirements vs. hazard assessment decision).
– Keeping in mind the OECD Validation Principles for use of QSARs, and the Bradford Hill criteria for identification of AOPs, users should recognize that these are prediction methods and they have associated limitations.
– There are uncertainties regarding the variability and relevancy of predicted values. Many model estimates should only be considered when actual measured chemical-specific data are not available. Uncertainties should be noted.
Considerations for Use of Predictive Tools (cont’d)
31

Through this White Paper, the Agency (OW, OPP, ORD) presents an overview of predictive tools that may be useful in generating data for use in effects assessment and derivation of aquatic life screening values.
Each component of this approach should be evaluated, documented, and appropriately applied to a lines of evidence approach to estimating comparative taxonomic sensitivity to derived surrogate data values.
Summary
32