predicting the anti-inflammatory activity of novel 5...
TRANSCRIPT

Human Journals
Research Article
July 2015 Vol.:3, Issue:4
© All rights are reserved by Dr. Anwar Rafique Shaikh et al.
Predicting the Anti-Inflammatory Activity of Novel 5-Phenylsulfamoyl-2-(2-(Nitrooxy)
(Acetoxy)Benzoic Acid Derivative using 2D and 3D-QSAR (kNN-MFA) Analysis
www.ijppr.humanjournals.com
Keywords: anti-inflammatory agent, salicylic acid, 2D
QSAR, 3D QSAR, kNN-MFA, VLife MDS
ABSTRACT
2D-QSAR and 3D-QSAR studies by means of MLR, PLS and
PCR were performed on a series of salicylic acid derivatives
for anti-inflammatory activity using software MDS 4.2
version (VLife Science). This study was performed with 19
compounds (Data set) using random as well as manual data
selection methods for the division of the data into training and
test set. MLR methodology with stepwise forward-backward
variable selection method was used for building the QSAR
models. Statistically significant QSAR models were
generated. Among them most significant model has squared
correlation coefficient (r2) = 0.9236, cross validated
correlation coefficient (q2) = 0.8360 and predictive correlation
coefficient (pred_r2) = 0.3738 for the anti-inflammatory
activity. The idea of the present study is the search for novel
salicylic acid analogues that would show promise to be useful
in the anti-inflammatory agent.
Dr. Anwar Rafique Shaikh1*, Malik Amber
1,
Imadulislam1, Ziyaul Haque
2, Dr. Sanjay J.
Kshirsagar1, Kankate R. S
1, Yogita B. Thombare
1
1Bhujbal Knowledge city, MET’s Institute of
pharmacy, Adgaon, Nashik-422003
2AliAllana College of Pharmacy, Jamia Isalamia Isha-
atul Uloom's Ali-Allana College of Pharmacy,
Akkalkuwa.
Submission: 26 June 2015
Accepted: 3 July 2015
Published: 25 July 2015
www.ijppr.humanjournals.com
Citation: Dr. Anwar Rafique Shaikh et al. Ijppr.Human, 2015; Vol. 3 (4): 95-117.
96
1. INTRODUCTION
Most NSAIDs are weak organic acids. Once absorbed, they get bound to serum albumin. Due to
increased vascular permeability in localised sites of inflammation, this high degree of protein
binding may result in the delivery of higher levels of NSAIDs. They are a chemically diverse
group.
The primary effect of NSAIDs is to inhibit COX enzyme, thereby blocking the transformation of
arachidonic acid to prostaglandins, prostacyclin and thromboxanes. These result in complex
effects on vascular permeability and platelet aggregation, undoubtfully contributing to the
overall clinical effects of these compounds (Abadi at all 2005).
COX 1, or prostaglandin synthase H, is a house keeping enzyme that regulates normal cellular
functions and is stimulated by hormones and growth factors. It is constitutively expressed in
most tissues and is inhibited by NSAIDs in varying degrees. COX 1 is important in maintaining
the integrity of the gastric and duodenal mucosa and many of the side effects of NSAIDs on the
gastrointestinal tract are attributed to its inhibition (Furst and Ulrich, 2007).
COX 2 or prostaglandin synthase H2 is an inducible enzyme and is usually not detectable in most
tissues. Its expression is increased during states of inflammation or experimentally in response to
mitogenic stimuli. Its expression is inhibited by glucocorticoids. COX-2 is also inhibited by all
of the presently used NSAIDs, to a lesser or greater degree. Thus, differences in the effectiveness
with which a particular NSAID inhibits an isoform of COX may affect with its activity and its
potential toxicity. It has been proposed that the ideal NSAID would inhibit the inducible COX-2
alone, without having any effect on COX-1.
Our interest is in developing new effective medications as anti-inflammatory agent because of
less toxicity in GIT. Pharmacological evaluation shows the NO2 release of compound will
decrease the GIT toxicity (Bandarage, et al, 2000).
The main objective of proposed plan was to design, synthesize & evaluate newer salicylate
derivatives by introduction of nitroxy functional group to reduce the GI side effects (associated
with aspirin) and substitution at 5-position to improve the anti-inflammatory profile.
Gastrointestinal effects of non steroidal anti-inflammatory drug (NSAID) are still a significant
www.ijppr.humanjournals.com
Citation: Dr. Anwar Rafique Shaikh et al. Ijppr.Human, 2015; Vol. 3 (4): 95-117.
97
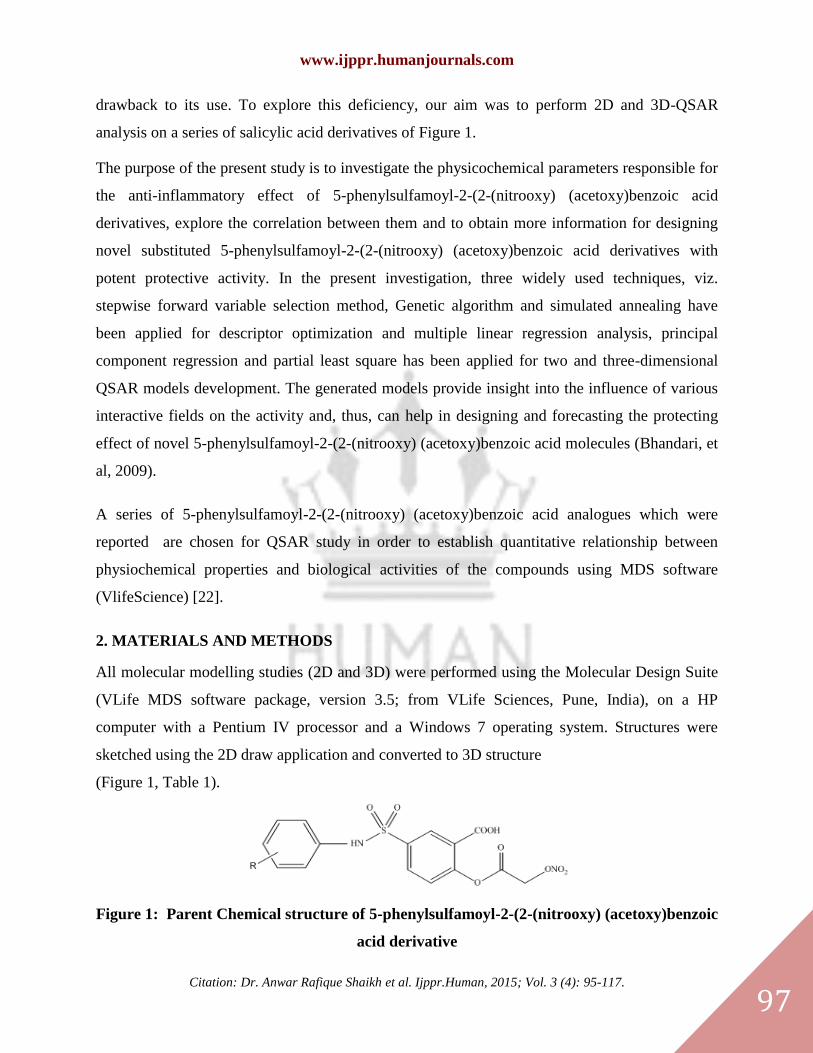
drawback to its use. To explore this deficiency, our aim was to perform 2D and 3D-QSAR
analysis on a series of salicylic acid derivatives of Figure 1.
The purpose of the present study is to investigate the physicochemical parameters responsible for
the anti-inflammatory effect of 5-phenylsulfamoyl-2-(2-(nitrooxy) (acetoxy)benzoic acid
derivatives, explore the correlation between them and to obtain more information for designing
novel substituted 5-phenylsulfamoyl-2-(2-(nitrooxy) (acetoxy)benzoic acid derivatives with
potent protective activity. In the present investigation, three widely used techniques, viz.
stepwise forward variable selection method, Genetic algorithm and simulated annealing have
been applied for descriptor optimization and multiple linear regression analysis, principal
component regression and partial least square has been applied for two and three-dimensional
QSAR models development. The generated models provide insight into the influence of various
interactive fields on the activity and, thus, can help in designing and forecasting the protecting
effect of novel 5-phenylsulfamoyl-2-(2-(nitrooxy) (acetoxy)benzoic acid molecules (Bhandari, et
al, 2009).
A series of 5-phenylsulfamoyl-2-(2-(nitrooxy) (acetoxy)benzoic acid analogues which were
reported are chosen for QSAR study in order to establish quantitative relationship between
physiochemical properties and biological activities of the compounds using MDS software
(VlifeScience) [22].
2. MATERIALS AND METHODS
All molecular modelling studies (2D and 3D) were performed using the Molecular Design Suite
(VLife MDS software package, version 3.5; from VLife Sciences, Pune, India), on a HP
computer with a Pentium IV processor and a Windows 7 operating system. Structures were
sketched using the 2D draw application and converted to 3D structure
(Figure 1, Table 1).
Figure 1: Parent Chemical structure of 5-phenylsulfamoyl-2-(2-(nitrooxy) (acetoxy)benzoic
acid derivative

www.ijppr.humanjournals.com
Citation: Dr. Anwar Rafique Shaikh et al. Ijppr.Human, 2015; Vol. 3 (4): 95-117.
98
Table 1: % Release of nitric oxide
Sr. No. Compound
Code
Activity
Clogpb
% NO
Release
1 F1 1.31 20.86
2 F2 1.05 11.23
3 F3 1.15 14.31
4 F4 1.05 11.26
5 F5 1.11 13.02
6 F6 1.06 11.51
7 F7 1.26 18.20
8 F8 1.25 17.82
9 F9 1.21 16.34
10 F10 1.19 15.74
11 F11 1.08 12.14
12 F12 1.05 11.25
13 F13 0.95 9.00
14 F14 1.15 14.40
15 F15 1.20 15.95
16 F16 1.29 19.90
17 F17 1.17 14.80
18 F18 1.08 12.30
19 F19 1.05 11.31
2.1 Biological data
The anti-inflammatory activity of 5-phenylsulfamoyl-2-(2-(nitrooxy) (acetoxy)benzoic acid
derivative were taken from the reported work. The total set of compounds was divided into a
training set for generating 2D and 3D QSAR models and a test set for validating the quality of
the models. Selection of the training set and test set molecules was done on the basis of structural
www.ijppr.humanjournals.com
Citation: Dr. Anwar Rafique Shaikh et al. Ijppr.Human, 2015; Vol. 3 (4): 95-117.
99
diversity and a wide range of activity such that the test set molecules represent a range of
biological activity similar to that of the training set; thus, the test set is truly representative of the
training set. The biological activity values [IC50 (µM)] reported in micromolar units were
converted to their molar units and then further to negative logarithmic scale and subsequently
used as the dependent variable for the QSAR analysis. The values of IC50 along with the
structure of the compounds in the series are listed in Table 1.
2.2 Molecular modelling for 2D QSAR
In 2D QSAR analysis, significant methods Multiple linear regression, principal component
regression and partial least square were applied to generate the 2D-QSAR model. The 2D
structures were converted to 3D structures by sending them to MDS software. Each compound
was energy minimized and batch optimized by using Merck Molecular Force Field and charges
followed by Austin Model-1. Hamiltonian method was available in MOPAC module with the
convergence criterion 0.001 kcal/mol A˚ fixing Root Mean Square Gradients (RMS) to 0.001
kcal/mol A˚. 2D descriptors (physicochemical and alignment independent) were calculated for
the optimized compounds on QSAR plus worksheet. The invariable descriptors (the descriptors
that are constant for all the molecules) were removed, as they do not contribute to QSAR. Most
stable structure for each compound was generated after energy minimization and used for
calculating various physicochemical descriptors like thermodynamic, steric and electronic. The
energy-minimized geometry was used for the calculation of the various 2D descriptors
(Individual, Chi, ChiV, Path count, Chi Chain, ChiV Chain, Chain path count, Cluster, Path
cluster, Kappa, Element Count, Estate number, Estate contribution, Semi-empirical,
Hydrophilic– hydrophobic, Polar surface area and Alignment independent) and was considered
as independent variables in the present study.
QSAR analysis was performed after removal of all the invariable columns, as they do not
contribute to the QSAR. The optimal test and training data set were generated using the manual
as well as random data selection method. Sphere exclusion method was also adopted for division
of training and test set. Sphere exclusion method is used for creating training and test set from
the data. This is a rational selection method which takes into consideration both biological and
chemical space for division of data set. Dissimilarity value provides handle to vary train/test set
size. It needs to be adjusted by trial and error until a desired division of train and test set is
www.ijppr.humanjournals.com
Citation: Dr. Anwar Rafique Shaikh et al. Ijppr.Human, 2015; Vol. 3 (4): 95-117.
100
achieved. As a rule, increase in dissimilarity value will lead to increase in number of molecules
in the test set. All 13 molecules were subjected to regression analysis using Multiple linear
regression analysis, as model building methods coupled with stepward forward backward
variable selection method. Regression analysis was carried out for treatment of drug abuse
disorders and the best model was cross-validated. Best two dimensional QSAR results obtained
by multiple linear regression analysis (using random and manual data selection method), Partial
Least Squares and Principal Component Regression are obtained by the following Table 2.1, 2.2
and 2.3 respectively.
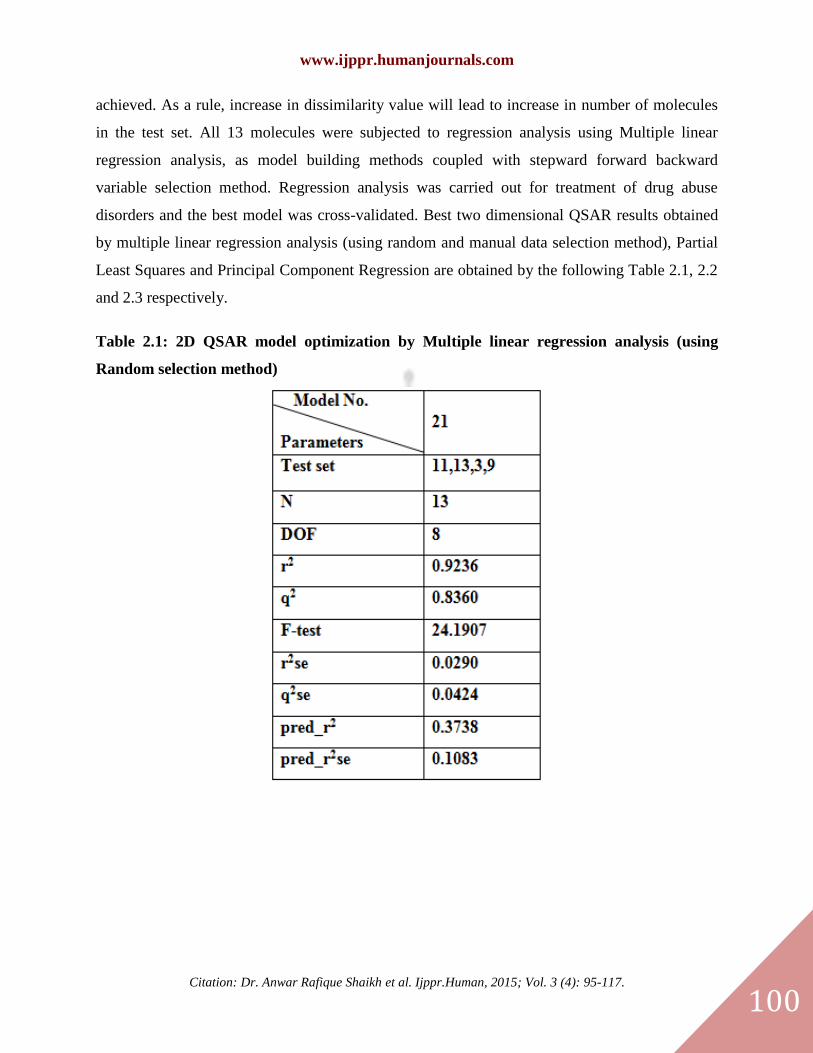
Table 2.1: 2D QSAR model optimization by Multiple linear regression analysis (using
Random selection method)
www.ijppr.humanjournals.com
Citation: Dr. Anwar Rafique Shaikh et al. Ijppr.Human, 2015; Vol. 3 (4): 95-117.
101
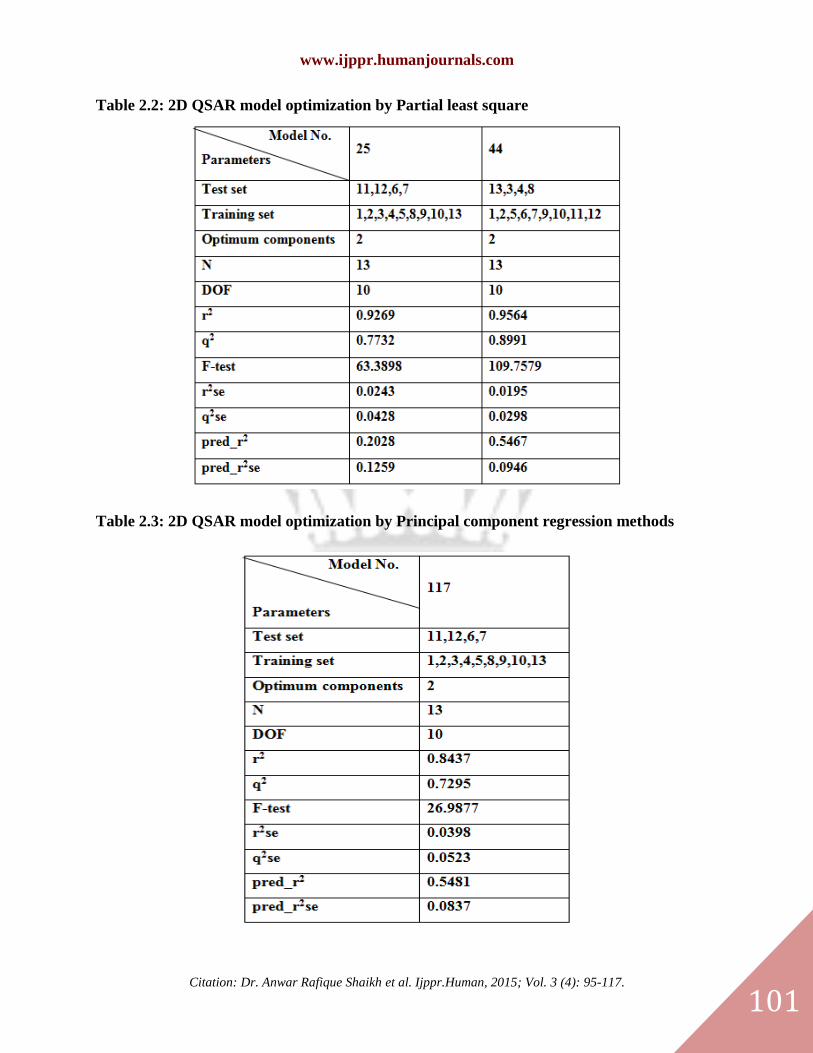
Table 2.2: 2D QSAR model optimization by Partial least square
Table 2.3: 2D QSAR model optimization by Principal component regression methods

www.ijppr.humanjournals.com
Citation: Dr. Anwar Rafique Shaikh et al. Ijppr.Human, 2015; Vol. 3 (4): 95-117.
102
2.3. Three dimensional (3-D) QSAR studies
In the kNN-MFA method three models were generated for the selected members of training and
test sets, and the corresponding best two models are reported herein. VLife Molecular Design
Suite 3.5 allows user to choose probe, grid size, and grid interval for the generation of
descriptors. The variable selection methods along with the corresponding parameters are allowed
to be chosen, and optimum models are generated by maximizing q2. k-Nearest neighbor
molecular field analysis (kNN-MFA) requires suitable alignment of given set of molecules. To
derive the kNN-MFA descriptor fields, a 3D cubic lattice with grid spacing of 2 A˚ in x, y, and z
dimensions were created to encompass the aligned molecules. kNN-MFA descriptors were
calculated using sp3 carbon probe atom with a van der Waals radius of 2A˚ and a charge of +1.0
with default cut off energy 30 kcal/mol to generate steric field, electrostatic and hydrophobic
fields. The steric, and electrostatic energy values were truncated at a default value of ±30
kcal/mol. The kNN-MFA steric, and electrostatic fields thus generated were scaled by the
standard method in the software. The 3D-QSAR studies were performed by kNN-MFA using
stepwise forward backward, simulated annealing selection method and genetic algorithm
method. The software produced more than 7568 descriptors and prior to model development
descriptors having zero values or same values were removed which resulted in more than total
2500 descriptors for all the compounds in separate columns. This algorithm allows constructing
training sets covering all descriptor space areas occupied by representative points. kNN-MFA
with simulated annealing and stepwise variable selection was employed for selection of variables
to obtain the QSAR model. The standard leave one out (LOO) procedure was implemented to
calculate cross validated r2 (q
2) value, that is a molecule in the training set was eliminated and its
biological activity was predicted as the weighted average activity of the k most similar
molecules.
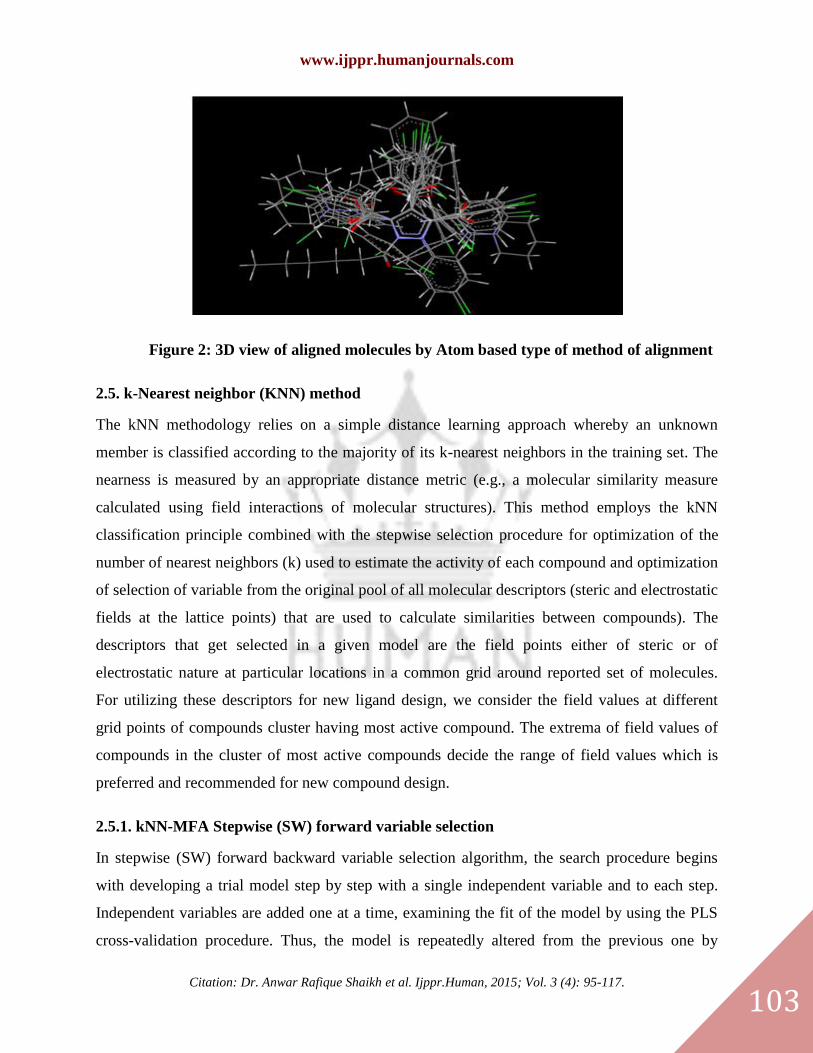
2.4. Molecular alignment
Molecular alignment was used to visualize the structural diversity in the given set of molecules.
This was followed by generation of common rectangular grid around the molecules. The Atom
based alignment method was used for alignment by considering the common elements of the
series. kNN-MFA method requires suitable alignment of given set of molecules after
optimization, alignment was carried out by Atom based alignment method (Fig. 2).
www.ijppr.humanjournals.com
Citation: Dr. Anwar Rafique Shaikh et al. Ijppr.Human, 2015; Vol. 3 (4): 95-117.
103
Figure 2: 3D view of aligned molecules by Atom based type of method of alignment
2.5. k-Nearest neighbor (KNN) method
The kNN methodology relies on a simple distance learning approach whereby an unknown
member is classified according to the majority of its k-nearest neighbors in the training set. The
nearness is measured by an appropriate distance metric (e.g., a molecular similarity measure
calculated using field interactions of molecular structures). This method employs the kNN
classification principle combined with the stepwise selection procedure for optimization of the
number of nearest neighbors (k) used to estimate the activity of each compound and optimization
of selection of variable from the original pool of all molecular descriptors (steric and electrostatic
fields at the lattice points) that are used to calculate similarities between compounds). The
descriptors that get selected in a given model are the field points either of steric or of
electrostatic nature at particular locations in a common grid around reported set of molecules.
For utilizing these descriptors for new ligand design, we consider the field values at different
grid points of compounds cluster having most active compound. The extrema of field values of
compounds in the cluster of most active compounds decide the range of field values which is
preferred and recommended for new compound design.
2.5.1. kNN-MFA Stepwise (SW) forward variable selection
In stepwise (SW) forward backward variable selection algorithm, the search procedure begins
with developing a trial model step by step with a single independent variable and to each step.
Independent variables are added one at a time, examining the fit of the model by using the PLS
cross-validation procedure. Thus, the model is repeatedly altered from the previous one by
www.ijppr.humanjournals.com
Citation: Dr. Anwar Rafique Shaikh et al. Ijppr.Human, 2015; Vol. 3 (4): 95-117.
104
adding or removing a predictor variable in accordance with the ‘stepping criteria’ (in this case F=
4 for inclusion; F=3.99 for exclusion for the forward–backward selection method). The method
continues until there is no more significant variable remaining outside the model (Table 3).
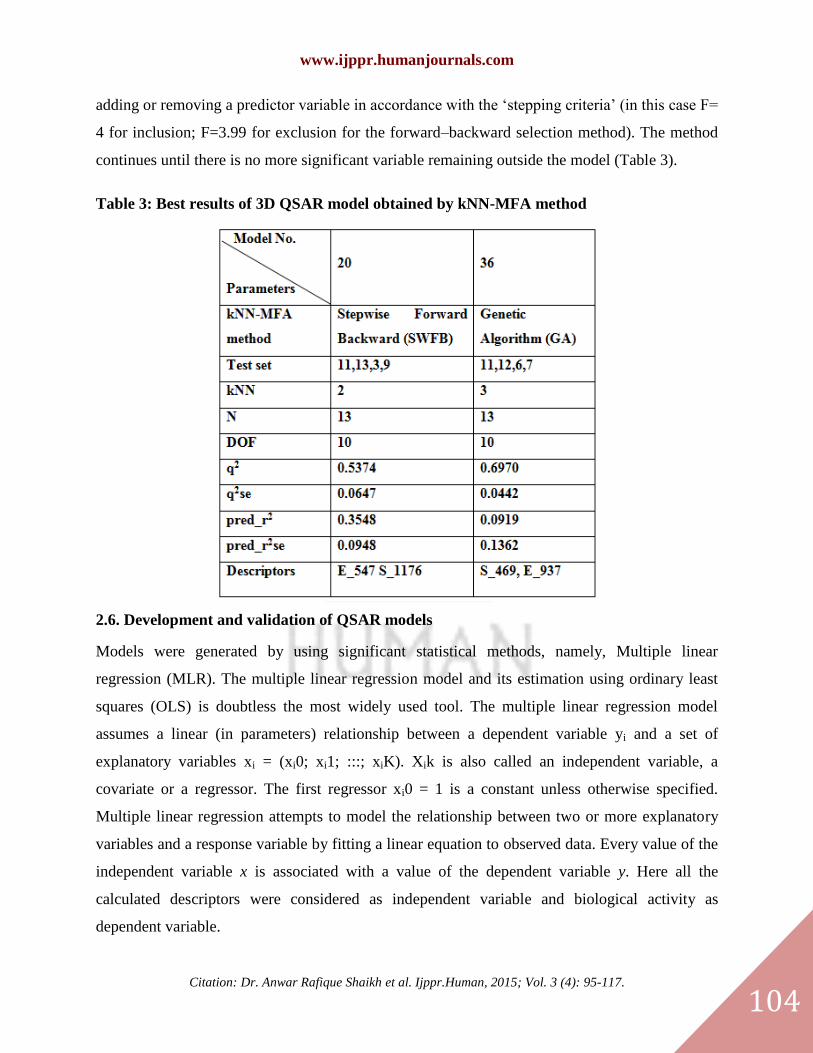
Table 3: Best results of 3D QSAR model obtained by kNN-MFA method
2.6. Development and validation of QSAR models
Models were generated by using significant statistical methods, namely, Multiple linear
regression (MLR). The multiple linear regression model and its estimation using ordinary least
squares (OLS) is doubtless the most widely used tool. The multiple linear regression model
assumes a linear (in parameters) relationship between a dependent variable yi and a set of
explanatory variables xi = (xi0; xi1; :::; xiK). Xik is also called an independent variable, a
covariate or a regressor. The first regressor xi0 = 1 is a constant unless otherwise specified.
Multiple linear regression attempts to model the relationship between two or more explanatory
variables and a response variable by fitting a linear equation to observed data. Every value of the
independent variable x is associated with a value of the dependent variable y. Here all the
calculated descriptors were considered as independent variable and biological activity as
dependent variable.

www.ijppr.humanjournals.com
Citation: Dr. Anwar Rafique Shaikh et al. Ijppr.Human, 2015; Vol. 3 (4): 95-117.
105
The cross-validation analysis was performed using the leave-one-out method. The following
statistical parameters were considered to compare the generated QSAR models: correlation
coefficient (r), squared correlation coefficient (r2), predicted r
2 (pred_r
2), and Fischer’s value (F)
24. To validate the generated QSAR models, the leave-one-out (LOO) method was used,
indicated as the value of q2 (cross-validated explained variance), which is a measure of the
internal predictive ability of the model. The cross-validated r2 (q2) value was calculated, where
yi and are the actual and predicted activities of the ith
molecule respectively, and ymean is the
average activity of all the molecules in the training set.
Both summations are over all molecules in the training set and hence the predictions were based
on the current trial solution, the q2 obtained indicates the predictive power of the current model
25.
The predicted r2 (pred_r
2) value was calculated, where yi and are the actual and predicted
activities of the ith
molecule in test set, respectively, and ymean is the average activity of all
molecules in the training set. Both summations are over all molecules in the test set. The pred_r2
value is indicative of the predictive power of the current model for external test set25
.
To evaluate the statistical significance of the QSAR model or an actual data set, we have
employed a one-tail hypothesis testing. The robustness of the QSAR models for experimental
training sets was examined by comparing these models to those derived for random data sets.
Random sets were generated by rearranging biological activities of the training set molecules25
.
3. RESULTS AND DISCUSSION
The importance and utility of the new 2D and 3D QSAR method discussed has been established
by applying it to known sets of molecules as described above. All the calculated descriptors were
considered as independent variable and biological activity as dependent variable. In 2D QSAR
analysis, significant methods like Multiple linear regression analysis, Partial Least Square (PLS)
www.ijppr.humanjournals.com
Citation: Dr. Anwar Rafique Shaikh et al. Ijppr.Human, 2015; Vol. 3 (4): 95-117.
106
and Principal Component Regression (PCR) were applied to generate the model having good q2
and pred_r2 values, one of which was selected having good internal and external predictivity.
Selection of training and test set was by Manual data selection and random data selection
method. Training and test set were selected if they follow the unicolumn statistics, i.e. maximum
of the test is less than maximum of training set and minimum of the test set is greater than of
training set, which is prerequisite for further QSAR analysis. This result shows that the test is
interpolative i.e., derived from the min-max range of training set. The mean and standard
deviation of the training and test set provides insight to the relative difference of mean and point
density distribution of the two sets The QSAR models developed by kNN-MFA include both the
electrostatic, steric descriptors along with their range to indicate their importance for interaction
in molecular field. Models 20 and 36 are with 3D QSAR studies. QSAR investigations of the
substituted 5-N-phenylsulfamoyl-2-(2-(nitrooxy) (acetoxy)benzoic acid derivatives series
resulted in several QSAR equations. Some statistically significant 2D and 3D QSAR models
were chosen for discussion.
3.1 2D-QSAR model:
Model 21:
By Random data selection method;
IC50=--0.1362(SaascCount) + 0.0950 (SdssCcount) – 0.0556 (SsCH3Count) – 0.0432 (T-C-S-6)
+ 1.6935
n = 13, Degree of freedom = 8, r2 = 0.9236, q
2 = 0.8360, F test = 24.1907, r
2 se = 0.0290, q
2 se =
0.0424, pred_r2 = 0.3738, pred_r
2 se = 0.1083
Among all the significant models the above is the best model generated for anti-inflammatory.
The equation explains 92.36% (r2
= 0.9236) of the total variance in the training set and has an
internal (q2) and external (pred_r
2) predictive ability of ~83.60% and ~37.38% respectively. The
F-test = 24.1907 which is far greater than the F-tabulated value = 3.2850 (http://url.ie/fjj2). This
shows the statistical significance of 99.99% of the model, which means that the probability of
failure of the model is 1 in 10,000. All the standard error values are very low (less than 1) hence
this model is highly acceptable.

www.ijppr.humanjournals.com
Citation: Dr. Anwar Rafique Shaikh et al. Ijppr.Human, 2015; Vol. 3 (4): 95-117.
107
In this QSAR model, the negative coefficient of SaascCount (it is descriptor defines the total
number of CH group connected with three single bond) on the biological activity indicates that
lower the value leads to the better activity, while higher the value indicates less biological
activity. The negative coefficient of SdssCcount (This descriptor defines the total number of
carbon connected with one double and two single bond.) on the biological activity indicates that
higher the value leads to the better activity, while lower the value indicates less biological
activity. The negative coefficient of SsCH3Count (It is descriptors defines the total number of
CH3 group connected with single bond. The negative coefficient of T-C-S-6 (It is the count of
carbon atoms separated from sulphur atom by 6 bonds.
Figure 3a: Contribution plot of 2D-QSAR Model 21
Figure 3b: Fitness plot showing actual activity versus predicted activity of Model 21
www.ijppr.humanjournals.com
Citation: Dr. Anwar Rafique Shaikh et al. Ijppr.Human, 2015; Vol. 3 (4): 95-117.
108
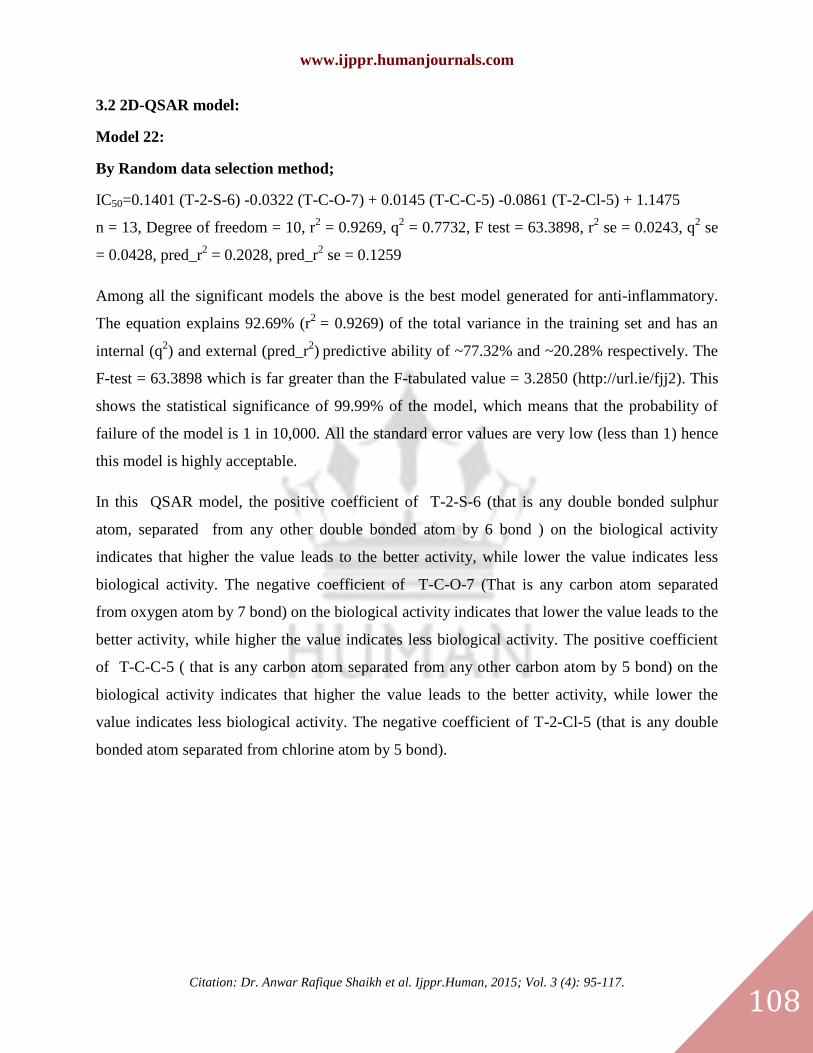
3.2 2D-QSAR model:
Model 22:
By Random data selection method;
IC50=0.1401 (T-2-S-6) -0.0322 (T-C-O-7) + 0.0145 (T-C-C-5) -0.0861 (T-2-Cl-5) + 1.1475
n = 13, Degree of freedom = 10, r2 = 0.9269, q
2 = 0.7732, F test = 63.3898, r
2 se = 0.0243, q
2 se
= 0.0428, pred_r2 = 0.2028, pred_r
2 se = 0.1259
Among all the significant models the above is the best model generated for anti-inflammatory.
The equation explains 92.69% (r2
= 0.9269) of the total variance in the training set and has an
internal (q2) and external (pred_r
2) predictive ability of ~77.32% and ~20.28% respectively. The
F-test = 63.3898 which is far greater than the F-tabulated value = 3.2850 (http://url.ie/fjj2). This
shows the statistical significance of 99.99% of the model, which means that the probability of
failure of the model is 1 in 10,000. All the standard error values are very low (less than 1) hence
this model is highly acceptable.
In this QSAR model, the positive coefficient of T-2-S-6 (that is any double bonded sulphur
atom, separated from any other double bonded atom by 6 bond ) on the biological activity
indicates that higher the value leads to the better activity, while lower the value indicates less
biological activity. The negative coefficient of T-C-O-7 (That is any carbon atom separated
from oxygen atom by 7 bond) on the biological activity indicates that lower the value leads to the
better activity, while higher the value indicates less biological activity. The positive coefficient
of T-C-C-5 ( that is any carbon atom separated from any other carbon atom by 5 bond) on the
biological activity indicates that higher the value leads to the better activity, while lower the
value indicates less biological activity. The negative coefficient of T-2-Cl-5 (that is any double
bonded atom separated from chlorine atom by 5 bond).
www.ijppr.humanjournals.com
Citation: Dr. Anwar Rafique Shaikh et al. Ijppr.Human, 2015; Vol. 3 (4): 95-117.
109
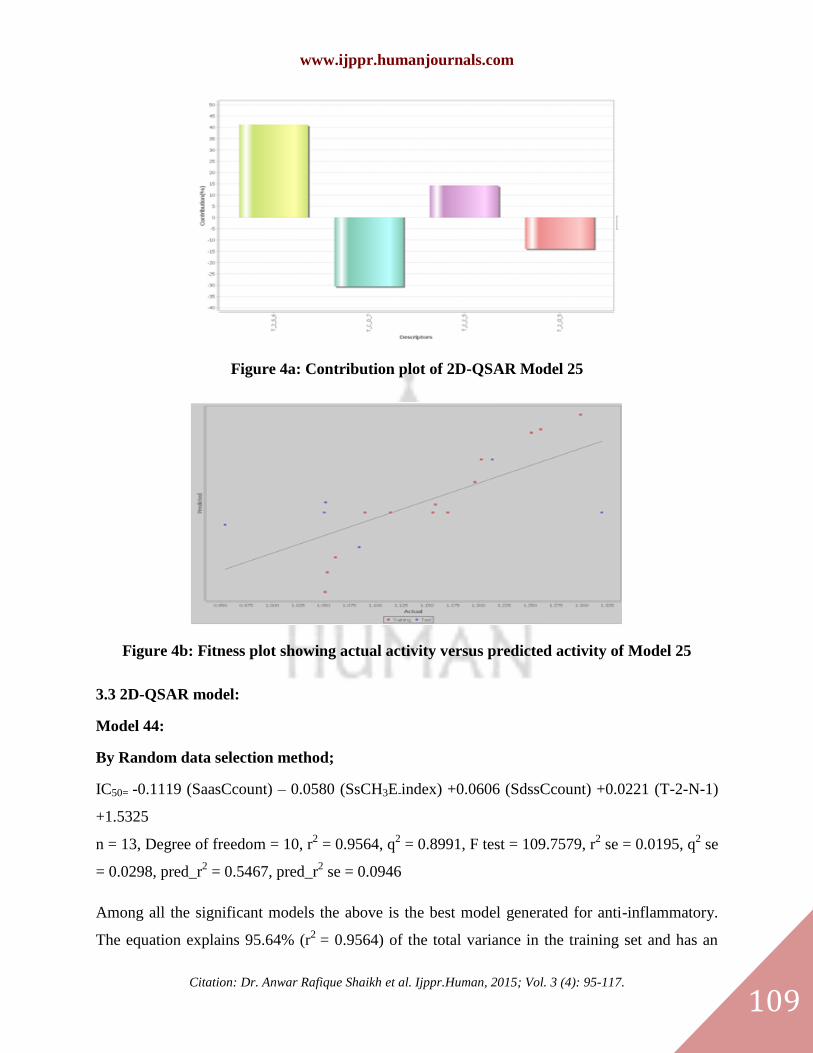
Figure 4a: Contribution plot of 2D-QSAR Model 25
Figure 4b: Fitness plot showing actual activity versus predicted activity of Model 25
3.3 2D-QSAR model:
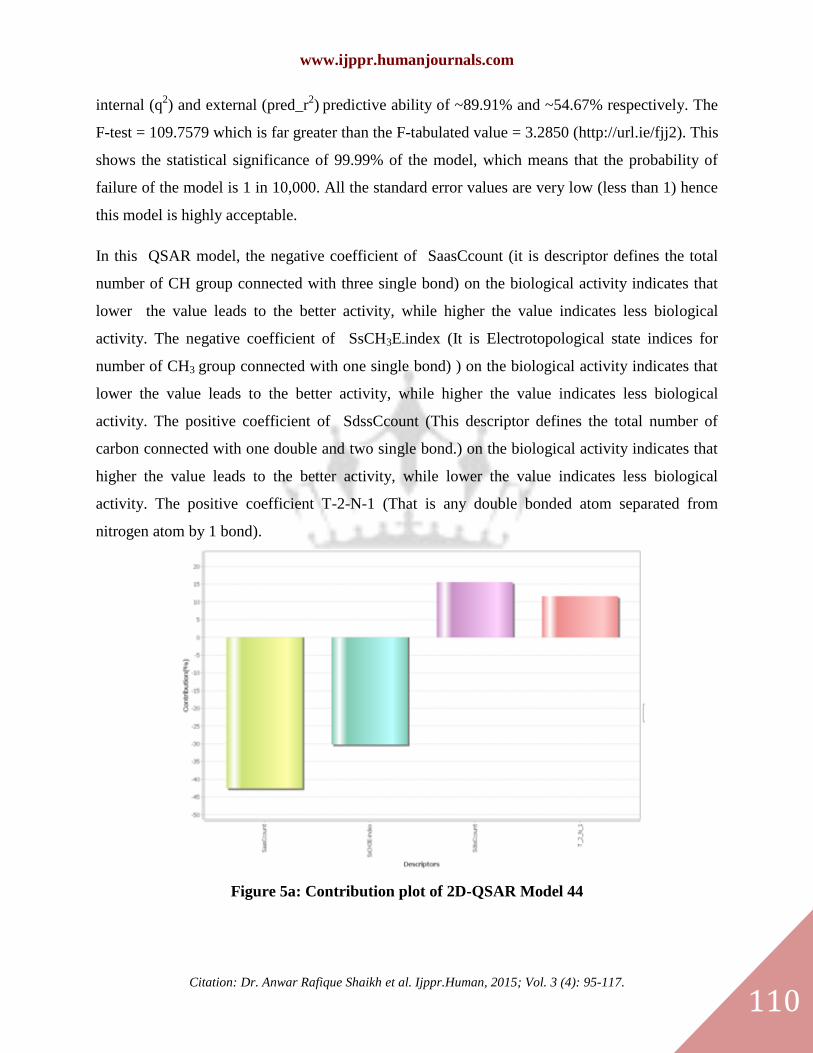
Model 44:
By Random data selection method;
IC50= -0.1119 (SaasCcount) – 0.0580 (SsCH3E-index) +0.0606 (SdssCcount) +0.0221 (T-2-N-1)
+1.5325
n = 13, Degree of freedom = 10, r2 = 0.9564, q
2 = 0.8991, F test = 109.7579, r
2 se = 0.0195, q
2 se
= 0.0298, pred_r2 = 0.5467, pred_r
2 se = 0.0946
Among all the significant models the above is the best model generated for anti-inflammatory.
The equation explains 95.64% (r2
= 0.9564) of the total variance in the training set and has an
www.ijppr.humanjournals.com
Citation: Dr. Anwar Rafique Shaikh et al. Ijppr.Human, 2015; Vol. 3 (4): 95-117.
110
internal (q2) and external (pred_r
2) predictive ability of ~89.91% and ~54.67% respectively. The
F-test = 109.7579 which is far greater than the F-tabulated value = 3.2850 (http://url.ie/fjj2). This
shows the statistical significance of 99.99% of the model, which means that the probability of
failure of the model is 1 in 10,000. All the standard error values are very low (less than 1) hence
this model is highly acceptable.
In this QSAR model, the negative coefficient of SaasCcount (it is descriptor defines the total
number of CH group connected with three single bond) on the biological activity indicates that
lower the value leads to the better activity, while higher the value indicates less biological
activity. The negative coefficient of SsCH3E-index (It is Electrotopological state indices for
number of CH3 group connected with one single bond) ) on the biological activity indicates that
lower the value leads to the better activity, while higher the value indicates less biological
activity. The positive coefficient of SdssCcount (This descriptor defines the total number of
carbon connected with one double and two single bond.) on the biological activity indicates that
higher the value leads to the better activity, while lower the value indicates less biological
activity. The positive coefficient T-2-N-1 (That is any double bonded atom separated from
nitrogen atom by 1 bond).
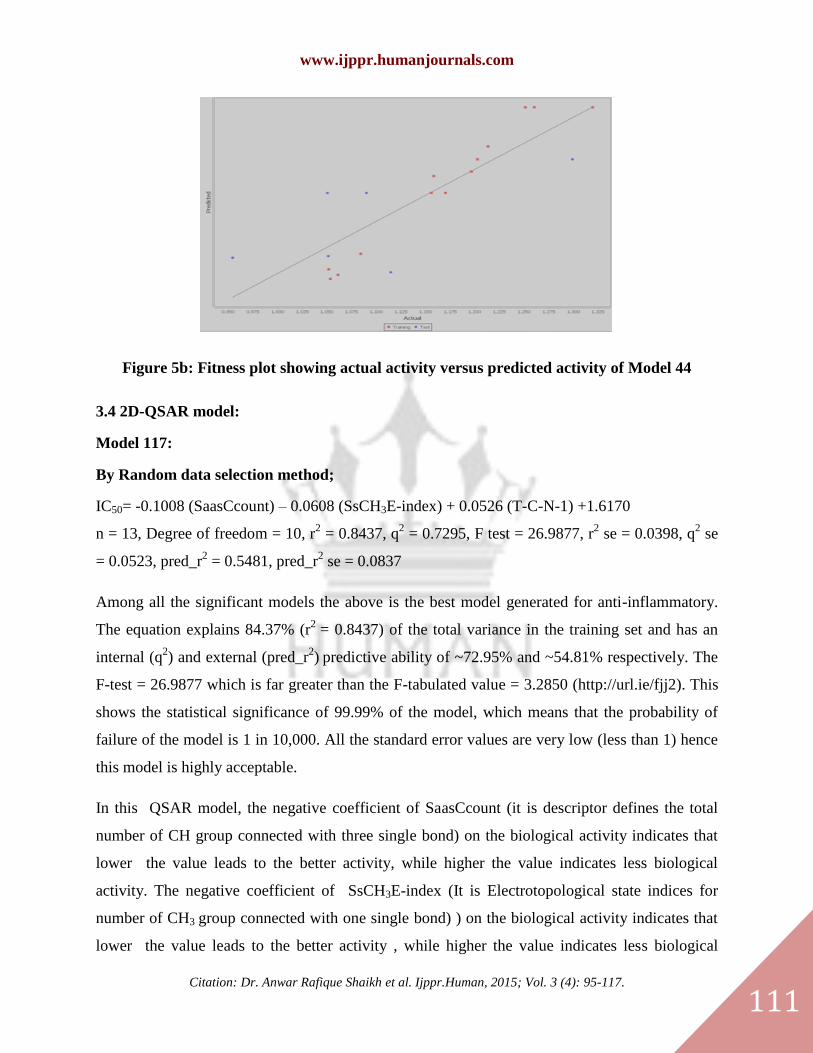
Figure 5a: Contribution plot of 2D-QSAR Model 44
www.ijppr.humanjournals.com
Citation: Dr. Anwar Rafique Shaikh et al. Ijppr.Human, 2015; Vol. 3 (4): 95-117.
111
Figure 5b: Fitness plot showing actual activity versus predicted activity of Model 44
3.4 2D-QSAR model:
Model 117:
By Random data selection method;
IC50= -0.1008 (SaasCcount) – 0.0608 (SsCH3E-index) + 0.0526 (T-C-N-1) +1.6170
n = 13, Degree of freedom = 10, r2 = 0.8437, q
2 = 0.7295, F test = 26.9877, r
2 se = 0.0398, q
2 se
= 0.0523, pred_r2 = 0.5481, pred_r
2 se = 0.0837
Among all the significant models the above is the best model generated for anti-inflammatory.
The equation explains 84.37% (r2
= 0.8437) of the total variance in the training set and has an
internal (q2) and external (pred_r
2) predictive ability of ~72.95% and ~54.81% respectively. The
F-test = 26.9877 which is far greater than the F-tabulated value = 3.2850 (http://url.ie/fjj2). This
shows the statistical significance of 99.99% of the model, which means that the probability of
failure of the model is 1 in 10,000. All the standard error values are very low (less than 1) hence
this model is highly acceptable.
In this QSAR model, the negative coefficient of SaasCcount (it is descriptor defines the total
number of CH group connected with three single bond) on the biological activity indicates that
lower the value leads to the better activity, while higher the value indicates less biological
activity. The negative coefficient of SsCH3E-index (It is Electrotopological state indices for
number of CH3 group connected with one single bond) ) on the biological activity indicates that
lower the value leads to the better activity , while higher the value indicates less biological
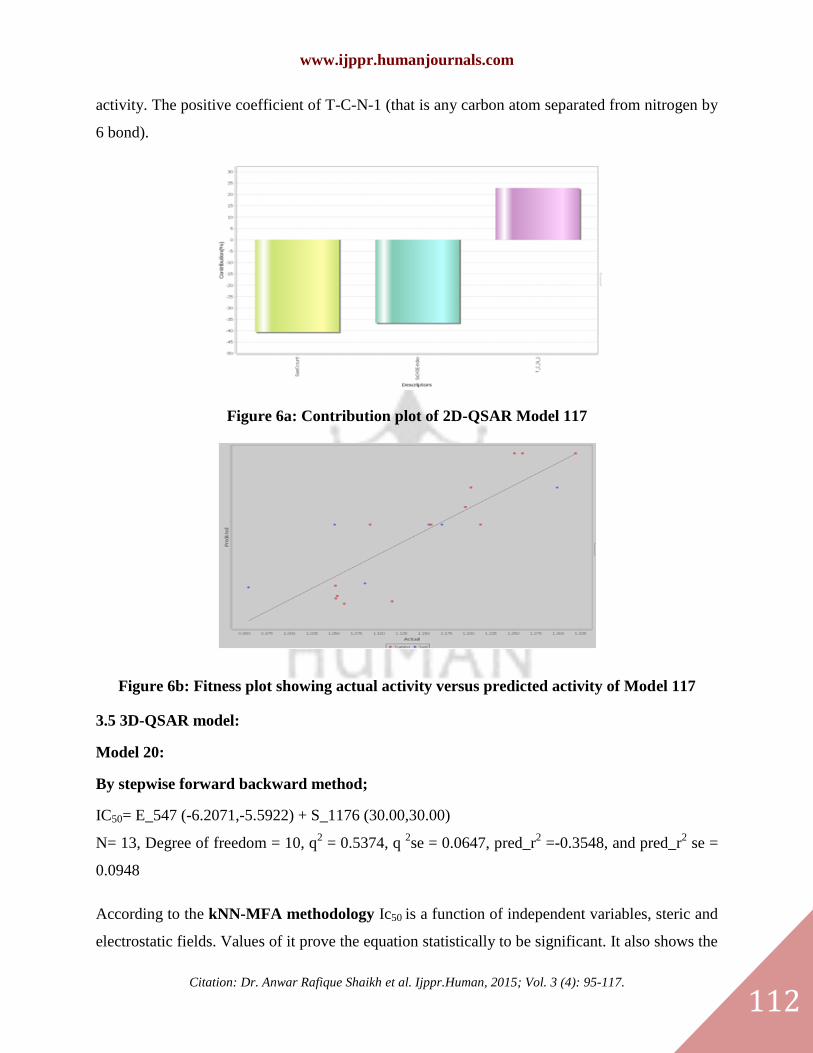
www.ijppr.humanjournals.com
Citation: Dr. Anwar Rafique Shaikh et al. Ijppr.Human, 2015; Vol. 3 (4): 95-117.
112
activity. The positive coefficient of T-C-N-1 (that is any carbon atom separated from nitrogen by
6 bond).
Figure 6a: Contribution plot of 2D-QSAR Model 117
Figure 6b: Fitness plot showing actual activity versus predicted activity of Model 117
3.5 3D-QSAR model:
Model 20:
By stepwise forward backward method;
IC50= E_547 (-6.2071,-5.5922) + S_1176 (30.00,30.00)
N= 13, Degree of freedom = 10, q2 = 0.5374, q
2se = 0.0647, pred_r
2 =-0.3548, and pred_r
2 se =
0.0948
According to the kNN-MFA methodology Ic50 is a function of independent variables, steric and
electrostatic fields. Values of it prove the equation statistically to be significant. It also shows the

www.ijppr.humanjournals.com
Citation: Dr. Anwar Rafique Shaikh et al. Ijppr.Human, 2015; Vol. 3 (4): 95-117.
113
predictive power of the model as 53.74%. It showed steric and electrostatic field energy of
interactions between probe (CH) and compounds at their corresponding spatial grid points of
547, 1176. Numbers nearest neighbor’s k of 2 were observed with this model i.e. two values are
proved statistically significant. It is observed from the Figure 6 that the negative coefficient of
E_547 suggested that electronegative substituent may be favourable on the position of salicylic
acid ring for better activity. Even the steric factor S_1176 is positive which indicates the
favourability of bulky groups on the salicylic acid ring to increase the activity.
Figure 7a: Contribution plot of 3D-QSAR Model 20
Figure 7b: Fitness plot showing actual activity versus predicted activity of Model 20
Model 36:
By stepwise forward backward method;
IC50= E_937 (-2.4827,-0.4193) + S_469 (0.0643,0.1358)

www.ijppr.humanjournals.com
Citation: Dr. Anwar Rafique Shaikh et al. Ijppr.Human, 2015; Vol. 3 (4): 95-117.
114
N= 13, Degree of freedom = 10, q2 = 0.6970, q
2se = 0.0442, pred_r
2 =-0.3548, and pred_r
2 se =
0.0948
According to the kNN-MFA methodology Ic50 is a function of independent variables, steric and
electrostatic fields. Values of it prove the equation statistically to be significant. It also shows the
predictive power of the model as 53.74%. It showed steric and electrostatic field energy of
interactions between probe (CH) and compounds at their corresponding spatial grid points of
937, 469. Numbers nearest neighbor’s k of 3 were observed with this model i.e. two values are
proved statistically significant. It is observed from the Figure 6 that the negative coefficient of
E_937 suggested that electronegative substituent may be favourable on the position of salicylic
acid ring for better activity. Even the steric factor S_469 is positive which indicates the
favourability of bulky groups on the salicylic acid ring to increase the activity.
Figure 8a: Contribution plot of 3D-QSAR Model 36
Figure 8b: Fitness plot showing actual activity versus predicted activity of Model 36

www.ijppr.humanjournals.com
Citation: Dr. Anwar Rafique Shaikh et al. Ijppr.Human, 2015; Vol. 3 (4): 95-117.
115
4. CONCLUSIONS
In the present investigation, all proposed QSAR models were statistically significant, thus, from
above QSAR investigations it could be concluded that 2D/3D descriptors properties of
substituted 5-phenylsulfamoyl-2-(2-(nitrooxy) (acetoxy)benzoic acid derivatives are mainly
involved in treatment of drug abuse disorders. The good correlation between experimental and
predicted biological activity for compounds in the test set further highlights the reliability of the
constructed QSAR model. The requirements for the more potent biological activity are explored
with 2D, 3D and group based QSAR studies. The 2D technique indicates the importance of
XlogP, SssCH3-Eindex, SssCH3-count, and SlogP of the compounds on the activity. The 3D
QSAR analysis makes it possible to relate chemical structures of ligands and their binding
affinity with respect to different bio targets by using the kNN-MFA techniques. Thus it provides
a direct view of factors expressed in terms of molecular fields (electrostatic, steric) affecting the
binding affinity. This in turn could give the reasonably good prediction of binding affinity. The
location and range of function values at the field points selected by the models provide clues for
the design of new molecules. Hence, this method is expected to provide a good alternative for the
drug design.
The 3D-QSAR model showed that electrostatic effects dominantly determine the binding
affinities and these QSAR models developed in this study would be useful for the development
of new drugs as a medicament for the drug abuse disorder. The 2D-QSAR studies revealed that
alignment independent descriptors were the major contributing descriptors. The descriptor values
obtained in this study helped in quantification of the structural features of 5-phenylsulfamoyl-2-
(2-(nitrooxy) (acetoxy)benzoic acid derivative.
After successful QSAR studies, attempts were made to predict the activities of the newly
designed analogues of these reported compounds. We have designed 32 compounds among
which 11 compounds are showing higher activity than the reported analogues. In future, we can
synthesize these compounds using the selected scheme and confirm their activity by carrying out
in vivo evaluation.

www.ijppr.humanjournals.com
Citation: Dr. Anwar Rafique Shaikh et al. Ijppr.Human, 2015; Vol. 3 (4): 95-117.
116
Table 4: Newly designed salicylic acid derivative with their predicted biological activity
These compounds have more biological activity than the reported.
5. ACKNOWLEDGMENT
The author wishes to express gratitude to V-life Science Technologies Pvt. Ltd. for providing the
software for the study. Also the authors are thankful to the Trustee, Bhujbal Knowledge City for
providing the necessary facilities to carry out the research work.
6. REFERENCES
1. A.H. Abadi, et al. (2005), Synthesis of novel 4-substituted-7-trifluoromethylquinoline derivatives with nitric
oxide releasing properties and their evaluation as analgesic and anti-inflammatory agents, Bioorganic &
Medicinal Chemistry , 13, pp. 5759–5765.
2. U. K. Bandarage, et al. (2000) Nitrosothiol esters of diclofenac synthesis and pharmacological characterization
as gastrointestinal-sparing prodrugs, Journal of Medicinal Chemistry, 43, pp. 4005-16.
3. S. V. Bhandari, et al. (2009) Design, synthesis and pharmacological screening of novel nitric oxide donors
containing 1,5-diarylpyrazolin-3-one as nontoxic NSAIDs, European Journal of Medicinal Chemistry, 44,
pp.4622–4636
4. A. Carlos, et al. (2005) Novel Nonsteroidal Antiinflammatory Drugs Possessing a Nitric Oxide Donor Diazen-
1-ium-1,2-diolate Moiety: Design, Synthesis, Biological Evaluation, and Nitric Oxide Release Studies, Journal
of Medicinal Chemistry, 48, pp. 4061-77
5. A. V. Carlos, et al. (2005), Synthesis and biological evaluation of 3,4-diphenyl- 1,2,5-oxadiazole-2-oxides and
3,4-diphenyl-1,2,5-oxadiazoles as potential hybrid COX-2 inhibitor/nitric oxide donor agents, Bioorganic &
Medicinal Chemistry, 13, pp. 2749–2757

www.ijppr.humanjournals.com
Citation: Dr. Anwar Rafique Shaikh et al. Ijppr.Human, 2015; Vol. 3 (4): 95-117.
117
6. A.V. Carlos, et al. (2007) O2-Acetoxymethyl-protected diazeniumdiolate-based NSAID’s (NONO-NSAIDs):
Synthesis, nitric oxide release, and biological evaluation studies, Bioorganic and Medicinal. Chemistry letters,
15, pp. 4767- 74.
7. C. Cena, et al. (2003) Antiinflammatory, Gastrosparing, and Antiplatelet Properties of New NO-Donor Esters of
Aspirin, Journal of Medicinal Chemistry, 46, pp. 747- 54.
8. M. A. Chowdhury, et al. (2010), Celecoxib analogs possessing a N-(4-nitrooxybutyl) piperidin-4-yl or N-(4-
nitrooxybutyl)-1,2,3,6-tetrahydropyridin-4-yl nitric oxide donor moiety: Synthesis, biological evaluation and
nitric oxide release studies, Bioorganic & Medicinal Chemistry Letters , 20, pp.1324–1329
9. M. A. Chowdhury,. et al. (2008), Synthesis of new 4-[2-(4-methyl (amino) sulfonylphenyl)-5-trifluoromethyl-
2H-pyrazol-3-yl]-1,2,3,6-tetrahydropyridines: A search for novel nitric oxide donor anti-inflammatory agents,
Bioorganic & Medicinal Chemistry, 16, pp.8882–8888
10. B. C. Daniel, et al. (2008), Non-steroidal Anti-inflammatory Agents – Benefits and New Developments for
Cancer Pain , Supportive Oncology, pp. 18-22.
11. J.E Downing, et a.l (2005) Gastric and thymic assay of acute oral treatment of rats with nitric oxide esters of
ibuprofen or indomethacin, Biochem. Biophys. Res. Commun.
12. O. O. Fadeyi, et al (2004) Antipyretic, analgesic, anti-inflammatory and cytotoxic effects of four derivatives of
salicylic acid and anthranilic acid in mice and rats, African Journal of Biotechnology, 3(8), pp. 426-431
13. S. Fiorucci, J. L. Wallace, R. N. Dubois, et al.(2000) New anti-inflammatory agents: NO-NSAIDS and COX-2
inhibitors. International conference on “Advances In Prostaglandin and Leukotriene Research: Basic Science
and New Clinical Applications”, June (4-8), pp. 2.
14. S. Fioruccia, et al. (2007), NSAIDs, coxibs, CINOD and H2S-releasing NSAIDs:What lies beyond the horizon,
Digestive and Liver Disease, 39, pp. 1043–1051.
15. S. Fioruccia, et al.(2004) Cooperation between aspirin –triggered Lipoxin and Nitric oxide mediates adhesive
properties of 2-(Acetyloxy) benzoic acid 3-(nitrooxymethyl) phenyl ester (NCX-4016) Nitric oxide aspirin on
neutrophile endothelial cell dherence, The Journal of Pharmacology and Experimental Therapeutics, 306,
pp.1174-1182
16. W. (Foye, 2009,) Principles of Medicinal Chemistry. New Delhi: B. J. Waverly Pvt. Ltd., 4, pp.-
17. J.F. Gilmer, et al. (2001) Synthesis, hydrolysis kinetics and antiplatelet effects of isosorbide mononitrate
derivatives of aspirin, Euopean journal of Pharmaceutical Sciences, 14, pp. 221-7.
18. R. A. Khaled, et al. (2007) Novel (E)-2-(aryl)-3-(4-methanesulfonylphenyl)acrylic ester prodrugs possessing a
diazen-1-ium-1,2-diolate moiety: Design, synthesis, cyclooxygenase inhibition, and nitric oxide release studies,
Bioorganic & Medicinal Chemistry, 15, pp. 6796–6801
19. R. Kodela, et al. (2012), NOSH-Aspirin: A Novel Nitric Oxide−Hydrogen Sulfide -Releasing Hybrid: A New
Class of Anti-inflammatory Pharmaceuticals, ACS Medicinal Chemistry Letters, 3, pp. 257−262.
20. AJMANI, S., JADHAV, K., and KULKARNI, S. (2006), Three-dimensional QSAR using the k-nearest
neighbor method and its interpretation. Journal of chemical information and modeling, 46, pp. 24-31.
21. DEVILLERS, J. (1996), Neuronal network in QSAR and drug design. London: Academic Press.
22. DOUCET, J.P. et al. (2007), Nonlinear SVM approaches to QSPR/QSAR studies and drug design. Current
Computer Aided Drug Design, 3, pp. 263–289.
23. GUHA, R. (2005), Methods to Improve the Reliability, Validity and Interpretability of QSAR Models. PhD
thesis, The Pennsylvania State University.
24. HUDSON, B.D. et al. (1996), Parameter Based Methods for Compound Selection from Chemical Databases,
Quantitative Structure-Activity Relationships, 15 (4), pp. 285-289.
25. KUBINY, H. (1994), Variable Selection in QSAR Studies. I. An Evolutionary Algorithm. Quantitative
Structure-Activity Relationships, 13 (3), pp. 285-294.
26. CRAMER, R.D., III PATTERSON, D.E., BUNE, J.D. (1988) Comparative Molecular Field Analysis
(CoMFA), 1. Effect of shape on Binding of Steroids to Carrier.J.AM. Chem. Soc., 137(2), pp.5959-5967.
27. TROPSHA, A. and ZHENG, W. (2000) Novel Variable Selection quantitative structure property relationship
based on the k-nearest neighbor principle. Journal of chemical information and computer science, 40 (1). pp.-
185-194
28. TROPSHA .A. and ITSKOWTIZ, P. (2005) Beware of q2,. Journal of Molecular graphics and Modeling, 20
pp.269-276
29. KULKARNI, V.M. AND BOTHARA K.G., (2008), Drug Design, 3rd ed. Pune: Nirali prakashan.
30. MDS (Molecular Design Suite). VLife Sciences Technologies, Pvt. Ltd. Pune, India. Available from:
http://www.vlifesciences.com