predicting stall and post-stall behavior of airfoils at low mach numbers
TRANSCRIPT

AIAA JOURNALVol. 33, No. 4, April 1995
Predicting Stall and Post-Stall Behavior of Airfoilsat Low Mach Numbers
Tuncer Cebeci,* Hamid Hefazi,1^ and Farzam Roknaldin*California State University, Long Beach, California 90840
andLawrence W. Carr§
NASA Ames Research Center, Moffett Field, California 94035
An interactive boundary-layer method, together with the e"approach to the calculation of transition, is usedto predict the stall and post-stall behavior of airfoils in incompressible and compressible flows at low freestreamMach numbers. Two separate inviscid methods—a panel method with compressibility corrections and a full po-tential method—are used to compute the external velocity distribution needed in the solution of the compressibleboundary-layer equations. The turbulence model is based on the Cebeci-Smith algebraic eddy-viscosity formula-tion with improvements for strong pressure gradient effects. Comparison of calculated results with inviscid flowcomputed with a panel method indicate excellent agreement with experiment for a wide range of Reynolds numbersin incompressible flows. Comparison of calculated results obtained with inviscid flow computed with a full potentialmethod also indicate excellent agreement with experiment for a wide range of angles of attack, including stall forcompressible flows at low freestream Mach numbers. The study also shows that even though the compressibilitycorrections to the panel method are adequate at small-to-moderate angles of attack, they are not satisfactory athigher angles of attack, especially near stall.
I. Introduction
A PROBLEM of considerable interest in aerodynamics is thebehavior of airfoils or helicopter blades at conventional wind-
tunnel Reynolds numbers, which sometimes may be quite low. Eventhough in flight, Reynolds numbers are significantly higher thanthose in wind tunnels, and the behavior of the lifting bodies isnot plagued with problems associated with small-scale wind-tunnelmodels, it is important that the calculation methods accurately pre-dict the aerodynamic performance characteristics of the body so thatflight conditions can be accurately simulated.
At high Reynolds numbers the performance characteristics of air-foils or helicopter blades can be predicted by methods based eitheron the solution of the Navier-Stokes equations or on a combina-tion of inviscid and boundary-layer equations. In both approaches,the accuracy of the method depends on the numerical method, theturbulence model, and the method used to compute the location ofthe onset of transition. The differences between calculation meth-ods for flight and wind-tunnel Reynolds numbers are mainly inthe prediction of the transition location and in the modeling of thetransition region. When the Reynolds number is high, the onset oftransition occurs before or at the flow separation point, and the ex-tent of the transition region is confined to a relatively small region.When transition occurs before laminar separation, it can be com-puted by correlation formulas such as those suggested by Michel1and Granville2 or by the en method based on linear stability theory,as suggested by Smith3 and van Ingen.4 Several turbulence models,mostly developed for attached flows, can be used to model the tran-sition region,5 with models suggested by Dhawan and Narasimha6
and by Chen and Thy son7 being popular. Except at very high anglesof attack where the flow corresponds to stall or post-stall condi-tions, these methods and models are often satisfactory in predict-
Received Oct. 1, 1993; revision received May 5, 1994; accepted for pub-lication May 6, 1994. Copyright © 1994 by the American Institute of Aero-nautics and Astronautics, Inc. All rights reserved.
* Professor and Chair, Aerospace Engineering Department. Fellow AIAA.f Professor, Aerospace Engineering Department. Senior Member AIAA.* Graduate Student, Aerospace Engineering Department.§ Research Scientist and Group Leader, Unsteady Viscous Flows,
Aeroflightdynamics Directorate, U.S. Army ATCOM, and Fluid Mechan-ics Laboratory Branch.
ing airfoil flows, as discussed in Refs. 8 and 9. With decreasingReynolds number (around chord Reynolds numbers of 5 x 10⁵
to 1 x 10⁵, however, rather large separation bubbles begin to ap-pear on the airfoil; the onset of transition occurs inside the bub-ble and is separation induced. The importance of the turbulencemodel for the transition region increases and plays a larger role inthe computational method. As a result the methods used to predictairfoil or blade characteristics at low Reynolds numbers must bemodified to account for these phenomena that are either absent ornot important at moderate wind-tunnel and high-Reynolds-numberflows.10-13
Another important factor that must be considered in a calculationmethod is the role of the compressibility on stall angle at relativelylow freestream Mach numbers. Although the Reynolds number onthe airfoil may be small on a model at Mach numbers such as 0.15,with increasing Mach number, perhaps up to 0.5, the Reynolds num-ber can vary by threefold. The behavior of the flow, the change of thelength of the separation bubble, and the movement of the transitionlocation within the separation bubble must be predicted accuratelyto calculate the stall angle at each Mach number.
This paper presents an efficient and accurate method for calcu-lating the stall and post-stall behavior of airfoils at low and highReynolds numbers. The method is based on the solution of in-viscid and boundary-layer equations with the onset of transitioncomputed with the en method based on linear stability theory. Themethod is developed for incompressible and compressible flows atlow freestream Mach numbers. For incompressible flows, the invis-cid method is calculated with a panel method.14 For compressibleflows, the inviscid flow is calculated 1) by introducing compressibil-ity corrections to the panel method and 2) by using a full potentialmethod.15
The following section describes the calculation method and isfollowed by Sec. Ill, which presents the results for several airfoilsin incompressible and compressible flows. The paper ends with asummary of the more important conclusions.
II. Calculation MethodA. Interactive Boundary-Layer Method
With inviscid flow solutions given either by a panel method or afull-potential method, the viscous flow solutions are obtained fromthe compressible boundary-layer equations in which the turbulence
595
Dow
nloa
ded
by N
AN
YA
NG
TE
CH
NIC
AL
UN
IVE
RSI
TY
on
June
5, 2
014
| http
://ar
c.ai
aa.o
rg |
DO
I: 1
0.25
14/3
.123
91

596 CEBECIET AL.: STALL AND POST-STALL OF AIRFOILS
model is given by the algebraic eddy viscosity em and turbulentPrandtl number Prt formulation of Cebeci and Smith5:
— - ( p u ) + — ( p u ) = 0dx dy
du _3u due 3 !~pu— + PV-- = PeUe-r- + — (Mdx dy dx dy [
(1)
)? I (2)
3H _3H 3 \( sm \3T 3ul—— + pv—- = — \ ( k + cpp —- 1 — + u(n + pem) —3x 3y dy\_\ P?t J dy dy ]
(3)
where ~pv = pv+p'v'.ln the absence of mass transfer, the boundaryconditions for an adiabatic surface are
oo,
dH
H ̂ He
(4a)
(4b)
and in the wake, where a dividing line at y = 0 is required to separatethe upper and lower parts of the inviscid flow, and in the absence ofthe normal pressure gradient, they are
±00, u —> ue(x), Hy = 0, U = 0
He\(5)
To perform the calculations for flows with separation, an inverseprocedure is used, and the external velocity is computed as part ofthe solution. According to the formulation discussed in Ref. 8, theedge boundary condition is written as
ue(x) = u°e(x) + 8ue(x)
where 8ue(x) is computed from the Hilbert integral
daI fxb dSue(x) = - I —
" JXa dcr ')-
(6a)
(6b)
B. l\irbulence ModelThe turbulence model used to represent the flow on the air-
foil is expressed in terms of the Cebeci and Smith eddy-viscosityformulation,5
Xtr,
(ue - u ) d y XtrX,
0 < y < yc (7a)
yc < y < ^ (7b)
The condition used to define yc is the continuity of the eddyviscosity, and so Eq. (7a) is applied from the wall outward (innerregion) until its value is equal to that given for the outer region byEq. (7b). The parameters A and y are defined by
W r ~ wmax' 7 =1 (8a)
5.5(;y/5)6
and a, as discussed in Ref. 16,
a- = 0.0168 (8b)
where ft [with Rt denoting the ratio of wall shear stress to maximumReynolds stress, Tw/(—pu'vr)m9] is given by
1+2*, (2-*,)
Rt
Rt < 1.0
Rt > 1.0(9)
For rw < 0, Rt is set equal to zero.The expression ytr represents the transition region and is given
by
= 1 - e x p - G O c - j C t r ) I — (10a)
Here jctr is the location of the beginning of transition, and G isdefined by
G = Ajf^C34 (10b)e
where C is 60 for attached flows, and the transition Reynolds numberRXti = (Uex/Ve)tr.
The corresponding eddy-viscosity expressions in the wake are
[(sm),.e - (£„,)„,] exp 205 (11)where (sm)t.e. is the eddy viscosity at the trailing edge computedfrom Eqs. (7), and (em)w is the eddy viscosity in the far wake givenby the larger of
(fi = 0.064
and
/•ymin
/ (We - MJ —oo
[(emyw = 0.064 / (ue - u) dy
(12a)
(12b)
The calculation of airfoils at chord Reynolds numbers less than106 requires changes to the turbulence model given by Eqs. (7).According to the ytr model used in the Cebeci-Smith (CS) modeland given by Eqs. (lOa) and (lOb), the extent of the transition regionRAx is related to the transition Reynolds number RXtI by
r> /~< r>2/3 / i o\^A* — ̂ KXti \U)
which shows that R&x increases with decreasing RXti. This expres-sion was obtained from data based on attached flows and is notapplicable to flows with separation. Experiments show that the ex-tent of the separation bubble and the location of the onset of transi-tion depend upon the Reynolds number. At high Reynolds numbers,transition usually corresponds to the location of separation, and thelength of the bubble is relatively short. At low Reynolds numbers,transition can occur inside the bubble and can strongly influencethe nature of flow. To take account of the corresponding effects, acorrelation formula was developed in Ref. 13; the parameter C inEq. (lOb) was expressed in terms of RXtz by
C2 = 213 (log /extr - 4.7323) (14)
in the Reynolds number range from Rc — 2.4 x 10⁵ to 2 x 10⁶.
C. Transition MethodThe onset of transition is calculated from the en method, which is
based on the linear stability theory. Since the study conducted hereis for low Mach numbers, the compressibility effect on transitionwas neglected, and the incompressible form of the Orr-Sommerfeldequation
ct)iv-2a2(t)ff + a44>-iR(au-co)((l)f'-a2(t>) + iRauff(l> = Q (15)
was solved for given velocity profiles u and u" and for a set of spec-ified dimensional frequencies &>* at XQ to obtain the amplification
Dow
nloa
ded
by N
AN
YA
NG
TE
CH
NIC
AL
UN
IVE
RSI
TY
on
June
5, 2
014
| http
://ar
c.ai
aa.o
rg |
DO
I: 1
0.25
14/3
.123
91

CEBECIET AL.: STALL AND POST-STALL OF AIRFOILS 597
rates so that for each frequency the value of n can be obtained fromthe integral
.-/•„.JXQ
(16)
Transition is obtained from the resulting curves corresponding tothe maximum amplification factor by assuming n to be 9.
D. Compressibility Corrections to the Panel MethodThe compressibility corrections used in the panel method depend
upon the linearized form of the compressible velocity potential equa-tion and are based on the assumption of small perturbations and thinairfoils. A simple correction formula used here is the Karman-Tsienformula that uses the tangent gas approximation to simplify thecompressible potential-flow equations. According to this formula,the effect of Mach number on the pressure coefficient is estimatedfrom
(17)
and the corresponding velocities are computed from
V (1(18a)
where CP|. denotes the incompressible pressure coefficient and
**•*• rv-i ^ /^ i ,1A,= (18b)
E. Solution ProcedureA brief description of the solution procedure used in this method
is as follows. The panel or the full-potential method provides anexternal velocity distribution and identifies the stagnation point. Theinteractive boundary-layer method leads to solutions on the upperand lower surfaces from the stagnation point through the regions oflaminar, transitional, and turbulent flow to the trailing edge. With theupper and lower surface velocity profiles computed at the trailingedge, the calculations are extended into the wake. As a consequenceof the aforementioned, a blowing velocity defined by
Vn = —— (M*)dx(19)
is available on the airfoil and in the wake and is used to obtain a newdistribution of external velocity uei (x) from the inviscid method. Asbefore, the boundary-layer solutions on the upper and lower surfacesof the airfoil and in the wake are obtained with the Hilbert integral.This sequence of calculations is repeated for the whole flowfielduntil convergence is achieved.
In all cases except at high angles of attack, the onset of transitionis obtained with the en method. At higher angles of attack, the onsetof transition location was assumed to occur at the pressure peak andwas not computed.
III. Results and DiscussionThe results are presented in two sections. In Sec. III. A the inviscid
flow was computed by using the panel method, and the results arepresented for several airfoils in incompressible flows to show theaccuracy of the method for predicting the stall and post-stall behav-ior of airfoils at low and high Reynolds numbers. Since extensiveregions of separation bubbles can occur on airfoils at low Reynoldsnumbers, studies are also conducted to investigate the extent of theseparation bubble and the location of onset of transition on the air-foils, as well as the reduction of stall angle due to Reynolds numbereffects. In Sec. III.B results are presented for several airfoils mea-sured in Ref. 17 to investigate the compressibility effect on stallangle. For this purpose the inviscid flow was computed by usingeither the panel method with compressibility corrections or withthe full-potential method. The studies were conducted at moderateReynolds numbers.
2.0
1.5
CL
1.0
0.5
o.o0.0 5.0 10.0 15.0
ALPHA20.0 25.0
a)
1.5
CL
1.0
0.5
0.00.0 5.0 10.0 15.0
ALPHA20.0 25.0
b)
Fig. 1 Effect of Reynolds number on the lift coefficient of a NAC A 0012airfoil: a) Rc = 3 X 10⁶ and b) RC = 6 x 10⁶.
A. Incompressible FlowsThe calculations were first performed for three airfoils, the NAC A
0012, NACA 23012, and Sikorsky SSC-A09, at high Reynolds num-bers where the transition region is negligible (see Ref. 18). At low-to-moderate angles of attack, the onset of transition is calculatedby using the en method. At higher angles of attack, the onset oftransition was assumed to correspond to laminar separation, whichoccurs very close to the pressure peak. The results, however, are pre-sented here for the NACA 0012 airfoil only. For additional results,see Ref. 18.
Figure 1 shows a comparison between calculated and measuredlift coefficients for the NACA 0012 airfoil at chord Reynolds num-bers corresponding to 3 x 10⁶ and 6 x 10⁶. As can be seen, in accordwith the measurements, the calculation method is able to computeCt for all angles of attack and satisfactorily account for the Reynoldsnumber effect.
It is useful to examine the extent of flow separation on the airfoiland the variation of the displacement thickness on the airfoil and inthe wake at high angles of attack. Figures 2 and 3 show the variationof local skin coefficient and displacement thickness distribution onthe NACA 0012 airfoil at Rc = 3 x 10⁶. As can be seen from Fig. 2,flow separation occurs for a > 10 deg, and its extent increases withincreasing angle of attack. At an incidence angle of attack a = 18deg, the flow separation on the airfoil is 60% of the chord length.
The variations of dimensionless displacement thickness 8*/calong the airfoil and wake of the airfoil shown in Fig. 3 indicatethat, as expected, displacement thickness increases along the airfoil,becoming maximum at the trailing edge, and decreases in the wake.Its magnitude increases with increase in angle of attack. For a = 10deg, 8*/c at the trailing edge is around 2% of the chord, becoming
Dow
nloa
ded
by N
AN
YA
NG
TE
CH
NIC
AL
UN
IVE
RSI
TY
on
June
5, 2
014
| http
://ar
c.ai
aa.o
rg |
DO
I: 1
0.25
14/3
.123
91

598 CEBECIET AL.: STALL AND POST-STALL OF AIRFOILS
Table 1 Laminar separation (LS), transition (x/c)tr,and turbulent reattachment (TR) locations on the
Eppler airfoil, Rc = 3 X 10s
2.0
Experiment Calculated
LS TR LS TR
0.480.40
0.690.58
0.6530.541
0.5150.42
0.720.60
0.0020
o.oooo
-0.0010
Fig. 2 Variation of local skin-friction coefficient on the NACA 0012airfoil for Rc = 3 x 10⁶.
0.16
0.12
0.08
0.04
0.00
Fig. 3 Variation of dimensionless displacement thickness distribution6*/c on the NACA 0012 airfoil and its wake for Rc = 3 X 10⁶.
4% at ex = 14 deg and 7% at a = 16 deg, which is the stall angle forthis airfoil at this Reynolds number. With increase in angle of attack,the trailing-edge displacement thickness increases significantly, be-coming 12% of the chord at or = 17 deg and 16% at a = 18 deg.However, what is quite interesting, aside from this rather sharp in-crease in displacement thickness, is the behavior of the maximumvalue of the displacement thickness: whereas for angles of attackup to and including stall angle, a = 16 deg, its maximum is at thetrailing edge, at higher angles of attack corresponding to post stall,its maximum value is after the trailing edge.
Figure 4 shows the variation of the lift coefficient of the NACA0012 airfoil for a chord Reynolds number of 2 x 10⁵ together withthe results obtained at Rc = 3 x 10⁶. As can be seen, the Reynoldsnumber has a significant effect, not only on the magnitude of themaximum lift coefficient, but also on the stall angle. With this changein Reynolds number, the (Q)max is reduced from a value of 1.5 to avalue slightly over 1. The corresponding reduction in angle of attackis from 16 to around 11 deg.
Table 1 and Figs. 5-7 show a sample of the results for an Epplerairfoil at a chord Reynolds number of 3 x 10⁵. These recent resultsalso reported in Ref. 19 were obtained with the present calculation
CL
0.5
o.o
Rc=3xlO
0.0 5.0 10.0 15.0ALPHA
25.0
Fig. 4 Variation of lift coefficient of the NACA 0012 airfoil at twoReynolds numbers.
1.0T
0.0 0.2 0.4 0.6 0.8 1.0
Fig. 5 Comparison of calculated (solid lines) and measured (symbols)pressure coefficient distributions for a) a = 0 deg and b) a = 4 deg atRc = 3 X 10⁵.
method for a wide range of angles of attack at Reynolds numberscorresponding to 2 x 10⁵ and 3 x 10⁵. The experimental data wereobtained by McGhee et al.20 in the Langley Low-Turbulence Pres-sure Tunnel (LTPT). The tests were conducted at Mach numbersfrom 0.03 to 0.13 and at chord Reynolds numbers from 6 x 10⁴ to4.6 x 105. Lift and pitching-moment data were obtained from airfoilsurface pressure measurements and drag data from wake surveys.Oil flow visualization was used to determine laminar separation andturbulent reattachment locations.
Table 1 shows the laminar separation (LS), onset of transition(;t/c)tr, and turbulent reattachment (TR) locations on the upper sur-face of the Eppler airfoil for angles of attack corresponding to a = 0and 4 deg. As can be seen, the onset of transition occurs inside theseparation bubble, and the airfoil has an extensive separation bubblethat decreases in size with increase in a.
Dow
nloa
ded
by N
AN
YA
NG
TE
CH
NIC
AL
UN
IVE
RSI
TY
on
June
5, 2
014
| http
://ar
c.ai
aa.o
rg |
DO
I: 1
0.25
14/3
.123
91

0.040 T,
cf0.030-
0.020-
0.010-
0.000-
-0.010- ————— , ——————— , ——————— , ——————— , ——— ,
v____ ^ _^s /̂
0.0 0.2 0.4 0.6 0.8 1.0X/C
CEBECIET AL.: STALL AND POST-STALL OF AIRFOILS
1.4T
599
a) a)
Cf0.015-
0.010-
0.005-
0.000-
-0.005- —————— , ——————— , ——————— , ——————— , ——— . . . . . . ,
V _ _ ^ —— _^^
0.0 0.2 0.4 0.6 0.8 1.0X/C
0.04 T
Cd
b)
Fig. 6 Variation of the calculated local skin-friction coefficient on theairfoil for a) a = 0 deg and b) a = 4 deg for Rc - 3 X 10s.
Figure 5 shows a comparison between the calculated and mea-sured pressure coefficient distributions for a = 0 and 4 deg, andFig. 6 shows the variation of the local skin-friction coefficient c/along at the airfoil. The comparison between calculations and ex-periment is excellent, and the calculation method accounts well forthe relatively large separation bubble at both angles of attack. Figure7 shows the same good agreement in lift and drag coefficients for arange of angles of attack.
B. Compressible Flows at Low Mach Numbers andat High Reynolds Numbers
The effect of compressibility on stall at low freestream Machnumbers and at high Reynolds numbers was investigated for fourairfoils; the experimental data were taken at NASA Ames by Carr etal.17 A comparison of calculated results with experimental data aregiven next for a sample of airfoils. For additional results, see Ref.18.
Before examining the results, it is useful to describe the procedureemployed for performing the wake calculations in the interactivescheme. The viscous wake calculations require a streamline issuingfrom the trailing edge of the airfoil. The computation of the locationof this streamline is relatively simple if conformal mapping meth-ods are used to determine the velocity field. In this case, the streamfunction ty is usually known, and because the airfoil surface is rep-resented by \/r(x, y) = const, the calculation of the wake streamlineamounts to tracing the curve after it leaves the airfoil. When the flow-field is computed by a panel method or by a full-potential method,however, the results are known only at discrete points in the field interms of the velocity components. In this case, the wake streamlinecan be determined from the numerical integration of
dydx (20)
aft of the trailing edge with known initial conditions. This is the pro-cedure we used for the panel method; for the full-potential method,the discrete points in the wake were arbitrarily used to representthe streamline needed in the viscous wake calculations. As shall be
0.03 - -
0.02-•
0.01--
0.00-2
b)
Fig. 7 Comparison of calculated (solid lines) and measured (symbols)a) lift and b) total drag coefficients for the Eppler airfoil at Rc= 3 x 10⁵.
shown later, this procedure is not a good one and needs to be im-proved, since the solutions near the trailing edge exhibits an irregularbehavior.
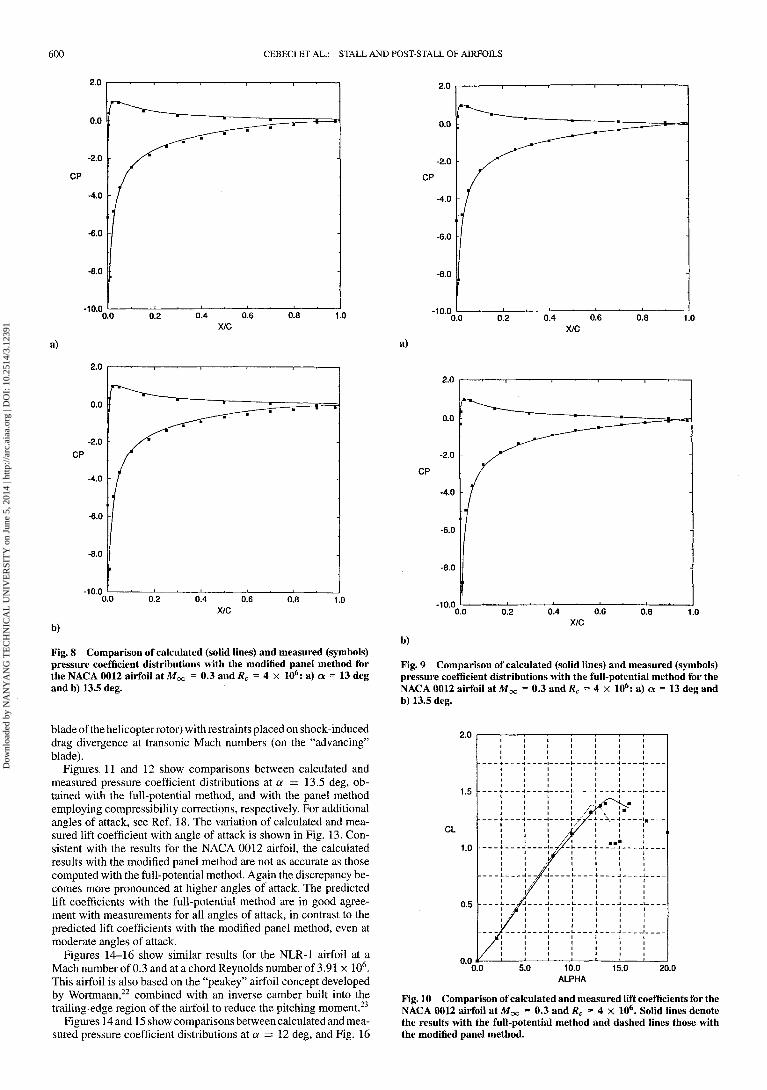
Figures 8-10 show the results for the NACA 0012 airfoil at a Machnumber of 0.3 and for a chord Reynolds number of 4 x 10⁶. Thisairfoil was the standard helicopter airfoil during the early periodof development of helicopters and has become a benchmark forcomparison of computation and experiment.
Figures 8 and 9 compare the calculated pressure coefficient distri-butions with measurements for two angles of attack correspondingto a = 13 and 13.5 deg. The results in Fig. 8 correspond to cal-culations employing the panel method with compressibility correc-tions, and Fig. 9 shows the results from employing the full-potentialmethod. As can be seen, the calculations (using the same boundary-layer method) produce results in which the full-potential resultsare in better agreement than those obtained with the panel methodwith compressibility corrections. Such a comparison is importantbecause it is generally believed that the compressibility correctionsare often satisfactory to account for the compressibility effects atlow Mach numbers.
Figure 10 shows a comparison between the calculated lift coef-ficients with experimental data. Again, the solutions employing thefull-potential method produce results that agree well with the mea-surements. Although to some extent the compressibility correctionsto the panel method improve the agreement with experimental data,panel method solutions are not as accurate as those predicted withthe full-potential method; the (Q)max is underpredicted by a signif-icant amount, and lift values are not even very accurate before stall.It is useful to note that for M^ — 0, the (Q)max for this airfoil isclose to 1.5 at Rc = 3 x 10⁶ and is close to 1.6 at Rc = 6 x 10⁶.According to Fig. 10, at a relatively low Mach number of 0.3, the(Q)max is reduced to around 1.4 at Rc = 4 x 10⁶.
Figures 11-13 show the results for the AMES 01 airfoil at a Machnumber of 0.3 and at a chord Reynolds number of 3.84 x 10⁶. Thisairfoil was designed for helicopter applications, using a numericaloptimization approach.21 This multipoint optimization combinedhigh lift at moderate subsonic Mach numbers (on the "retreating"
Dow
nloa
ded
by N
AN
YA
NG
TE
CH
NIC
AL
UN
IVE
RSI
TY
on
June
5, 2
014
| http
://ar
c.ai
aa.o
rg |
DO
I: 1
0.25
14/3
.123
91
600 CEBECIET AL.: STALL AND POST-STALL OF AIRFOILS
•10.00.0
a)
-10.0
b)
Fig. 8 Comparison of calculated (solid lines) and measured (symbols)pressure coefficient distributions with the modified panel method forthe NACA 0012 airfoil at M^ = 0.3 and Rc = 4 X 10⁶: a) a = 13 degand b) 13.5 deg.
blade of the helicopter rotor) with restraints placed on shock-induceddrag divergence at transonic Mach numbers (on the "advancing"blade).
Figures 11 and 12 show comparisons between calculated andmeasured pressure coefficient distributions at a = 13.5 deg, ob-tained with the full-potential method, and with the panel methodemploying compressibility corrections, respectively. For additionalangles of attack, see Ref. 18. The variation of calculated and mea-sured lift coefficient with angle of attack is shown in Fig. 13. Con-sistent with the results for the NACA 0012 airfoil, the calculatedresults with the modified panel method are not as accurate as thosecomputed with the full-potential method. Again the discrepancy be-comes more pronounced at higher angles of attack. The predictedlift coefficients with the full-potential method are in good agree-ment with measurements for all angles of attack, in contrast to thepredicted lift coefficients with the modified panel method, even atmoderate angles of attack.
Figures 14-16 show similar results for the NLR-1 airfoil at aMach number of 0.3 and at a chord Reynolds number of 3.91 x 10⁶.This airfoil is also based on the "peakey" airfoil concept developedby Wortmann,22 combined with an inverse camber built into thetrailing-edge region of the airfoil to reduce the pitching moment.23
Figures 14 and 15 show comparisons between calculated and mea-sured pressure coefficient distributions at a = 12 deg, and Fig. 16
-8.0
-10.0o.ox/c
a)
2.0
CP
-4.0
-6.0
-8.0
-10.00.0 0.2 0.4 0.6 0.8 1.0
X/C
b)
Fig. 9 Comparison of calculated (solid lines) and measured (symbols)pressure coefficient distributions with the full-potential method for theNACA 0012 airfoil at M^ = 0.3 and Rc = 4 x 10⁶: a) a = 13 deg andb) 13.5 deg.
0.0
Fig. 10 Comparison of calculated and measured lift coefficients for theNACA 0012 airfoil at M^ = 0.3 and Rc = 4 x 10⁶. Solid lines denotethe results with the full-potential method and dashed lines those withthe modified panel method.
Dow
nloa
ded
by N
AN
YA
NG
TE
CH
NIC
AL
UN
IVE
RSI
TY
on
June
5, 2
014
| http
://ar
c.ai
aa.o
rg |
DO
I: 1
0.25
14/3
.123
91

CEBECIET AL.: STALL AND POST-STALL OF AIRFOILS 601
-8.0
Fig. 11 Comparison of calculated (solid lines) and measured (symbols)pressure coefficient distributions with the modified panel method for theAmes 01 airfoil at M^ = 0.3, Rc = 3.84 x 10⁶, and a = 13.5 deg.
CP
-2.0
-4.0
-6.0
-8.00.0
Fig. 12 Comparison of calculated (solid lines) and measured (symbols)pressure coefficient distributions with the full-potential method for theAMES 01 airfoil at M^ = 0.3, Rc = 3.84 x 10⁶, and a = 13.5 deg.
0.0 20.0
Fig. 13 Comparison of calculated and measured lift coefficients for theAMES 01 airfoil at M^ = 0.3 and Rc = 3.84 x 10⁶. Solid lines denotethe results with the full-potential method and dashed lines those withthe modified panel method.
CP
-10.0
Fig. 14 Comparison of calculated (solid lines) and measured (symbols)pressure coefficient distributions with the modified panel method for theNLR-1 airfoil atMoo = 0.3, Rc = 3.91 x 10⁶, and a = 12 deg.
-10.0
Fig. 15 Comparison of calculated (solid lines) and measured (symbols)pressure coefficient distributions with the full-potential method for theNLR-1 airfoil atMoc = 0.3, Rc = 3.91 x 10⁶, and a = 12 deg.
0.0 20.0
Fig. 16 Comparison of calculated and measured lift coefficients for theNLR-1 airfoil at MOO = 0.3 and Rc = 3.91 x 10⁶. Solid lines denote theresults with the full-potential method and dashed lines those with themodified panel method.
Dow
nloa
ded
by N
AN
YA
NG
TE
CH
NIC
AL
UN
IVE
RSI
TY
on
June
5, 2
014
| http
://ar
c.ai
aa.o
rg |
DO
I: 1
0.25
14/3
.123
91

602 CEBECIET AL.: STALL AND POST-STALL OF AIRFOILS
shows a comparison between measured and calculated lift coeffi-cients. For this airfoil, the predicted (Q)max with the modified panelmethod is in good agreement with the predicted (Q)max with thefull-potential method, as well as with the experimental value; sur-prisingly enough, however, the predicted lift coefficients with themodified panel method are not in as good agreement with the mea-surements at lower angles of attack than they are at the stall angles,whereas those predicted with the full-potential method are in excel-lent agreement with data.
IV. Concluding RemarksThe results and discussion of the previous section and those in
Ref. 18 show that the present interactive boundary-layer and stabilityand transition method combined with an improved turbulence modeland with a full-potential method, leads to values of lift coefficientsthat are in very good agreement with experiment for compressibleflows at low freestream Mach numbers. The panel method used forinviscid flows with viscous effects shows good agreement with datafor incompressible flows but is not satisfactory for compressibleflows at low Mach number flows with compressibility corrections.
The calculations also indicate the important role of the Reynoldsnumber at low Reynolds numbers. The presence of rather extensiveseparation bubbles even at low angles of attack requires the transitioncalculations to be performed interactively.
AcknowledgmentsThis work was supported by the Air Force Office of Scientific Re-
search (AFOSR) under Contract AFOSR 90-0262 and under NASARFR-0352. The authors would like to thank D. Fant for the AFOSRsupport.
References^ichel, R., "Etude de la Transition sur les Profiles d'Aile; Establishment
d'un Critere de Determination de Point de Transition et Calcul de la Traineede Profile Incompressible, ONERA Rept. 1/1578A, 1951.
2Granvillle, P. S., "The Calculation of the Viscous Drag of Bodies ofRevolution," David W. Taylor Model Basin, Rept. 849, 1953.
3Smith, A. M. O., "Transition, Pressure Gradient, and Stability Theory,"Proceedings of the IX International Congress of Applied Mechanics(Brussels, Belgium), Vol. 4, 1956, pp. 234-244.
4Van Ingen, J. L., "A Suggested Semi-Empirical Method for the Calcula-tion of the Boundary-Layer Region," Rept. VTH71, VTH74, Delft, Holland,1956.
5Cebeci, T, and Smith, A. M. O., Analysis of Turbulent Boundary Layers,Academic Press, New York, 1974.
6Dhawan, S., and Narasimha, R., "Some Properties of Boundary-LayerFlow During the Transition from Laminar to Turbulent Motion," Journal ofFluid Mechanics, Vol. 3, 1958, pp. 418-436.
7Chen, K. K., and Thyson, N. A., "Extension of Emmons' Spot Theoryto Flows on Blunt Bodies, " AIAA Journal, Vol. 9, 1971, pp. 821-825.
8Cebeci, T, Clark, R. W., Chang, K. C., Halsey, N. D., and Lee, K., "Air-foils with Seperation and the Resulting Wakes," Journal of Fluid Mechanics,Vol. 163, 1986, pp. 323-347.
9Cebeci, T, Jau, J., Vitiello, D., and Chang, K. C., "Prediction of Post-Stall Flows on Airfoils," Numerical and Physical Aspects of AerodynamicFlows IV, edited by T. Cebeci, Springer-Verlag, Heidelberg, Germany, 1990,pp. 93-106.
10Gleyzes, C., Cousteix, J., and Bonnet, J. L., "A Calculation Methodof Leading-Edge Separation Bubbles," Numerical and Physical Aspects ofAerodynamic Flows II, edited by T. Cebeci, Springer-Verlag, New York,1984, pp. 173-192.
uDrela, M., and Giles, M. B., "Viscous-Inviscid Analysis of Transonicand Low Reynolds Number Airfoils," AIAA Journal, Vol. 25, No. 10, 1987,pp. 1347-1355.
12Walker, G. J., Subroto, P. H., and Platzer, M. R, "Transition ModelingEffects on Viscous/Inviscid Interaction Analysis of Low Reynolds NumberAirfoil Flows Involving Laminar Separation Bubbles," American Society ofMechanical Engineers, ASME Paper 88-GT-32, June 1988.
13Cebeci, T, "Essential Ingredients of a Method for Low Reynolds-Number Airfoil," AIAA Journal, Vol. 27, 1989, p. 1680.
14Hess, J. L., and Smith, A. M. O., "Calculation of Potential Flow AboutArbitrary Bodies," Progress in Aerospace Sciences, Vol. 8, Pergamon, NewYork, 1966.
15Bharadvaj, B. K., "Computational of Steady and Unsteady ControlSurface Loads in Transonic Flow," AIAA Journal, Vol. 29, No. 11, 1991,pp. 1906-1922.
16Cebeci, T, Roknaldin, F, and Carr, L. W., "Prediction of Stall andPost-Stall Behavior of Airfoils at Low and High Reynolds Numbers," AIAAPaper 93-3502, Jan. 1993.
17Carr, L. W., McCroskey, W. J., McAlister, K. W., Pucci, S. L., andLambert, O., "An Experimental Study of Dynamic Stall on AdvancedAirfoil Sections, Vol. 3, Hot-Wire and Hot-Film Measurements," NASATM 84245.
18Cebeci, T, and Carr, L. W, "Calculation of the Stall and Post-StallBehavior of Airfoils at Low Mach Numbers," NASA Rept. (in preparation).
19Chen, H. H., and Cebeci, T, "The Role of Separation Bubbles on theAerodynamic Characteristics of Airfoils, Including Stall at Low ReynoldsNumbers" (paper in review).
20McGhee, R. J., Jones, G. S., and Jouty, R., "Performance Characteristicsfrom Wind-Tunnel Tests of a Low Reynolds-Number Airfoil," AIAA Paper88-0607, Jan. 1988.
21 Hicks, R. M., and McCroskey, W. J., "An Experimental Evaluationof a Helicopter Rotor Section Design by Numerical Optimization," NASATM-78622, 1980.
22 Wortmann, F. X., "Design of Airfoils with High Lift at Low and MediumSubsonic Mach Numbers," AGARD'Conference Proceedings CP-102, Ad-visory Group for Aerospace Research and Development, Paper 7, Neuilly-sur-Seine, France, 1972.
23Dadone, L. U., "Two-Dimensional Wind Tunnel Test of an OscillatingRotor Airfoil Volume 1," NASA CR 2914, 1977.
Dow
nloa
ded
by N
AN
YA
NG
TE
CH
NIC
AL
UN
IVE
RSI
TY
on
June
5, 2
014
| http
://ar
c.ai
aa.o
rg |
DO
I: 1
0.25
14/3
.123
91