predicting soil phosphorus buffer coefficients using potential sorption site density and soil...
TRANSCRIPT

Predicting Soil Phosphorus Buffer Coefficients Using Potential Sorption Site Densityand Soil Aggregation
X. Wang,* J. M. Jackman, R. S. Yost, and B. A. Linquist
ABSTRACTThe phosphorus (P) buffer coefficient, a ratio of the increase in
extractable P to the amount of applied fertilizer P, is a source ofconsiderable uncertainty in determining the amount of fertilizerneeded to meet crop P requirements. The use of clay as a predictorof the P buffer coefficient has been suggested for soils of similarmineralogy. However, it has not been satisfactory for soils with awide range of soil mineralogies but relatively high clay content. Theobjective of this study was to improve the prediction of buffer coeffi-cients using soil characteristics associated with the process of P sorp-tion, such as mineralogy, surface area, and aggregation. The soil Psorption site density, estimated from detailed clay mineralogy, andreactive mass, the fraction of the total soil mass in the surface aggre-gates where newly added P can be sorbed, were used to predict thebuffer coefficient. The P buffer coefficients of 10 soils with a widerange in P sorption were estimated by Mehlich 3, modified Truog,and 0.5 M NaHCO, extractants for incubation periods of 32 and180 d. The inclusion of P sorption site density and reactive masssubstantially improved predicting the P buffer coefficients when com-pared with the P buffer coefficients predicted by only soil clay content.Statistical models showed that the P buffer coefficients were nega-tively correlated with both log of the P sorption site density andreactive mass. Thus, soils with fewer P sorption sites, lower reactivemass, and larger aggregate size will tend to have higher buffer coeffi-cients, indicating that a greater portion of the added P remainsplant available.
HGHLY WEATHERED SOILS in the tropics often havelow available-P because of high P retention by Al
and Fe oxides and amorphous materials (Fox andSearle, 1978; Sanchez and Uehara, 1980). The additionof fertilizer P is one method used to raise soil availableP to crop critical levels. The ability to predict P fertilizerrequirements and develop accurate P recommendationsis critical to sustainable agriculture and to protectingour environment from detrimental effects of excess P.
Phosphorus requirements are often determined fromfield experiments designed to calibrate soil tests (Evans,1987), which usually means determining how much fer-tilizer is needed to meet crop requirements and to pro-duce the maximum yields. A modeling approach whichuses buffer coefficients and critical levels of the extract-able nutrient represents an effort to improve the empiri-cal process of calibration of P soil test with experiments.The hypothesis of this approach to estimating P require-ments is that fewer costly field experiments are required
X. Wang, and R.S. Yost, Dep of Agronomy and Soil Science, Univ.of Hawaii, 1910 East West Road, Honolulu, HI 96822; J.M. Jackman,4F-2, 89 Tung-Hwa St. 106, Taipei, Taiwan; B.A. Linquist, Interna-tional Rice Research Institute, P.O. Box 933, Manila 1099, Philippines.College of Tropical Agriculture and Human Resources Journal SeriesNo. 4417. Received 7 May 1999. "Corresponding author ([email protected]).
Published in Soil Sci. Soc. Am. J. 64:240-246 (2000).
if buffer coefficients and critical levels can be success-fully predicted from basic soil properties (Yost et al.,1992).
The P buffer coefficient is defined as the increase inextractable P, extracted by a soil test method, resultingfrom the addition of fertilizer P to the soil (Cox, 1994),and is often used to calculate how much P must beadded to meet plant P requirements. The phosphorusdecision support system (PDSS) uses the buffer coeffi-cient, the soil critical level of extractable P, and thecurrent extractable P level to estimate crop P require-ment (Yost et al., 1992). Once the buffer coefficient isestimated, subsequent estimates of P requirementshould depend only on current soil tests.
Characterization of the buffer coefficient should bepossible by quantifying soil properties that determineP sorption. Olsen and Watanabe (1963) observed thatclay content was correlated with P sorption capacity.Cox (1994) used soil clay content to estimate the soilbuffer coefficient, which has been incorporated into thePDSS (Yost et al., 1992), for soils with a wide range oftextures but relatively similar soil mineralogical types.Over a wide range of soil mineralogies but relativelyhigh clay content, however, we found little correlationbetween the buffer coefficient and clay content but highcorrelation with the amorphous material (mainly, Al,Fe, Si oxides) content as extracted by acid ammoniumoxalate. Jackman et al. (1997) further showed that thedensity of potential P sorption sites, which is a functionof the surface area and surface hydroxyl density of min-erals, provided an improved prediction of P sorption ina wide range of soils, indicating the strong effect of clayminerals on P sorption.
Highly weathered soils with low clay activity oftenare highly aggregated (Uehara and Gillman, 1981).Phosphorus sorption and desorption processes appearto be influenced by soil aggregate size and stability be-cause newly applied P remains on the surface of aggre-gates (Gunary et al., 1964; Linquist et al., 1997; Wang,1997). Although shaking and grinding soil to less than2 mm in preparation for P extraction may homogenizethe soil sample, it is observed that only a small propor-tion of the clay fraction (<2 ijun) was obtained fromsome tropical soils with high clay contents (e.g., Kapaaand Leilehua series) even after sonicating the samplesfor 15 min (Wang, 1997). Consequently, the large sizeand high stability of soil aggregates may influence theaccessibility of sorption sites in the aggregates to P andthe ability of extractants to remove the P from sorptionsites in the aggregates. Linquist et al. (1997) attempted
Abbreviations: GMD, geometric mean diameter; PS02, the amount ofP sorbed at an equilibrium solution of 0.2 mg P L"1; SPsite: soil Psorption site density; MASSGMD, reactive mass estimated from Eq. [2].
240
WANG ET AL.: PREDICTING SOIL PHOSPHORUS BUFFER COEFFICIENTS 241
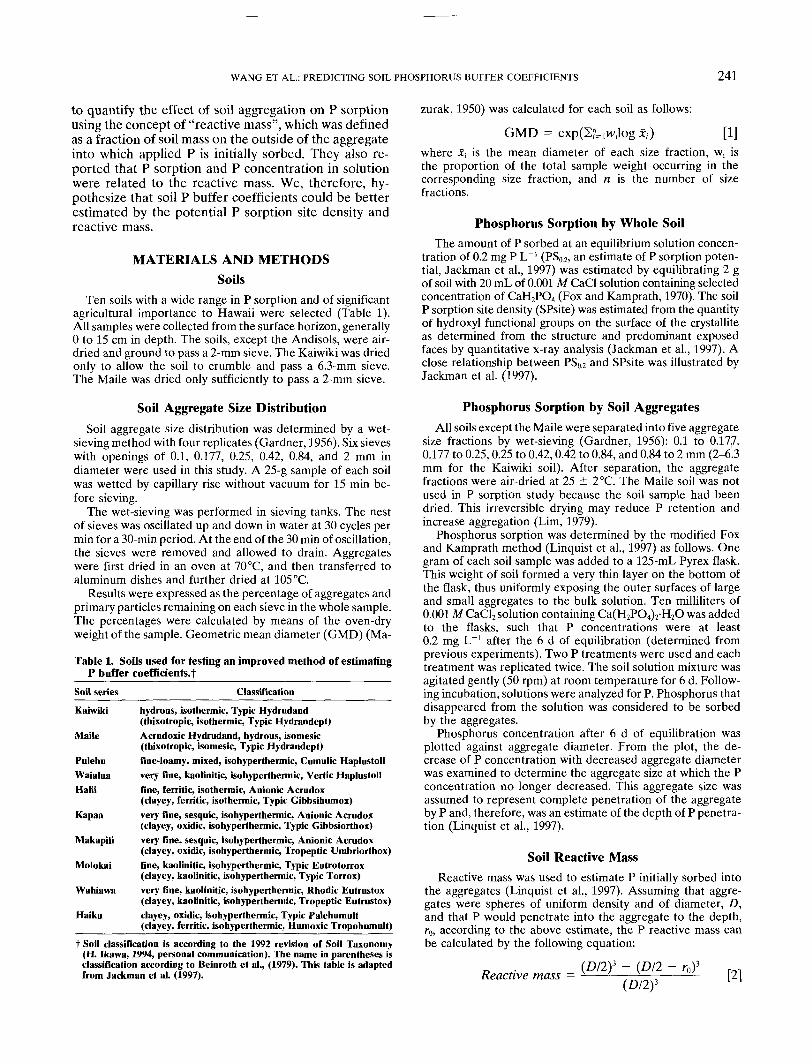
to quantify the effect of soil aggregation on P sorptionusing the concept of "reactive mass", which was definedas a fraction of soil mass on the outside of the aggregateinto which applied P is initially sorbed. They also re-ported that P sorption and P concentration in solutionwere related to the reactive mass. We, therefore, hy-pothesize that soil P buffer coefficients could be betterestimated by the potential P sorption site density andreactive mass.
MATERIALS AND METHODSSoils
Ten soils with a wide range in P sorption and of significantagricultural importance to Hawaii were selected (Table 1).All samples were collected from the surface horizon, generally0 to 15 cm in depth. The soils, except the Andisols, were air-dried and ground to pass a 2-mm sieve. The Kaiwiki was driedonly to allow the soil to crumble and pass a 6.3-mm sieve.The Maile was dried only sufficiently to pass a 2-mm sieve.
Soil Aggregate Size DistributionSoil aggregate size distribution was determined by a wet-
sieving method with four replicates (Gardner, 1956). Six sieveswith openings of 0.1, 0.177, 0.25, 0.42, 0.84, and 2 mm indiameter were used in this study. A 25-g sample of each soilwas wetted by capillary rise without vacuum for 15 min be-fore sieving.
The wet-sieving was performed in sieving tanks. The nestof sieves was oscillated up and down in water at 30 cycles permin for a 30-min period. At the end of the 30 min of oscillation,the sieves were removed and allowed to drain. Aggregateswere first dried in an oven at 70 °C, and then transferred toaluminum dishes and further dried at 105 °C.
Results were expressed as the percentage of aggregates andprimary particles remaining on each sieve in the whole sample.The percentages were calculated by means of the oven-dryweight of the sample. Geometric mean diameter (GMD) (Ma-
Table 1. Soils used for testing an improved method of estimatingP buffer coefficients.!
Soil series __ Classification
Kaiwiki hydrous, isothermic, Typic Hydrudand(thixotropic, isothermic, Typic Hydrandept)
Maile Acrudoxic Hydrudand, hydrous, isomesic(thixotropic, isomesic, Typic Hydrandept)
Pulehu fine-loamy, mixed, isohyperthermic, Cumulic HaplustollWaialua very fine, kaolinitic, isohyperthermic, Vertic HaplustollHalii fine, ferritic, isothermic, Anionic Acrudox
(clayey, ferritic, isothermic, Typic Gibbsihumox)Kapaa very fine, sesquic, isohyperthermic, Anionic Acrudox
(clayey, oxidic, isohyperthermic, Typic Gibbsiorthox)very fine, sesquic, isohyperthermic, Anionic Acrudox(clayey, oxidic, isohyperthermic, Tropeptic Umbriorthox)
Molokai fine, kaolinitic, isohyperthermic, Typic Eutrotorrox(clayey, kaolinitic, isohyperthermic, Typic Torrox)
Wahiawa very fine, kaolinitic, isohyperthermic, Rhodic Eutrustox(clayey, kaolinitic, isohyperthermic, Tropeptic Eutrustox)
Haiku clayey, oxidic, isohyperthermic, Typic Palehumult(clayey, ferritic, isohyperthermic, Humoxic Tropohumult)
t Soil classification is according to the 1992 revision of Soil Taxonomy(H. Ikawa, 1994, personal communication). The name in parentheses isclassification according to Beinroth et al., (1979). This table is adaptedfrom Jackman et al. (1997).
zurak, 1950) was calculated for each soil as follows:
GMD = exp(2?=iH'ilog *,•) [1]where *, is the mean diameter of each size fraction, w; isthe proportion of the total sample weight occurring in thecorresponding size fraction, and n is the number of sizefractions.
Phosphorus Sorption by Whole SoilThe amount of P sorbed at an equilibrium solution concen-
tration of 0.2 mg P L~' (PS0.2, an estimate of P sorption poten-tial, Jackman et al., 1997) was estimated by equilibrating 2 gof soil with 20 mL of 0.001 M CaCl solution containing selectedconcentration of CaH2PO4 (Fox and Kamprath, 1970). The soilP sorption site density (SPsite) was estimated from the quantityof hydroxyl functional groups on the surface of the crystalliteas determined from the structure and predominant exposedfaces by quantitative x-ray analysis (Jackman et al., 1997). Aclose relationship between PS0.2 and SPsite was illustrated byJackman et al. (1997).
Phosphorus Sorption by Soil AggregatesAll soils except the Maile were separated into five aggregate
size fractions by wet-sieving (Gardner, 1956): 0.1 to 0.177,0.177 to 0.25,0.25 to 0.42,0.42 to 0.84, and 0.84 to 2 mm (2-6.3mm for the Kaiwiki soil). After separation, the aggregatefractions were air-dried at 25 ± 2°C. The Maile soil was notused in P sorption study because the soil sample had beendried. This irreversible drying may reduce P retention andincrease aggregation (Lim, 1979).
Phosphorus sorption was determined by the modified Foxand Kamprath method (Linquist et al., 1997) as follows. Onegram of each soil sample was added to a 125-mL Pyrex flask.This weight of soil formed a very thin layer on the bottom ofthe flask, thus uniformly exposing the outer surfaces of largeand small aggregates to the bulk solution. Ten milliliters of0.001 M CaCl2 solution containing Ca(H2PO4)2-H2O was addedto the flasks, such that P concentrations were at least0.2 mg L"1 after the 6 d of equilibration (determined fromprevious experiments). Two P treatments were used and eachtreatment was replicated twice. The soil solution mixture wasagitated gently (50 rpm) at room temperature for 6 d. Follow-ing incubation, solutions were analyzed for P. Phosphorus thatdisappeared from the solution was considered to be sorbedby the aggregates.
Phosphorus concentration after 6 d of equilibration wasplotted against aggregate diameter. From the plot, the de-crease of P concentration with decreased aggregate diameterwas examined to determine the aggregate size at which the Pconcentration no longer decreased. This aggregate size wasassumed to represent complete penetration of the aggregateby P and, therefore, was an estimate of the depth of P penetra-tion (Linquist et al., 1997).
Soil Reactive MassReactive mass was used to estimate P initially sorbed into
the aggregates (Linquist et al., 1997). Assuming that aggre-gates were spheres of uniform density and of diameter, D,and that P would penetrate into the aggregate to the depth,r0, according to the above estimate, the P reactive mass canbe calculated by the following equation:
_ . (£>/2)3 - (DI2 - r0)3Reactive mass = -——-——— ———- ' °'
(£>/2)3

242 SOIL SCI. SOC. AM. J., VOL. 64, JANUARY-FEBRUARY 2000
60 -,
50
40 -
30 -
a) 32-d incubation» 0.5 M NaHCO3: Y = 1.69 + 0.098 X (r2 = 0.99)• Mehlich 3: Y = -1.93 + 0.0813 X (r2 = 0.97)» M-Truog:Y = 2.54 +0.127 Xfr2
50 n
40
30 -
20 -
10 -
0 -
100 150 200 250 300 350 400
b) 180-d incubation0.5 M NaHCO3: Y = 2.46 + 0.059 X (r2 = 0.99)
Mehlich 3: Y = -0.16 + 0.022 X (r2 = 0.96)M-Truog: Y = 1.19 + 0.097 X (r2 = 0.99)
0 50 100 150 200 250 300 350 400
Padded (mg kg"1)Fig. 1. Relationship between extractable P by the three soil test meth-
ods (Mehlich 3, modified Truog, and 0.5 M NaHCO<) and P appliedto the Kapaa soil following incubation periods of 32 and 180 d.
For aggregates less than or equal to ra in radius the calculatedreactive mass becomes 1. As aggregate size increases the calcu-lated reactive mass decreases approaching 0. The aggregatediameter (£>) of whole soil was estimated from the geometricmean diameter.
Phosphorus Incubation Study and Buffer Coefficients
For the incubation study, each soil was treated with five Plevels as powdered calcium monobasic phosphate [Ca(H2.
Table 2. Phosphorus sorption and aggregation of the selected soils.
0.O5
O
'5IT
<D
I03
O
(DOc
3.5
2.5
1.5
0.5
Pulehu (GMD = 0.245)
10 mg PL-120mgPL'
0.0 0.3 0.6 0.9 1.2 1.5
1.0 Kapaa (GMD = 0.416)
0-860 mg P L"10.6
0.2
0.1
0.0
lOOmgPL'1
0.0 0.3 0.6 0.9 1.2
3 i Kaiwiki (GMD = 0.837)
1.5
2
0
400 mg P L'1
600 mg P L"1
0 1Aggregate diameter (mm)
Fig. 2. Phosphorus sorption as influenced by aggregate size for theKapaa, Kaiwiki, and Pulehu soils. These three soils were selectedto represent the different soil P sorption and aggregation. Legendsindicate initial P levels added to aggregates. Error bars representtwo standard deviations. Symbol sizes exceed error bars in somecases.
PO4)2-H2O] (Jackman, 1994). Four sets of P applications wererequired because of differing sorption capacity of the soils.The applications were 0, 25, 50, 100, and 200 mg P kg~' soilfor the Haiku, Molokai, Pulehu, Waialua soils; 0, 50,100, 200,and 400 mg P kg"' soil for the Halii, Kapaa, Makapili, Wahiawasoils; 0, 100, 200, 400, and 800 mg P kg"1 soil for the Maile;
Soil
HaikuHaliiKaiwikiKapaaMaileMakapiliMolokaiPulehuWahiawaWaialuaMean ± Sett
<0.1 mm
3329112630254043413531
0.1-0.42 mme;/«
40282841364541363942
38
>0.42 mm
27436133343019212023
31
GMDtmg P kg"'
0.3300.4178.8370.4160.3870.4170.2590.2450.2600.296
0.428 ± 0.068
PSut|xmolc g-'
416260
3280434
1130125013879
490112
758
SPsite§
66.0115563121265182
4.28.3
71.642.8
144
MASS(;MUfl
0.9570.8850.5100.993NA#
0.8870.9031.0000.9950.9790.901
t Reactive mass estimated from Eq. [2] average of four observations.I Phosphorus sorption at an equilibrium solution concentration of 0.2 mg P L§ Soil P sorption site density (Jackman et al., 1997).H Geometric mean diameter.# Not available.tt Mean ± 1 standard error.

WANG ET AL.: PREDICTING SOIL PHOSPHORUS BUFFER COEFFICIENTS 243
Table 3. Correlation coefficients among P sorption potential, Psorption site density, aggregate size, and reactive mass.
Table 4. Comparison of P buffer coefficients determined afterthe 32nd and 180th day of incubation using a paired f-test.
PSu SPsitet GMDiSPsiteGMDMASSGMD§
0.97**0.92**0.93**
0.95**-0.94** -0.93**
** Significant probability levels at 0.01.t Soil P sorption site density.t Geometric mean diameter.§ Reactive mass as estimated by GMD.
and 0, 250, 500,1000, and 2000 mg P kg"1 soil for the Kaiwikisoil. The soils were placed in plastic bags and the calciumphosphate was thoroughly mixed with the soil. The appro-priate amount of water was added to bring the soil to theestimated field capacity. The samples were incubated at 25 ±2°C for 180 d while the bags were kept open to allow the soilsto dry. When the samples had dried they were rewetted toestimated field capacity and thus put through successive wet-ting and drying cycles. The moisture content was monitoredthroughout the equilibration period. The Kaiwiki and Mailesoils were not allowed to air-dry but were maintained at amoisture level similar to that normally occurring in the field,which prevented an irreversible change in physical or chemicalproperties of the hydric materials (Lim, 1979).
Soils were sampled after 32 and 180 d of equilibration, andwere analyzed for extractable P with the following extractants:(i) 0.01 M H2SO4 + 3% (NH4)2SO4, modified Truog (m-Truog)(Ayres and Hagihara, 1952); (ii) 0.5 M NaHCO3 at pH 8.5(Watanabe and Olsen, 1965); and (iii) a mixed solution of0.2 M acetic acid, 0.25 M ammonium nitrate, 0.015 M ammo-nium fluoride, 0.013 M nitric acid, and 0.001 M ethylenedi-aminetetraacetic acid (ETDA) (Mehlich, 1984). Phosphorusconcentration in the supernatant was measured with ammo-nium molybdate and ascorbic acid according to Murphy andRiley (1962) and Watanabe and Olsen (1965).
The phosphorus buffer coefficient was estimated from theslope of the linear regression of extractable soil P regressedagainst added P. A typical linear relationship between extract-able P and added P is illustrated by results from the Kapaasoil (Fig. 1).
Soil water content at — 1.5 MPa was measured by pressureplates by pre-soaking the soil in water overnight.
Statistical AnalysisMultiple linear regressions were used to predict the buffer
coefficients from soil properties such as P sorption site density,aggregate size, and reactive mass. Regression coefficients wereestimated with S-PLUS (Statistical Science, 1995), and theAIC statistic was used to determine the best fitting model(Akaike, 1974). This statistic, the likelihood version of theCp statistic, provides a convenient criterion for determiningwhether a model is improved by dropping or adding a term.A logarithmic transformation of the P sorption site densitywas used in regression analysis and in the computation ofPearson correlation coefficients.
RESULTS AND DISCUSSIONSoil Aggregation
Soils varied in size distribution of aggregates (GMD).One was highly aggregated, several ranged from 0.3 to0.5 mm, and others less than 0.3 mm (Table 2). TheKaiwiki soil, dominated by amorphous materials, washighly aggregated as indicated by the GMD value of
Method Mean of the difference i P-valueiMehlich 3Modified Truog0.5 M NaHCO,
0.0003-0.0142
0.02650.980.660.01
t The mean of the differences in the P buffer coefficient which are subtrac-tion of the P buffer coefficients after 32 d of incubation from those after180 d of incubation.
I Probability level of significant difference of means.
0.837 mm (Table 2). The Haiku, Halii, Kapaa, and Ma-kapili soils, dominant in Al and Fe crystalline minerals,were in the middle range, as indicated by GMDs from0.3 to 0.5 mm. The other soils, characterized by low claycontent or by kaolinite and 2:1 clay-sized minerals, werein a group with low soil aggregation — GMDs less than0.3 mm. The GMD value of the Maile soil should begreater than 0.387 mm, probably because the soil samplehad been dried and passed through a 2-mm sieve. Bothsoils dry irreversibly (Uehara and Gillman, 1981).
Reactive MassChanges in solution P concentration with decreasing
soil aggregate diameter were used to estimate the depthof P penetration into aggregates, which was then usedfor calculating reactive mass. The reactive mass wasproposed to better explain the effects of aggregate sizeon P sorption (Linquist et al., 1997). The depth of Ppenetration into aggregates was soil specific (Fig. 2).Phosphorus concentration in solution after 6 d of equili-bration decreased with decreasing aggregate mean diam-eter until 0.214 mm for the Haiku, Halii, Kapaa, Makapili,Wahiawa, Waialua soils, and down to 0.139 for the Molo-kai soil, and 0.177 mm for the Kaiwiki soil. For thePulehu soil, P concentrations in solution in smaller ag-gregate fractions were greater than in larger aggregatefractions, and reactive mass was assumed to be 1.
There were negative correlations between both PS0.2and MASSGMD, and SPsite and MASSGMD (Table 3).These negative relationships are probably due to theincrease in P sorption with increased Al and Fe oxidecontent (Jones, 1981; Jackman et al., 1997) and a positivecorrelation between soil aggregation and Al and Feoxides (Uehara and Gillman, 1981). The highly aggre-gated soils associated with high contents of Al and Feoxides would result in smaller values of reactive massbased on Eq. [2], suggesting that the above negativecorrelations are expected. In contrast, P sorption byaggregates separated from the same soil decreased withincreased aggregate size, and increased with increasedreactive mass (Linquist et al., 1997; Wang, 1997). Thiscan be expected because the dominant factor affectingP retention is probably reactive mass while the other soilproperties are relatively uniform for aggregate fractionsseparated from the same soil. Similar contents of Aland Fe oxides among aggregate fractions should resultin small differences in P retention among aggregatefractions, except for the aggregate size effect of increas-ing reactive mass with smaller aggregates.
244 SOIL SCI. SOC. AM. J., VOL. 64, JANUARY-FEBRUARY 2000
Waialua -Wahiawa -
Pulehu -Molokai -Makapili -
Maile -Kapaa -Kaiwiki -
Halii -Haiku -
^mMmwwm a) Mehlich 3•wtwrnvmmi
1
b•/////////A
^ ———— i VMM. 180-d incubation
-i i i 32-d incubationi
a_,
oCO
0.00 0.05 0.10 0.15 0.20 0.25 0.30 0.35
WaialuaWahiawa
Pulehu -Molokai -Makapili
MaileKapaa
Kaiwiki -Halii -
Haiku
180-d incubation
32-d incubation
b) Modified Truog
0.0 0.1 0.2 0.3 0.4 0.5 0.6 0.7
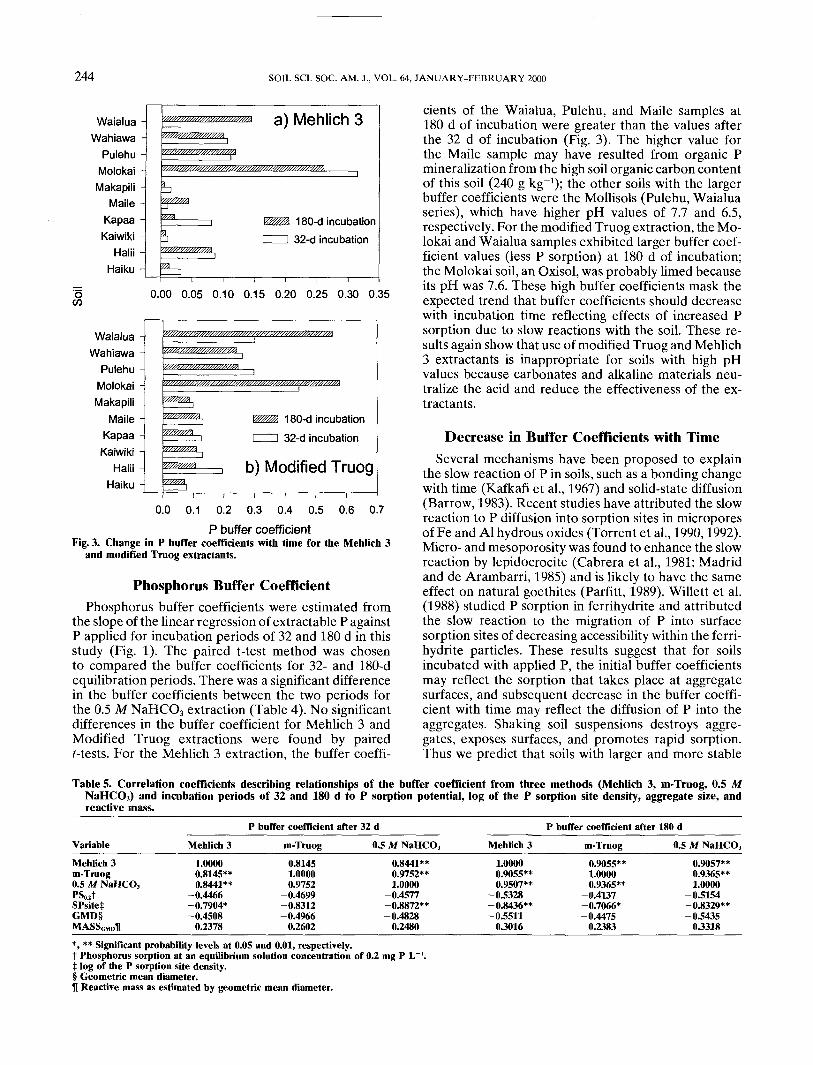
P buffer coefficientFig. 3. Change in P buffer coefficients with time for the Mehlich 3
and modified Truog extractants.
Phosphorus Buffer CoefficientPhosphorus buffer coefficients were estimated from
the slope of the linear regression of extractable P againstP applied for incubation periods of 32 and 180 d in thisstudy (Fig. 1). The paired t-test method was chosento compared the buffer coefficients for 32- and 180-dequilibration periods. There was a significant differencein the buffer coefficients between the two periods forthe 0.5 M NaHCO3 extraction (Table 4). No significantdifferences in the buffer coefficient for Mehlich 3 andModified Truog extractions were found by pairedMests. For the Mehlich 3 extraction, the buffer coeffi-
cients of the Waialua, Pulehu, and Maile samples at180 d of incubation were greater than the values afterthe 32 d of incubation (Fig. 3). The higher value forthe Maile sample may have resulted from organic Pmineralization from the high soil organic carbon contentof this soil (240 g kg"1); the other soils with the largerbuffer coefficients were the Mollisols (Pulehu, Waialuaseries), which have higher pH values of 7.7 and 6.5,respectively. For the modified Truog extraction, the Mo-lokai and Waialua samples exhibited larger buffer coef-ficient values (less P sorption) at 180 d of incubation;the Molokai soil, an Oxisol, was probably limed becauseits pH was 7.6. These high buffer coefficients mask theexpected trend that buffer coefficients should decreasewith incubation time reflecting effects of increased Psorption due to slow reactions with the soil. These re-sults again show that use of modified Truog and Mehlich3 extractants is inappropriate for soils with high pHvalues because carbonates and alkaline materials neu-tralize the acid and reduce the effectiveness of the ex-tractants.
Decrease in Buffer Coefficients with TimeSeveral mechanisms have been proposed to explain
the slow reaction of P in soils, such as a bonding changewith time (Kafkafi et al., 1967) and solid-state diffusion(Barrow, 1983). Recent studies have attributed the slowreaction to P diffusion into sorption sites in microporesof Fe and Al hydrous oxides (Torrent et al., 1990,1992).Micro- and mesoporosity was found to enhance the slowreaction by lepidocrocite (Cabrera et al., 1981; Madridand de Arambarri, 1985) and is likely to have the sameeffect on natural goethites (Parfitt, 1989). Willett et al.(1988) studied P sorption in ferrihydrite and attributedthe slow reaction to the migration of P into surfacesorption sites of decreasing accessibility within the ferri-hydrite particles. These results suggest that for soilsincubated with applied P, the initial buffer coefficientsmay reflect the sorption that takes place at aggregatesurfaces, and subsequent decrease in the buffer coeffi-cient with time may reflect the diffusion of P into theaggregates. Shaking soil suspensions destroys aggre-gates, exposes surfaces, and promotes rapid sorption.Thus we predict that soils with larger and more stable
Table 5. Correlation coefficients describing relationships of the buffer coefficient from three methods (Mehlich 3, m-Truog, 0.5 MNaHCO,) and incubation periods of 32 and 180 d to P sorption potential, log of the P sorption site density, aggregate size, andreactive mass.
P buffer coefficient after 32 d P buffer coefficient after 180 d
Variable
Mehlich 3m-Truog0.5 M NaHCOjPSoztSPsiteiGMD§MASSGMDfl
Mehlich 3
1.00000.8145**0.8441**
-0.4466-0.7904*-0.4508
0.2378
m-Truog
0.81451.00000.9752
-0.4699-0.8312-0.4966
0.2602
0.5 M NaHCOj
0.8441**0.9752**1.0000
-0.4577-0.8872**-0.4828
0.2480
Mehlich 3
1.00000.9055**0.9507**
-0.5328-0.8436**-0.5511
0.3016
m-Truog
0.9055**1.00000.9365**
-0.4137-0.7066*-0.4475
0.2383
0.5 M NaHCOj
0.9057**0.9365**1.0000
-0.5154-0.8329**-0.5435
0.3318
*, ** Significant probability levels at 0.05 and 0.01, respectively.t Phosphorus sorption at an equilibrium solution concentration of 0.2 mg P L\ log of the P sorption site density.§ Geometric mean diameter.II Reactive mass as estimated by geometric mean diameter.

WANG ET AL.: PREDICTING SOIL PHOSPHORUS BUFFER COEFFICIENTS 245
Table 6. Comparison of means of the P buffer coefficients toP sorption.
Soil
HaikuHaliiKaiwikiKapaaMaileMakapiliMolokaiPulehuWahiawaWaialua
Mehlich 3
0.023060.084000.009250.051430.041150.010430.28780.11500.10330.0873
m-Truog
0.07450.15130.12040.11230.13730.09250.51100.27190.25170.4275
0.5 M NaHCO3
0.056060.099310.074140.078520.076200.043430.28400.20680.14680.2018
PSW416260
3280434
1130125013879
490112
t Phosphorus sorption at an equilibrium solution concentration of 0.2 mgPL~'.
aggregates should have higher buffer coefficients forlonger periods of time than the same soils but withsmaller aggregates. This may explain why the Maile andKaiwiki soils, which are rich in amorphous materialsand have strong structure, show higher buffer coeffi-cients than some of the Oxisols, which have much lowerP sorption potentials estimated by the Fox and Kam-prath (1970) P sorption methods. The Fox and Kam-prath (1970) method of vigorous shaking usually breaksup aggregates and probably represents maximum Psorption (Linquist et al., 1997). In our case, the Maileand Kaiwiki soils sorbed the most of P according to thevigorous, aggregate crushing equilibration (Table 6).
Prediction of P Buffer Coefficientsfrom Soil Properties
Preliminary analysis showed that the buffer coeffi-cients in this study were not correlated with clay content,CEC, oxalate-extractable amorphous materials, pH, Al,organic content, specific surface area, water content atmatrix potential of -1.5 MPa, and total P (Jackman,1994). In this paper, we related the P buffer coefficientsto P sorption and other soil properties associated withthe process of P sorption. The buffer coefficients werecorrelated with P sorption potential, aggregate size, andreactive mass, and significantly correlated with log ofSPsite (Table 5). These correlations suggested the pres-
Table 7. Models and coefficients describing the prediction of Pbuffer coefficients of three soil tests for the incubations of 32and 180 d._____________________________
Modelt «2
32-d incubation(1) PBCMeu = 0.4827 - 0.0584 log(SPsite) -(2) PBCm Inl08 = 0.7343 - 0.0783 log(SPsite)(3) PBCoten = 0.5724 - 0.0615 log(SPsite) -
180-day incubation(4) PBCMehj = 0.4298 - 0.0551 log(SPsite) -(5) PBCm !„„,. = 0.9186 - 0.1072 log(SPsite)(6) PBCOI» = 0.4096 - 0.0498 log(SPsite) -
0.1728 MASSGMD 0.675**- 0.2205 MASSGMD 0.731**0.1945 MASSGMD 0.870**
0.1339 MASSGMD 0.760**- 0.2747 MASSGMD 0.515**0.0961 MASSGMD 0.750**
** Significant probability level at 0.01.t Phosphorus coefficients for Mehlich 3 (PBCMeh3)> modified Truog
(PBC.-in.J, and PBCo,,,., and 0.5 M NaHCO,. SPsite is the soil Psorption site density. MASSGMo is the reactive mass estimated fromgeometric mean diameter.
ence of compound effects of soil minerals and chemicaland physical factors on P sorption and extraction pro-cesses in the incubation study. The types of amounts ofsoil minerals determine the number of sorption sites,which are closely related to the total P sorption potential(Jackman et al., 1997). On the other hand, soil physicalproperties influence P diffusion into aggregates throughmoisture retention, aggregate size, and stability. Thereactive mass may represent such physical effects on Psorption. Thus both chemical and physical aspects ofsorption seem important in estimating buffer coeffi-cients.
A comparison of the buffer coefficients with PS0.2values indicates that the measurements of P sorptionby the incubation and the P isotherm curve methodswere not the same (Table 6). In some cases where therewere large differences in PSo.2 values between soils, therewas only small or no differences among the buffer coeffi-cients. The Kaiwiki, Makapili, and Maile soils had muchlarger PS0.2 values than the Kapaa, Haiku, and Haliisoils, but the buffer coefficients of these soils suggestedsimilar P sorption potential. The Wahiawa soil, with amedium sorption potential estimated with PS0.2, dis-played a low sorption potential according to the buffercoefficients. These results suggest that predicting the P
Table 8. The standard errors of the P buffer coefficient prediction by Cox's model (1994), the revised model in Table 7, and the otherselected models.
Model Mehlich 3
Cox (1994)t 0.1151Model in Table 7$ 0.05347Model (1)§ 0.07165Model (2)§ 0.06872Model (3)§ 0.06476Model (4)§ 0.06077Model (5)§ 0.06437Model (6)5 0.06863
t PhosphorusI Phosphorus
Buffer Coefficient = e bcl">,Buffer Coefficient predicted
32-d incubation
m-Truog
0.13630.061820.074200.079020.097150.074280.072340.06807
where b and clay are aby the P sorption site
180-d incubation
0.5 M NaHCOj
0.10250.030590.051470.053380.066740.056380.053070.04849
constant and clay contentdensity and reactive mass
Mehlich 3
0.10590.040820.055470.057360.063920.044930.049590.04846
, respectively,in Table 7.
m-Truog
0.22520.13670.14710.11360.13500.10080.12390.1395
0.5 M NaHCO,
0.10630.043500.047330.042420.063920.046900.043180.04566
§
Model (1): Phosphorus Buffer Coefficient = constant + log(GMD) + (1/GMD), where GMD is geometric mean diameter.Model (2): Phosphorus Buffer Coefficient = constant + GMD + MC1S + GMD-MC1S, where MC15 is the water content at matrix potential of -1.5 MPa.GMD is geometric mean diameter.Model (3): Phosphorus Buffer Coefficient = constant + MC15 + SSA + MC15-SSA, where SSA is soil specific surface area, respectively. MC1S is thewater content at matrix potential of 1.5 MPa.Model (4): Phosphorus Buffer Coefficient = constant + logCMC^) + GMD + MASSGMD, where MASSGMD is reactive mass. The MC15 and GMD arethe same as the Model (1) and (2).Model (5): Phosphorus Buffer Coefficient - constant + log(SSA) + GMD + MASSGMD, where the parameters are defined in the Model (1), (3), and (4).Model (6): Phosphorus Buffer Coefficient = constant + log(GMD) + MASSGMD, where GMD and MASSGMD are defined in the Model (1) and (4).

246 SOIL SCI. SOC. AM. J., VOL. 64, JANUARY-FEBRUARY 2000
buffer coefficient should include other soil characteris-tics in addition to P sorption potential or P sorptionsite density.
Soil aggregation, as expressed by reactive mass andaggregate size, was correlated with the P buffer coeffi-cient (Table 5) indicating that the prediction of the Pbuffer coefficients could be improved by including ag-gregate size and reactive mass. The best fitting statisticalmodels quantify the effects of P sorption sites and reac-tive mass to the buffer coefficients (Table 7). Signs ofcoefficients of each model indicated that the buffer coef-ficients were negatively related to both log of the sorp-tion site density and reactive mass. Thus a soil with alow number of P sorption sites and a low fraction ofreactive mass should have a large buffer coefficient, i.e.,sorb relatively less P.
The models including clay mineralogy and physicalfactors substantially reduced standard errors of thebuffer coefficients when compared with Cox's models(Cox, 1994), where the buffer coefficients were pre-dicted only by the clay contents of soils (Table 8). Incase the P sorption site density is not available or veryexpensive to estimate, the inclusions of water contentat matrix potential of —1.5 MPa (Jackman, 1997), thesoil specific surface area (Jackman, 1997), or GMD, areother alternatives to improve the prediction of the Pbuffer coefficients (Table 8).
Although the prediction of buffer coefficients wasimproved by including P sorption density and soil aggre-gation, it still is necessary to test whether extractable Pwithin aggregates has the same availability as extract-able P on the surface of the aggregates. Current soil Ptest methods have not been evaluated for the effects ofP diffusion into aggregates and accessibility of roots androot hairs to P within the aggregates on soil P supply.
ACKNOWLEDGMENTSThis research was supported by the Soil Management-Col-
laborative Research Program of the U.S. Agency for Interna-tional Development and the U.S. Department of AgricultureSection 406 Funds.