predicting pathogen growth during short-term … jfp 70.pdf · raw meat microbiological and...
TRANSCRIPT

1446
Journal of Food Protection Vol 70 No 6 2007 Pages 1445ndash1456Copyright International Association for Food Protection
Predicting Pathogen Growth during Short-Term TemperatureAbuse of Raw Pork Beef and Poultry Products
Use of an Isothermal-Based Predictive Tool
STEVEN C INGHAM1 MELODY A FANSLAU1 GREG M BURNHAM1 BARBARA H INGHAM1
JOHN P NORBACK1 AND DONALD W SCHAFFNER2
1University of WisconsinndashMadison Madison Wisconsin 53706 and 2Rutgers The State University of New JerseyNew Brunswick New Jersey 08903 USA
MS 06-418 Received 2 August 2006Accepted 30 January 2007
ABSTRACT
A computer-based tool (available at wwwwiscedufoodsafetymeatresearch) was developed for predicting pathogengrowth in raw pork beef and poultry meat The tool THERM (temperature history evaluation for raw meats) predicts thegrowth of pathogens in pork and beef (Escherichia coli O157H7 Salmonella serovars and Staphylococcus aureus) and onpoultry (Salmonella serovars and S aureus) during short-term temperature abuse The model was developed as follows 25-gsamples of raw ground pork beef and turkey were inoculated with a five-strain cocktail of the target pathogen(s) and held atisothermal temperatures from 10 to 433C Log CFU per sample data were obtained for each pathogen and used to determinelag-phase duration (LPD) and growth rate (GR) by DMFit software The LPD and GR were used to develop the THERMpredictive tool into which chronological time and temperature data for raw meat processing and storage are entered TheTHERM tool then predicts a log CFU value for the desired pathogen-product combination The accuracy of THERM wastested in 20 different inoculation experiments that involved multiple products (coarse-ground beef skinless chicken breastmeat turkey scapula meat and ground turkey) and temperature-abuse scenarios With the time-temperature data from eachexperiment THERM accurately predicted the pathogen growth and no growth (with growth defined as log CFU 03) in67 85 and 95 of the experiments with E coli O157H7 Salmonella serovars and S aureus respectively and yielded fail-safe predictions in the remaining experiments We conclude that THERM is a useful tool for qualitatively predicting pathogenbehavior (growth and no growth) in raw meats Potential applications include evaluating process deviations and critical limitsunder the HACCP (hazard analysis critical control point) system
Since 2000 all wholesale meat processors in the Unit-ed States have been required to use the hazard analysiscritical control point (HACCP) system for ensuring foodsafety (16) Under the HACCP system processors mustconduct a hazard analysis for each of their products andthen develop and implement an HACCP plan for the controlof identified hazards that are reasonably likely to occur TheHACCP plan specifically deals with identified processstepsmdashcritical control points (CCPs)mdashthat must be prop-erly executed to control these hazards A CCP is definedas lsquolsquoa point step or procedure in a food process at whichcontrol can be applied and as a result a food safety hazardcan be prevented eliminated or reduced to acceptable lev-elsrsquorsquo (16) Scientifically validated critical limits must thenbe specified as criteria for use in monitoring each identifiedCCP
In a typical hazard analysis for a raw pork beef orpoultry product the growth of pathogens such as Esche-richia coli O157H7 Salmonella serovars and Staphylo-coccus aureus will be identified as a hazard that is reason-ably likely to occur These pathogens cannot be eliminatedduring the typical processing of raw products but their
Author for correspondence Tel 608-265-4801 Fax 608-262-6872E-mail scinghamwiscedu
growth can be controlled by at least one CCP typically thestep at which the product temperature is the warmest Pres-ently to our knowledge there is no US Department ofAgriculture (USDA) guideline that provides previously ac-cepted critical limits for this type of CCP in pork and beefprocessing although 13C is the regulatory limit for rawpoultry product temperatures during processing (19) Inmany small and very small meat plants with unrefrigeratedraw meat processing areas the temperature at the process-ing step designated the CCP may be high enough that theproduct can be considered to have undergone short-termtemperature abuse Furthermore some processing stepssuch as grinding can cause an increase in raw meat tem-perature Raw products may also be exposed to short-termtemperature abuse during CCP deviations or other process-ing or scheduling problems Clearly scientifically valid in-formation is needed to set time limits for preventing path-ogen growth when raw meat products are held for shorttimes at abusive temperatures
Ideally processors would obtain scientifically valid in-formation through controlled inoculation studies Howeverthis approach is not safe practical or affordable for mostprocessors Alternatively laboratory-based studies of path-ogen growth on actual products can be conducted This ap-proach has been followed in a variety of situations (4 5
J Food Prot Vol 70 No 6 PREDICTING PATHOGEN GROWTH IN RAW MEATS 1447
TABLE 1 Chemical and physical characteristics of typical laboratory-ground pork beef and turkey used to develop THERM andcommercial coarse-ground beef skinless chicken breast meat turkey scapula meat and ground turkey used in experiments to testTHERM
AnalysisLaboratory-ground pork
Laboratory-ground beef
Coarse-groundbeef
Laboratory-ground turkey
Skinlesschickenbreasts
Turkeyscapula meat
Commercial ground turkey
Plant A Plant Ba
pH 57 57 54 59 58 58 58 61 moisture 739 732 624 737 729 735 709 697 fat 17 40 182 10 13 32 96 126 protein 236 221 176 240 244 225 182 172 salt 005 006 014 009 009 008 01 03
a The product contained added rosemary extract preservatives
7 8) Another possible way to generate the needed infor-mation is to analyze the processing time-temperature con-ditions by computer-generated predictive models of patho-gen growth For example pathogen growth during non-isothermal temperature abuse could be predicted by divid-ing the product time-temperature history into multiple smalltemperature-change intervals and then applying the USDAPathogen Modeling Program (PMP 70 Agricultural Re-search Service Eastern Regional Research Center Wynd-moor Pa) to predict the pathogen growth in each intervalThe estimated pathogen growth would be the sum of thepredicted growth for each interval However because manyof the PMP 70 models are derived from studies with purepathogen cultures in laboratory media USDA regulatorshave not generally accepted this approach as the sole meansof scientific validation (20) In contrast the AgriculturalResearch Service Eastern Regional Research Center hasdeveloped a tool for predicting E coli O157H7 growth thatis based on experiments with sterile ground beef (14) Thistool although based on studies with meat does not accountfor potential growth-affecting interactions between E coliO157H7 and nonpathogenic bacteria indigenous to com-mercial products
A more versatile low-cost alternative to pathogen chal-lenge studies and existing predictive tools is the develop-ment of a computer-generated predictive tool based onpathogen growth data obtained from multiple inoculationstudies conducted with nonsterile raw ground pork beefand poultry By this approach the growth predictionswould be based on the observed behavior of relatively highnumbers of pathogen cells in the absence of added inhib-itory substances such as sodium chloride or sodium nitriteand with a low but realistic level of competing microor-ganisms ie a simulated lsquolsquoworst-casersquorsquo situation In an ear-lier study we presented such a tool and validated its usefor predicting the growth of E coli O157H7 Salmonellaserovars and S aureus during the slow partial-cooking ofbacon (1) In the present study we developed a toolTHERM (temperature history evaluation for raw meats) forpredicting pathogen growth in raw pork and beef (E coliO157H7 Salmonella serovars and S aureus) and on poul-try meat (Salmonella serovars and S aureus) during short-term temperature-abuse situations We tested the accuracyof THERM by subjecting inoculated raw coarse-groundbeef raw skinless chicken breast meat raw turkey scapula
meat and raw ground turkey to short-term temperature-abuse situations and comparing the experimentally deter-mined pathogen growth with the level of pathogen growthpredicted by THERM
MATERIALS AND METHODS
Raw ground pork beef and turkey used in developingTHERM Fresh vacuum-packaged nonenhanced (not injectedwith phosphate solution) pork loins were obtained from a localretail store or directly from a local wholesale distributor Freshvacuum-packaged beef roasts were obtained from a local retailstore A large box of frozen nonenhanced skinless turkey breastswas obtained from a local wholesale distributor Pork loins werefrozen at 20C and then thawed at 5C before grinding whilebeef roasts were ground within 1 day of arrival at the laboratoryBefore grinding fat was trimmed from the pork loins and beefroasts because high fat content may slow the growth rate (GR)of E coli O157H7 in raw meats (13) Turkey breasts were storedin the freezer (20C) and then thawed at 5C in preparation forgrinding Meat was ground once with a meat grinder (a grindingplate with 4-mm-diameter holes Univex model MG8912 UnivexSalem NH)
Raw meat microbiological and chemical analyses A 25-gsample of ground meat from each purchased package or box wasplaced in a filter bag measuring 1525 by 23 cm (6 by 9 in) anddiluted with 99 ml of Butterfieldrsquos phosphate diluent (BPD Nel-son Jameson Marshfield Wis) The sample was then appropri-ately diluted in BPD and plated on 3M Petrifilm aerobic countplates (APC 3M Microbiology St Paul Minn) and incubated at35C for 48 h to determine the concentration of indigenous bac-teria (APC) in the meat product before its use in isothermal stud-ies One sample each of a representative lot of ground porkground beef and ground turkey was sent to a commercial labo-ratory for a determination of the pH percent moisture percentfat percent protein and percent salt (Table 1) Other than thesamples for APC determination and chemical analyses the groundmeats were vacuum sealed in large plastic bags and frozen at20C until thawing at 5C before use
Preparation of inocula Five strains each of E coli O157H7 Salmonella serovars and S aureus were used in developingand testing THERM (Table 2) Each strain was prepared from afrozen stock culture with a working culture plate prepared bysuccessively culturing twice at 35C for 18 to 24 h in brain heartinfusion broth (Difco Becton Dickinson Sparks Md) streakingto brain heart infusion agar (Difco Becton Dickinson) incubatingat 35C for 18 to 24 h examining for homogeneous colony mor-phology and then storing the plate at 5C An isolated colony of
J Food Prot Vol 70 No 61448 INGHAM ET AL
TABLE 2 Pathogen strains used for the development and testingof THERM
Species Strain noSource ofisolation
Source ofstraina
Escherichia coliO157H7
USDA-FSISb
380-94Salami implicat-
ed in illnessoutbreak
1
E coli O157H7 ATCC 43894 Clinical sample 2E coli O157H7 ATCC 43895 Ground beef im-
plicated in ill-ness outbreak
2
E coli O157H7 ATCC 51657 Clinical sample 2E coli O157H7 ATCC 51658 Clinical sample 2Salmonella Ty-
phimuriumS9 Clinical sample
WisconsinLaboratory ofHygiene
3
Salmonella Hei-delberg
S13 Clinical sampleWisconsinLaboratory ofHygiene
3
Salmonella In-fantis
S20 Unknown 3
Salmonella Had-ar
S21 Unknown 3
Salmonella En-teritidis
E40 Chicken ovaryisolate NewYork Depart-ment of Health
3
Staphylococcusaureus
ATCC 12600 Clinical sample 2
S aureus ATCC 25923 Clinical sample 2S aureus FRI-100 Cake implicated
in illness out-break
4
S aureus FRI-472 Turkey salad im-plicated in ill-ness outbreak
4
S aureus FRI-1007 Genoa salamiimplicated inillness out-break
4
a 1 Dr John Luchansky formerly Food Research Institute Uni-versity of WisconsinndashMadison now at USDA Agricultural Re-search Service Eastern Regional Research Center 2 AmericanType Culture Collection Manassas Va 3 Dr Eric JohnsonFood Research Institute University of WisconsinndashMadison 4Dr Amy Wong Food Research Institute University of Wiscon-sinndashMadison
b FSIS Food Safety and Inspection Service
each strain was transferred from its working culture plate to 9 mlof brain heart infusion broth and then incubated at 35C for 24 hInocula were prepared for each pathogen by combining each ofthe five cultured strains into a 50-ml centrifuge tube and centri-fuging at 5000 g for 12 min Because earlier studies in ourlaboratory had shown that combining all three pathogen speciessignificantly inhibited the growth of S aureus in inoculated rawmeat (data not shown) two different inocula were prepared forthe pork and beef experiments The first contained E coli O157H7 and Salmonella serovars prepared as follows the supernatantwas decanted from each five-strain mixture and each pellet was
resuspended to 25 ml with BPD From both five-strain mixtures10 ml was transferred to another 50-ml centrifuge tube creating20 ml of a 10-strain two-pathogen inoculum containing ca 9 logCFUml The second inoculum containing only S aureus at alevel of ca 9 log CFUml was prepared by decanting the super-natant from the five-strain mixture and resuspending the pellet to45 ml with BPD Finally each inoculum was diluted 100-fold inBPD For experiments with turkey the same procedure was fol-lowed except that E coli O157H7 was not used
Preparation and inoculation of meat Isothermal studieswere conducted at approximately 28C intervals (actually mea-sured as 5F because the US meat industry uses the Fahrenheitscale) ranging from 10 to 433C (50 to 110F) Raw ground porkbeef and turkey (ca 25 g) were weighed out into sample bags(75 by 185 cm) and allowed to reach the test temperature eitherin a static water bath (temperatures above room temperature [RT])or an incubator (temperatures at or below RT) A type K ther-mocouple attached to a model SP150 data logger (Dickson Ad-dison Ill) was inserted in the center of a bag of meat to deter-mine when the test temperature had been reached When the testtemperature was reached each meat sample (except for the onecontaining the thermocouple) was inoculated with 100 l of (i)the E coli O157H7 and Salmonella serovars inoculum (beef andpork) (ii) the Salmonella serovars inoculum (turkey) or (iii) theS aureus inoculum (all products) Previously we determined thatpathogen growth was faster when the inoculum was dispersed inthe ground meat than when it was localized in a lsquolsquoholersquorsquo withinthe meat mass (data not shown) hence each inoculated samplebag was sealed and manually massaged for 20 s to distribute theinoculum throughout the meat mass Bags of inoculated productwere returned to the isothermal experiment temperature as quicklyas possible (5 min) Three concurrent trials were conducted foreach temperature with separate inocula prepared for each trialand enough bags of inoculated product were prepared to allow ananalysis of one bag for each inoculum type in each trial at everysampling time
Enumeration of inoculum organisms In experiments to de-velop THERM three bags per inoculum type (one per trial) wereremoved at each sampling time from the water bath or incubatorThe outer surface of each bag was sanitized with 70 ethanol andallowed to dry Once dry the contents of each bag were trans-ferred to a filter bag measuring 1525 by 23 cm The originalsample bag was everted to expose any inoculum still on the bagand was also placed into the filter bag The ground meat sampleand original sample bag were combined with 99 ml of BPD stom-ached at normal speed for 30 s with a stomacher laboratory blend-er (Fisher Scientific Itasca Ill) and serially diluted (in BPD)Similar sampling and initial sample homogenization were done ateach sampling time in experiments to test THERM (see below)For each dilution 100 l was spread on a single plate with asterile bent plastic spreader The selective medium used for Ecoli O157H7 was sorbitol MacConkey agar (Difco Becton Dick-inson) on which typical colonies are colorless to white andopaque The selective medium used for the Salmonella serovarswas xylose lysine decarboxylase agar (Oxoid Ogdensburg NY)on which typical colonies have a black center and a well-definedclear-to-opaque halo The selective medium used for S aureuswas Baird-Parker agar base (Difco Becton Dickinson) with a tel-lurite egg yolk supplement (Difco Becton Dickinson) Typical Saureus colonies on Baird-Parker agar base are shiny black with adistinctive clear zone in the surrounding agar The sorbitolMacConkey agar and xylose lysine decarboxylase plates were in-cubated at 35C for 24 h and the Baird-Parker agar plates were
J Food Prot Vol 70 No 6 PREDICTING PATHOGEN GROWTH IN RAW MEATS 1449
TABLE 3 Ground pork observed lag-phase duration (LPD) growth rate (GR) and R2 values (derived by DMFit) for E coli O157H7 (EC) Salmonella serovars (SALM) and S aureus (SA)a
Temp(CF)
EC
LPD(min)
GR(log CFUmin) R2
SALM
LPD(min)
GR(log CFUmin) R2
SA
LPD(min)
GR(log CFUmin) R2
433110 44 00133 097 74 00146 098 149 00177 098406105 59 00186 099 74 00153 096 124 00179 095378100 51 00136 098 93 00146 097 110 00121 09835095 60 00146 095 100 00089 073 140 00120 09732290 103 00067 093 154 00118 076 207 00134 09729585 89 00077 094 106 00076 092 214 00059 09626780 128 00052 083 261 00110 084 312 00046 09823975 154 00048 091 257 00072 088 330 00028 08421170 139 00027 093 343 00058 090 375 00024 09618465 315 00031 092 490 00059 094 1275 00028 08715660 360 00019 095 528 00020 094 1235 00008 09612855 1061 00011 096 1030 00012 091 NGb NG10050 2286 00004 098 3282 000048 084 NG NG
a Indigenous microbial load before inoculation was 35 log CFUgb NG no growth
TABLE 4 Ground beef observed lag-phase duration (LPD) growth rate (GR) and R2 values (derived by DMFit) for E coli O157H7 (EC) Salmonella serovars (SALM) and S aureus (SA)a
Temp(CF)
EC
LPD(min)
GR(log CFUmin) R2
SALM
LPD(min)
GR(log CFUmin) R2
SA
LPD(min)
GR(log CFUmin) R2
433110 63 00262 089 79 00146 090 111 00107 099406105 63 00169 095 105 00219 092 102 00111 09378100 86 00201 070 106 00195 097 101 00129 09935095 78 00147 091 90 00109 094 155 00111 09932290 86 00100 098 105 00086 091 149 00078 09929585 99 00060 091 107 00057 090 192 00069 09726780 130 00062 095 123 00060 096 346 00057 09923975 156 00028 090 180 00030 086 260 00032 09921170 216 00034 077 215 00039 095 361 00024 07918465 251 00028 099 232 00032 099 751 00011 09415660 387 00015 095 513 00016 090 NGb NG NG12855 560 00012 099 747 00012 099 NG NG NG10050 1625 00004 074 2784 00002 082 NG NG NG
a Indigenous microbial load before inoculation was 35 log CFUgb NG no growth
incubated at 35C for 48 h After colony enumeration one typicalcolony of each pathogen per test temperature was transferred tobrain heart infusion agar and grown overnight at 35C for confir-mation Gram staining reaction cell morphology and colony mor-phology were observed for all isolates A latex agglutination test(Oxoid) was also done for presumptive S aureus For presumptiveSalmonella serovars the oxidase test (DrySlide kit Fisher) andAPI 20E biochemical characterization (bioMerieux HazelwoodMo) were also done and an oxidase test and latex agglutinationtest (Oxoid) were used to confirm presumptive colonies of E coliO157H7
The THERM tool For each pathogen and test temperaturethe log CFU per sample was determined at each sampling timefor each of the three trials The sampling time and log CFU persample data were then entered for each pathogen and test tem-
perature into the DMFit 10 program (J Baranyi Institute of FoodResearch Norwich Research Park Norwich UK) which gener-ated a best-fit growth curve with an estimated lag-phase duration(LPD) GR and corresponding R2 value (Tables 3 through 5) TheLPD and GR values for each combination of pathogen and typeof raw meat were used to develop the THERM tool Software hasbeen written that allows the user to enter up to 20 elapsed-time(expressed in minutes) and temperature (expressed in degreesFahrenheit) data pairs This software uses an interval accumula-tion strategy to estimate the percentage of LPD that elapses ineach time interval (constant temperature assumed) by dividing theinterval time by the LPD and multiplying the resulting value by100 The percentage of LPD contributed by each interval is ac-cumulated and displayed interval by interval until 100 of thetime in lag phase has elapsed (equation 1)
J Food Prot Vol 70 No 61450 INGHAM ET AL
TABLE 5 Ground turkey observed lag-phase duration (LPD)growth rate (GR) and R2 values (derived by DMFit) for Salmo-nella serovars (SALM) and S aureus (SA)a
Temp(CF)
SALM
LPD(min)
GR (logCFUmin) R2
SA
LPD(min)
GR (logCFUmin) R2
433110 44 00110 081 134 0009 097406105 48 00156 099 57 00060 093378100 92 00162 098 156 00161 09935095 137 00171 088 158 00120 09932290 134 00085 080 130 00096 09829585 136 00117 086 208 00066 07726780 207 00106 086 249 00055 09823975 186 00056 096 232 00033 09721170 281 00029 080 498 00021 09618465 501 00028 094 1217 00037 09815660 826 00022 073 966 00009 09712855 887 00008 096 NGb NG NG10050 1364 00004 084 NG NG NG
a Indigenous microbial load before inoculation was 35 logCFUg
b NG no growth
N
total LPD interval timeLPD 100 (1) ii1
After the lag phase is complete interval accumulation is used toestimate the subsequent growth expressed in log CFU The logCFU of growth is computed by multiplying the GR (log CFU perminute) by either the time (in minutes) remaining in the intervalduring which the lag phase ended or the total time of the interval(for all intervals thereafter equation 2)
N
total growth GR for interval interval time (2) i ii1
Temperature was assumed to be constant throughout each intervalWhen temperature values entered by the user do not coincide withexperimental temperatures used (28C intervals from 10 to433C) linear interpolation is performed between DMFit-derivedLPD and GR values to obtain the LPD and GR values for use incalculating the predicted growth
Testing THERM performance in commercial product in-oculation studies The accuracy of THERM was tested in severalinoculation studies with coarse-ground beef pieces of skinlesschicken breast meat and turkey scapula meat and ground turkeymeat These products were inoculated subjected to various short-term temperature-abuse regimes and analyzed to determine path-ogen populations at predetermined time points during the tem-perature abuse A time-temperature history for either the product(45-kg chubs [vacuum-sealed cylindrical packages] of coarse-ground beef) or the storage environment (poultry products) wasalso obtained in each experiment to enter into THERM and obtaina predicted change in log CFU or log CFU
Coarse-ground beef in 45-kg chubs was obtained from a lo-cal wholesale distributor A representative sample was sent to acommercial laboratory for chemical and physical analysis (Table1) At the time of use the concentration of indigenous bacteria(APC) was quantified as described earlier Inocula for coarse-ground beef studies were prepared as described previously Toinoculate the 45-kg chubs twelve 25-g samples were removedfrom 12 squares measuring 38 by 38 cm made by cutting inci-sions through the packaging material on the top half of the long
axis of the chub The 25-g samples were placed in small (75 by185 cm) sampling bags inoculated with 100 l of either the Ecoli O157H7 and Salmonella serovars inoculum or the S aureusinoculum and manually massaged for 20 s to disperse the inoc-ulum The inoculated samples in sample bags were flattened toattain the original dimensions (38 by 38 cm) and placed backinto the incisions (38 by 38 cm) made in the chubs with theends of the sample bags inserted just underneath the packagingof the product After inoculation the surface of each 45-kgcoarse-ground beef chub contained six samples inoculated with Ecoli O157H7 and Salmonella serovars and six samples inoculatedwith S aureus
Inoculated coarse-ground beef chubs were subjected to oneof three temperature-abuse situations (Table 6) For each coarse-ground beef experiment a temperature probe attached to a datalogger was inserted just under the surface in the center of thechub to record the time-temperature data which were then enteredinto THERM Data points were selected by dividing the experi-ment time into 20 equal intervals and determining the temperatureat each of the times from the data logger output In coarse-groundbeef experiments the three temperature-abuse situations repre-sented (i) pathogen contamination of refrigerated raw meat fol-lowed by short-term holding (3 to 6 h) at RT or 35C (experiments1 to 4) (ii) thawing of previously contaminated and frozen prod-ucts at RT or 35C (12 to 15 h experiments 5 to 8) and (iii)holding of meat that had been previously contaminated frozenand thawed at RT or 35C for 12 h (experiments 9 to 12) Sam-pling (one sample bag per inoculum) and pathogen enumerationwere done as described earlier at predetermined times throughouteach experiment Frozen or frozen-thawed samples were spreadplated on nutrient agar (Difco Becton Dickinson) and incubatedat 35C for 1 h to encourage repair of freeze-thawndashinduced injuryand then the nutrient agar was overlaid with the appropriate se-lective medium (tempered at 48C) Incubation then continued at35C for the usual 24- or 48-h period
Fresh skinless chicken breasts and ground turkey meat fromtwo different processors were obtained at a local retail store andeither stored at 5C or frozen and then thawed at 5C before userespectively Frozen turkey scapula meat was obtained from a lo-cal wholesale distributor stored frozen and then thawed at 5Cbefore use A representative sample of each product was sent toa commercial laboratory for chemical and physical analysis (Table1) The APC was determined for each product as described earlierEach type of poultry product was subdivided into small portionsinoculated with either the Salmonella serovars or the S aureus(inoculum prepared as described previously) and then storedStorage treatments were either at 13C for 8 h (experiments 13 to16) mimicking a processing environment barely complying withUSDA regulations (19) or sequentially at 13C for 3 h 21C for3 h and 30C for 4 h (experiments 17 to 20) The latter experi-ments mimicked an extreme loss of temperature control (egproducts inadvertently left on a loading dock cooler failure)Small pieces of meat 25 by 25 by 18 cm thick were excisedfrom the surface of the skinless chicken breasts and from theturkey scapula meat and 100 l of either the Salmonella serovarsor the S aureus inoculum was pipetted onto the surface of eachpiece and distributed with a sterile plastic spreader Each inocu-lated piece was placed in a sample bag (75 by 185 cm) Groundturkey meat was distributed in sample bags (75 by 185 cm 25g per bag) and inoculated with either the Salmonella serovars orthe S aureus as described earlier A bag of each product for eachinoculum type was analyzed to obtain time zero inoculum levelsand all remaining bags were then stored A thermocouple and datalogger as described earlier were used to monitor storage temper-
J Food Prot Vol 70 No 6 PREDICTING PATHOGEN GROWTH IN RAW MEATS 1451
TABLE 6 Outline of temperature-abuse experiments with inoc-ulated coarse-ground beef (GB) skinless chicken breasts (C) tur-key scapula meat (T) ground turkey meat from plant A (GT-A)and ground turkey meat from plant B (GT-B)
Expt no Product Storage temp (C) Holding time
1 GB RTa 340 minb
2 GB RT 360 minb
3 GB 35 180 minb
4 GB 35 240 minb
5 GB 20RT 15 hb
6 GB 20RT 15 hb
7 GB 2035 12 hb
8 GB 2035 12 hb
9 GB 205RT 12 hbc
10 GB 205RT 12 hbc
11 GB 20535 12 hbc
12 GB 20535 12 hbc
13 C 513 8 hb
14 T 513 8 hb
15 GT-A 513 8 hb
16 GT-B 513 8 hb
17 C 5132130 10 hd
18 T 5132130 10 hd
19 GT-A 5132130 10 hd
20 GT-B 5132130 10 hd
a RT room temperature (21C)b Holding time at RT 13C or 35C Initial sampling occurred on
inoculation (for nonfrozen coarse-ground beef samples) wheninoculated poultry products were moved to 13C storage orwhen frozen coarse-ground beef was removed from the freezer
c Sampling was done when the center of the meat mass reached5C and perodically during storage at RT or 35C
d The product was held at 13C for 3 h 21C for 3 h and 30Cfor 4 h Initial sampling was done when the product was movedto 13C storage
ature and provide data to enter into THERM Data points wereselected by dividing the experiment time into 20 equal intervalsand determining the temperature at each of the times from thedata logger output One sample of each product type was analyzedat 3 6 and 8 h (experiments 13 to 16) or at 3 6 and 10 h(experiments 17 to 20) Microbiological analyses were conductedas described earlier
Statistical analyses The paired t test with a 5 significancelevel (release 12 Minitab Inc State College Pa) was done tocompare the LPD and GR values for a given pathogen betweenproducts (ground pork ground beef and ground turkey) and fora given product between pathogens (E coli O157H7 Salmonellaserovars and S aureus) In experiments to test THERM each logCFU value obtained in an experiment was subtracted from itscorresponding time zero value to obtain observed log CFU val-ues Time-temperature data from each experiment were enteredinto THERM to obtain predicted log CFU values The observed log CFU values were compared with the predicted values bythe paired t test and regression analysis (Minitab)
RESULTS AND DISCUSSION
Earlier experiments in our laboratory showed that thelevel of indigenous microorganisms had a significant effecton the LPD values for S aureus (data not shown) but not
for E coli O157H7 or Salmonella serovars with larger Saureus LPD values resulting when there were greater num-bers of indigenous organisms Therefore to develop a con-servative predictive tool all development experiments usedmeat products that had what we considered low levels ofbackground organisms ie 35 log CFUg This levelwas slightly lower than the mean APC values reported inUSDA baseline surveys of ground beef turkey and chicken(15 17 18) All ground meat used in developing THERMcontained 35 log CFUg as measured by a 35C incu-bation temperature Higher plate count values might havebeen obtained if an incubation temperature more suitablefor the growth of psychrotrophic bacteria had been usedalthough the longer incubation time required for such ananalysis discourages use of this analysis by meat processorsand regulators
By the DMFit 10 program we were able to success-fully determine LPD and GR values on the basis of a best-fit microbial growth curve produced by the software (Tables3 through 5) For each curve an R2 value was calculatedThe R2 value is a number from 0 to 1 that represents therelative predictive power of the model The closer the R2
value is to 1 the greater the modelrsquos accuracy All R2 valuesfor ground pork were 073 with 78 of the values090 and all R2 values for ground beef were 070 with80 of the values 090 For turkey all R2 values were073 with 62 of the values 090 The only statisticallysignificant (P 005) differences in LPD or GR valueswere as follows (i) LPD values for Salmonella serovarswere lower in beef than in pork (ii) LPD values for Saureus were higher than for E coli O157H7 and Salmo-nella serovars in beef and higher than for E coli O157H7in pork and (iii) GR values for S aureus were lower thanfor E coli O157H7 and Salmonella serovars in beef andturkey respectively As expected LPD values decreasedand GR values increased as the temperature increased to anoptimum for growth Although differences in experimentalconditions preclude direct comparisons the LPD value ob-served at 295C for Salmonella serovars in ground turkey(Table 5) was similar to the reported LPD value determinedfor Salmonella Typhimurium on irradiated raw skinlesschicken breast at 30C (9) Similarly the LPD values forSalmonella serovars in ground turkey (Table 5) were con-sistent with the LPD values reported for Salmonella Ty-phimurium on heat-sterilized ground chicken meat at tem-peratures ranging from 10 to 40C (10) The LPD valuesfor Salmonella serovars in ground beef (Table 4) were con-sistently lower than the derived lag times reported for Sal-monella Typhimurium on irradiation-sterilized lean beef tis-sue (2)
The LPD and GR values for pathogen growth in rawinoculated pork beef and turkey were used to developTHERM The THERM tool can be used in situations forwhich a series of temperature measurements (of either theproduct or its storage environment) is available to enter intothe program The THERM user enters each temperaturemeasurement and the corresponding time at which the tem-perature was measured The THERM tool predicts the log CFU for the pathogen of interest
J Food Prot Vol 70 No 61452 INGHAM ET AL
TABLE 7 Observed and predicted (THERM) growth of Escherichia coli O157H7 (EC) Salmonella serovars (SALM) and Staphylo-coccus aureus (SA) in coarse-ground beef (GB) skinless chicken breasts (C) turkey scapula meat (T) ground turkey from plant A (GT-A) and ground turkey from plant B (GT-B) during storage at abusive temperaturesa
Exptno Product
Measured P or Chtemp (C)
Start EndLength oftrial (min)
Log CFU
EC
StartEnd (observed
predicted)
SALM
StartEnd (observed
predicted)
SA
StartEnd (observed
predicted)
1 GB P 134 P 190 340 49 4849 47 4348 49 49492 GB P 164 P 203 360 49 5053 45 4650 47 48473 GB P 220 P 286 180 49 5052 47 4549 48 47484 GB P 230 P 292 240 49 5254 44 5049 48 48485 GB P 196 P 201 900 50 4957 47 4853 46 47466 GB P 192 P 182 900 49 5051 46 4746 49 49497 GB P 32 P 298 720 48 5758 43 4551 45 45468 GB P 14 P 311 720 48 6070 43 4963 45 48579 GB P 83 P 171 720 47 4952 45 4848 49 5050
10 GB P 33 P 168 720 48 5355 42 4647 48 495111 GB P 78 P 324 720 47 8493 42 8282 45 737612 GB P 97 P 313 720 46 8382 41 8074 46 597213 C Ch 5 Ch 13 480 NT NT 45 4645 49 494917 C Ch 5 Ch 30 600 NT NT 48 6467 37 554314 T Ch 5 Ch 13 480 NT NT 45 4445 49 494918 T Ch 5 Ch 30 600 NT NT 48 6567 34 554015 GT-A Ch 5 Ch 13 480 NT NT 46 4546 49 494919 GT-A Ch 5 Ch 30 600 NT NT 49 6468 40 544616 GT-B Ch 5 Ch 13 480 NT NT 45 4545 49 494920 GT-B Ch 5 Ch 30 600 NT NT 49 6568 37 5643
a Each log CFU value represents either the log CFU for a single 25-g sample of coarse-ground beef or ground turkey or the mean logCFU per gram (n 2) for chicken breast or turkey scapula meat samples P product Ch chamber NT not tested
The results of the experiments that were used to testTHERM are shown in Table 7 The greatest observed log CFU value was 40 for Salmonella serovars in ex-periment 11 coarse-ground beef while the greatest predict-ed log CFU value was 46 for E coli O157H7 in thesame experiment We first qualitatively evaluated the pre-dicted and observed log CFU values ie described pre-dictions and observations as either lsquolsquogrowthrsquorsquo or lsquolsquonogrowthrsquorsquo We used the criteria of growth log CFU 03 (more than one doubling) and no growth log CFU 03 (see Table 8) According to these criteriaE coli O157H7 grew in experiments 7 8 11 and 12(coarse-ground beef at 35C storage) and in experiment 10(coarse-ground beef at RT storage) Salmonella serovarsgrew in coarse-ground beef in experiments 4 8 11 and 12(all of which involved 35C storage) and in experiment 10(coarse-ground beef at RT storage) as well as in all of thepoultry experiments that involved 30C storage (experi-ments 17 to 20) S aureus grew in experiments 11 and 12(coarse-ground beef stored at 35C) and on all of the poul-try products stored at 30C (experiments 17 to 20) TheTHERM tool accurately predicted whether growth wouldoccur in 67 85 and 95 of the experiments that involvedE coli O157 Salmonella serovars and S aureus respec-tively (Table 8) In all other experiments THERM predict-ed pathogen growth when it was not observed experimen-tally ie made a lsquolsquofail-safersquorsquo prediction Notably THERM
never made a lsquolsquofail-dangerousrsquorsquo prediction ie never failedto predict growth when it was observed experimentally
The THERM tool did not perform as well when wemade quantitative comparisons ie direct comparisons ofpredicted and observed log CFU values (see Table 9) Inthis type of evaluation we considered a predicted log CFU value accurate if it was within 03 of the ob-served value (within one doubling) In coarse-ground beefexperiments THERM predictions were accurate in 67 42and 83 of the experiments with E coli O157 Salmonellaserovars and S aureus respectively All the remaining (notlsquolsquoaccuratersquorsquo) THERM predictions for coarse-ground beefexperiments were fail-safe (the predicted log CFU valueexceeded the observed log CFU value by more than 03)with the exception of a fail-dangerous prediction for thegrowth of Salmonella serovars in experiment 12
Notably different results were obtained in the poultryproduct experiments The THERM tool performed well inpredicting the growth of Salmonella serovars (88 accu-rate 12 fail-safe Table 9) but yielded fail-dangerous pre-dictions for S aureus in 50 of the experiments The ob-served growth of S aureus in the poultry product experi-ments exceeded the fail-safe predicted levels by 08 to 15log CFU This underpredicted growth would have the mostadverse consequences if the initial populations of S aureuswere such that the predicted growth would not result inenough enterotoxin production to cause illness but the ob-
J Food Prot Vol 70 No 6 PREDICTING PATHOGEN GROWTH IN RAW MEATS 1453
TABLE 8 Qualitative accuracy of predictions (THERM) for predicting growth or no growth of Escherichia coli O157H7 (EC)Salmonella serovars (SALM) and Staphylococcus aureus (SA) in coarse-ground beef (GB) skinless chicken breasts (C) turkey scapulameat (T) ground turkey from plant A (GT-A) and ground turkey from plant B (GT-B) during storage at abusive temperaturesa
Exptno Product
EC growth 03 log CFU
Observed Predicted Accuracy
SALM growth 03 log CFU
Observed Predicted Accuracy
SA growth 03 log CFU
Observed Predicted Accuracy
1 GB Acc Acc Acc2 GB F-S F-S Acc3 GB Acc Acc Acc4 GB F-S Acc Acc5 GB F-S F-S Acc6 GB Acc Acc Acc7 GB Acc F-S Acc8 GB Acc Acc F-S9 GB F-S Acc Acc
10 GB Acc Acc Acc11 GB Acc Acc Acc12 GB Acc Acc Acc
Total GB 67 Acc 75 Acc 91 Acc33 F-S 25 F-S 9 F-S
13 C NT NT NT Acc Acc17 C NT NT NT Acc Acc14 T NT NT NT Acc Acc18 T NT NT NT Acc Acc15 GT-A NT NT NT Acc Acc19 GT-A NT NT NT Acc Acc16 GT-B NT NT NT Acc Acc20 GT-B NT NT NT Acc Acc
Total Poultry 100 Acc 100 AccTotalb 67 Acc 85 Acc 95 Acc
33 F-S 15 F-S 5 F-S
a Growth increase of 03 log CFU no growth increase of 03 log CFU no Acc accurate yes F-S fail-safe iepredicted growth was 03 log CFU and observed growth was 03 log CFU NT not tested
b Denotes overall total
served growth would The major compositional differencesbetween the laboratory-ground turkey meat used in devel-oping THERM and the commercial poultry products usedin testing THERM are that the commercial products all con-tained more fat and the commercial ground turkey con-tained more salt It is possible that these differences inhib-ited competing microorganisms somewhat and allowedgreater S aureus growth than predicted by THERM
In addition to comparing the predicted and observed log CFU values for each pathogen in each individualexperiment the paired t test was used to compare predictedand observed log CFU values for each pathogen for allexperiments combined This analysis showed that predicted log CFU values were significantly higher than observed log CFU values for E coli O157H7 (P 0007) andSalmonella serovars (P 002) The R2 values from re-gression analysis were 094 and 089 respectively for thesetwo pathogens indicating a very consistent relationship be-tween predicted and observed values The R2 value for Saureus was only 043 reflecting the divergence of predictedand observed values in poultry product experiments 17 to20 The paired t test analysis did not show any statisticallysignificant difference between predicted and observed val-ues for S aureus for all experiments combined (P 049)
perhaps reflecting the inconsistent relationship between pre-dicted and observed results
An additional way of testing the accuracy of THERMis to compare its pathogen growth predictions with the ex-perimental pathogen growth observed in experiments inother laboratories For example a recent study by Mannand Brashears (7) suggested a critical limit for ground beefprocessors of lsquolsquotime in the processing area of 6 hrsquorsquo withthe processing area temperature defined as 22 to 23C For225C storage of ground beef for 6 h with no additionalwarm-up or cool-down times (the same conditions as inMann and Brashears (7)) the THERM tool predicted anincrease for E coli O157H7 of 054 log CFU The exper-imentally determined log CFU value was 049 indicatinggood agreement between THERM and the inoculationstudy With a longer RT incubation Mann and Brashearsobserved log CFU values (rounded) of 10 14 and 18for E coli O157H7 stored for 8 10 and 12 h respectivelyThe corresponding log CFU values predicted by THERMfor these times were 09 13 and 17 For ground beefstored at 10C Mann and Brashears observed log CFUvalues of approximately 01 01 02 04 08 and 10 at4 8 12 24 48 and 72 h respectively The THERM toolpredicted no growth of E coli O157H7 through 27 h with
J Food Prot Vol 70 No 61454 INGHAM ET AL
TABLE 9 Quantitative accuracy of predictions (THERM) for predicting change in log CFU for Escherichia coli O157H7 (EC)Salmonella serovars (SALM) and Staphylococcus aureus (SA) in coarse-ground beef (GB) skinless chicken breasts (C) turkey scapulameat (T) ground turkey from plant A (GT-A) and ground turkey from plant B (GT-B) during storage at abusive temperaturesa
Exptno Product
EC change in log CFU
Observed Predicted Accuracy
SALM change in log CFU
Observed Predicted Accuracy
SA change in log CFU
Observed Predicted Accuracy
1 GB 01 0 Acc 04 01 F-S 0 0 Acc2 GB 01 04 Acc 01 05 F-S 01 0 Acc3 GB 01 03 Acc 02 02 F-S 01 0 Acc4 GB 03 05 Acc 06 05 Acc 0 0 Acc5 GB 01 07 F-S 01 06 F-S 01 0 Acc6 GB 01 02 Acc 01 0 Acc 0 0 Acc7 GB 09 10 Acc 02 08 F-S 0 01 Acc8 GB 12 22 F-S 06 20 F-S 03 12 F-S9 GB 02 05 F-S 03 03 Acc 01 01 Acc
10 GB 05 07 Acc 04 05 Acc 01 03 Acc11 GB 37 46 F-S 40 40 Acc 28 31 Acc12 GB 37 36 Acc 39 33 F-D 13 26 F-S
Total GB 67 Acc 42 Acc 83 Acc33 F-S 49 F-S 17 F-S
9 F-D13 C NT NT NT 01 0 Acc 0 0 Acc17 C NT NT NT 16 19 Acc 18 06 F-D14 T NT NT NT 01 0 Acc 0 0 Acc18 T NT NT NT 17 19 Acc 21 06 F-D15 GT-A NT NT NT 01 0 Acc 0 0 Acc19 GT-A NT NT NT 15 19 F-S 14 06 F-D16 GT-B NT NT NT 0 0 Acc 0 0 Acc20 GT-B NT NT NT 16 19 Acc 19 06 F-D
Total Poultry 88 Acc 50 Acc12 F-S 50 F-D
Totalb 67 Acc 60 Acc 70 Acc33 F-S 35 F-S 10 F-S
5 F-D 20 F-D
a Acc accurate observed and predicted growth differed by 03 log CFU F-S fail-safe ie predicted growth was at least 03 log CFUgreater than observed growth F-D fail-dangerous ie predicted growth was at least 03 log CFU less than observed growth NT not tested
b Denotes overall total
log CFU values of 05 at 48 h and 11 at 72 h By thequalitative approach discussed earlier we conclude that theTHERM tool predictions are consistent with those from theMann and Brashears study
From our results we conclude that the THERM tool isuseful for qualitatively predicting the growth of all threepathogens in raw meats in general and for quantitatively pre-dicting the growth of all three pathogens in raw beef andSalmonella serovars on raw poultry The THERM tool ap-pears to be less useful for the quantitative prediction of Saureus growth on raw poultry There are several potentialshortcomings to THERM that may adversely affect its per-formance First the use of multistrain cocktails in developingTHERM means that the fastest growing strain has the great-est effect on the calculated lag time and GR (22) Howeverthe presence of an unusually rapid-growing strain (or strains)would increase the conservative nature of the THERM toolby resulting in smaller LPD or larger GR values and therebydecrease the likelihood that THERM would underestimatepathogen growth Second THERM does not account for avariety of inhibitory ingredients eg fat sodium chloridesodium nitrite liquid smoke inhibitory processing condi-
tions (eg dry-curing cold-smoking drying) to which path-ogens or competing microorganisms may be exposed duringthe temperature abuse of raw meat products Additional ver-sions of THERM could be developed however for use withproducts that have a different composition from that of theground meats we used in this study Other researchers haveattempted to account for inhibitors of microbial growth andhave modeled the temperature pH and water activity con-ditions at the growthndashno growth boundary for SalmonellaTyphimurium in broth (6) However to our knowledge anal-ogous studies with meat systems have not been publishedThird THERM was developed with ground meats ratherthan intact muscle tissue Mann et al (8) have shown thatthe growth of Salmonella is faster in ground pork than inwhole-muscle pork This trend was not seen when we com-pared the predicted log CFU values (from ground turkey)with the observed log CFU values from unground poultryproducts Fourth some pathogen strains may be capable ofgrowth at temperatures slightly above or below the limits ofTHERM (11) although the ability of hemorrhagic E coli togrow at 8C in ground beef has been reported to decreasewhen high levels of background organisms are present (12)
J Food Prot Vol 70 No 6 PREDICTING PATHOGEN GROWTH IN RAW MEATS 1455
Growth at temperatures below the THERM lower limitswould likely have little effect on the accuracy of THERMpredictions because of the long LPD values expected at suchlow temperatures but THERM growth predictions could beerroneously low if growth occurred at temperatures abovethe 433C upper limit of THERM The level of backgroundorganisms in the ground meats used to develop THERM wasalways considerably lower than the level of inoculum organ-isms which could add to the conservative performance ofTHERM Competition from background organisms has beenshown to slow the growth of E coli O157H7 in groundbeef (21) and laboratory broth (3) and of S aureus onminced turkey (23) Our preliminary experiments done todevelop inoculum preparation techniques also showed thistrend Finally it is possible that pathogens that originate fromthe hide or skin or the intestinal tract of an animal are in aphysiological state better suited to rapid growth in meat thanare pathogens grown in laboratory medium This possibilityshould be investigated in future studies
Overall the THERM tool was accurate or fail-safe inqualitatively predicting whether E coli O157H7 Salmo-nella serovars and S aureus grew in raw beef and on poul-try products during experiments designed to test the toolrsquosperformance Therefore this tool would be useful for pro-cessors who evaluate the potential critical limits associatedwith raw meat processing CCPs Critical limits could beevaluated by entering possible time-temperature combina-tions into THERM to see if pathogen growth is predictedFor example a processor could propose a critical limit forpreventing Salmonella growth during raw pork processingas follows lsquolsquoduring processing the product shall not be attemperatures of 5 to 156C for more than 2 h and thenshall be cooled to below 5C within another 2 hrsquorsquo A con-servative approach would then be to enter time-temperaturepairs representing immediate warm-up to 156C holdingat 156C for 4 h and immediate cool-down With this in-formation entered THERM would predict no growth ofSalmonella serovars as the LPD at 156C is much greaterthan 4 h (490 min see Table 3) Alternatively time-tem-perature data from several lots of a product that meet theproposed critical limit could be entered into THERM todetermine if pathogen growth is predicted The THERMtool could also be used to evaluate product safety in a sit-uation in which critical limits are not met ie a deviation
On the basis of the results of our study we recommendthe qualitative use of THERM by processors for developingcritical limits or evaluating deviations that involve the tem-perature abuse of raw ground pork beef and poultry prod-ucts Processors may download THERM from wwwwiscedufoodsafetymeatresearch
ACKNOWLEDGMENTS
This study was financially supported by a grant from the USDACooperative State Research Education and Extension Service NationalIntegrated Food Safety Initiative We are indebted to the following un-dergraduate students for their laboratory assistance Ryan Algino AmyHaen Julia Heinrich Andrew Jensen Erica Schoeller and Melissa TalbotIn addition we thank Justin Kral for authoring the THERM-web interfaceand designing the Website for THERM
REFERENCES
1 Burnham G M M A Fanslau and S C Ingham 2006 Evaluatingmicrobial safety of slow partial-cooking processes for bacon use ofa predictive tool based on small-scale isothermal meat inoculationstudies J Food Prot 69602ndash608
2 Dickson J S G R Siragusa and J E Wray Jr 1992 Predictingthe growth of Salmonella typhimurium on beef by using the tem-perature function integration technique Appl Environ Microbiol583482ndash3487
3 Duffy G R C Whiting and J J Sheridan 1999 The effect of acompetitive microflora pH and temperature on the growth kineticsof Escherichia coli O157H7 Food Microbiol 16299ndash307
4 Ingham S C J A Losinski K L Becker and D R Buege 2004Growth of Escherichia coli O157H7 and Salmonella serovars onraw beef pork chicken bratwurst and cured corned beef implica-tion for HACCP plan critical limits J Food Saf 24246ndash256
5 Ingham S C R K Wadhera M A Fanslau and D R Buege 2005Growth of Salmonella serovars Escherichia coli O157H7 and Staph-ylococcus aureus during thawing of whole chicken and retail groundbeef portions at 22 and 30C J Food Prot 681457ndash1461
6 Koutsoumanis K P P M Kendall and J N Sofos 2004 Modelingthe boundaries of growth of Salmonella Typhimurium in broth as afunction of temperature water activity and pH J Food Prot 6753ndash59
7 Mann J E and M M Brashears 2006 Validation of time andtemperature values as critical limits for the control of Escherichiacoli O157H7 during the production of fresh ground beef J FoodProt 691978ndash1982
8 Mann J E L Smith and M M Brashears 2004 Validation oftime and temperature values as critical limits for Salmonella andbackground flora growth during the production of fresh ground andboneless pork products J Food Prot 671389ndash1393
9 McKay A L A C Peters and A C Hann 1997 The growth ofSalmonella typhimurium on irradiated raw skinless chicken breastInt J Food Microbiol 37121ndash129
10 Oscar T P 2005 Development and validation of primary secondaryand tertiary models for growth of Salmonella Typhimurium on sterilechicken J Food Prot 682606ndash2613
11 Palumbo S A J E Call F J Schultz and A C Williams 1995Minimum and maximum temperatures for growth and verotoxin pro-duction by hemorrhagic strains of Escherichia coli J Food Prot58352ndash356
12 Palumbo S A A Pickard and J E Call 1997 Population changesand verotoxin production of enterohemorrhagic Escherichia colistrains inoculated in milk and ground beef held at low temperaturesJ Food Prot 60746ndash750
13 Tamplin M L 2002 Growth of Escherichia coli O157H7 in rawground beef stored at 10C and the influence of competitive bacterialflora strain variation and fat level J Food Prot 651535ndash1540
14 Tamplin M L G Paoli B S Marmer and J Phillips 2005 Mod-els of the behavior of Escherichia coli O157H7 in raw sterile groundbeef stored at 5 to 46C Int J Food Microbiol 100335ndash344
15 US Department of Agriculture Food Safety and Inspection Service1994 Nationwide federal plant raw ground beef microbiological sur-vey Available at httpwwwfsisusdagovOPHSbaselinerwgrbeefpdf Accessed 26 May 2006
16 US Department of Agriculture Food Safety and Inspection Service1996 Pathogen reduction hazard analysis and critical control point(HACCP) systems final rule Fed Regist 6138805ndash38989
17 US Department of Agriculture Food Safety and Inspection Service1996 Nationwide raw ground turkey microbiological survey Avail-able at httpwwwfsisusdagovOPHSbaselinerwgrturkpdf Ac-cessed 26 May 2006
18 US Department of Agriculture Food Safety and Inspection Service1996 Nationwide raw ground chicken microbiological surveyAvailable at httpwwwfsisusdagovOPHSbaselinerwgrchckpdfAccessed 26 May 2006
J Food Prot Vol 70 No 61456 INGHAM ET AL
19 US Department of Agriculture Food Safety and Inspection Service2003 Poultry products inspection regulationsmdashtemperatures andchilling and freezing procedures 9 CFR 38166 US GovernmentPrinting Office Washington DC
20 US Department of Agriculture Food Safety and Inspection Service2005 Use of microbial pathogen computer modeling in HACCPplans FSIS notice 25-05 Available at httpwwwfsisusdagovregulationsnotice25-05defaultasp Accessed 18 May 2006
21 Vold L A Holck Y Wasteson and H Nissen 2000 High levels
of background flora inhibit growth of Escherichia coli O157H7 inground beef Int J Food Microbiol 56219ndash225
22 Whiting R C and M H Golden 2002 Variation among Esche-richia coli O157H7 strains relative to their growth survival thermalinactivation and toxin production in broth Int J Food Microbiol75127ndash133
23 Yang X R G Board and G C Mead 1988 Influence of spoilageflora and temperature on growth of Staphylococcus aureus in turkeymeat J Food Prot 51303ndash309
- Untitled
-
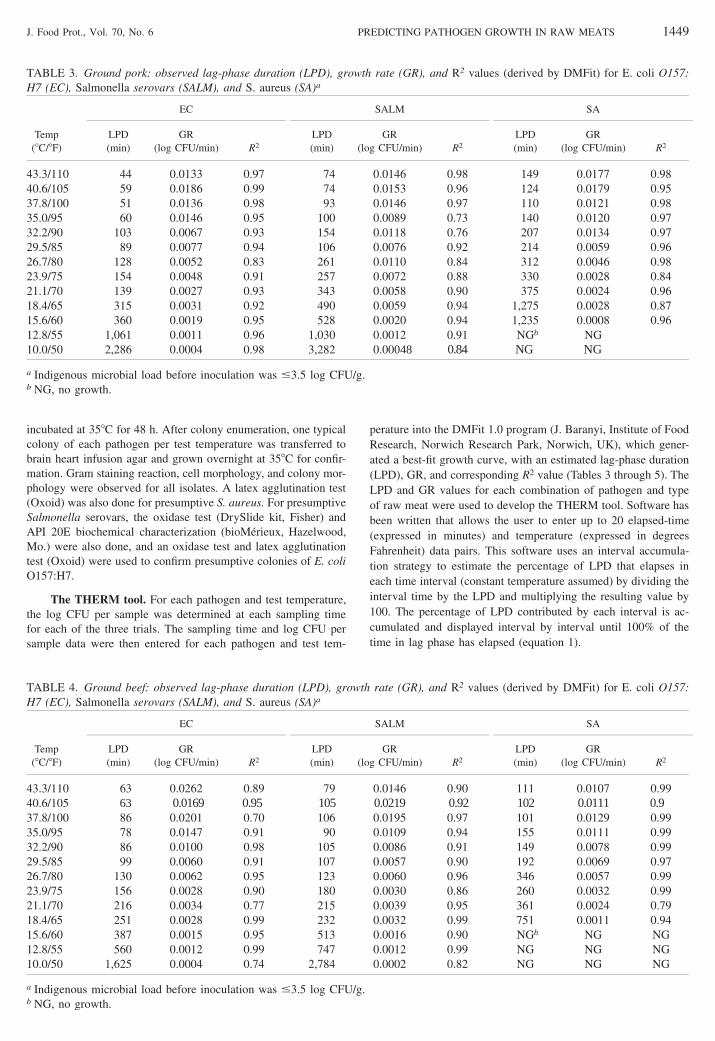
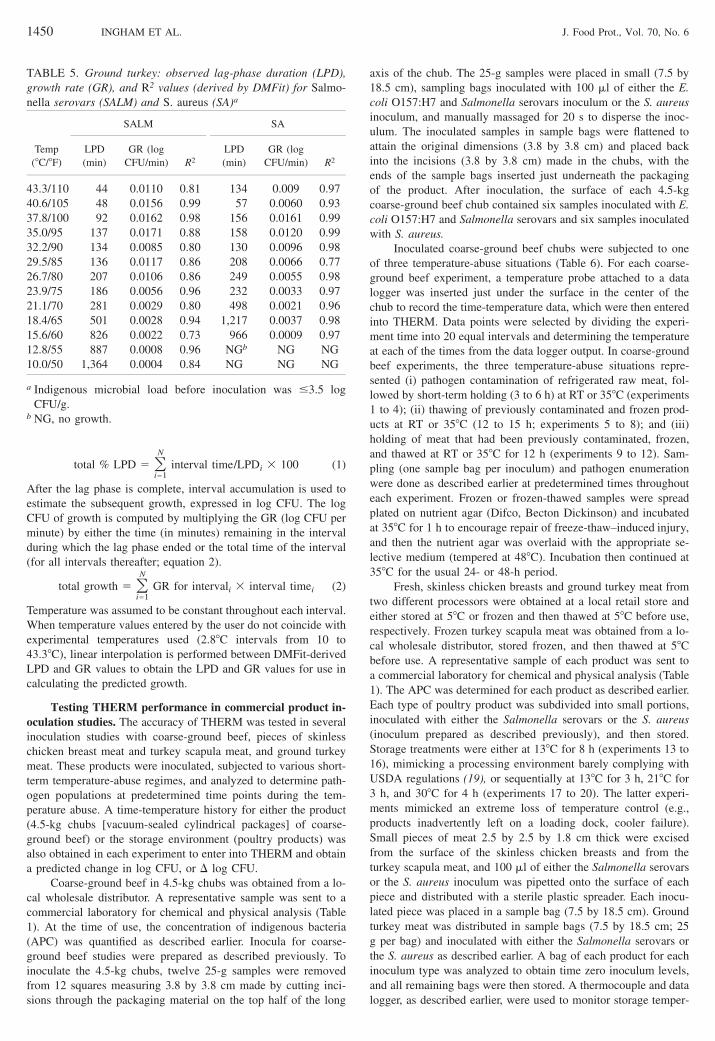
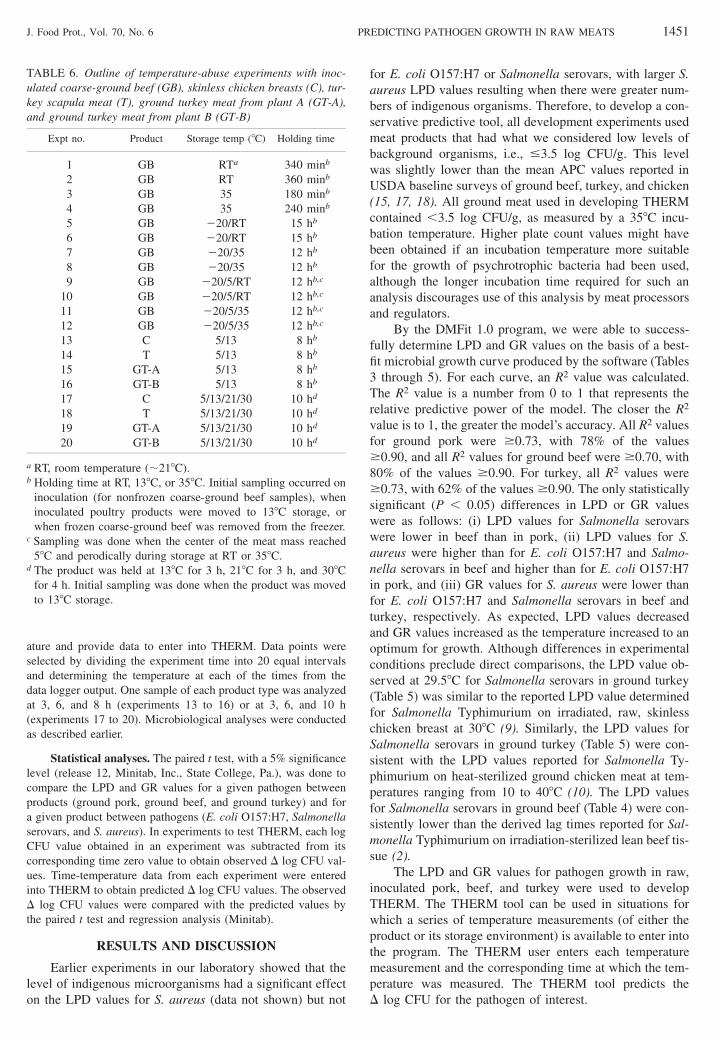