precog: a tool for automated extraction and visualization
TRANSCRIPT
SOFTWARE Open Access
PRECOG: a tool for automated extractionand visualization of fitness components inmicrobial growth phenomicsLuciano Fernandez-Ricaud1, Olga Kourtchenko2, Martin Zackrisson3, Jonas Warringer3,4 and Anders Blomberg1*
Abstract
Background: Phenomics is a field in functional genomics that records variation in organismal phenotypes in thegenetic, epigenetic or environmental context at a massive scale. For microbes, the key phenotype is the growth inpopulation size because it contains information that is directly linked to fitness. Due to technical innovations andextensive automation our capacity to record complex and dynamic microbial growth data is rapidly outpacing ourcapacity to dissect and visualize this data and extract the fitness components it contains, hampering progress in allfields of microbiology.
Results: To automate visualization, analysis and exploration of complex and highly resolved microbial growth dataas well as standardized extraction of the fitness components it contains, we developed the software PRECOG(PREsentation and Characterization Of Growth-data). PRECOG allows the user to quality control, interact with andevaluate microbial growth data with ease, speed and accuracy, also in cases of non-standard growth dynamics.Quality indices filter high- from low-quality growth experiments, reducing false positives. The pre-processing filtersin PRECOG are computationally inexpensive and yet functionally comparable to more complex neural networkprocedures. We provide examples where data calibration, project design and feature extraction methodologieshave a clear impact on the estimated growth traits, emphasising the need for proper standardization in data analysis.
Conclusions: PRECOG is a tool that streamlines growth data pre-processing, phenotypic trait extraction, visualization,distribution and the creation of vast and informative phenomics databases.
Keywords: Phenomics, Yeast, growth, Data pre-processing, Fitness components, Automation, Data presentation
BackgroundThanks to recent technological innovations we can nowdetect and assess traits on virtually all phenotypic levels,from molecular to population level phenotypes, with un-precedented speed. These advancements have spurred theemergence of phenomics, the field in functional genomicsthat is dedicated the cataloguing of variation in pheno-types as a function of variation in genetic, epigenetic andenvironmental factors [1]. From a modest origin in docu-menting qualitative traits with moderate throughput, phe-nomics has evolved to precisely record quantitative traitswith an astounding degree of parallelization. The massiveaccumulation of quantitative phenotypic data requires the
continuous expansion of data storage, analysis, and visua-lization capabilities, something that has resulted in thedevelopment of an increasing number of specializedphenotype databases dedicated to the most importantmodel organisms [2–7].Microbes dominate the biosphere and microbial phe-
nomics therefore has a key role in functional genomics[1]. A wide array of techniques have been introduced toaddress different aspects of the microbial phenome [8–21],but the growth of microbial populations and microbialgrowth phenomics takes centre stage because of its intim-ate link to microbial fitness and evolution. Microcultivationin liquid medium offers high resolution, but only moderatethroughput, in the surveying of growth in microbial popu-lation size [1]. Recently, we and others have shown thatmicrocultivation of microbial colonies on solid medium of-fers both high-resolution and high-throughput estimation
* Correspondence: [email protected] of Marine Sciences, Lundberg Laboratory, University ofGothenburg, Medicinaregatan 9c, 41390 Göteborg, SwedenFull list of author information is available at the end of the article
© 2016 The Author(s). Open Access This article is distributed under the terms of the Creative Commons Attribution 4.0International License (http://creativecommons.org/licenses/by/4.0/), which permits unrestricted use, distribution, andreproduction in any medium, provided you give appropriate credit to the original author(s) and the source, provide a link tothe Creative Commons license, and indicate if changes were made. The Creative Commons Public Domain Dedication waiver(http://creativecommons.org/publicdomain/zero/1.0/) applies to the data made available in this article, unless otherwise stated.
Fernandez-Ricaud et al. BMC Bioinformatics (2016) 17:249 DOI 10.1186/s12859-016-1134-2

of microbial population size growth [22–24]. Expectationsare that this will lead to an explosion in microbial growthphenomics data and make activities in bioinformatics likestorage, analysis and visualization of the accumulated infor-mation a critical issue. Various algorithms for analysingand extracting fitness components from microbial growthdata have been developed for use in microbial growth phe-nomics [25].Quantifying the growth in microbial population size at
both high resolution and high throughput has technic-ally two key components. First, an instrument that auto-matically and accurately records proliferation of a largenumber of microbial populations in parallel is needed.Several microcultivation instruments currently on themarket achieve both a reasonable accuracy and a reason-able throughput [25–30]. The output from these instru-ments is files where the measured proxy for populationsize, e.g. optical density (OD), is listed for each experimen-tal position as a function of time. Second, an analyticalframework is needed to automatically handle, analyse andextract fitness components from each series of populationsize estimates and report the results in a convenient for-mat. There is currently no generally accepted and widelyused standard tool for the conversion of raw growth datainto fitness components. On the contrary, most researchgroups develop their own ad hoc methods, leading to in-accurate, incomparable and incomplete data.Algorithms to calculate growth rates, lag times and
yield have been presented but are either not publicallyavailable [31, 32], or only available as Perl scripts [29] orExcel macros [25] upon request. GrowthRates, is a re-cently published, freely available software for analysinggrowth data [33] but does not contain visualization op-tions for scrutiny of obtained curves in parallel to ex-tracted traits. GATHODE, is a semi-automated opensource software [34] that contains a graphical interface,but it is currently only available as source code and thusprogramming skills are essential for its installation.YODA, is mainly designed for chronological life spananalysis and requires the establishment of a web-server[35]. Several of the above-mentioned tools lack the abilityto correct for the non-linearity of the recorded opticaldensity at higher cell densities, and none of them providea quality measure of growth curves to speed-up andstandardize the downstream analyzes of large data-sets.To simplify analysis and standardize comparisons
between different laboratories in the conversion of rawestimates of microbial population size into accurate fit-ness components, we developed the open source soft-ware PRECOG (PREsentation and Characterization OfGrowth-data) that is ready to be downloaded in a desktopversion, accessed via a web-site or utilized as a web-service (API). PRECOG converts the raw OD data into ac-curate population size estimates, provides quality indices,
extracts fitness components, and presents both processeddata series, i.e. the growth curves, and the extracted fitnesscomponents in a manner that allows easy user-interaction,exploration, and evaluation. PRECOG is designed to han-dle data generated by microcultivation in liquid cultures.However, PRECOG is essentially agnostic with regards toinstrumental platform and requires no prior knowledgeof the experimental design. This allows the user to initi-ate data-analysis immediately after the data acquisitionhas been completed. To enable proper comparison be-tween research groups of experimentally generatedtraits it is essential to standardize procedures betweenlaboratories at many levels, e.g. analytical proceduresfor data pre-processing and feature extraction [36].PRECOG is a first step in our goal to create an exten-sive microbial phenomics framework that streamlinesdata acquisition and standardizes fitness component ex-traction and data visualization, storage and distribution.
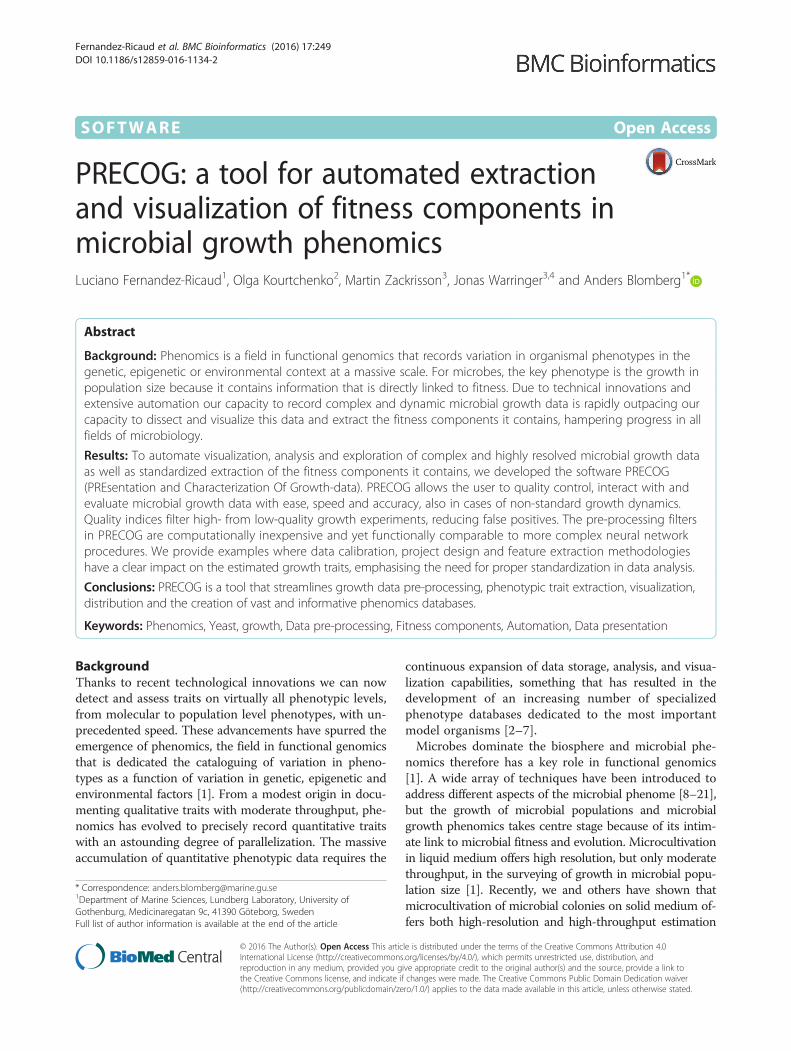
PRECOG implementationThe PRECOG analysis pipeline consists of four steps(Fig. 1a): i) data import, ii) data processing, iii) datavisualization, and iv) data export. PRECOG was initiallydeveloped to process time series of optical density datafrom the Bioscreen C instrument, but similar proxies ofpopulation size from other types of instruments can beused as input.
System overviewPRECOG was implemented using C#, targeting theMicrosoft.Net framework [37], and is accessible as threedifferent platforms. A webserver hosts a website thatoperates as a gateway to PRECOG [38] and it can alsocan be reached via a link from our PROPHECY database[39]. The website hosts the three PRECOG platforms: adesktop application to be downloaded, installed and usedlocally, an online tool at the website and an ApplicationProgram Interface (API)(web service). A table compar-ing the functionalities of the different versions of PRE-COG can be found in supplementary material(Additional file 1: Table S1). Documentation, a video-tutorial, access to publications linked to PRECOG, andcontact details are also available at the website.The desktop application can be installed on any Windows
computer (Windows 7 or higher) from the website via thelink “Desktop Application” on the main menu, or from thedesktop install page [40]. Note that the program workswithout problems when ran on another operating systemusing a virtual machine with Windows installed (e.g.Oracle’s VirtualBox running on a Mac). The desktopplatform offers the richest user experience by providingthe most features, including an intuitive user interface,and rich graphics allowing the user to visualize, explore
Fernandez-Ricaud et al. BMC Bioinformatics (2016) 17:249 Page 2 of 15
and evaluate the processed data. This publication is fo-cused on the desktop application.The online PRECOG platform, called PRECOG-lite, is
a slimmed-down version of the desktop application thatruns on a web-server. By connecting to the webpage, theuser can upload a growth-data file and perform limited ex-ploration of the extracted fitness components and theunderlying population size growth curves. Finally, the usercan download results as text files for further local analyses.The API is a classic web service (responds to HTTP
requests using the SOAP protocol) providing access to
the code underlying raw data processing and fitnesscomponent extraction. This allows more advanced usersto integrate the code employed into their own programs,regardless of operating system or programing language.The API service provides maximum flexibility butminimal visualization capabilities. The API service canbe found at [41].PRECOG will read an input file with several series of
optical density data, pre-process each data series to removetechnical noise and some technical bias, calibrate and con-vert the raw optical density data to actual population sizes,
Fig. 1 PRECOG’s overall design. a The functionality that PRECOG provides is organized as a pipeline that follows four basic steps: step 1 - dataimport, step 2 - data processing, step 3 - data visualization, and step 4 - data export. b Screenshots from the PRECOG desktop application. PRECOG’suser interface is divided into two zones: actions and views. The action zone controls the program’s functions: i) upload data files, ii) setting parameters,iii) experiment selection, iv) graph controls, and v) save data. The views zone presents the data in different displays: vi) table view, vii) thumbnail viewand viii) detailed curve view
Fernandez-Ricaud et al. BMC Bioinformatics (2016) 17:249 Page 3 of 15

flag low-quality curves, extract fitness components andoutput both fitness components and the underlying dataseries (growth curves) for visual exploration and evaluationby the user.All the core functions of PRECOG are stored in a vir-
tual library referred to as the PRECOG engine. This corelibrary is shared by all three versions of PRECOG.
PRECOG desktop applicationUsing the Microsoft’s Windows Presentations Foundation(WPF) framework [42–44], we created a rich user inter-face for the PRECOG engine that functions as a stand-alone Windows client and facilitates the exploration andvisualization of microbial population size estimates.The user interface is divided into two zones: actions
and views (Fig. 1b). The action zone organizes all thesystem operations under an “Actions Tab”. Here the usercan find all the operations available in PRECOG as collaps-ible sections. When the user has imported data files in the“Upload experimental files” window, another tab on theactions zone, “Experimental Runs”, shows the uploadedgrowth-data files as individual experiments. Experimentscan now be explored individually or in batch by selectingthe relevant files. Exploration is performed in the viewszone.PRECOG has three basic user operations: Upload data
files, Save data, and Parameters. The upload data sectionsupports xl~ files and CSV exports generated by BioscreenC instruments, and generic tab-delimited files. Unlike theWeb and API PRECOG platforms, the desktop applicationallows processing and comparison of multiple data sets.The upload data section also allows the user to set specialoptions, like the selection of the rate trait extraction methodor the use of the monotonic filter. The parameters sectionlets the user customize the calibration function thatconverts the recorded optical densities into actual popula-tion size estimates. It also allows the user to specify theblank values that subtracts the background signal. At aminimum, the calibration function should be customized toeach type of instrument and each species of microbes, andthe blank values should be customized to each type of in-strument and each medium. PRECOG allows the user tosave and output data as tab delimited text files. Four typesof data can be exported, as individual runs or in batches ofmore than one run. These are: raw unprocessed data, fullyprocessed population size estimates, first derivatives (slopes)of the fully processed series of population size estimatesand the fitness components extracted from each growthcurve. Growth curves that were manually marked as ex-cluded (see below) will not be included in the export files.Once an imported data file is selected, data will be pre-
sented in the views zone. By default, it opens in the tableview. This shows the fitness components extracted fromeach fully processed series of population size estimates.
Data series are organized column-wise in the input file,with column headers being integer numbers, typicallydenoting position on the experimental plate, beginningfrom 1. Each data series is identified in the display by itscolumn header (Fig. 1b). The table view supports full sort-ing and copy functionality, the latter allowing the user tocopy from PRECOG and paste into other programs, e.g.MS Excel, for further analysis. This view shows the qualityindices of each data series (data series and growth curvewill here be used interchangeably) of fully processedpopulation size estimates, supporting the user in decisionson to what degree the data series should be trusted. Theuser can then mark the data series for exclusion. It is alsopossible to merge multiple rows into a single graph. Thisfeature is useful when wanting to visualize the effect ofmultiple samples at once. The user can change this viewto a more compact display with many individual dataseries included in the same run as individual thumbnails,together with the fitness components extracted from eachseries (Fig. 1b).A double click on a graph thumbnail creates a separate
tab in the view zone with a detailed display of thesample’s growth curve (Fig. 1b). The detailed graph viewallows the user to interact with the data in detail; theuser can perform zoom and pan operations, use logarithmicor non-logarithmic y-axis, and simultaneously visualizeboth the raw optical densities and the fully processed popu-lation size estimates. The system also shows markers in theregion of each data series where the fitness componentswere extracted as metadata (Additional file 2: Figure S1).This allows the user to visually detect and avoid the intro-duction of analytical bias that could confound fitness com-ponent extraction. The detailed graph view has anotheruseful function; it can show the first derivative of the curve.The first derivative maximum should overlap with thegrowth rate metadata markers (Additional file 2: Figure S2).If not, this is a clear indication of analytical errors in the fit-ness component extraction. The detailed graph view, itsunderlying data and the extracted fitness components canbe copy-pasted into other applications.
PRECOG-lite – online versionThe online PRECOG-lite platform is a slimmed-downversion of PRECOG that allows the user to upload a sin-gle experimental file. The raw optical densities will bepre-processed and calibrated as in the desktop applica-tion and the fully processed population size estimateswill be presented as growth curves. These can be saved ina tab-delimited text file. During the upload and processsteps, the user can set several parameters like the onesdetermining the calibration function, the blank value, thegrowth rate trait extraction method and if they want toskip the monotonic filter (Additional file 2: Figure S3).Once the data has been processed, it can be accessed in
Fernandez-Ricaud et al. BMC Bioinformatics (2016) 17:249 Page 4 of 15

the same three formats as in the desktop application: tableview, thumbnail view and detailed graph view (Additionalfile 2: Figure S3). In the online version, potential low-quality curves are flagged for visual inspection by one ormore of the four quality-indices. However, the user cannotin PRECOG-lite mark the curves for exclusion as can bedone in the desktop version.
PRECOG web service – APIThe API version of PRECOG offers access to some ofthe basic functions of the core library (see [45] for anoverview), allowing other developers to use them in theirown programs. The current API implementation is basicand is intended to evolve organically following user input.
Pre-processing filters reducing noise and biasTo remove or reduce random noise and technical bias,PRECOG filters the raw optical densities in a three-stepprocedure. This is done before the background subtractionand the calibration that transform raw optical densitiesinto actual population size estimates. First, a sliding win-dow one-dimensional median filter considers each threeconsecutive data values in the data series, replacing themiddle value with the median of all three. Edge cropping
is avoided by padding (filling the gap by cloning the end-points). Median filters are standard to minimize the im-pact from high amplitude noise at single time points,“spikes”, while preserving the overall data characteristics[46–49]. Optical density spikes originate from lamp fail-ure, heterogeneity in the cell population, electronic inter-ference, dust particles or sudden change in light influxfrom the environment. In the evaluated test data series,spikes affected about 4 % of 90,000 growth curves.Whereas the median filter effectively removed spikes atsingle time points (Fig. 2; upper two graphs), it failed toremove the rare “wide spikes” that extended over mul-tiple consecutive time-points (Fig. 2; lower two graphs).Low amplitude but high frequency noise is challenging
to remove. Standard signal analysis instead seeks tominimize the influence of such noise by smoothingseries of signals, accepting that also data that is close tothe truth are subject to minor adjustments [47–50].After the median filtering, PRECOG therefore employs aone-dimensional mean filter in a sliding window thatconsiders three consecutive data values. The middlevalue in each window is replaced by the mean over thethree values in the series. The smoothing is amongthe lightest employed in signal analysis, accepting that
Fig. 2 Effects of data pre-processing. Effects of different types of noise in the raw data (red line) on the fully (black line) or partially (green line)processed data, the latter without the mean filter that removes spikes. If spikes are not removed, as in the case of wide spikes consisting of morethan one data point, the processed data will be distorted (as seen in the lower two graphs). Figures are screenshots from PRECOG.
Fernandez-Ricaud et al. BMC Bioinformatics (2016) 17:249 Page 5 of 15

some noise may penetrate in order not to distort thetrue data trends.Neither the median nor the mean filter is capable of
accounting for the strongly confounding noise and biasassociated with collapsing growth curves. Curve collapsesfollow from the sudden emergence of dramatic heterogen-eity in microbial populations, typically due to bubbleformation, cell-cell cohesion leading to aggregates, or well- wall adhesion leading to deprivation of cells in the cen-tral well area. Curve collapses are associated with drasticdrops in cell density, often followed by equally drastic in-creases when bubbles and cell aggregates drift stochastic-ally in and out of light beams. PRECOG, as a thirdfiltering step, sweeps each data series and enforces datamonotonicity by replacing any values lower than its prede-cessor with the predecessor itself (Fig. 2). Given that theenforcement of monotonicity has been preceded by bothmedian and mean filtering, its effects are restricted to re-moving or reducing abnormalities in collapsing curves. Arelevant note of caution is that there might be naturallyoccurring biological phenomena that result in a negativenet growth (curve collapses), e.g. bacterial cultures beingtreated with cell lysing agents like certain antibiotics, orbeing exposed to changing osmotic pressure or starvation,with associated cell lysis and/or autophagocytosis. To makepossible studies of these phenomena using PRECOG, thereis an option where the monotonicity filter can be excluded.
Background/blank subtraction and data calibrationThe last pre-processing steps before the fitness compo-nents are extracted are the blank subtraction and thecalibration adjustment. The blank value, provided by theuser, is subtracted from every data point in the dataseries. This effectively removes the background signal onthe assumption that the background is constant acrossall experimental positions. Recorded optical densities donot increase linearly with cell densities because of an ac-celerating cell shielding effect against light at higherdensities. This is typically detectable at OD > 0.3 [25]. Sam-ple dilution is not logistically feasible in high-throughputgrowth phenomics; thus, recorded optical densities have tobe analytically transformed into actual population size esti-mates. The transformation uses an empirically establishedcalibration function that should be separately establishedfor each species and instrument type. For the Bioscreen Cinstrument, a calibration function has been calculated andapplied to correct for this effect. The function is valid formost lineages and physiological states of the model yeastSaccharomyces cerevisiae [25] and is offered as default.
The default procedure for fitness component extractionThe traditional view of the microbial population sizegrowth curve postulates an initial lag phase of no net in-crease in cell number, an exponential phase where net
increase in cell number is positive and constant and a sta-tionary phase of no net increase. These phases are sepa-rated by acceleration and deceleration phases that typicallyare disregarded in the analysis. The inevitable final phase ofnet death, which rarely is initiated within the time-frame ofa typical experiment, also tends to be overlooked. In thistraditional view, the three fundamental fitness componentsis the length of the lag phase, the rate of growth in the ex-ponential growth phase and the total gain in populationsize up until growth ends in the stationary phase. The latterreflects the efficiency with which the limiting resource hasbeen converted into population size growth. PRECOG ex-tracts these three fitness components, using the algorithmsearlier presented [25], in the following way:The growth lag is extracted from population size esti-
mates, presented on the log-scale as the intercept betweenthe initial population size and the line extrapolated frommaximum growth. PRECOG calculates the mean of thefirst five population-size estimates, providing a robustmeasure of the initial OD. PRECOG then calculates thetime for all the intercepts between the initial mean valuesand every slope. Slopes are obtained in a moving windowof eight time-points, departing from the beginning of thecurve and proceeding to the end. The fitness componentlag time is estimated as the mean of the two largest inter-cepts and is expressed in hours.The growth rate, expressed as population size doubling
time, is extracted from the highest of many short slopesin the exponential growth phase and converted intopopulation doubling time. The first three hours of thecurve is excluded to avoid obtaining slopes correspondingto cell size increases when cells exit from the starved G0state and recapture a size that is permissive for cell division.Then it takes the logarithm (base 10) of the remaining datapoints and calculates the slopes in a moving window ofthree time-points. Slopes are ranked based on their valuesand the two highest slopes are discarded in order tominimize the effect of any remaining artefact outliers. Fromthe remaining slopes, the mean of the five highest is formed�xhighest slopes� �
and converted into doubling time (in hours).
The growth efficiency is extracted as the total increasein population size, from the smallest to the largest popula-tion sizes, given that growth has actually ceased whenpopulation size is maximal. The mean of the two smallestmeasurements �xbaseð Þ and the mean of the six highestmeasurements �xtop
� �defines the interval such that the ef-
ficiency is estimated as �xtop − �xbase . No estimate of effi-ciency is given if the standard deviation of the six highestOD measurements divided by �xtop
� �is greater than 0.02,
corresponding to a rough distinction between curves thathave and have not reached a stationary phase.PRECOG also provides an alternative algorithm for
growth rate extraction that is less prone to overestimate
Fernandez-Ricaud et al. BMC Bioinformatics (2016) 17:249 Page 6 of 15

the growth rate when growth curves are noisy and morerobust when data are sparse. The algorithm performslinear regressions in a window of five time points thatslides along the curve, extracting slopes from the regres-sion models and converting the highest slope into doub-ling times.
Quality indicesAutomatic evaluation of the quality of the data series ofpopulation size estimates is challenging because bothhigh-quality data series, that should be retained, andlow-quality data series, that should be rejected, varygreatly in their growth dynamics and types of technicalerrors (Additional file 2: Figure S4, Figure S5). To distin-guish high from low quality growth curves given thisvariability, PRECOG establishes four quality indices(QI), based on the raw data series, that together esti-mates curve quality. The indices are QI1, “overall noisi-ness” in the form of the average fit of regression lines tothe data along the curve, QI2, “local noisiness” based onlocal regions with poor fit of regression lines to the dataalong the curve, QI3, “number of spikes” that identifiesshort, dramatic increases in data values and QI4, “curvecollapses” that identifies curves with sudden and sus-tained drops in data values. Conceptually, these phe-nomena are all incompatible with accepted models oftrue growth curve dynamics. High values in one or moreof the quality indices therefore suggest technical prob-lems and identify data series that should be visuallyinspected by the user for possible exclusion.For the QI1, “overall noisiness”, we exclusively consider
the noise in the growth phase of the curve, by calculatinglinear regression over a five-point sliding window withslope k > 0.07. QI1 is defined as 1 - the average coefficientsof determination, r2, of the data in all such windows totheir respective linear regression, and provides a measureof the overall noisiness in a data series.The QI2, “local noisiness” uses the same principle as
QI1 but only considers high local variation of the growthdata. QI2 is defined as 1 - the average of the three worstcoefficient of determination, r2, of the linear regressions.Thus, it indicates the existence of very noisy regions.The QI3, “number of spikes”, estimates the number of
spikes in the growth curve. The QI3 index is initially cal-culated in the same way as the QI2. However, here PRE-COG counts the number of r2 values that are less than0.5. From practical experience we have seen that thisindex shows how many sharp bends the curve has, thusbeing an indication of the number of spikes.The QI4, “curve collapses”, measures the magnitude of
the corrections done to the raw growth curve. The QI4index is calculated by comparing data series before andafter filtering with the monotonic filter. We obtain QI4as the sum of the absolute differences between the data
series, over all time-points. Large correction values reflectcurves that have collapsed in late exponential or stationaryphase. These are rarely captured by other quality indices.
MethodsEstablishing the calibration functionTo make the species-specific calibration functions tocorrect higher OD values, cells were grown overnight tostationary phase in synthetic defined media; YNB with 2 %(w/v) glucose for the various yeast species and LB mediumfor Escherichia coli. The stationary phase cultures werex1.5 serially diluted in the corresponding growth media tofinally reach 15 dilution-steps, and the whole series ofdilutions measured in the Bioscreen instrument. Theblank-corrected diluted OD values and the blank-correctedundiluted OD values are for practical purposes indistin-guishable up to OD ≈ 0.3, and above this value the true ODvalues were calculated using the corresponding dilution fac-tor and the diluted samples (OD < 0.3). A blank value wasestimated on only media without cells, and this value wassubtracted from all other measured OD values. Using thepreviously established formula for calibration, y = x + cx3
[51], which assumes a near 1:1 linearity for low OD, the fol-lowing values for c were found: Candida albicans: c =0.5790256635480614, Pichia pastoris: c = 0.5653284345804932, Schizosaccharomyces pombe: c = 0.64672463774234579, and E. coli: c = 0.75389848795692815. For S. cerevi-siae we obtained c = 0.82673123484708266 which is veryclose to the earlier established and since long used c valuefor this species, 0.8324057 [19, 51]; for consistency reasonswe will stay with the old c value.
ResultsFlagging low-quality data series for manual inspectionand exclusionTo evaluate the performance of PRECOG, we created twobenchmarking sets of 100 high- and 100 low-qualitygrowth curves. Curves in the high-quality set are technic-ally of good standard and capture a wide range of true bio-logical properties, including individual and combinedeffects on each of the classical fitness components growthlag, rate and efficiency, as well as multimodal growth.Multimodal growth corresponds to multiple phases of ele-vated growth (Additional file 2: Figure S4 and data S1).Growth curves in the low-quality set represent a variety ofamplitudes and frequencies of technical noise (Additionalfile 2: Figure S5 and data S2); roughly half of the curves inthis benchmarking set are completely dominated by tech-nical error and should be rejected. We believe that thesetwo benchmarking sets could be generally valuable in mi-crobial phenomics for performance tests of growth algo-rithms and software. The two benchmarking sets can bedownloaded from [52].
Fernandez-Ricaud et al. BMC Bioinformatics (2016) 17:249 Page 7 of 15

Growth curves are quality filtered by PRECOG in asemi-automated procedure. The first step is the auto-matic calculation of quality indices based on four curvefeatures. The second step is manual scrutiny of indicatedproblematic curves for possible exclusion. The four qualityindices are QI1; “overall noisiness”, QI2; “local noisiness”,QI3; “number of spikes” and QI4; “curve collapses”. Thus,the four indices capture different types of technical prob-lems encountered, and one should not expect all indicesto flag for low quality of a particular problematic curve.Low-quality data series evading the four quality indicesmay result in extractions of incorrect fitness components.On the other hand, false flagging of high-quality data
series results in an excessive workload on the operator, interms of manual inspection.To find the optimal breakpoint for what to flag and
what not to flag, we evaluated six thresholds for eachquality index: flagging the worst 0.5, 1, 2.5, 5, 10 and 15 %of data series on almost 90,000 growth curves, the aggre-gated 90 k set, generated over many years and by severaldifferent experimentalists in our lab (Fig. 3). Each thresh-old was then tested on the two benchmarking sets toevaluate false positives and false negatives. We found thenumbers of false positives, in the high-quality set, andfalse negatives, in the low-quality set, to be lowest atthe 5 % flagging level for each QI in the aggregated 90 k
Fig. 3 Filtering data using PRECOG’s quality indices. a Data is filtered using four quality indices, QI1 - “overall noisiness”, QI2 - “local noisiness”,QI3 - “number of spikes”, and QI4 - “curve collapses”. Upper panels: performance of each quality filter on the “aggregated 90 k set”, including almost90,000 growth curves. x-axis shows QI score, y-axis shows number of growth curves flagged at each QI score setting. Blue bars = non-cumulativeflagging, red line = cumulative flagging, dashed black line = selected QI score setting that flags a cumulative 5 % of curves. Lower panels: performanceof the QI filter (QI score, y-axis) on the two selected benchmarking sets of 100 high- and 100 low-quality curves (x-axis). Dashed horizontal lines:performance at the 5 % rejection threshold selected based on the “aggregated 90 k set” growth curves. b Summary performance of all quality indices.Number of curves that obtain 0, 1, 2, 3 and 4 flags in the “aggregated 90 k set” at the selected threshold, where each quality index flags the worst 5 %of growth curves, i.e. 90 % of all curves were not scored by any of the quality indices while 2 % were scored by all four. c Summary performance of allquality indices. Number of QI flags in the high- and low-quality benchmarking sets. Colours indicate quality index responsible for the flagging, withblue = QI1, red = QI2, green =QI3 and purple = QI4. d Number of false positives and negatives in the two benchmarking sets, as a function of usingvarious thresholds from the “aggregated 90 k set”
Fernandez-Ricaud et al. BMC Bioinformatics (2016) 17:249 Page 8 of 15
set (Fig. 3d). At this threshold the low-quality curves wereeasily distinguished by the quality indices; only one curveescaped all four quality-indices. None of the high-qualitycurves were flagged at the 5 % threshold. It was also clearthat different quality indices captured different curveproblems (Fig. 3c); only 39 % of the low quality curveswere flagged by all four quality indices while roughly 11 %were captured by only one quality index. The flaggedcurves can be visually inspected in PRECOG in a semi-automated manner, allowing fast operator decisions onwhich flagged curves to accept and reject. Non-flaggedcurves are automatically accepted and included in thedownstream analysis.
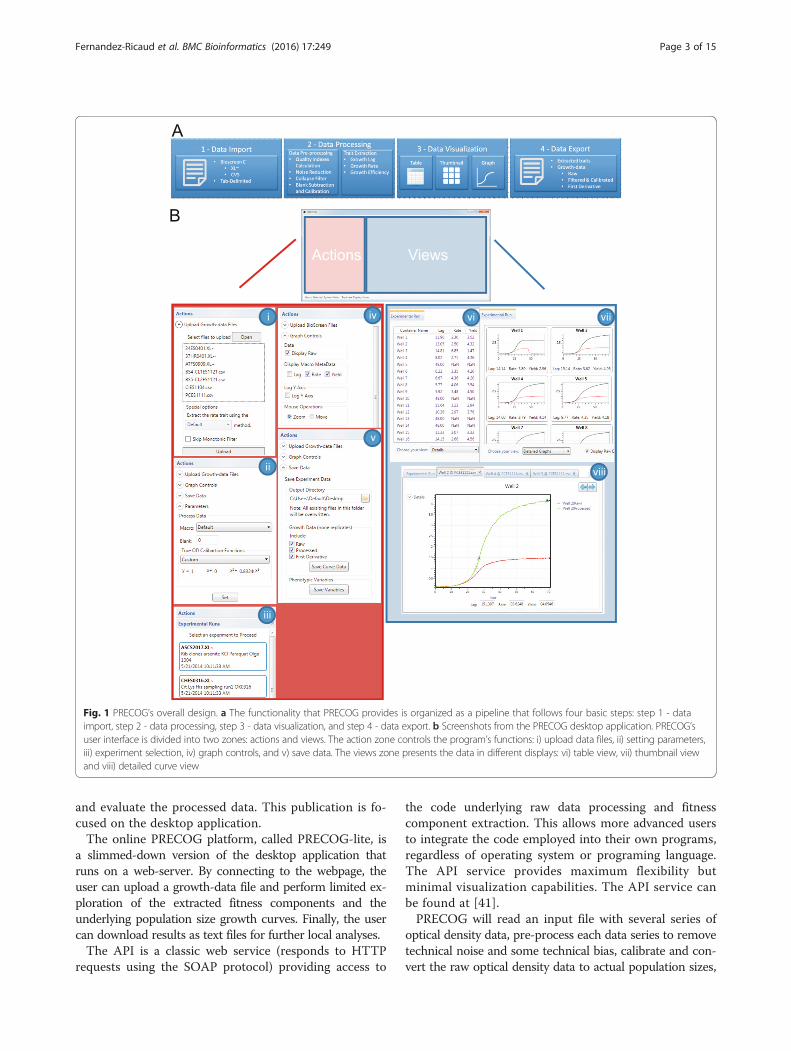
Benchmarking PRECOG’s pre-processing data filters forminimizing noiseTo remove or reduce noise and bias, PRECOG filters theraw optical densities in a three-step procedure. PRECOG’s
data filtering is computationally inexpensive and thereforepossible to employ on a very large scale, and addresses thevast majority of technical errors manifesting in data series.We tested PREGOG’s data filtering by comparing its per-formance to a multi-layered neural networks noise reduc-tion filter. Neural networks have been used for many yearsas a reliable tool to solve noise reduction problems [53, 54].A multi-layered neural network, iterated 500x to excludeoutliers (remove noise), did not perform better than thethree-step PRECOG data filtering process (Fig. 4). Fitnesscomponents, extracted following the data processing by thetwo methods, were nearly identical for high-quality curves(r2, lag = 0.9938, rate = 0.9976, efficiency = 0.9997) and cor-related well also for low-quality curves (r2, lag = 0.7868,rate = 0.7465, efficiency = 0.991); if the really bad curvesflagged for all four QI:s were excluded the correlations wereeven better (r2, lag = 0.9716, rate = 0.9762, efficiency =0.9933). Visual inspection of low-quality data series where
Fig. 4 Benchmarking of PRECOG’s default data cleaning algorithm. We compared PRECOG’s pre-processing filters against a computationallydemanding neural network pre-processing procedure. After the pre-processing, the fitness components growth lag, growth rate and growthefficiency were extracted by PRECOG’s standard procedure from the high- (left panel) and low-quality (right panel) benchmarking sets, andcompared. Low-quality curves are in the right panel marked (green with a red mark) if flagged by all four quality-indices (thus, indicatingcurves of really low quality)
Fernandez-Ricaud et al. BMC Bioinformatics (2016) 17:249 Page 9 of 15
noticeably different outcomes were observed, failed to es-tablish a pattern of consistent superior performance of anyone filtering method. The computational inexpensivenessof PRECOG’s three-step data pre-processing thereforespeaks emphatically in its favor.
The importance of calibration to convert optical densitiesinto population size estimatesThe optical density of cultures is easy to measure and canbe implemented in automated procedures, which is why ithas become a standard way of estimating changes in high-throughput microbial population size studies. Calibration ofrecorded optical densities into population size estimatesdrastically adjusts the shape of recorded growth curves, sug-gesting a potentially profound distortion of fitness compo-nents extracted by softwares failing to employ thisprocedure (Fig. 5). To evaluate to what degree fitness com-ponents are confounded by failure to calibrate, we com-pared fitness components extracted from the high-qualitybenchmarking set, before and after calibration (Fig. 5b). Dis-tortions in the form of a systematic underestimation of lagphases, corresponded to 15 % shorter lags than reality, andsystematic overestimation of population doubling times,corresponded to 25 % slower growth than reality, were sub-stantial. In the case of growth efficiency, the systematic un-derestimations from non-calibrated data were outrightcatastrophic, with a mean of 61 % lower estimates thanreality (Fig. 5b). Thus, calibration of recorded optical dens-ities is absolutely essential and should never be overlooked.PRECOG allows the user to choose between calibration
functions stored centrally or to enter functions establishedempirically by the individual laboratory. It is clear from ourexperimental data that different organisms require differentcalibration functions (Fig. 5c). For example, the relation be-tween observed optical density and actual population size isvery different in the fission yeast S. pombe than in the bud-ding yeast S. cerevisiae. In this context it should be men-tioned that OD is influenced by other factors besides cellnumber, like the volume and biomass of each cell, absorp-tion from internal molecules, the shape of individual cellsand cell aggregation. This means that OD measurementsare most effective in comparing microbial cultures forwhich other properties that affect light transmission areidentical. Thus, OD should always be seen as a proxy forthe microbial population size, and interesting phenomenashould ideally be confirmed by alternative cell-countingmethods, like microscopy or FACS, for which the biasesare different. The impact from the calibration functionwill especially be great for the extraction of growth effi-ciency, as calibration functions deviate more from linearityat higher optical densities. PRECOG enables users to entercalibration functions established by comparing opticaldensities of diluted and non-diluted microbial samplesover a range of densities [25] (see Methods section for a
more detailed description of experimental and analyticalprocedures for establishing valid calibration functions).
Fitness component extraction and frequency of samplingPRECOG extracts the three canonical fitness componentsassociated with net growth of microbial populations; lengthof the initial lag phase, in which no net growth occurs,maximal rate of growth (specifically: minimum populationdoubling time) in the phase when net growth is positive,and the total gain in population size, given that a stationaryphase of no further net growth has been reached at themaximum population size. Stationary phase is almost ex-clusively entered because one resource, typically energy ornitrogen, has been depleted, and the population size yieldtherefore represents the efficiency with which this resourcehas been converted into population growth. PRECOG alsotracks the data points used to extract each fitness compo-nents as associated metadata, allowing stringent userevaluation of the reliability of each extracted fitness com-ponent (Additional file 2: Figures S1, S2).The primary experimental settings that operators need
to decide on prior to experiment start are frequency ofdata measurements and total number of data measure-ments. Together, these parameters define the length of anexperiment. We evaluated the influence of varying the datameasurement frequency on extracted fitness componentsin a standard 72h experiment, using the two benchmarkingsets. While growth efficiency and lag were largely un-affected by realistic frequency changes (Additional file 2:Figure S7), minimum population doubling times were sys-tematically and continuously overestimated when datameasurements were less frequent (Fig. 6a, upper panel).Minimum population doubling times typically occur earlyin the net growth phase. As data measurement frequencydecreases, minimum population doubling times are in-creasingly based on data points from later in the netgrowth phase, where slopes are less steep and the exponen-tial growth assumption increasingly incorrect (Additionalfile 2: Figure S6).We also tested an alternative method for rate extrac-
tion, based on a single linear regression over five con-secutive time-points, expecting it to have a lower degreeof dependency for alterations in frequency of sampling.Indeed, we found that the tendency towards overestimatingtrue minimum population doubling times at lower meas-urement frequencies was somewhat less severe when linearregressions over five consecutive time-points were consid-ered (Fig 6b). Comparing the two growth rate extractionmethods on high frequency sampled data, we found nearperfect correlation (r2 = 0.9966) over the whole range ofgrowth rates in the high-quality data set (Fig. 6b), but aslight, systematic tendency for extraction of shorter mini-mum population doubling times using linear regression.This tendency was substantially stronger in the low-quality
Fernandez-Ricaud et al. BMC Bioinformatics (2016) 17:249 Page 10 of 15

data set, where the correlation was also less impressive(Fig. 6b; lower graph). The discrepancy between thetwo methods primarily originated from the defaultmethod, based on the mean of many high slopes, dis-carding the two highest slopes; when including the twohighest slopes in the growth rate extraction, the correl-ation between methods was excellent (r2 = 0.9705) and
the systematically faster growth extracted using linearregression disappeared (data not shown). We concludethat for high-frequency sampled growth data, maximalpopulation doubling time estimates are mostly inde-pendent of which of the two methods are used. In PRE-COG the user can select the preferred growth rateextraction method.
Fig. 5 Fitness components extraction from calibrated and non-calibrated growth curves. Fitness components were extracted from the high-qualitybenchmarking set of growth curves. a Example curves for each of the fitness components extracted (growth lag, rate and efficiency). For each estimatedfitness component, markers (red triangles = non-calibrated data, black circles = calibrated data) indicate the data underlying that estimate. b Correlationbetween calibrated and non-calibrated data. Dotted line indicates the 1:1 relation. c Calibration function for different organisms. Recorded optical density(x-axis) and actual population size (density), as reflected in the OD recorded for a diluted cell suspension and multiplication with the dilution factor (y-axis),is shown
Fernandez-Ricaud et al. BMC Bioinformatics (2016) 17:249 Page 11 of 15

DiscussionEstimation of phenotypes is central in experimental lifesciences. Advancing the speed and accuracy with whichphenotype estimation can be achieved is therefore criticalto scientific progress. Although phenomics still lags be-hind genomics [55], the throughput of phenotypic data ac-quisition has now, for a wide set of model organisms,advanced to a degree that data analysis, standardization,visualization and validation are becoming critical bottle-necks. The computational challenge is amplified by thatmany phenomics instruments, each with their own noiselevels, biases and limitations that need specific attention,are in use without unified industry standards [36]. Con-cerns over the reproducibility, comparability and accessi-bility of the vast resources of phenotypic data are alsobeing voiced by an increasing fraction of the life sciencecommunity [56–59].Variation in experimental designs in terms of genetic
background, environmental factors, media compositionand instrumental set-up is essential, both for exploringthe full width of biological phenomena and for establish-ing the general validity of conclusions across widerswaths of the experimental space. This variation is bene-ficial and leads to that more of the phenotypic space isexamined. Nevertheless, standardization in the down-stream analysis is required in order to allow strict compari-sons across platforms, verification of the reproducibilityand general validity of conclusions, and simplifying data
mining for third parties. We hope that PRECOG can playsuch a standardising role.Currently, phenotypic data is mostly presented using
free text combined with controlled vocabularies, like theYeast Phenotype Ontology [60]. However, the qualifiersused, e.g. arrested, delayed, decreased, increased, andnormal, imply the direction of change relative some typeof reference but lacks quantitative definitions in terms ofeffect-sizes, the confidence with which conclusions havebeen established, and the conditions under which theywere found to be true [4]. This certainly leaves muchroom for improvement [61], including the use of properreferences, quality assessment of data, calibration, stan-dardized software data processing and fitness compo-nent extraction, and correctly accounting for noise andbias.PRECOG is first and foremost an effort in the direc-
tion of standardized data processing and fitness compo-nent extraction. Additionally, PRECOG aims to simplifydata analysis, visualization and evaluation for users thatlack the experience, time, and computational expertise todevelop the tools required to achieve these tasks. Mostcommercial software dedicated to analysing growth curveshave built-in capacities to extract various variables, suchas the maximum signal intensity, the maximum slope, orthe integral under the curve. Unfortunately, these built insoftware features typically extracts variables from rawgrowth curve data, i.e. without any calibration to obtain
Fig. 6 Comparing two algorithms for extracting doubling time. a Effect of sampling frequency on doubling time. Sampling frequency denotesthe fixed time (interval) between consecutive measurements. At the start of the experiment the user sets the sampling frequency: PRECOG’s defaultalgorithm (upper panel), the algorithm based on linear regression (lower panel). Averages from the high- and low-quality sets are indicated. b Doublingtimes extracted from data with 20 minute sampling intervals (our default value) for the high- (upper panel) and low-quality (lower panel) benchmarkingsets are shown for the two algorithms
Fernandez-Ricaud et al. BMC Bioinformatics (2016) 17:249 Page 12 of 15

true estimates of population size and without smoothingof population sizes to minimize noise and bias. As shownin Fig. 5, this will result in grossly misleading results.Moreover, the specifics of the procedures for variable ex-tractions are rarely published for proprietary reasons andare not comparable across either programs or versions ofprograms, leading to severe issues with reproducibility be-tween various laboratories and over time. PRECOG withits implemented calibration functions and transparent fea-ture extraction procedures thus facilities automated pro-cessing of microbial growth phenomics data in a mannerthat provides high accuracy, minimizes risks for false posi-tive and negatives, allows the user to visualize and evaluateindividual data series such that extracted fitness compo-nents can be directly connected to the underlying growthcurves, and provides easy and standardized exportingfunctions. Overall, we found that the established analysispipeline handles high-quality curves well, with no operatorintervention needed, whereas low-quality growth curvespose challenges that cannot easily be overcome in an au-tomated fashion. We partly solved this by flagging low-quality data series for operator inspection and potentialrejection, using a series of quality indices. We delegate thedecision to the operator as to what is the best overall strat-egy, with regards to rejecting or accepting questionabledata series. Ideally, experiments should be designed withsufficient replication such that rejection of even a ratherhigh fraction of growth curves as being of too low qualitywould not challenge the statistical integrity of the analysis.In reality, few experimental designs are replicated at alevel where rejecting of substantial amounts of data seriescan be done without painful costs. This calls for furtheradvancements in throughput, and perhaps a refocusingfrom number of distinct samples to number and ran-domization of replicates of these samples. Downstreamanalysis of obtained growth data will naturally involvesound statistics. Certain replicates might in these statis-tical analyses be scored as outliers; if these correspond tocurves showing quality warnings that would be an excel-lent base for exclusion.As with any method, there are room for future improve-
ments of the PRECOG platform. We currently make pooruse of the richness of the data acquired, restricting fitnesscomponents extraction to the lag, rate and efficiency ofgrowth. These parameters only reflect a fraction of thegrowth information in the data accumulated. Focus onthese fitness components are partially motivated by theestablished standard model of growth, assuming distinctlag and stationary phases that are separated by a long ex-ponential phase. This standard model is at best a verycrude approximation of a complex and very diverse reality,where growth often rapidly becomes limited by externalfactors and therefore switches from exponential to lineargrowth, or where serial use of nutrients or handling of
toxins promotes diauxic rather than unimodal growth[62]. Fitness, in terms of a genotypes’ frequency increaserelative other genotypes, are naturally affected by itsperformance in each of these phases. Fitness compo-nent extraction would therefore certainly benefit from aconceptual re-think. Full exploitation of the first deriv-ate of growth is a natural first step in this direction.Expanding fitness component extraction requires carefulattention to the particular biases that affect the differentphases of growth, with systematic differences betweenmeasurement positions on an experimental plate and therelative impact of different normalization procedures ap-plied to account for these constituting key questionmarks.
ConclusionTo summarize, we here launch the tool PRECOG that willpromote simplicity, transparency and standardization inmicrobial growth phenomics, and provide a portal withthe standalone software and online tools so that othermicrobiology labs can easily upload, assess and visualizetheir growth data. Data may then be further distributed tostandard repositories, like the SGD [4] and PROPHECYdatabases [63, 64].
Availability and requirementsProject name: PRECOGProject home page: http://precog.lundberg.gu.se/Operating system(s): Desktop Application: Windows;Online version: Platform Independent; API(Web service):Platform IndependentProgramming language: Microsoft C#Other requirements: Dot Net framework 4.5 or higherLicense: EULAAny restrictions to use by non-academics: Software isfree for non-commercial users.The high-quality set is included as Data S1.The low-quality set is included as Data S2.
Additional files
Additional file 1: Table S1. Feature comparison of the differentPRECOG platforms. (DOCX 17 kb)
Additional file 2: Figure S1. Meta data to evaluate the extractedfitness components. Markers indicate data used for estimation of growthlag (purple circles), rate/doubling time (black cross), and efficiency (greentriangles). Figures are screen shots from PRECOG. Figure S2. Displayingthe first derivative of growth. X’s mark the samples where the doublingtime was extracted, which coincides with the first derivative peak. Allowsthe user to identify curves where there are difficulties in extracting traits,like curves exhibiting multimodality (B and C). Figures are screenshotsfrom PRECOG. Figure S3. PRECOG-lite website screenshots. (A) upload, B)table view, C) thumbnail view, D) a detail view of the growth-data, E) theSave As allows the user to save the data in its different forms (growth-data, first derivate, and extracted traits). Figure S4. High-quality bench-marking set of growth curves. The 100 growth curves of high quality dis-playing various growth feature, i.e. difference in growth lag, rate and
Fernandez-Ricaud et al. BMC Bioinformatics (2016) 17:249 Page 13 of 15
efficiency as well as combinations of these. The set also include curvesthat are clearly multimodal. Red = raw data, Black = fully processed data.All curves are displayed on the log scale (y-axis). Figure S5. Low-qualitybenchmarking set of growth curves. The 100 growth curves of low qual-ity, representing various technical challenges, e.g. curves with high levelsof noise, frequent spikes and collapsing curves. Red = raw data, Black =fully processed data. All curves are displayed on the log scale (y-axis). Fig-ure S6. First derivative of growth curves with various sampling frequen-cies. First derivative is displayed indicating times for measurements (redcircles), and data used for estimation of growth rate (crosses). Figure S7.The effect of sampling frequency on growth lag (upper panel) and effi-ciency (lower panel). Sampling frequency denotes the fixed time (interval)between consecutive OD measurements. Averages from the high- andlow-quality sets are indicated. (PDF 452 kb)
AcknowledgementWe thank Peter Dahl for excellent technical help with establishing thecalibration functions. Financial support from the Swedish Research CouncilFORMAS (216-2013-549) to AB, and from the national Bioinformatics in LifeSciences (BILS) to LFR, is acknowledged.
Authors’ contributionsLF developed the PRECOG software (wrote the code) and created thewebsite. OK, MZ, JW and AB defined the user requirements for the software.LF, OK and AB contributed to the design of the software. OK and AB testedthe software. LF and OK contributed to the tutorial on the website. LFanalysed and produced the data for the Results section in the manuscript.OK and JW provided the experimental data. LF and AB made the first draftof the manuscript, and together with JW and MZ contributed to the finalversion. All authors read and approved the final manuscript.
Competing interestThe authors declare that they have no competing interests.
Author details1Department of Marine Sciences, Lundberg Laboratory, University ofGothenburg, Medicinaregatan 9c, 41390 Göteborg, Sweden. 2Department ofMarine Sciences, University of Gothenburg, P.O. Box 461, SE 405 30Göteborg, Sweden. 3Department of Cell and Molecular Biology, LundbergLaboratory, University of Gothenburg, Medicinaregatan 9c, 41390 Göteborg,Sweden. 4Centre for Integrative Genetics (CIGENE), Department of Animaland Aquacultural Sciences, Norwegian University of Life Sciences, PO Box5003, 1432 Ås, Norway.
Received: 27 January 2016 Accepted: 9 June 2016
References1. Warringer J, Blomberg A. Yeast Phenomics-Large-scale Mapping of the
Genetic Basis for Organismal Traits. In Hancock JM, editor. Phenomics. CRCPress; 2014. p.172–207.
2. Blake JA, Bult CJ, Eppig JT, Kadin JA, Richardson JE, Airey MT, Anagnostopoulos A,Babiuk RP, Baldarelli RM, Baya MJ, Beal JS, Bello SM, Bradt DW, Burkart DL,Butler NE, Campbell JW, Corbani LE, Cousins SL, Dahmen SJ, Dene H, Diehl AD,Forthofer KL, Frazer KS, Geel DB, Hall MM, Knowlton M, Lewis JR, Lu I, Maltias LJ,McAndrews-Hill M, et al.: The Mouse Genome Database genotypes::Phenotypes.Nucleic Acids Res 2009, 37(SUPPL. 1):D712-9.
3. de la Cruz N, Bromberg S, Pasko D, Shimoyama M, Twigger S, Chen J,Chen C-F, Fan C, Foote C, Gopinath GR, Harris G, Hughes A, Ji Y, Jin W, Li D,Mathis J, Nenasheva N, Nie J, Nigam R, Petri V, Reilly D, Wang W, Wu W,Zuniga-Meyer A, Zhao L, Kwitek A, Tonellato P, Jacob H. The Rat GenomeDatabase (RGD): developments towards a phenome database. Nucleic AcidsRes. 2005;33(Database issue):D485–91.
4. Engel SR, Balakrishnan R, Binkley G, Christie KR, Costanzo MC, Dwight SS,Fisk DG, Hirschman JE, Hitz BC, Hong EL, Krieger CJ, Livstone MS,Miyasato SR, Nash R, Oughtred R, Park J, Skrzypek MS, Weng S, Wong ED,Dolinski K, Botstein D, Cherry JM: Saccharomyces Genome Databaseprovides mutant phenotype data. Nucleic Acids Res 2009;38:D433-6.
5. Zhao H, Yao W, Ouyang Y, Yang W, Wang G, Lian X, Xing Y, Chen L, Xie W.RiceVarMap: a comprehensive database of rice genomic variations. NucleicAcids Res. 2015;43(Database issue):D1018–22.
6. Sakurai T, Satou M, Akiyama K, Iida K, Seki M, Kuromori T, Ito T, Konagaya A,Toyoda T, Shinozaki K. RARGE: a large-scale database of RIKEN Arabidopsisresources ranging from transcriptome to phenome. Nucleic Acids Res. 2005;33(Database issue):D647–50.
7. Yemini E, Jucikas T, Grundy LJ, Brown AEX, Schafer WR. A database ofCaenorhabditis elegans behavioral phenotypes. Nat Methods. 2013;10:877–9.
8. Wouters BJ, Löwenberg B, Delwel R. A decade of genome-wide geneexpression profiling in acute myeloid leukemia: flashback and prospects.Blood. 2009;113:291–8.
9. Harrison PW, Wright AE, Mank JE. The evolution of gene expression and thetranscriptome-phenotype relationship. Semin Cell Dev Biol. 2012;2:222–9.
10. Nachtomy O, Shavit A, Yakhini Z. Gene expression and the concept of thephenotype. Stud Hist Philos Sci Part C Stud Hist Philos Biol Biomed Sci.2007;38:238–54.
11. Holmes E, Loo RL, Stamler J, Bictash M, Yap IKS, Chan Q, Ebbels T,De Iorio M, Brown IJ, Veselkov KA, Daviglus ML, Kesteloot H, Ueshima H,Zhao L, Nicholson JK, Elliott P. Human metabolic phenotype diversity andits association with diet and blood pressure. Nature. 2008;453:396–400.
12. Schilling CH, Edwards JS, Palsson BO. Toward metabolic phenomics: analysisof genomic data using flux balances. Biotechnol Prog. 1999;15:288–95.
13. Walter T, Shattuck DW, Baldock R, Bastin ME, Carpenter AE, Duce S, Ellenberg J,Fraser A, Hamilton N, Pieper S, Ragan MA, Schneider JE, Tomancak P, HérichéJ-K. Visualization of image data from cells to organisms. Nat Methods. 2010;7(3Suppl):S26–41.
14. Montes JM, Melchinger AE, Reif JC. Novel throughput phenotyping platformsin plant genetic studies. Trends Plant Sci. 2007;12:433–6.
15. Vizeacoumar FJ, Van Dyk N, Vizeacoumar FS, Cheung V, Li J, Sydorskyy Y,Case N, Li Z, Datti A, Nislow C, Raught B, Zhang Z, Frey B, Bloom K, Boone C,Andrews BJ. Integrating high-throughput genetic interaction mapping andhigh-content screening to explore yeast spindle morphogenesis. J Cell Biol.2010;188:69–81.
16. Vyssotski AL, Serkov AN, Itskov PM, Dell’Omo G, Latanov AV, Wolfer DP,Lipp H-P. Miniature neurologgers for flying pigeons: multichannel EEG andaction and field potentials in combination with GPS recording.J Neurophysiol. 2006;95:1263–73.
17. Simon JC, Dickinson MH. A new chamber for studying the behavior ofDrosophila. PLoS One. 2010;5:e8793.
18. Rodríguez-Muñoz R, Bretman A, Slate J, Walling CA, Tregenza T. Natural andsexual selection in a wild insect population. Science. 2010;328:1269–72.
19. Warringer J, Ericson E, Fernandez L, Nerman O, Blomberg A. High-resolutionyeast phenomics resolves different physiological features in the salineresponse. Proc Natl Acad Sci U S A. 2003;100:15724–9.
20. Costanzo M, Baryshnikova A, Bellay J, Kim Y, Spear ED, Sevier CS, Ding H,Koh JLY, Toufighi K, Mostafavi S, Prinz J, St Onge RP, VanderSluis B,Makhnevych T, Vizeacoumar FJ, Alizadeh S, Bahr S, Brost RL, Chen Y, Cokol M,Deshpande R, Li Z, Lin Z-Y, Liang W, Marback M, Paw J, San Luis B-J, Shuteriqi E,Tong AHY, van Dyk N, et al. The genetic landscape of a cell. Science. 2010;327:425–31.
21. Lawless C, Wilkinson DJ, Young A, Addinall SG, Lydall DA. Colonyzer:automated quantification of micro-organism growth characteristics on solidagar. BMC Bioinformatics. 2010;11:287.
22. Addinall SG, Holstein E-M, Lawless C, Yu M, Chapman K, Banks AP, Ngo H-P,Maringele L, Taschuk M, Young A, Ciesiolka A, Lister AL, Wipat A, Wilkinson DJ,Lydall D. Quantitative fitness analysis shows that NMD proteins and manyother protein complexes suppress or enhance distinct telomere cap defects.PLoS Genet. 2011;7:e1001362.
23. Baryshnikova A, Costanzo M, Kim Y, Ding H, Koh J, Toufighi K, Youn J-Y, Ou J,San Luis B-J, Bandyopadhyay S, Hibbs M, Hess D, Gingras A-C, Bader GD,Troyanskaya OG, Brown GW, Andrews B, Boone C, Myers CL. Quantitativeanalysis of fitness and genetic interactions in yeast on a genome scale. NatMethods. 2010;7:1017–24.
24. Zackrisson M, Hallin J, Ottosson L-G, Dahl P, Fernandez-Parada E, Ländström E,Fernandez-Ricaud L, Kaferle P, Skyman A, Omholt S, Petrovic U, Warringer J,Blomberg A: Scan-o-matic: high-resolution microbial phenomics at a massivescale. 2016; G3: Genes, Genomes, Genetics, in press.
25. Warringer J, Blomberg A. Automated screening in environmental arraysallows analysis of quantitative phenotypic profiles in Saccharomycescerevisiae. Yeast. 2003;20:53–67.
Fernandez-Ricaud et al. BMC Bioinformatics (2016) 17:249 Page 14 of 15

26. Deutschbauer AM, Jaramillo DF, Proctor M, Kumm J, Hillenmeyer ME, Davis RW,Nislow C, Giaever G. Mechanisms of haploinsufficiency revealed by genome-wide profiling in yeast. Genetics. 2005;169:1915–25.
27. Kensy F, Engelbrecht C, Büchs J. Scale-up from microtiter plate to laboratoryfermenter: evaluation by online monitoring techniques of growth andprotein expression in Escherichia coli and Hansenula polymorphafermentations. Microb Cell Fact. 2009;8:68.
28. Bochner BR. New technologies to assess genotype-phenotype relationships.Nat Rev Genet. 2003;4:309–14.
29. Toussaint M, Conconi A. High-throughput and sensitive assay to measureyeast cell growth: a bench protocol for testing genotoxic agents.Nat Protoc. 2006;1:1922–8.
30. King RD, Rowland J, Oliver SG, Young M, Aubrey W, Byrne E, Liakata M,Markham M, Pir P, Soldatova LN, Sparkes A, Whelan KE, Clare A. Theautomation of science. Science. 2009;324:85–9.
31. Holowachuk S. A kinetic microplate method for quantifying the antibacterialproperties of biological fluids. J Microbiol Methods. 2003;55:441–6.
32. Novak M, Pfeiffer T, Ackermann M, Bonhoeffer S. Bacterial growth propertiesat low optical densities. Antonie Van Leeuwenhoek. 2009;96:267–74.
33. Hall BG, Acar H, Nandipati A, Barlow M. Growth rates made easy. Mol BiolEvol. 2014;31:232–8.
34. Jung PP, Christian N, Kay DP, Skupin A, Linster CL. Protocols and programsfor high-throughput growth and aging phenotyping in yeast. PLoS One.2015;10:e0119807.
35. Olsen B, Murakami CJ, Kaeberlein M. YODA: software to facilitate high-throughput analysis of chronological life span, growth rate, and survival inbudding yeast. BMC Bioinformatics. 2010;11:141.
36. Blomberg A. Measuring growth rate in high-throughput growthphenotyping. Curr Opin Biotechnol. 2011;22:94–102.
37. Microsoft.Net Framework [http://www.microsoft.com/net]38. PRECOG Portal [http://precog.lundberg.gu.se]39. PROPHECY Website [http://prophecy.lundberg.gu.se]40. PRECOG Desktop Install page [http://precog.lundberg.gu.se/PrecogInstall]41. PRECOG API [http://precog.lundberg.gu.se/WebService/Precog.asmx]42. Sells C, Griffiths I. Programming WPF: Building Windows UI with Windows
Presentation Foundation. Sebastopol: O’Reilly Media, Inc.; 2007.43. Nathan A. Windows Presentation Foundation Unleashed. Carmel: Sams
Publishing; 2006.44. Freeman A. Introducing Visual C# 2010. Berkeley, CA: Apress; 2010.45. PRECOG API Overview [http://precog.lundberg.gu.se/Pages/Content/
PrecogAPI]46. Pitas I, Venetsanopoulos AN. Order statistics in digital image processing.
Proc IEEE. 1992;80:1893–921.47. Liu Y, Liu C, Wang D. A 1D time-varying median filter for seismic random,
spike-like noise elimination. Geophysics. 2009;74:V17–24.48. Lee YLY, Kassam S. Generalized median filtering and related nonlinear
filtering techniques. IEEE Trans Acoust. 1985;33:673.49. Pitas I, Venetsanopoulos AN. Nonlinear Digital Filters. New York: Springer
Science & Business Media; 1990.50. Cerutti S, Carrault G, Cluitmans PJM, Kinie A, Lipping T, Nikolaidis N, Pitas I,
Signorini MG. Non-linear algorithms for processing biological signals.Comput Methods Programs Biomed. 1996;51:51–73.
51. Pylvanainen I. A parametric approach to yeast growth curve estimation andstandardization. Chalmers University of Technology and GoteborgUniversity: Division of Mathematical Statistics, Department of MathematicalSciences; 2005.
52. PRECOG-Lite [http://precog.lundberg.gu.se/Pages/PrecogLite/PRECOG]53. Liu Z, Lu M, Wei M. Structure noise reduction of ultrasonic signals using
artificial neural network adaptive filtering. Ultrasonics. 1997;35:325–8.54. Hodge VJ, Austin J. A survey of outlier detection methodologies. Artif Intell
Rev. 2004;22:85–126.55. Houle D, Govindaraju DR, Omholt S. Phenomics: the next challenge. Nat Rev
Genet. 2010;11:855–66.56. Huber R, Palmen TG, Ryk N, Hillmer A-K, Luft K, Kensy F, Büchs J. Replication
methods and tools in high-throughput cultivation processes - recognizingpotential variations of growth and product formation by on-linemonitoring. BMC Biotechnol. 2010;10:22.
57. Jasnos L, Sliwa P, Korona R. Resolution and repeatability of phenotypicassays by automated growth curve analysis in yeast and bacteria. AnalBiochem. 2005;344:138–40.
58. Gribbon P, Lyons R, Laflin P, Bradley J, Chambers C, Williams BS, Keighley W,Sewing A. Evaluating real-life high-throughput screening data. J BiomolScreen. 2005;10:99–107.
59. Leek JT, Scharpf RB, Bravo HC, Simcha D, Langmead B, Johnson WE, Geman D,Baggerly K, Irizarry RA. Tackling the widespread and critical impact of batcheffects in high-throughput data. Nat Rev Genet. 2010;11:733–9.
60. Costanzo MC, Skrzypek MS, Nash R, Wong E, Binkley G, Engel SR, Hitz B,Hong EL, Cherry JM. New mutant phenotype data curation system in theSaccharomyces Genome Database. Database (Oxford). 2009;2009:bap001.
61. Deans AR, Lewis SE, Huala E, Anzaldo SS, Ashburner M, Balhoff JP, Blackburn DC,Blake JA, Burleigh JG, Chanet B, Cooper LD, Courtot M, Csösz S, Cui H,Dahdul W, Das S, Dececchi TA, Dettai A, Diogo R, Druzinsky RE, Dumontier M,Franz NM, Friedrich F, Gkoutos G V, Haendel M, Harmon LJ, Hayamizu TF, He Y,Hines HM, Ibrahim N, et al. Finding our way through phenotypes. PLoS Biol.2015;13:e1002033.
62. Warringer J, Anevski D, Liu B, Blomberg A. Chemogenetic fingerprinting byanalysis of cellular growth dynamics. BMC Chem Biol. 2008;8:3.
63. Fernandez-Ricaud L, Warringer J, Ericson E, Pylvänäinen I, Kemp GJL,Nerman O, Blomberg A. PROPHECY - A database for high-resolutionphenomics. Nucleic Acids Res. 2005;33(DATABASE ISS):D369.
64. Fernandez-Ricaud L, Warringer J, Ericson E, Glaab K, Davidsson P, Nilsson F,Kemp GJL, Nerman O, Blomberg A. PROPHECY - A yeast phenomedatabase, update 2006. Nucleic Acids Res. 2007;35 SUPPL. 1:D463.
• We accept pre-submission inquiries
• Our selector tool helps you to find the most relevant journal
• We provide round the clock customer support
• Convenient online submission
• Thorough peer review
• Inclusion in PubMed and all major indexing services
• Maximum visibility for your research
Submit your manuscript atwww.biomedcentral.com/submit
Submit your next manuscript to BioMed Central and we will help you at every step:
Fernandez-Ricaud et al. BMC Bioinformatics (2016) 17:249 Page 15 of 15