precision sidedress uan application for corn production kefyalew girma oklahoma state university...
TRANSCRIPT

PRECISION SIDEDRESS PRECISION SIDEDRESS UAN APPLICATION FOR UAN APPLICATION FOR CORN PRODUCTIONCORN PRODUCTION
Kefyalew GirmaOklahoma State University
Kefyalew GirmaOklahoma State UniversityO
k
l
a
h
o
m
a
S
t
a
t
e
U
n
i
v
e
r
s
i
t
y

O
k
l
a
h
o
m
a
S
t
a
t
e
U
n
i
v
e
r
s
i
t
y
Nitrogen Leak
IntroductionIntroduction

IntroductionIntroduction
The common use of UAN for sidedress N application in corn is to apply this liquid fertilizer in the middle of rows using either dribble surface bands, or rolling coulter injection. O
k
l
a
h
o
m
a
S
t
a
t
e
U
n
i
v
e
r
s
i
t
y
Coulter UAN application in corn (Ames, IA). UAN surface application is made within the center of the row, 15 inches away from the base of each stalk.

IntroductionIntroduction
Excavated corn plants showing no overlapping of nodal root systems when corn plants were more than 10” apart, at silking growth stage
O
k
l
a
h
o
m
a
S
t
a
t
e
U
n
i
v
e
r
s
i
t
y

Objective Objective
to compare three sidedress N placement methods on corn grain yield/where
Evaluate sidedress N rates
O
k
l
a
h
o
m
a
S
t
a
t
e
U
n
i
v
e
r
s
i
t
y
Sense by plant and treat based on yield potential

Treatment structure of precision sidedress UAN experiment, Haskell and Lake Carl Blackwell, 2005-2006.Trt Pre Side d. Placement method
1 40 20 Directed stream application at the base of each plant (1)
2 40 20 Directed stream application at the base of a row (2)
3 40 20 Dribble surface bands applied in the middle of two rows (3)
4 40 40 1
5 40 40 2
6 40 40 3
7 40 80 1
8 40 80 2
9 40 80 3
10 40 160 1
11 40 160 2
12 40 160 3
13 0 0 NA
14 40 0 Broadcast
15 200 0 Broadcast
O
k
l
a
h
o
m
a
S
t
a
t
e
U
n
i
v
e
r
s
i
t
y

O
k
l
a
h
o
m
a
S
t
a
t
e
U
n
i
v
e
r
s
i
t
y
By-plant By-row
Between rows

O
k
l
a
h
o
m
a
S
t
a
t
e
U
n
i
v
e
r
s
i
t
y Directed Stream Applicator
Directed stream application of UAN in corn applied at the base of stalk of the plant

Plot size 10’ x 20’ with 5’ alleyBy plant N rate was determined as:
1)Calculate UAN/row2)Divide the above by number of plants/rowO
k
l
a
h
o
m
a
S
t
a
t
e
U
n
i
v
e
r
s
i
t
y Design and Field Layout
W E
N
S
Location: Haskell-2005
13 5 10 4 15 12 8 9 7 2 3 6 14 11 1
III
II
I
1 14 15 6 5 7 13 9 4 3 8 10 11 2 12
4 5 2 9 10 15 7 8 3 13 12 11 14 6 1

Row
Mean dry grain weight, lb/plant
Percent of no. of plants with yield > mean Range, lb/plant
Standard deviationlb/plant
Hask LC Hask LC Haskl LC Hask LC
1 0.20 0.38 50 53 0.31 0.35 0.09 0.09
2 0.19 0.38 50 47 0.34 0.35 0.09 0.09
Pro ns ns ns ns ns ns ns ns
O
k
l
a
h
o
m
a
S
t
a
t
e
U
n
i
v
e
r
s
i
t
y Between row and within row by plant corn
grain weight variability at Haskell (Hask) and Lake Carl Blackwell (LC), OK, 2005.
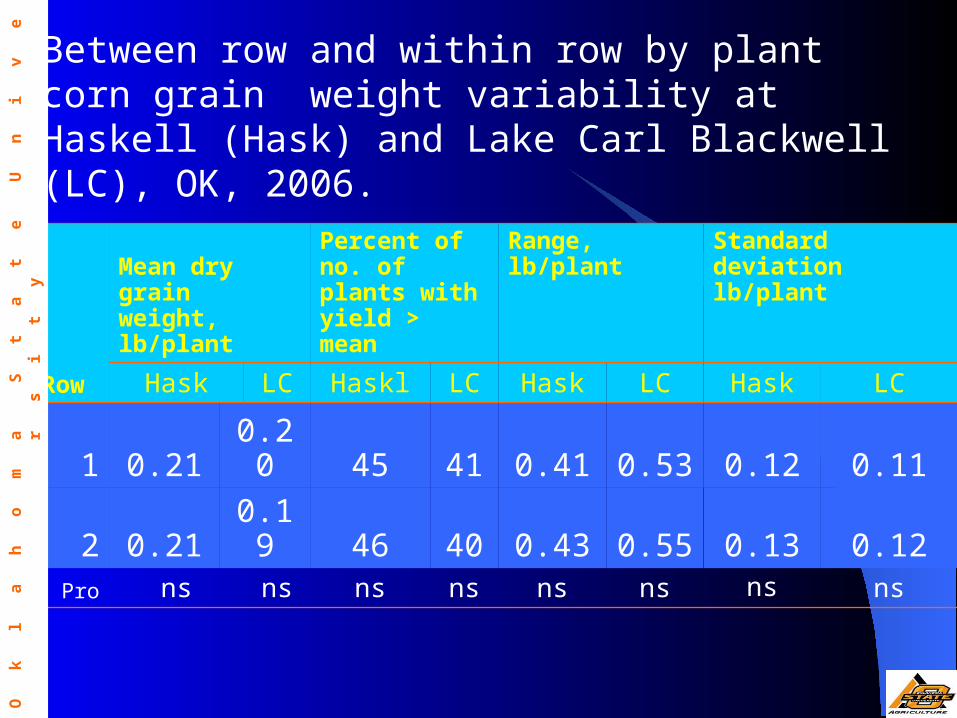
Between row and within row by plant corn grain weight variability at Haskell (Hask) and Lake Carl Blackwell (LC), OK, 2006.
Row
Mean dry grain weight, lb/plant
Percent of no. of plants with yield > mean
Range, lb/plant Standard deviationlb/plant
Hask LC Haskl LC Hask LC Hask LC
1 0.21 0.20 45 41 0.41 0.53 0.12 0.11
2 0.21 0.19 46 40 0.43 0.55 0.13 0.12Pro ns ns ns ns ns ns ns ns
O
k
l
a
h
o
m
a
S
t
a
t
e
U
n
i
v
e
r
s
i
t
y

Martin et al. (2005) Agron. J. 97:1603-1611Martin et al. (2005) Agron. J. 97:1603-1611
Regardless of yield level, plant-to-plant variability in corn grain yield can be expected and averaged more than 2765 kg ha-1 (44 bu/ac) over 46 sites (Ohio, Iowa, Nebraska, Virginia, Mexico, Argentina)
Regardless of yield level, plant-to-plant variability in corn grain yield can be expected and averaged more than 2765 kg ha-1 (44 bu/ac) over 46 sites (Ohio, Iowa, Nebraska, Virginia, Mexico, Argentina)
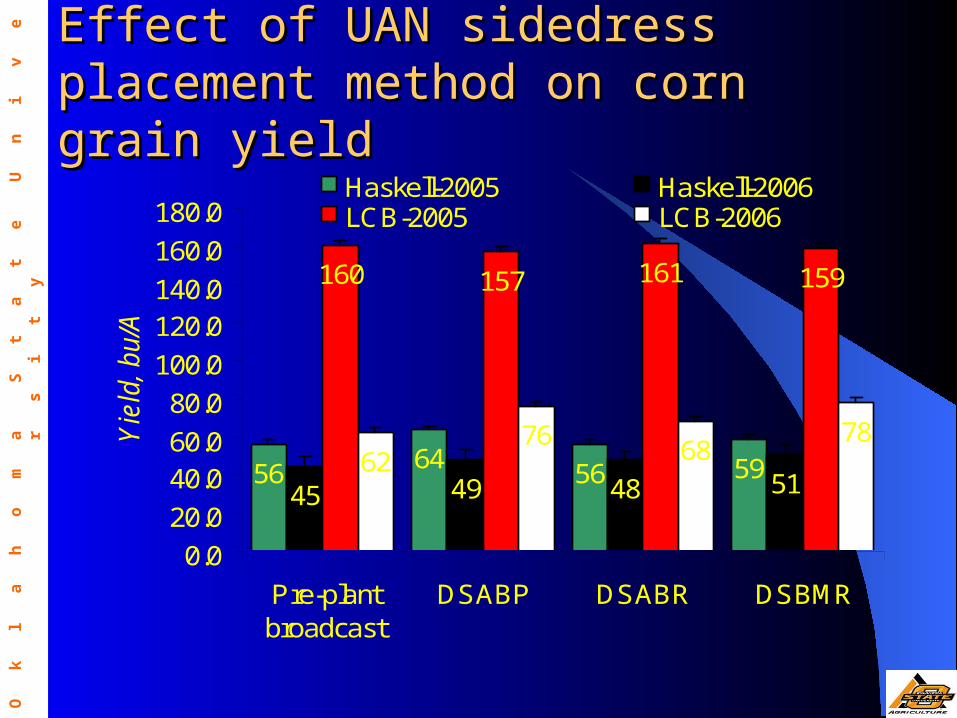
6456 59
45 49 48 51
160 157 161 159
6276
6878
56
0.0
20.0
40.060.0
80.0
100.0
120.0140.0
160.0
180.0
Pre-plantbroadcast
DSABP DSABR DSBMR
Yie
ld, b
u/A
Haskell-2005 Haskell-2006LCB-2005 LCB-2006
Effect of UAN sidedress placement Effect of UAN sidedress placement method on corn grain yieldmethod on corn grain yield
O
k
l
a
h
o
m
a
S
t
a
t
e
U
n
i
v
e
r
s
i
t
y

Effect of sidedress N rates on corn Effect of sidedress N rates on corn grain yieldgrain yield
30.0
60.0
90.0
120.0
150.0
180.0
0 20 40 80 160sidedress N rate, lb/A
Gra
in y
ield
, bu
/A
Haskell-2005 Haskell-2006LCB-2006 LCB-2005
O
k
l
a
h
o
m
a
S
t
a
t
e
U
n
i
v
e
r
s
i
t
y

O
k
l
a
h
o
m
a
S
t
a
t
e
U
n
i
v
e
r
s
i
t
y
Within row variability in grain yield was very high
By plant sidedress application of N according to individual plant yield potential would result in improved efficiency and reduced cost to producers
The gain in yields from the three methods ranged from 7 to 25% more than the broadcast treatment in three location-years
SummarySummary

O
k
l
a
h
o
m
a
S
t
a
t
e
U
n
i
v
e
r
s
i
t
y
Under normal growing conditions, N should be sidedressed by plant at a rate of 20-40 lb/A to maintain yield level and decrease loss in fertilizer N concurrent with within row plant to plant variability
Results are not conclusive as the 2006 corn growing season was extremely dry/hot
The experiment will be continued for 1 more year
SummarySummary
O
k
l
a
h
o
m
a
S
t
a
t
e
U
n
i
v
e
r
s
i
t
y
Additional measurements such as ears per plant, 100-seed weight, ear size, plant spacing, and grain N concentration
SummarySummary

O
k
l
a
h
o
m
a
S
t
a
t
e
U
n
i
v
e
r
s
i
t
y