precipitation strengthening of aluminum by · pdf fileprecipitation strengthening of aluminum...
TRANSCRIPT

Precipitation Strengthening of Aluminum by Precipitation Strengthening of Aluminum by Precipitation Strengthening of Aluminum by Precipitation Strengthening of Aluminum by Transition Metal AluminTransition Metal AluminTransition Metal AluminTransition Metal Aluminiiiidesdesdesdes
by
Yangyang FanYangyang FanYangyang FanYangyang Fan
A thesis submitted to the faculty of the
WORCESTER POLYTECHINC INSTITUTEWORCESTER POLYTECHINC INSTITUTEWORCESTER POLYTECHINC INSTITUTEWORCESTER POLYTECHINC INSTITUTE
in partial fulfillment of the requirements of the degree of
Master of Science
in
Materials Science and Engineering
April, 2012
Professor Makhlouf M. Makhlouf, Advisor
Professor Richard D. Sisson Jr., Director of the Material Science and Engineering
Program
i
ABSTRACTABSTRACTABSTRACTABSTRACT
Aluminum-zirconium alloys exhibit superior strength at elevated temperature in
comparison to traditional aluminum casting alloys. These alloys are heat-treatable and
their strength depends to a large extent on the quenching and aging steps of the heat
treatment process. However, measurements show that the critical cooling rate
necessary to retain 0.6 wt. pct. zirconium(the minimum amount necessary for
significant strengthening) in a super-saturated solid solution with aluminum is 90ºC/s,
which is un-attainable with traditional casting processes. On the other hand, the critical
cooling rate necessary to retain 0.4 wt. pct vanadium and 0.1 wt. pct. zirconium in a
super-saturated solidsolution with aluminum is only 40ºC/s; which suggests that
substituting vanadium for zirconium significantly decreases the critical cooling rate of
the alloy. This is an important finding as it means that, unlike the Al-0.6Zr alloy, the
Al-0.4V-0.1Zr alloy may be processed into useful components by traditional high
pressure die-casting. Moreover, measurements show that the hardness of the
Al-0.4V-0.1Zr alloy increases upon aging at 400ºC and does not degrade even after
holding the alloy at 300ºC for 100 hours. Also, measurements of the tensile yield
strength of the Al-0.4V-0.1Zr alloy at 300ºC show that it is about 3 times higher than
that of pure aluminum. This increase in hardness and strength is attributed to
precipitation of Al3(Zr,V) particles. Examination of these particles with high resolution
transmission electron microscopy (HRTEM) and conventional TEM show that vanadium
co-precipitates with zirconium and aluminum and forms spherical particles that have
the L12 crystal structure. It also shows that the crystallographic misfit between the
precipitate particles and the aluminum matrix is almost eliminated by introducing
vanadium into the Al3Zr precipitate and thatthe mean radius of the Al3(Zr,V) particles is
in the range from 1nm to 7nm depending on the alloy composition and aging practice.
Finally, it is found that adding small amounts of silicon to the Al-0.4V-0.1Zr alloy
effectively accelerates formation of the Al3(Zr,V) precipitate.

ii
ACKNOWLEDGEMENTSACKNOWLEDGEMENTSACKNOWLEDGEMENTSACKNOWLEDGEMENTS
I have worked with a great number of people whose contribution in various ways to my
research and the making of this thesis deserve special mention. It is a pleasure to
convey my gratitude to them all in my humble acknowledgement.
I am deeply grateful to Professor Makhlouf M. Makhlouf for giving me the opportunity to
work with him on this project. It has been an honor to be his student. I would like to
deliver my special gratitude to him for his advice, time, ideas and supervision from the
very beginning to the end of this research, as well as for sharing his unique experience
with me throughout the work. His words of encouragement and motivation came a long
way in bringing this work to completion. I would like to thank Professor Sisson for his
advice and guidance throughout these years. He has been a great help not only in my
academic performance, but also in my personal development. It is my pleasure also to
pay tribute to all the WPI faculty and staff.
I deeply appreciate my family, especially my father. He devoted his life to me, and
instructing me to be honest, responsible, and rightness by his acting. Collective and
individual acknowledgements are also due to colleagues, classmates and friends whose
enthusiasm and support in one way or another was helpful and memorable. The group
at the Advanced casting Research Center has contributed immensely to my personal
and professional experience at WPI. The team has been a wonderful source of
friendships, good advice and collaboration.
I want to thank the Metals Processing Institute and the Department of Materials
Science and Engineering at WPI who gave me the opportunity to be a part of them.
Finally, I thank everyone who supported and believed in me, and I express my apology
to anyone who I did not mention personally.

iii
Table of Contents
ABSTRACTABSTRACTABSTRACTABSTRACT .............................................................................................................................................................. i
ACKNOWLEDGEMENTSACKNOWLEDGEMENTSACKNOWLEDGEMENTSACKNOWLEDGEMENTS ....................................................................................................................................... ii
Table of ContentTable of ContentTable of ContentTable of Contentssss ................................................................................................................................................ iii
1.1.1.1. ObjectivesObjectivesObjectivesObjectives ..................................................................................................................................................... 1
2.2.2.2. BackgroundBackgroundBackgroundBackground .................................................................................................................................................. 2
2.1 Precipitation Strengthening ........................................................................................................ 2
2.2 The Stability of Precipitates ........................................................................................................ 8
2.3 Characteristics of Precipitates in High Temperature Aluminum Alloys ....................................10
2.4 Transition Metals that Form Aluminides with Meta-stable L12 Structure ................................12
2.5 Stable and Meta-stable Crystal Structures of Transition Metal Aluminides .............................14
2.6 Alloying Zirconium Trialuminide (Al3Zr) with Other Transition Metals .....................................16
2.7 Manufacturing Issues ...............................................................................................................17
2.8 The Al-Zr System .....................................................................................................................19
2.9 The Al-V and Al-Zr-V Systems ...................................................................................................20
2.10 Effect of Silicon and Iron on Precipitation of Transition Metal Aluminides in Aluminum ........24
3.3.3.3. Apparatuses and ProceduresApparatuses and ProceduresApparatuses and ProceduresApparatuses and Procedures ................................................................................................................. 25
3.1 Design of the Mold used in Measuring the Critical Cooling Rate .............................................25
3.2 Design of the Mold used in Measuring Tensile Properties .......................................................29
3.3 Melt Preparation, Casting, Heat Treatment, and Microstructure Characterization .................31
3.3.1 Melt Preparation and Casting. ..................................................................................................31
3.3.2 Establishing the Critical Cooling Rate .......................................................................................32
3.3.3 Heat Treatment, Hardness Measurement, and Microstructure Characterization ....................32
3.3.4 Elevated Temperature Tensile Property Measurements ..........................................................33
4. Results and Discussion4. Results and Discussion4. Results and Discussion4. Results and Discussion ............................................................................................................................... 35
4.1 The Effect of Cooling Rate on the Volume Percent of the Primary Al3M Phase .......................35
4.1.1 The Binary Al-Zr System ............................................................................................................35
4.1.2 The Ternary Al-Zr-V System ......................................................................................................38
4.2. Isothermal Heat Treatment of Binary Al-Zr and Ternary Al-Zr-V Alloys ....................................42
4.2.1 The Binary Al-Zr Alloy ...............................................................................................................42
4.2.2 The Ternary Al-Zr-V Alloys ........................................................................................................43
4.2.3 Thermal Stability of Al-0.4V-0.1Zr Alloy ...................................................................................44
4.3 Morphology and Crystal Structure of The Al3(Zr,V) Precipitates ...............................................45
4.4 Elevated Temperature Tensile Properties .................................................................................47
5. 5. 5. 5. ConclusionsConclusionsConclusionsConclusions ............................................................................................................................................... 49
6.6.6.6. ReferencesReferencesReferencesReferences ................................................................................................................................................ 50

1
1.1.1.1. ObjectiveObjectiveObjectiveObjectivessss
The objectives of this project are as follows:
1. To determine the critical cooling rate needed to suppress formation of the
equilibrium D023and D022precipitates in Al-Zr and Al-Zr-V alloys.
2. To establish the optimum heat treatment schedule for processingAl-Zr and
Al-Zr-V alloys.
3. To elucidate the mechanism of precipitation in Al-Zr-V alloys and to characterize
the structure and size of the precipitate particles.

2
2.2.2.2. BackgroundBackgroundBackgroundBackground
2.12.12.12.1 Precipitation StrengtheningPrecipitation StrengtheningPrecipitation StrengtheningPrecipitation Strengthening
Alfred Wilm[1]discovered that the strength of an Al 4Cu-0.5Mg-0.5Mn alloy is
unexpectedly high after quenching it from 525ºC and naturally aging it. However, he did
not explain the mechanism responsible for the increased strength because of the
limitations of the microscopes available at the time. Several years later, Merica,
Waltenberg, and Scott[2] published a paper in which they correctly deduced that the
different solubility of Cu, Zn, and Mg-Si in aluminum at 525ºC and at room temperature
leads to the precipitation of a secondary phase which reinforces the strength of the
aluminum alloy. However, the nature of the precipitates remained unclear because they
are too small to be directly observed by the optical microscope. This issue was not
resolved until the early 1960s when diffuse X-ray[3] and transmission electron
microscopy[4] were used to investigate precipitates in metallic alloys and today it is
well-known that in the binary Al-Cu system, four precipitates form in sequence. They are:
Guuinier-Prestion (GP) zones, θ’’, θ’, and θ. GP zones form first and can form by aging at
room temperature; the others require artificial aging, i.e., aging at elevated temperature.
All four precipitates strengthen the alloy as a result of their interaction with moving
dislocations. The earliest attempt to explain age hardening on the basis of interactions
of particles with dislocations is due to Mott and Nabarro [5] who suggested that
strengthening arose from the interaction between dislocations and the internal stresses
produced by “miss-fitting” coherent precipitates. Consider the situation where the
movement of a dislocation is hindered by a precipitate particle as shown schematically
in Fig.1. The tension forcesT on the dislocation are balanced by the resisting force F. As
F increases, the bowing of the dislocation increases, i.e, the angle� increases. If the particle is hard, the resisting force F is large and can be larger than 2T. In this case, the
dislocation will bypass the particle either by Orowan looping or by cross-slipping. In this
scenario, the particle remains unchanged; however, if the maximum resistance force is
attained and ���� � 1, then the particle will be sheared by the dislocation as the dislocation passes through it.

3
Fig.1.Fig.1.Fig.1.Fig.1. Balance of forces acting on a precipitate particle as
a dislocation attempts to pass by it.
Precipitate looping occurs if the precipitate particles are ‘hard’ enough that dislocations
pass through them without causing them to deform. Typically, this happens in four steps
as depicted schematically in Fig.2.These are: (1)the approach step, (2) the sub-critical
step,(3) the critical step, and (4) the escape step. Orowan [6] considered the
relationship between the applied stress and dislocation bowing and derived the
relationship:
∆� � � /� (1)
where ∆� is the increase in yield stress due to the precipitation looping, G is the
shear modulus of the matrix, b is the Burger’s vector of the dislocation, and L is the
particle spacing. Ashby[7] further developed this equation by taking into account the
inter-particle spacing and the effects of statistically distributed particles. The
Ashby-Orowan relationship is given as
∆�� � 0.538 · ����/�� · �� �
!�" (2)
In Eq. (2), ∆�� is the increase in yield strength, G is the shear modulus of the matrix, b
is the magnitude of the Burgers vector, D is the real diameter of the particle, and f is the
volume fraction of particles. A plot of the Ashby-Orowan stress as a function of
Resisting force
F
θ
Line
tension
T
T

4
precipitate diameter for different volume fractions of particles in an aluminum matrix
as generated by Eq. (2) with G = 26.2 GPa, and b = 0.286nm is shown in Fig.3.
(1) Approach stage
(2) Sub-critical stage
(3) critical stage
(4) Escape stage
Fig.2.Fig.2.Fig.2.Fig.2. The four steps of precipitation looping.
Force � per unit length
L
T T
� �

5
Fig.3.Fig.3.Fig.3.Fig.3. The Ashby-Orowan stress as a function of precipitate diameter for
various precipitate volume fractions, f.
The dislocation loops the precipitate particle when the particle is hard, but what really
impedes the movement of the dislocation is the strain field around the miss-fitting
coherent precipitate. Mott and Nabarro[8] described phenomenon. Briefly, coherent
strain fields around the precipitate cause repulsive forces against the dislocation as
shown schematically in Fig.4.Consequently, the dislocation is stopped by the restraining
force at the edge of the coherent precipitate. As the restraining force increases, the
convolutions of the dislocation increase up to the point where Orowan looping occurs.
Fig.4.Fig.4.Fig.4.Fig.4. Interaction between a dislocation and precipitate particles.
0
50
100
150
200
250
300
350
1 2 4 8 16 32 64
Oro
wan
Str
ess
(MP
a)
Particle diameter (nm)
f = 0.050
f = 0.010
f = 0.005
f = 0.001
Stress field of
precipitate
Dislocation
line
6
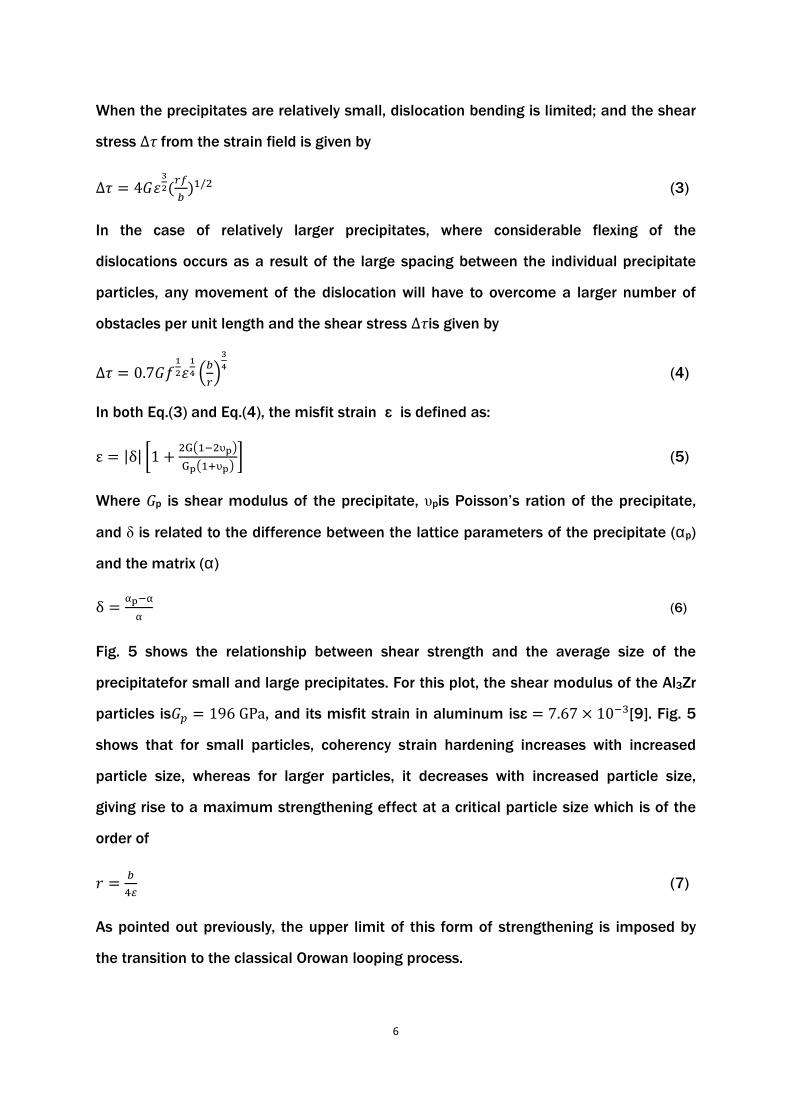
When the precipitates are relatively small, dislocation bending is limited; and the shear
stress Δτ from the strain field is given by
∆� � 4�$%�&�
� '(/! (3)
In the case of relatively larger precipitates, where considerable flexing of the
dislocations occurs as a result of the large spacing between the individual precipitate
particles, any movement of the dislocation will have to overcome a larger number of
obstacles per unit length and the shear stress Δτis given by
∆� � 0.7�*��$�
+ �"
%+ (4)
In both Eq.(3) and Eq.(4), the misfit strain ε is defined as:
ε � |δ| -1 . !G0(1!υ23G20(4υ23 5 (5)
Where Gp is shear modulus of the precipitate, υpis Poisson’s ration of the precipitate,
and δ is related to the difference between the lattice parameters of the precipitate (αp)
and the matrix (α)
δ � α21α
α (6)
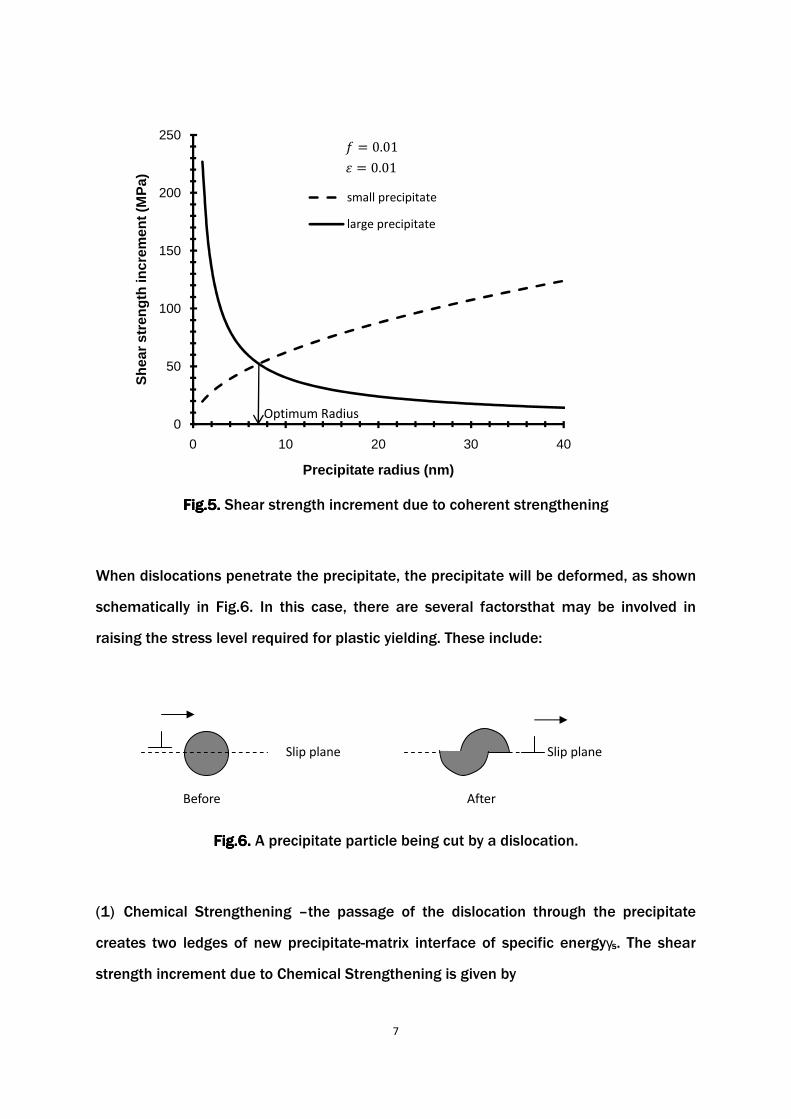
Fig. 5 shows the relationship between shear strength and the average size of the
precipitatefor small and large precipitates. For this plot, the shear modulus of the Al3Zr
particles is�6 � 196 GPa, and its misfit strain in aluminum isε � 7.67 < 101=[9]. Fig. 5
shows that for small particles, coherency strain hardening increases with increased
particle size, whereas for larger particles, it decreases with increased particle size,
giving rise to a maximum strengthening effect at a critical particle size which is of the
order of
> � �?@ (7)
As pointed out previously, the upper limit of this form of strengthening is imposed by
the transition to the classical Orowan looping process.
7
Fig.5.Fig.5.Fig.5.Fig.5. Shear strength increment due to coherent strengthening
When dislocations penetrate the precipitate, the precipitate will be deformed, as shown
schematically in Fig.6. In this case, there are several factorsthat may be involved in
raising the stress level required for plastic yielding. These include:
Fig.6.Fig.6.Fig.6.Fig.6. A precipitate particle being cut by a dislocation.
(1) Chemical Strengthening –the passage of the dislocation through the precipitate
creates two ledges of new precipitate-matrix interface of specific energyγs. The shear
strength increment due to Chemical Strengthening is given by
0
50
100
150
200
250
0 10 20 30 40
Sh
ear
stre
ng
th in
crem
ent (
MP
a)
Precipitate radius (nm)
small precipitate
large precipitate
* � 0.01
$ � 0.01
Optimum Radius
Before
Slip plane
After
Slip plane
8
�A � &6 BC%��DE '(/! � > F1( (8)
Whereγs is energy of a matrix-precipitate interface created by slip, � > F is the average
radius of the precipitate particles, and Γ is the line tension of a dislocation. Eq. (8)
shows that the smaller the average precipitate radius, the more the Chemical
Strengthening. Chemical Strengthening is usually a minor contributor to precipitation
hardening, and it is not as important as Stacking-Fault Strengthening.
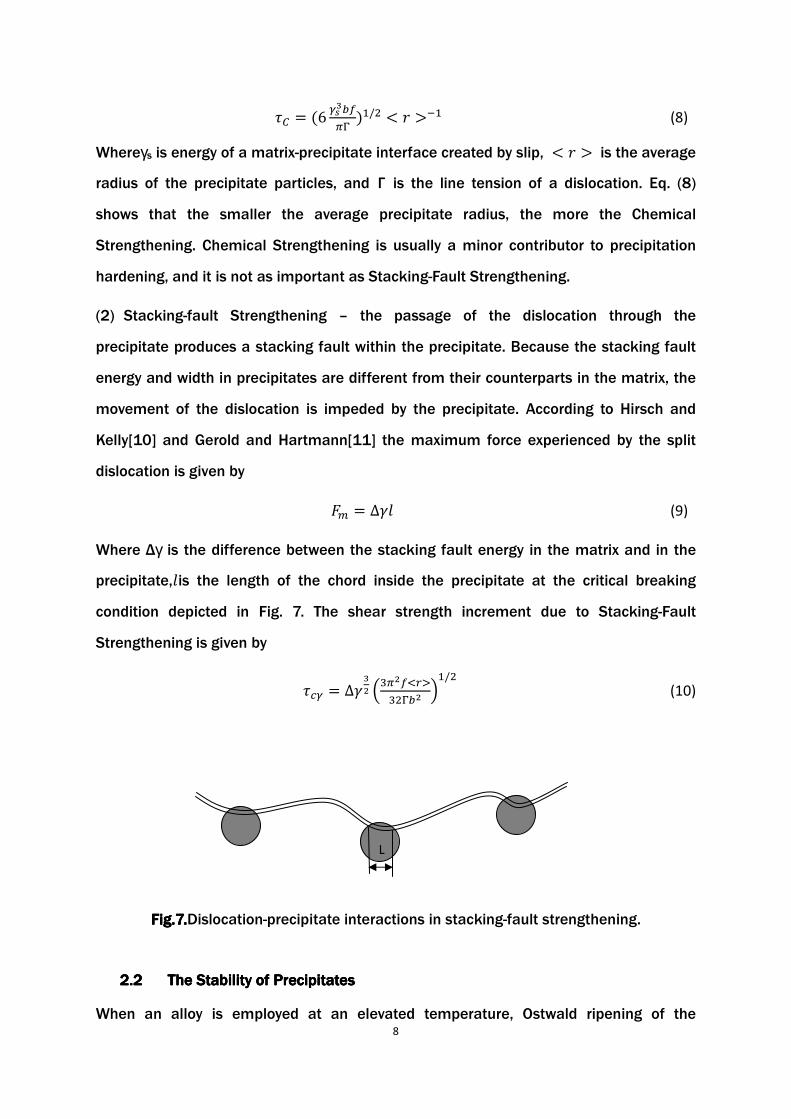
(2) Stacking-fault Strengthening – the passage of the dislocation through the
precipitate produces a stacking fault within the precipitate. Because the stacking fault
energy and width in precipitates are different from their counterparts in the matrix, the
movement of the dislocation is impeded by the precipitate. According to Hirsch and
Kelly[10] and Gerold and Hartmann[11] the maximum force experienced by the split
dislocation is given by
GH � ∆I� (9)
Where ∆γ is the difference between the stacking fault energy in the matrix and in the
precipitate,�is the length of the chord inside the precipitate at the critical breaking condition depicted in Fig. 7. The shear strength increment due to Stacking-Fault
Strengthening is given by
�JB � ∆I%� =D��KL
=!E�� "(/! (10)
Fig.7.Fig.7.Fig.7.Fig.7.Dislocation-precipitate interactions in stacking-fault strengthening.
2.22.22.22.2 The Stability of PrecipitatesThe Stability of PrecipitatesThe Stability of PrecipitatesThe Stability of Precipitates
When an alloy is employed at an elevated temperature, Ostwald ripening of the
L

9
precipitate particles may occur; i.e., the larger precipitate particles may grow even
larger at the expense of the small precipitate particles. As a consequence, the average
radius of the precipitate particles increases at elevated temperatures while the density
of the particles decreases. As pointed out earlier, precipitation hardening strongly
depends on the average radius of precipitate. Large, coarsened precipitates contribute
little to precipitation hardening.
The kinetics of Ostwald ripening is controlled by volume diffusion, as solute atoms are
transferred through the matrix from the shrinking precipitates to the growing ones.
Lifshits, Slyozov [12] and Wagner [13] (the LSW theory) shows that the average
precipitate size <r> increases with time t according to
&� >&M' F'= N &� >&M � 0' F'= � OM (11)
where � >&M' F is the average precipitate radius at time M , � >&M � 0' F is the
average precipitate radius at the onset of coarsening, and O is a rate constant given by Eq. (12) in which P is the diffusivity of the rate-controlling solute, � is the
precipitate-matrix interfacial free energy, and QR6and QRH are the equilibrium
solubilities of the solute elements in the precipitate and matrix phases, respectively.
O S �T&AU
V1AUW'� (12)
For creep-resistant alloys, the Ostwald ripening process must be slowed down. Hence, it
is essential to have in the alloy solutes with low diffusion coefficient and low solubility in
the matrix, and that form precipitates with a low interfacial energy withthe matrix.
In order to illustrate this point, considerthe three aluminum alloys:
(1) Al-Si12-Cu-Mg-Ni (eutectic composition),
(2) Al-Si18-Cu-Mg-Ni (hypereutectic composition), and
(3) Al-Si12-Cu4-Ni-Mg (special eutectic alloy).
Their yield strength and fatigue strength diminish rapidly with increased temperature
due to coarsening and dissolution of their precipitated phases, as depicted in Table 1
[14]. The major strengthening phases in the eutectic and hypereutectic alloys are
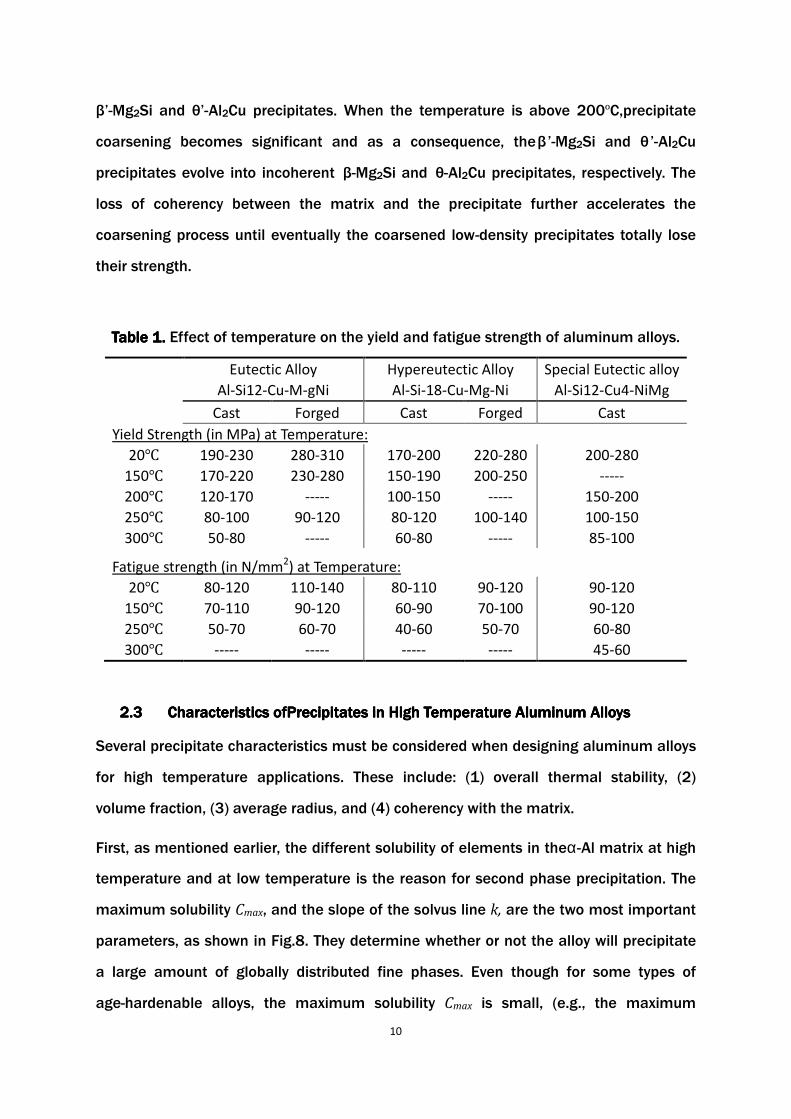
10
β’-Mg2Si and θ’-Al2Cu precipitates. When the temperature is above 200ºC,precipitate
coarsening becomes significant and as a consequence, theβ’-Mg2Si and θ’-Al2Cu
precipitates evolve into incoherent β-Mg2Si and θ-Al2Cu precipitates, respectively. The
loss of coherency between the matrix and the precipitate further accelerates the
coarsening process until eventually the coarsened low-density precipitates totally lose
their strength.
Table 1.Table 1.Table 1.Table 1. Effect of temperature on the yield and fatigue strength of aluminum alloys.
Eutectic Alloy
Al-Si12-Cu-M-gNi
Hypereutectic Alloy
Al-Si-18-Cu-Mg-Ni
Special Eutectic alloy
Al-Si12-Cu4-NiMg
Cast Forged Cast Forged Cast
Yield Strength (in MPa) at Temperature:
20X 190-230 280-310 170-200 220-280 200-280
150X 170-220 230-280 150-190 200-250 -----
200X 120-170 ----- 100-150 ----- 150-200
250X 80-100 90-120 80-120 100-140 100-150
300X 50-80 ----- 60-80 ----- 85-100
Fatigue strength (in N/mm2) at Temperature:
20X 80-120 110-140 80-110 90-120 90-120
150X 70-110 90-120 60-90 70-100 90-120
250X 50-70 60-70 40-60 50-70 60-80
300X ----- ----- ----- ----- 45-60
2.32.32.32.3 Characteristics ofCharacteristics ofCharacteristics ofCharacteristics ofPPPPrecipitates in recipitates in recipitates in recipitates in HHHHigh Temperature igh Temperature igh Temperature igh Temperature AAAAluminum luminum luminum luminum AAAAlloyslloyslloyslloys
Several precipitate characteristics must be considered when designing aluminum alloys
for high temperature applications. These include: (1) overall thermal stability, (2)
volume fraction, (3) average radius, and (4) coherency with the matrix.
First, as mentioned earlier, the different solubility of elements in theα-Al matrix at high
temperature and at low temperature is the reason for second phase precipitation. The
maximum solubility Cmax, and the slope of the solvus line k, are the two most important
parameters, as shown in Fig.8. They determine whether or not the alloy will precipitate
a large amount of globally distributed fine phases. Even though for some types of
age-hardenable alloys, the maximum solubility Cmax is small, (e.g., the maximum

11
equilibrium solubility of scandium and zirconium in aluminumis only 0.28 at.%[15] and
0.083 at.%[16], respectively) they still yield excellent precipitation strengthening by
means of proper heat treatment because the slop of the solvus line k for the alloy is
very steep.
Fig.8.Fig.8.Fig.8.Fig.8.The maximum solubility and solvus line in
(a) eutectic alloys and in (b) peritectic alloys.
Second, the average size of the precipitates strongly influences the yield strength of the
alloy. For the precipitate looping, stacking-fault, and Chemical Strengthening
mechanisms, the smaller the precipitate, the higher the yield strength of the alloy.
However, there is an optimum radius for the coherent strengthening mechanism where
strengthening is maximized.
Third, Fine [17] suggested that when the precipitate is coherent and coplanar with the
matrix, dislocations in the matrix can readily traverse through the precipitate particles,
and if the precipitate and matrix have different structures, then the dislocations which
traverse the precipitate create stacking faults in the precipitate. Since a large amount
of energy is required to create the stacking fault and the traversing dislocation creates
more stacking fault with each unit of slip, this is a very effective strengthening
mechanism for elevated temperatures. Also, the coherent-coplanar correspondence
between the precipitate and matrix means that the precipitate-matrix interface is a low
QYZ[ Q\
]
L
� . ] � . ^
k
QYZ[
]
L
� . ] � . ^
k
Te
mp
era
ture
Te
mp
era
ture
Composition Composition
(a) Eutectic alloys (b) Peritectic alloys
12
energy interface and there is little tendency forcoarsening or coalescence of the
precipitateparticles. Therefore, good coherency between the precipitate particles and
the matrix is favored for precipitation strengthening.
Fourth, low diffusivity of the solute elements in the matrix effectively minimizes the
coarsening of the precipitate particles at high temperature.
2.42.42.42.4 Transition Transition Transition Transition MMMMetals that etals that etals that etals that FFFForm orm orm orm AAAAluminides with luminides with luminides with luminides with MMMMetaetaetaeta----stable stable stable stable L1L1L1L12222SSSStructuretructuretructuretructure
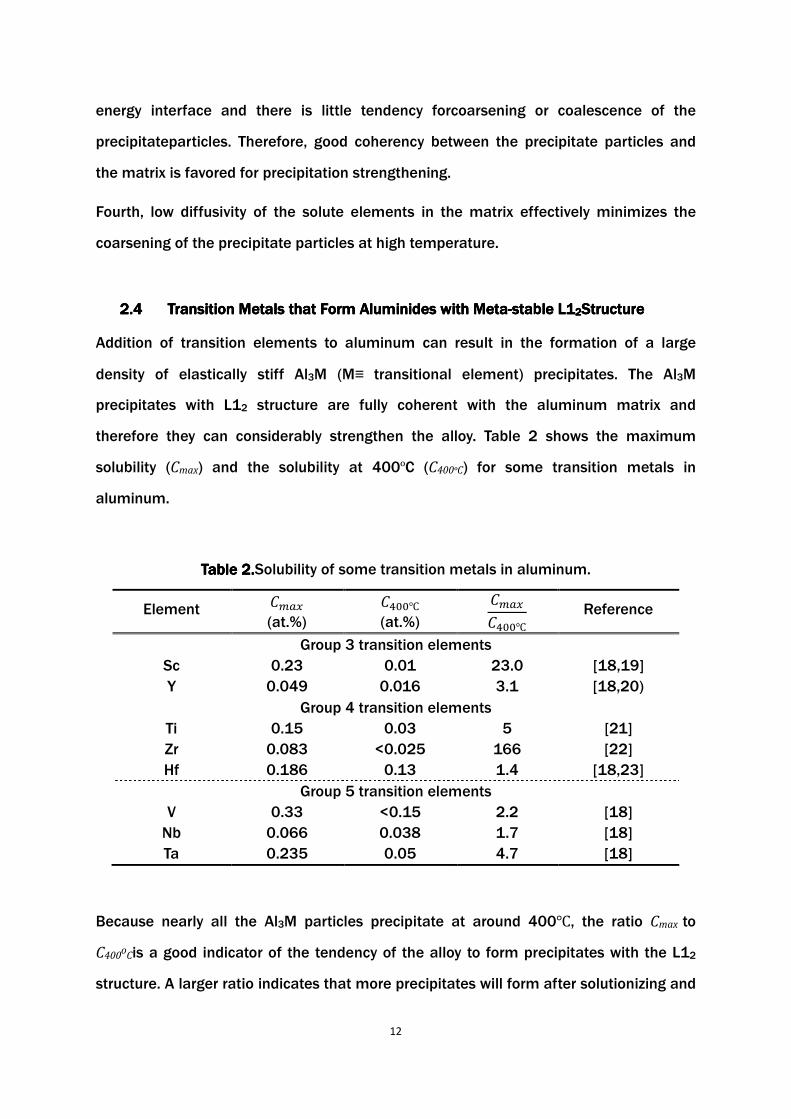
Addition of transition elements to aluminum can result in the formation of a large
density of elastically stiff Al3M (M≡ transitional element) precipitates. The Al3M
precipitates with L12 structure are fully coherent with the aluminum matrix and
therefore they can considerably strengthen the alloy. Table 2 shows the maximum
solubility (Cmax) and the solubility at 400ºC (C400ºC) for some transition metals in
aluminum.
Table 2Table 2Table 2Table 2....Solubility of some transition metals in aluminum.
Element QH�_ (at.%)
Q?``X (at.%)
QH�_Q?``X
Reference
Group 3 transition elements
Sc 0.23 0.01 23.0 [18,19]
Y 0.049 0.016 3.1 [18,20)
Group 4 transition elements
Ti 0.15 0.03 5 [21]
Zr 0.083 <0.025 166 [22]
Hf 0.186 0.13 1.4 [18,23]
Group 5 transition elements
V 0.33 <0.15 2.2 [18]
Nb 0.066 0.038 1.7 [18]
Ta 0.235 0.05 4.7 [18]
Because nearly all the Al3M particles precipitate at around 400X, the ratio Cmax to
C400o
Cis a good indicator of the tendency of the alloy to form precipitates with the L12
structure. A larger ratio indicates that more precipitates will form after solutionizing and

13
aging. As Table 2 indicates, zirconium and scandium are superior to the other transition
metals in that respect; accordingly they have been comprehensively studied [35]-[52].
However, the high cost of scandium limits its application and the mechanical properties
of Al-Zr alloys are far below what is expected.
The diffusivity of transition metals in aluminum directly influences the thermal stability
of the Al3M precipitates. As Table 3 shows, the diffusion coefficients of the various
transition metals in aluminum at 400ºC are at least three magnitudes smaller than that
of copper (2.27 < 101(? m/s)[29] or Mg (6.14 < 101(? m/s)[30] in aluminum. Therefore,
Al3M precipitates are more thermally stable than traditional precipitation hardening
phases, such as θ′-Al2Cu and β′-Mg2Si.
Table 3Table 3Table 3Table 3.... Diffusion coefficients of some transition metals in aluminum.
Element Do
m!s1( Q
kJmol1( P at 400X
m!s1( Reference
Sc 5.31 < 101? 124 1.98 < 101(h [24]
Ti 1.12 < 101( 260 7.39 < 101!! [25]
V 1.60 303 4.85 < 101!? [24]
Zr 7.28 < 101! 242 1.20 < 101!` [25]
Hf 1.07 < 101! 242 2.11 < 101!( [26]
Cr 10.00 282 1.29 < 101!( [27]
Fe 7.7 < 101( 221 5.14 < 101(i [28]
Coherency determines the strengthening mechanisms and the thermal stability of
precipitates. Lower misfit with the aluminum matrix not only leads to better thermal
stability of the precipitate, but it also results in higher yield strength at high
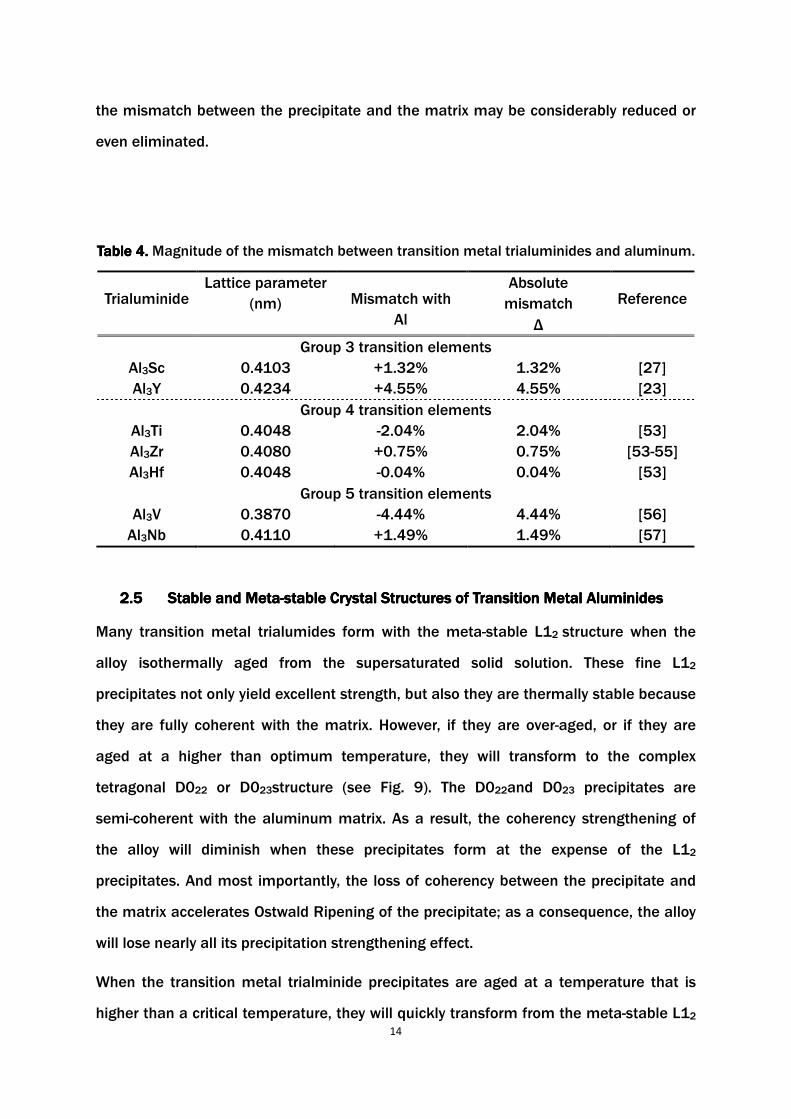
temperature. Table 4 shows the mismatch of some Al3M precipitates with aluminum.
All the phases are metastable and have the L12 structure. As Table 4 shows, Sc, Y, Zr,
and Nb trialuminides have a positive mismatch with aluminum; while Ti, Hf, and V
trialminides have a negative mismatch. A possible way to decrease the misfit between
the precipitate and the matrix is to alloy the L12 precipitates. Some alloying elements
may change the lattice parameter of the L12 precipitate and by a proper heat treatment
14
the mismatch between the precipitate and the matrix may be considerably reduced or
even eliminated.
Table 4Table 4Table 4Table 4.... Magnitude of the mismatch between transition metal trialuminides and aluminum.
Trialuminide Lattice parameter
(nm) Mismatch with
Al
Absolute
mismatch
∆
Reference
Group 3 transition elements
Al3Sc 0.4103 +1.32% 1.32% [27]
Al3Y 0.4234 +4.55% 4.55% [23]
Group 4 transition elements
Al3Ti 0.4048 -2.04% 2.04% [53]
Al3Zr 0.4080 +0.75% 0.75% [53-55]
Al3Hf 0.4048 -0.04% 0.04% [53]
Group 5 transition elements
Al3V 0.3870 -4.44% 4.44% [56]
Al3Nb 0.4110 +1.49% 1.49% [57]
2.52.52.52.5 Stable and Stable and Stable and Stable and MMMMetaetaetaeta----stable stable stable stable CCCCrystal rystal rystal rystal SSSStructures of tructures of tructures of tructures of TTTTransition Metal Aluminidesransition Metal Aluminidesransition Metal Aluminidesransition Metal Aluminides
Many transition metal trialumides form with the meta-stable L12 structure when the
alloy isothermally aged from the supersaturated solid solution. These fine L12
precipitates not only yield excellent strength, but also they are thermally stable because
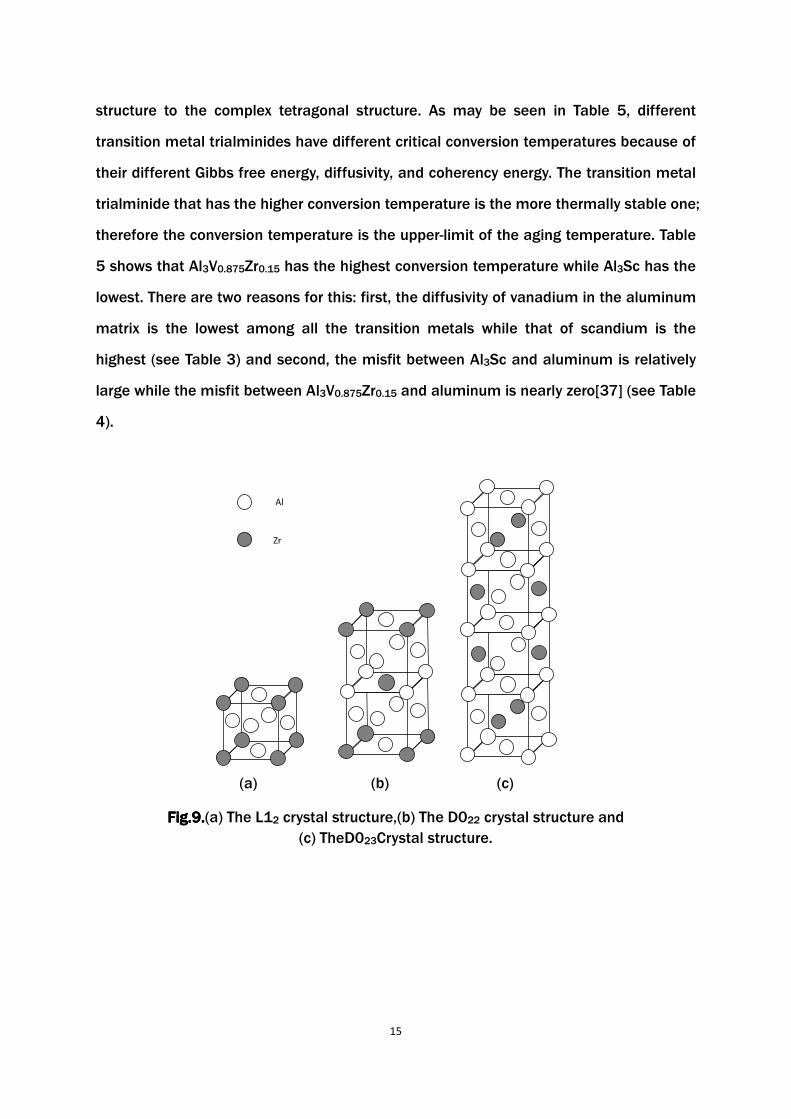
they are fully coherent with the matrix. However, if they are over-aged, or if they are
aged at a higher than optimum temperature, they will transform to the complex
tetragonal D022 or D023structure (see Fig. 9). The D022and D023 precipitates are
semi-coherent with the aluminum matrix. As a result, the coherency strengthening of
the alloy will diminish when these precipitates form at the expense of the L12
precipitates. And most importantly, the loss of coherency between the precipitate and
the matrix accelerates Ostwald Ripening of the precipitate; as a consequence, the alloy
will lose nearly all its precipitation strengthening effect.
When the transition metal trialminide precipitates are aged at a temperature that is
higher than a critical temperature, they will quickly transform from the meta-stable L12
15
structure to the complex tetragonal structure. As may be seen in Table 5, different
transition metal trialminides have different critical conversion temperatures because of
their different Gibbs free energy, diffusivity, and coherency energy. The transition metal
trialminide that has the higher conversion temperature is the more thermally stable one;
therefore the conversion temperature is the upper-limit of the aging temperature. Table
5 shows that Al3V0.875Zr0.15 has the highest conversion temperature while Al3Sc has the
lowest. There are two reasons for this: first, the diffusivity of vanadium in the aluminum
matrix is the lowest among all the transition metals while that of scandium is the
highest (see Table 3) and second, the misfit between Al3Sc and aluminum is relatively
large while the misfit between Al3V0.875Zr0.15 and aluminum is nearly zero[37] (see Table
4).
(a) (b) (c)
Fig.9.Fig.9.Fig.9.Fig.9.(a) The L12 crystal structure,(b) The D022 crystal structure and
(c) TheD023Crystal structure.
Zr
Al

16
Table 5Table 5Table 5Table 5....Conversion temperature and stable structure of transition metal trialumindes.
Phase Meta-stable
structure
Conversion
temperature
Stable
structure Reference
Al3Sc L12 350ºC 26 facets L12 [33]
Al3Zr L12 >500ºC Fan or rod
shape D023
[32]
[34]
Al3Sc0.6Zr0.4 L12 500ºC Rod shape
D023 [35]
Al3V0.875Zr0.15 L12 600ºC Rod shape
D023 [33]
2.6 2.6 2.6 2.6 Alloying Alloying Alloying Alloying Zirconium Trialuminide (Zirconium Trialuminide (Zirconium Trialuminide (Zirconium Trialuminide (AlAlAlAl3333ZrZrZrZr)with)with)with)with Other Other Other Other TTTTransition ransition ransition ransition MMMMetaletaletaletalssss
As mentioned earlier, aluminum alloys that contain Al3Sc and Al3Zrare among the most
promising alloys for high temperature applications; and therefore a large number of
studies have been devoted to investigating the potential of alloying the Al3Zr and Al3Sc
precipitates in these alloys with other transition elements while retaining the L12
structure. Some of these studies are listed in Table 6.
Basically, there are three motivations behind alloying Al3Zr and Al3Sc with other
transition metals. These are; (1) Al3Sc has excellent properties at high temperature;
however, it is too expensive. Therefore, substituting Sc with another element may
decrease the cost of the alloy[35-42]. (2) The misfit between the precipitate and the
matrix is an important parameter in precipitation hardening. Therefore, some
researchers[37] tried to alloy the Al3Zr and Al3Sc precipitates with other transition
metal(s) in order to decrease the misfit, and thus increase the thermal stability of the
precipitate. Others [44, 49] believed that a larger coherent misfit can enhance the
creep resistance of the alloy and so they tried to increase the misfit by alloying the
precipitate. (3) In Ostwald Ripening the large precipitates grow even larger at the
expense of the smaller precipitates. Researchers at U.C. Berkeley successfully made the
size of the Al3Sc precipitates uniform by alloying the precipitate with Li and Zr, and thus
they managed to improve the thermal stability of the alloy[43].
Among all these alloyed Al3M precipitates, Al3ZrxV1-x is the most interesting, mainly

17
because of the low diffusivity of vanadium in aluminum, and the low misfit between
Al3ZrxV1-x particles and aluminum, which make alloys that contain these precipitates
thermally stable. Moreover, vanadium can substitute for a large fraction of the
zirconium (as high as 87.5%); and the liquidus temperature of the vanadium-aluminum
system is considerably lower than that of other transition metal-aluminum systems.
Table 6.Table 6.Table 6.Table 6.Alloying elements in Al3Sc and Al3Zr trialuminides.
Trialuminide Alloying elements Reference
Al3Sc
Zr [35–42]
Si [47]
La elements
Tb [48]
Ho [48]
Tm [48]
Lu [48]
Gd [44]
Yb [44]
Li, Zr [43]
Zr, Hf [46]
Al3Zr
V [33, 51, 51]
Ti [45, 50]
Er [49]
Sc [35–42]
Sc, Hf [46]
2.7 2.7 2.7 2.7 ManufacturManufacturManufacturManufacturinginginging IssuesIssuesIssuesIssues
The equilibrium form of the majority of the transition metal trialuminides forms by a
peritectic reaction and the precipitate that forms is often coarse, incoherent with the
aluminum matrix, and adds little strength to the alloy. Thus, formation of the
18
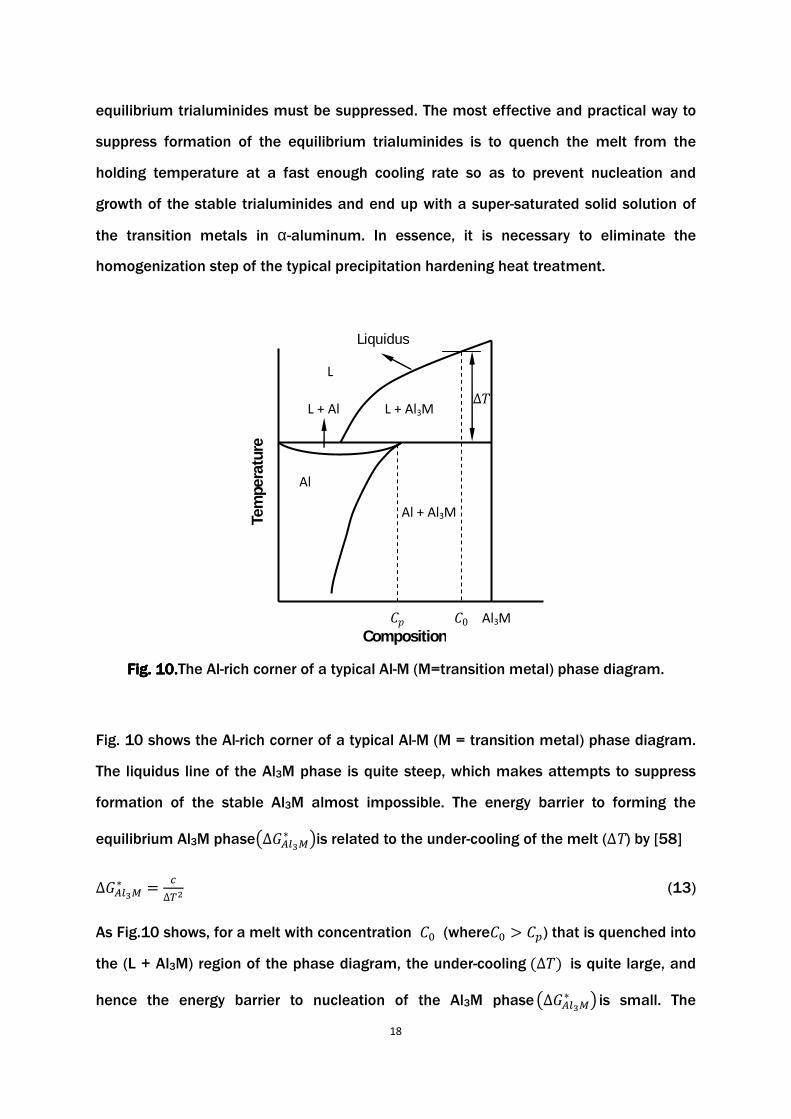
equilibrium trialuminides must be suppressed. The most effective and practical way to
suppress formation of the equilibrium trialuminides is to quench the melt from the
holding temperature at a fast enough cooling rate so as to prevent nucleation and
growth of the stable trialuminides and end up with a super-saturated solid solution of
the transition metals in α-aluminum. In essence, it is necessary to eliminate the
homogenization step of the typical precipitation hardening heat treatment.
Fig. 10.Fig. 10.Fig. 10.Fig. 10.The Al-rich corner of a typical Al-M (M=transition metal) phase diagram.
Fig. 10 shows the Al-rich corner of a typical Al-M (M = transition metal) phase diagram.
The liquidus line of the Al3M phase is quite steep, which makes attempts to suppress
formation of the stable Al3M almost impossible. The energy barrier to forming the
equilibrium Al3M phase0∆�jk%lm 3is related to the under-cooling of the melt (ΔT) by [58]
∆�jk%lm � J∆n� (13)
As Fig.10 shows, for a melt with concentration Q` (whereQ` F Q6) that is quenched into
the (L + Al3M) region of the phase diagram, the under-cooling &∆o' is quite large, and hence the energy barrier to nucleation of the Al3M phase0∆�jk%lm 3 is small. The
Composition Al3M
Tem
pera
ture
L
L + Al3M
Al
Al + Al3M
L + Al
Liquidus
∆o
Q0 Qp

19
Volmer-Weber theory [58] relates the homogenous nucleation rate (I) of theAl3M phase
to the energy barrier to nucleation, ∆�jk%lm
q � ro\[p N ∆�stuvwn" exp {N ∆�u|%}m
tuvwn~ (14)
where O�is the Boltzmann constant, and ∆�� is the free energy of activation for the
short-range diffusion of a mole of atoms or molecules moving a fraction of an atomic
distance across an interface to join a new lattice. Fig. 11 shows the process of
nucleation of the Al3M phase during continuous cooling based on Eq. (14). The change
in the number of Al3M nuclei with time follows an S-shape curve, and whenM � Mm, the
number of nuclei is almost zero. Therefore, there is a critical cooling rate at which
nucleation of the equilibrium Al3M phase could be avoided.
Fig.Fig.Fig.Fig.11.11.11.11. Schematic representation of the nucleation of the Al3Mphase from the melt.
2.82.82.82.8 The AlThe AlThe AlThe Al----Zr Zr Zr Zr SystemSystemSystemSystem
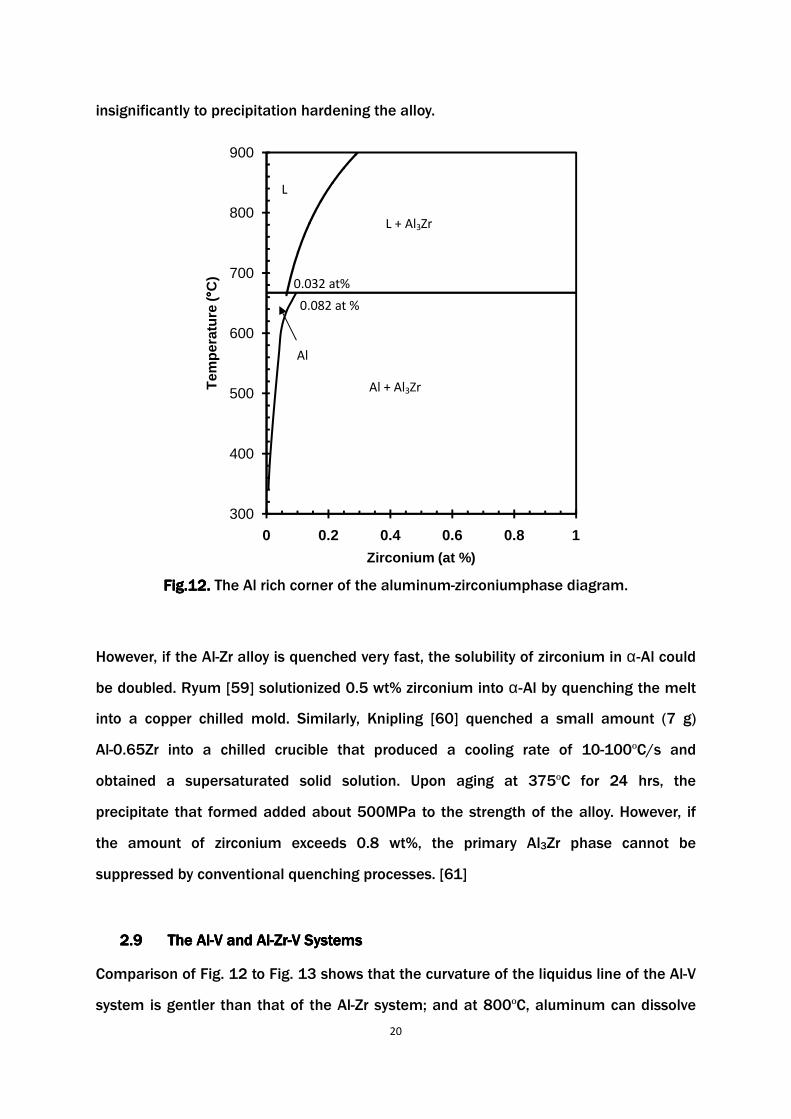
Fig.12 shows the Al-rich corner of the Al-Zr phase diagram [22]. The maximum solubility
of Zr in α-Al is 0.08 at % (0.28 wt %) at 667ºC, but even if all that zirconium is dissolved
into α-Al at 667ºC, only about 0.3% volume fraction of Al3Zr particles will precipitate
after aging.According to the Ashby-Orowan theory, such a small amount contributes
Time � �m
Slow cooling rate
Critical cooling rate
Fast cooling rate
0
Al3Zr Al3(Zr,V)
�m�
Al3V
�m��
20
insignificantly to precipitation hardening the alloy.
Fig.12.Fig.12.Fig.12.Fig.12. The Al rich corner of the aluminum-zirconiumphase diagram.
However, if the Al-Zr alloy is quenched very fast, the solubility of zirconium in α-Al could
be doubled. Ryum [59] solutionized 0.5 wt% zirconium into α-Al by quenching the melt
into a copper chilled mold. Similarly, Knipling [60] quenched a small amount (7 g)
Al-0.65Zr into a chilled crucible that produced a cooling rate of 10-100ºC/s and
obtained a supersaturated solid solution. Upon aging at 375ºC for 24 hrs, the
precipitate that formed added about 500MPa to the strength of the alloy. However, if
the amount of zirconium exceeds 0.8 wt%, the primary Al3Zr phase cannot be
suppressed by conventional quenching processes. [61]
2.2.2.2.9999 The AlThe AlThe AlThe Al----V and AlV and AlV and AlV and Al----ZrZrZrZr----V SystemV SystemV SystemV Systemssss
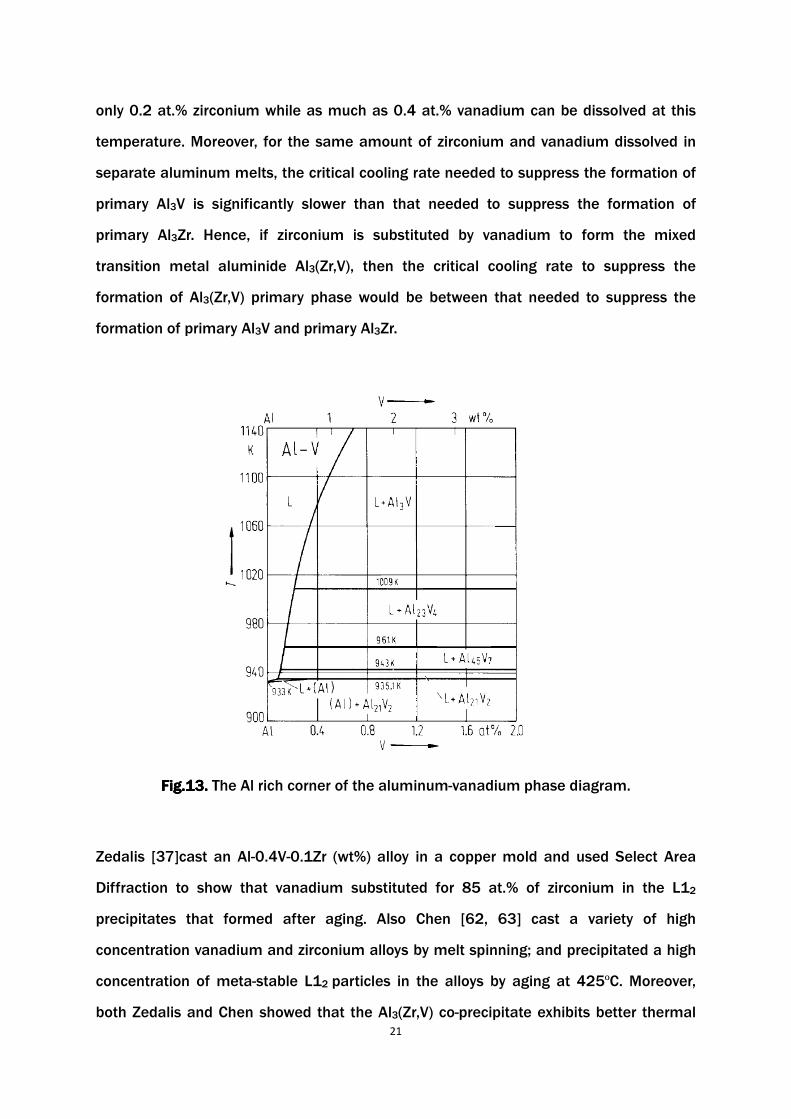
Comparison of Fig. 12 to Fig. 13 shows that the curvature of the liquidus line of the Al-V
system is gentler than that of the Al-Zr system; and at 800ºC, aluminum can dissolve
300
400
500
600
700
800
900
0 0.2 0.4 0.6 0.8 1
Tem
per
atu
re ( °° °°
C)
Zirconium (at %)
Al + Al3Zr
Al
L
L + Al3Zr
0.032 at%
0.082 at %
21
only 0.2 at.% zirconium while as much as 0.4 at.% vanadium can be dissolved at this
temperature. Moreover, for the same amount of zirconium and vanadium dissolved in
separate aluminum melts, the critical cooling rate needed to suppress the formation of
primary Al3V is significantly slower than that needed to suppress the formation of
primary Al3Zr. Hence, if zirconium is substituted by vanadium to form the mixed
transition metal aluminide Al3(Zr,V), then the critical cooling rate to suppress the
formation of Al3(Zr,V) primary phase would be between that needed to suppress the
formation of primary Al3V and primary Al3Zr.
Fig.13.Fig.13.Fig.13.Fig.13. The Al rich corner of the aluminum-vanadium phase diagram.
Zedalis [37]cast an Al-0.4V-0.1Zr (wt%) alloy in a copper mold and used Select Area
Diffraction to show that vanadium substituted for 85 at.% of zirconium in the L12
precipitates that formed after aging. Also Chen [62, 63] cast a variety of high
concentration vanadium and zirconium alloys by melt spinning; and precipitated a high
concentration of meta-stable L12 particles in the alloys by aging at 425ºC. Moreover,
both Zedalis and Chen showed that the Al3(Zr,V) co-precipitate exhibits better thermal
22
stability than the Al3Zr precipitate.
The ternary phase diagrams of the Al-Zr-V system aid inproducing L12 precipitates in
this system. Basically, there are two requirements to get L12precipitates:
(1) All the zirconium and vanadium must be dissolved into the liquid aluminum and
form a super-saturated solid solution upon freezing. As Fig. 14 shows, the
maximum solubility of vanadium plus zirconium is about 5 at.% at 1100ºC, and
the ratio of vanadium to zirconium at this point is 2.5. But since the typical
pouring temperature for foundry casting is much lower than 1100ºC (about
780ºC), and since typical cooling rates during foundry casting are slow, then the
practical amount of zirconium plus vanadium must be significantly less than 5
at.%
(2) The tendency to form L12 precipitates depends to a large extent on how steep
the solvus line of the system is. A steeper solvus line equates to a higher
tendency to form a metastable L12precipitate. Fig.15 shows that only trace
amounts of zirconium or vanadium dissolve in aluminum at 477ºC, and thus the
driving force to precipitate metastable particles is high.

23
Fig.14.Fig.14.Fig.14.Fig.14. Isothermal ternary phase diagram of the Al-Zr-V system at 1100ºC.
Fig.15.Fig.15.Fig.15.Fig.15. Isothermal ternary phase diagram of the Al-Zr-V at 477ºC.
24
2.2.2.2.10 10 10 10 EffectEffectEffectEffect of Siof Siof Siof Silicon licon licon licon and and and and Ironon PrecipitationIronon PrecipitationIronon PrecipitationIronon Precipitation of Transition Metal Aluminides in of Transition Metal Aluminides in of Transition Metal Aluminides in of Transition Metal Aluminides in
AluminumAluminumAluminumAluminum
Adding silicon and iron to an Al-Zr alloy accelerates the precipitation rate of Al3Zr [64,
65]. Hori et al. [65] investigated the precipitation behavior of Al3Zr with transmission
electron microscopy (TEM) and with resistivity measurements and concluded that
silicon provides nucleation sites for the continuous precipitation of Al3Zr. Takeshi [65]
suggested that adding iron to an Al-Zr alloy slightly accelerates the precipitation of Al3Zr,
while adding silicon more significantly accelerates it. The most significant effect occurs
at temperatures 50-100K below the temperature at which the maximum amount of
zirconium precipitates in the Al-Zr-Fe and Al-Zr-Si alloys.
25
3.3.3.3. ApparatusApparatusApparatusApparatuseseseses and Procedureand Procedureand Procedureand Proceduressss
3.13.13.13.1 DesignDesignDesignDesign of the of the of the of the MoldMoldMoldMold used in Measuring the Critical Cooling Rateused in Measuring the Critical Cooling Rateused in Measuring the Critical Cooling Rateused in Measuring the Critical Cooling Rate
The driving force to precipitate primary transition metal aluminides in aluminum is
quite large[54]. Therefore, a very high cooling rate is necessary in order to suppress
their nucleation. In order to quantify the critical cooling rate necessary to suppress the
formation of primary Al3Zr and Al3(Zr,V) in Al-Zr, Al-Zr-V alloys, a mold was designed and
manufactured to quench the alloys at various cooling rates. The mold was designed to
meet two requirements:(1)It provides a cooling rate gradient along the length of the
mold; and (2) the fastest cooling rate is about 100ºC/s, which is in the range of cooling
rates typical of high pressure die casting aluminum alloys. In order to meet these
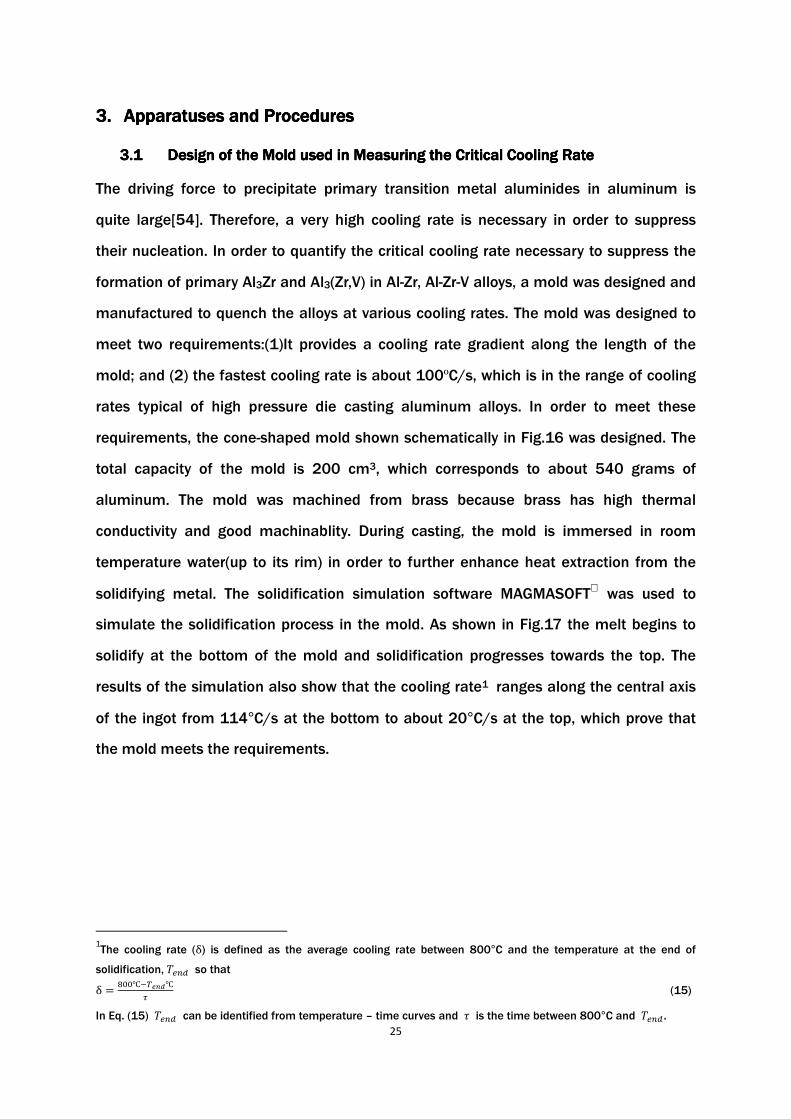
requirements, the cone-shaped mold shown schematically in Fig.16 was designed. The
total capacity of the mold is 200 cm3, which corresponds to about 540 grams of
aluminum. The mold was machined from brass because brass has high thermal
conductivity and good machinablity. During casting, the mold is immersed in room
temperature water(up to its rim) in order to further enhance heat extraction from the
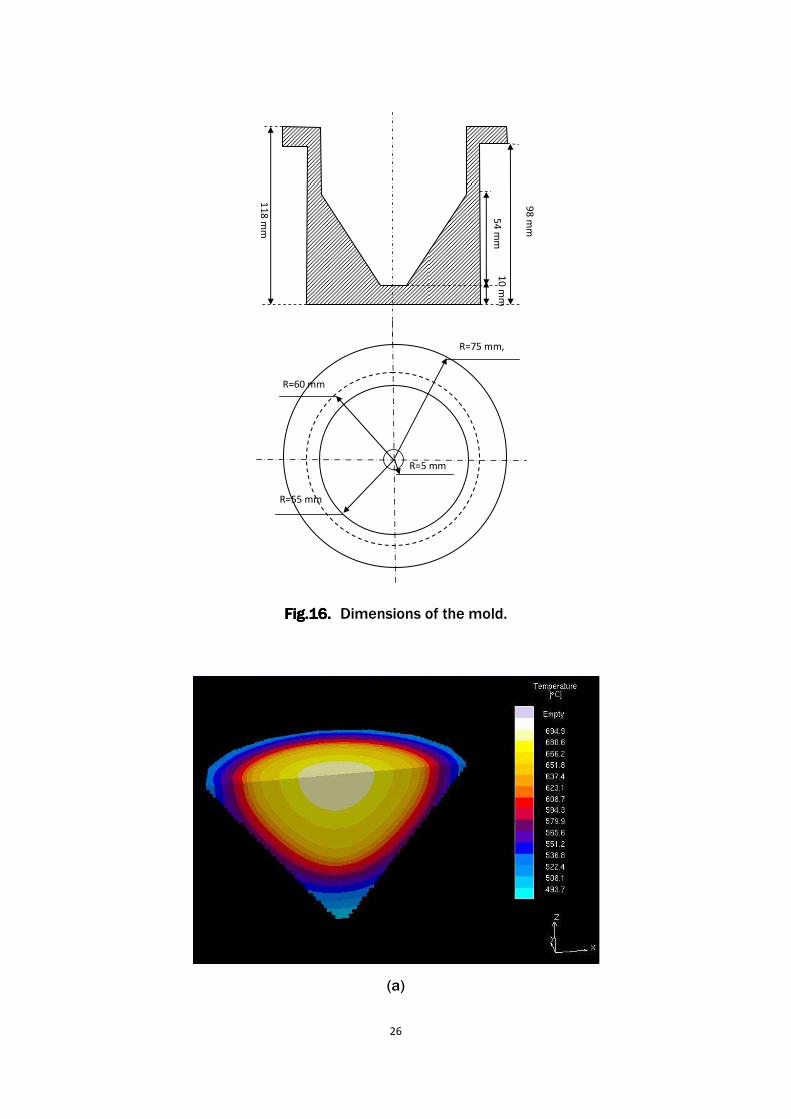
solidifying metal. The solidification simulation software MAGMASOFT was used to
simulate the solidification process in the mold. As shown in Fig.17 the melt begins to
solidify at the bottom of the mold and solidification progresses towards the top. The
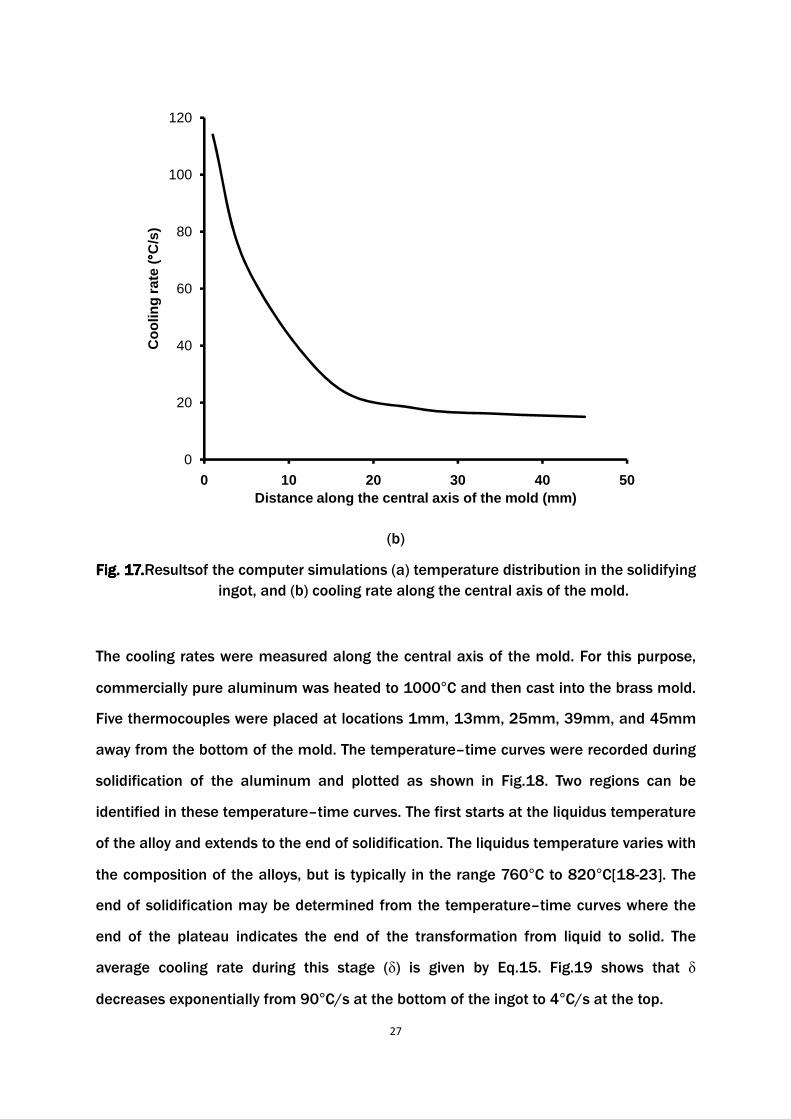
results of the simulation also show that the cooling rate1 ranges along the central axis
of the ingot from 114°C/s at the bottom to about 20°C/s at the top, which prove that
the mold meets the requirements.
1The cooling rate (δ) is defined as the average cooling rate between 800°C and the temperature at the end of
solidification, oR�� so that δ � i``X1nU��X
� (15)
In Eq. (15) oR�� can be identified from temperature – time curves and � is the time between 800°C and oR�� .
26
Fig.16.Fig.16.Fig.16.Fig.16. Dimensions of the mold.
(a)
R=55 mm
R=60 mm
R=75 mm,
R=5 mm
11
8 m
m
98
mm
10
mm
5
4 m
m
27
(b)
Fig. 17.Fig. 17.Fig. 17.Fig. 17.Resultsof the computer simulations (a) temperature distribution in the solidifying
ingot, and (b) cooling rate along the central axis of the mold.
The cooling rates were measured along the central axis of the mold. For this purpose,
commercially pure aluminum was heated to 1000°C and then cast into the brass mold.
Five thermocouples were placed at locations 1mm, 13mm, 25mm, 39mm, and 45mm
away from the bottom of the mold. The temperature–time curves were recorded during
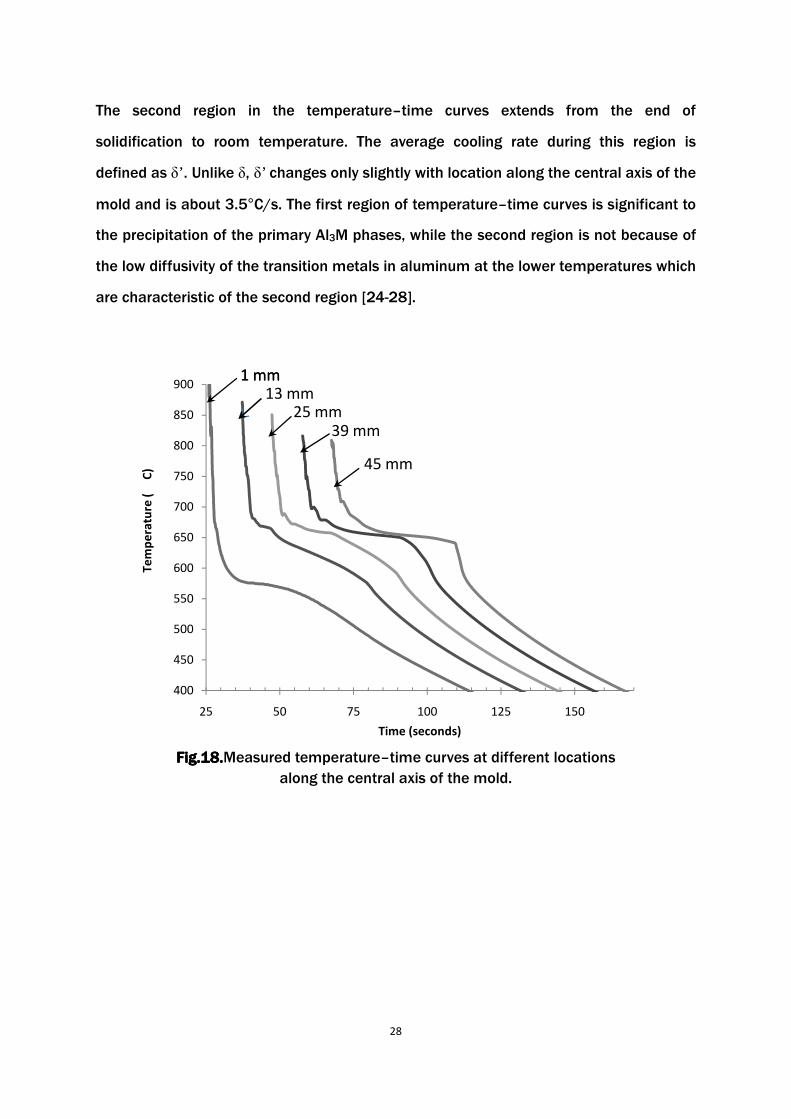
solidification of the aluminum and plotted as shown in Fig.18. Two regions can be
identified in these temperature–time curves. The first starts at the liquidus temperature
of the alloy and extends to the end of solidification. The liquidus temperature varies with
the composition of the alloys, but is typically in the range 760°C to 820°C[18-23]. The
end of solidification may be determined from the temperature–time curves where the
end of the plateau indicates the end of the transformation from liquid to solid. The
average cooling rate during this stage (δ) is given by Eq.15. Fig.19 shows that δ
decreases exponentially from 90°C/s at the bottom of the ingot to 4°C/s at the top.
0
20
40
60
80
100
120
0 10 20 30 40 50
Co
olin
g r
ate
( °° °°C
/s)
Distance along the central axis of the mold (mm)
28
The second region in the temperature–time curves extends from the end of
solidification to room temperature. The average cooling rate during this region is
defined as δ’ . Unlike δ, δ’ changes only slightly with location along the central axis of the
mold and is about 3.5°C/s. The first region of temperature–time curves is significant to
the precipitation of the primary Al3M phases, while the second region is not because of
the low diffusivity of the transition metals in aluminum at the lower temperatures which
are characteristic of the second region [24-28].
Fig.18.Fig.18.Fig.18.Fig.18.Measured temperature–time curves at different locations
along the central axis of the mold.
400
450
500
550
600
650
700
750
800
850
900
25 50 75 100 125 150
Te
mp
era
ture
(
C)
Time (seconds)
1 mm1 mm13 mm
25 mm39 mm
45 mm

29
Fig.19.Fig.19.Fig.19.Fig.19. Measured average cooling rates along the central axis of the ingot.
3.2 3.2 3.2 3.2 Design of the Mold used in Measuring Tensile PropertiesDesign of the Mold used in Measuring Tensile PropertiesDesign of the Mold used in Measuring Tensile PropertiesDesign of the Mold used in Measuring Tensile Properties
A water-chilled mold shown schematically in Fig.20 was designed to produce samples
for measuring tensile properties. The mold is made of copper to achieve a high cooling
rate. Five water channels are drilled in the mold walls to enhance heat extraction from
the ingot. The shape of the cast ingot is a disk 0.5 inches in height and 2 inches in
diameter, which can then be machine to yield standard tensile test samples. The
average cooling rate in an ingot cast in this mold was measured at 3 locations along the
thickness of the ingot and was found to be 160°C/s at the top, 60°C/s at the middle,
and 28°C/s at bottom.
0
10
20
30
40
50
60
70
80
90
0 10 20 30 40 50
Ave
rag
e co
olin
g r
ate
( °° °°C
/s)
Distance from the bottom (mm)

Fig.20.Fig.20.Fig.20.Fig.20. Schematic representation of the water
for tensile property measurements.
Fig.Fig.Fig.Fig. 21.21.21.21.Measured average cooling rate
A
A
30
Schematic representation of the water-chilled mold used to cast ingots
for tensile property measurements.
average cooling rate along the thickness of ingots cast
in the water-chilled mold.
0.5
”
2”
A
used to cast ingots
along the thickness of ingots cast

31
3.33.33.33.3 Melt Preparation, Melt Preparation, Melt Preparation, Melt Preparation, Casting, Heat TreCasting, Heat TreCasting, Heat TreCasting, Heat Treatmentatmentatmentatment,,,, and Microstructure and Microstructure and Microstructure and Microstructure
CharacterizationCharacterizationCharacterizationCharacterization
3.3.13.3.13.3.13.3.1 Melt Preparation and CastingMelt Preparation and CastingMelt Preparation and CastingMelt Preparation and Casting – Alloys with the chemical compositions shown in
Table 7 were prepared by induction melting. The alloys were prepared from Al-65%V master
alloy, 99% purity K2ZrF9 salt, 99% purity silicon, and 99.99% purity aluminum. The Al-65V
master alloy was pre-ground into ¼ mesh (6.3mm sieve opening).
Table 7.Table 7.Table 7.Table 7.Chemical compositions of the alloys.
Alloy # Zr (wt.%) V (wt.%) Si (wt.%) Al (wt.%)
1 0.6 0 <0.01 Balance
2 0.1 0.4 <0.01 Balance
3 0.1 0.4 0.2 Balance
4 0.15 0.6 <0.01 Balance
5 0.15 0.6 0.2 Balance
The melting and holding temperature of the alloys was 800°C, which is high enough to
ensure that all the zirconium and vanadium melted and dissolved in the aluminum.
Alloys 1 to 5 were poured into the cone-shaped brass mold which was immersed in
room-temperature water. The pouring temperature was approximately 780°C, which is
above the liquidus temperature of the alloys. Alloy 2 was also cast in the water-chilled
copper mold in order to produce ingots that were then machined into standard
specimens for measuring tensile properties. Alloy 2 was degassed with Ar prior to
casting in the water-chilled copper mold.

32
3.3.23.3.23.3.23.3.2 Establishing the Critical Cooling RateEstablishing the Critical Cooling RateEstablishing the Critical Cooling RateEstablishing the Critical Cooling Rate – In order to establish the critical cooling
rate for the Al-0.6Zr and Al-0.4-0.1Zr alloys, samples were extracted from the ingots
that were cast in the cone-shaped mold at different locations along the central axis of
the ingot so as to represent different cooling rates. The samples were mounted in
Bakelite and prepared for metallographic examination using standard procedures. The
primary Al3M phases present in each sample were then observed by a scanning
electron microscope (SEM)2 and the fraction of the primary phases were counted by
means of image analysis software3.
3.3.33.3.33.3.33.3.3 Heat TreatmentHeat TreatmentHeat TreatmentHeat Treatment, , , , Hardness Measurement,Hardness Measurement,Hardness Measurement,Hardness Measurement, and Microstructure Characterizationand Microstructure Characterizationand Microstructure Characterizationand Microstructure Characterization
–Samples were cut from the ingots that were cast in the cone-shaped brass mold from
the location where the cooling rate was 85°C/s. These samples were aged in a box
furnace according to the schedule shown in Table 8. Evolution of the Al3Zr and Al3(ZrxV1-x)
precipitates during aging was monitored by a measuring the Vickers microhardness of
the specimens, and by transmission electron microscopy4.The Vickers microhardness
measurements were performed at room temperature with a load of 200g and a dwell
time of 5 seconds on samples that were prepared by standard metallographic
techniques. For characterizing the samples with conventional transmission electron
microscopy, foils were prepared by mechanical grinding sections of the samples to a
thickness of about 70µm. Discs with 3 mm diameter were then punched from these
foils and thinned to perforation by twin-jet electropolishing at 20V DC with a 25 vol.%
solution of nitric acid in methanol at -20°C. Samples for High Resolution TEM were
prepared by the focused ion beam (FIB) technique. The samples had an area of
approximately 1µm ×××× 3µm and were thinned to 20nm thickness.
2 Model JEOL 7000, JEOL USA, Inc., Dearborn Road, Peabody, MA 01960.
3Image-J software.
4 JOEL TEM 2010F and JOEL TEM 100CX, JEOL USA, Inc., Dearborn Road, Peabody, MA 01960.

33
Table 8.Table 8.Table 8.Table 8. Aging schedule.
Alloy Aging Schedule
1 400°C, and 450°C isothermal aging
2 400°C isothermal aging, 1 hour at 500°C +12 hours at 400°C
3 400°C isothermal aging
4 400°C isothermal aging
5 400°C isothermal aging
3.3.43.3.43.3.43.3.4 Elevated Temperature TElevated Temperature TElevated Temperature TElevated Temperature Tensile ensile ensile ensile Property MeasurementsProperty MeasurementsProperty MeasurementsProperty Measurements– Ingots made from
alloy2 by casting in the water-chilled copper mold were machined to produce ASTM
standard size tensile specimens for high temperature tensile property measurements.
The shape and dimensions of specimens are shown in Fig. 22.
Fig.22.Fig.22.Fig.22.Fig.22. Schematic representation of the specimens used to measure tensile properties.
The elevated temperature tensile property measurements were conducted according to
the parameters shown in Table 9. In addition, the tensile properties of commercial
purity aluminum were measured at 300°C to provide a base line for comparison.
Table 9.Table 9.Table 9.Table 9.Parameters for measuring the tensile properties of alloy 2.
Aging Parameters No. of Samples Test Temperature
1hour at 500°C +12 hours at 400°C 3 300°C
18 hours at 400°C 3 300°C
1”
2”
3/16”

34
35
4. Results4. Results4. Results4. Results and Discussionand Discussionand Discussionand Discussion
4.14.14.14.1 The The The The Effect of Cooling Rate on the Volume Percent ofEffect of Cooling Rate on the Volume Percent ofEffect of Cooling Rate on the Volume Percent ofEffect of Cooling Rate on the Volume Percent ofthe the the the PrimaryPrimaryPrimaryPrimary AlAlAlAl3333M M M M PhasePhasePhasePhase
4.1.1 The Binary Al-Zr System
The Primary Al3Zr phase was detected by SEM in the Back Scattered Imaging Mode.
Because the atomic number of zirconium is much higher than that of aluminum, the
primary phase can be clearly distinguished by the Z-contrast in Back Scattered Imaging
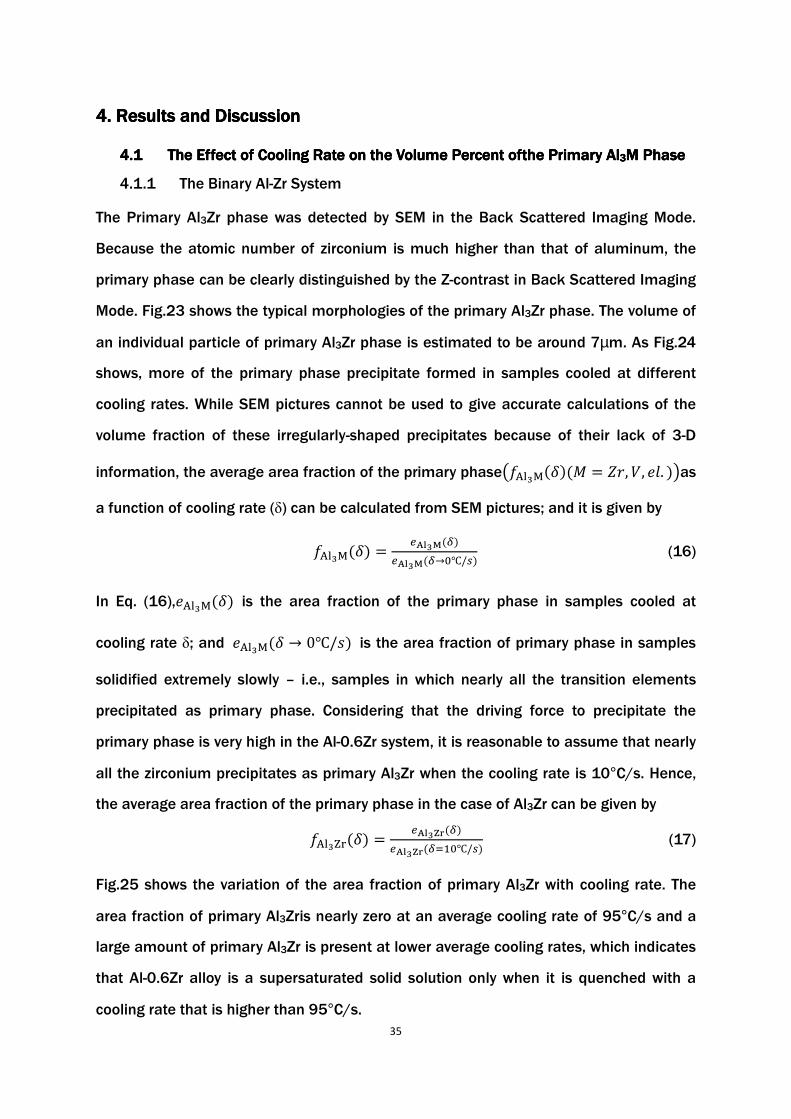
Mode. Fig.23 shows the typical morphologies of the primary Al3Zr phase. The volume of
an individual particle of primary Al3Zr phase is estimated to be around 7µm. As Fig.24
shows, more of the primary phase precipitate formed in samples cooled at different
cooling rates. While SEM pictures cannot be used to give accurate calculations of the
volume fraction of these irregularly-shaped precipitates because of their lack of 3-D
information, the average area fraction of the primary phase0*A�%M&�'&� � �>, �, \�. '3as a function of cooling rate (δ) can be calculated from SEM pictures; and it is given by
*A�%M&�' � RA�%M&�'RA�%M&��`X/�' (16)
In Eq. (16),\A�%M&�' is the area fraction of the primary phase in samples cooled at
cooling rate δ; and \A�%M&� � 0X/�' is the area fraction of primary phase in samples
solidified extremely slowly – i.e., samples in which nearly all the transition elements
precipitated as primary phase. Considering that the driving force to precipitate the
primary phase is very high in the Al-0.6Zr system, it is reasonable to assume that nearly
all the zirconium precipitates as primary Al3Zr when the cooling rate is 10°C/s. Hence,
the average area fraction of the primary phase in the case of Al3Zr can be given by
*A�%Z�&�' � RA�%Z�&�'RA�%Z�&��(`X/�' (17)
Fig.25 shows the variation of the area fraction of primary Al3Zr with cooling rate. The
area fraction of primary Al3Zris nearly zero at an average cooling rate of 95°C/s and a
large amount of primary Al3Zr is present at lower average cooling rates, which indicates
that Al-0.6Zr alloy is a supersaturated solid solution only when it is quenched with a
cooling rate that is higher than 95°C/s.

36
Fig.23.Fig.23.Fig.23.Fig.23. Morphologies of the primary Al3Zr phase in Al-Zr alloys.
37
(a) (b)
(c)
Fig.24.Fig.24.Fig.24.Fig.24. Backscattered SEM images of the Al3Zr primary phase in samples cooled with
different cooling rates. (a) 80°C/s, (b) 45°C/s, and (c) 10°C/s.

38
Fig.25.Fig.25.Fig.25.Fig.25. Variation of the area fraction of primary Al3Zr with cooling rate.
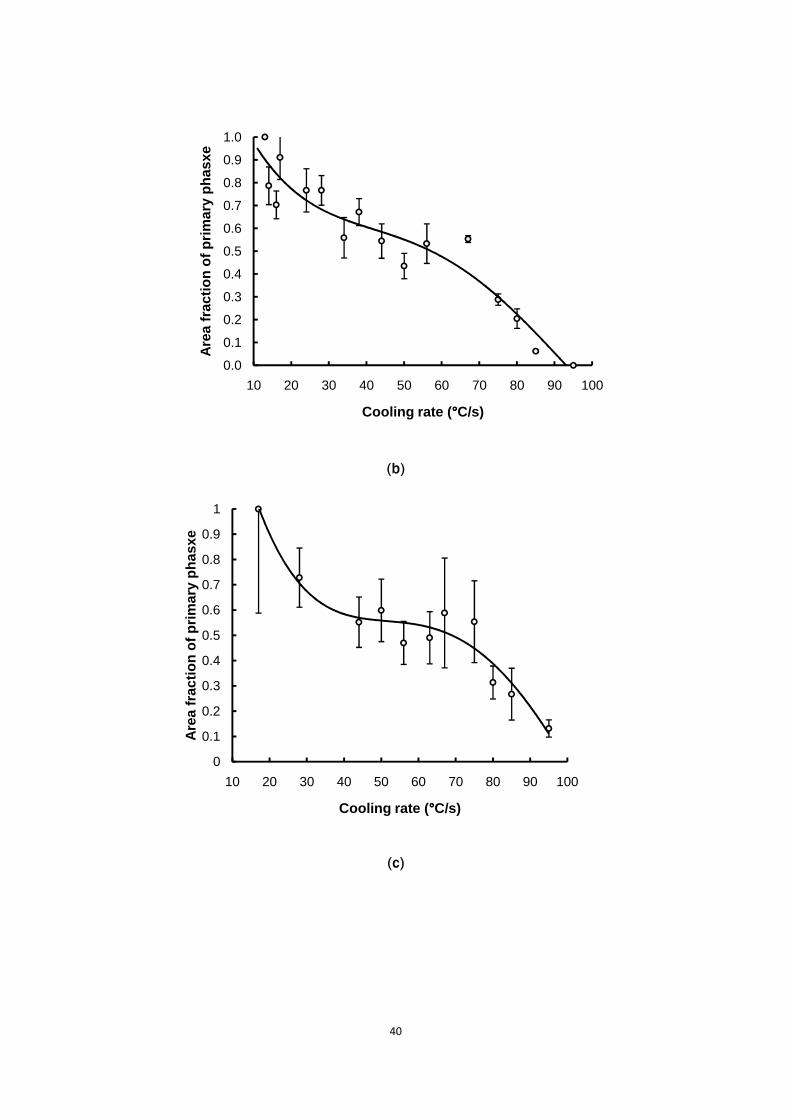
4.1.2 The Ternary Al-Zr-V System
The same method used with the binary Al-Zr system is applied to analyze Al-0.4V-0.1Zr,
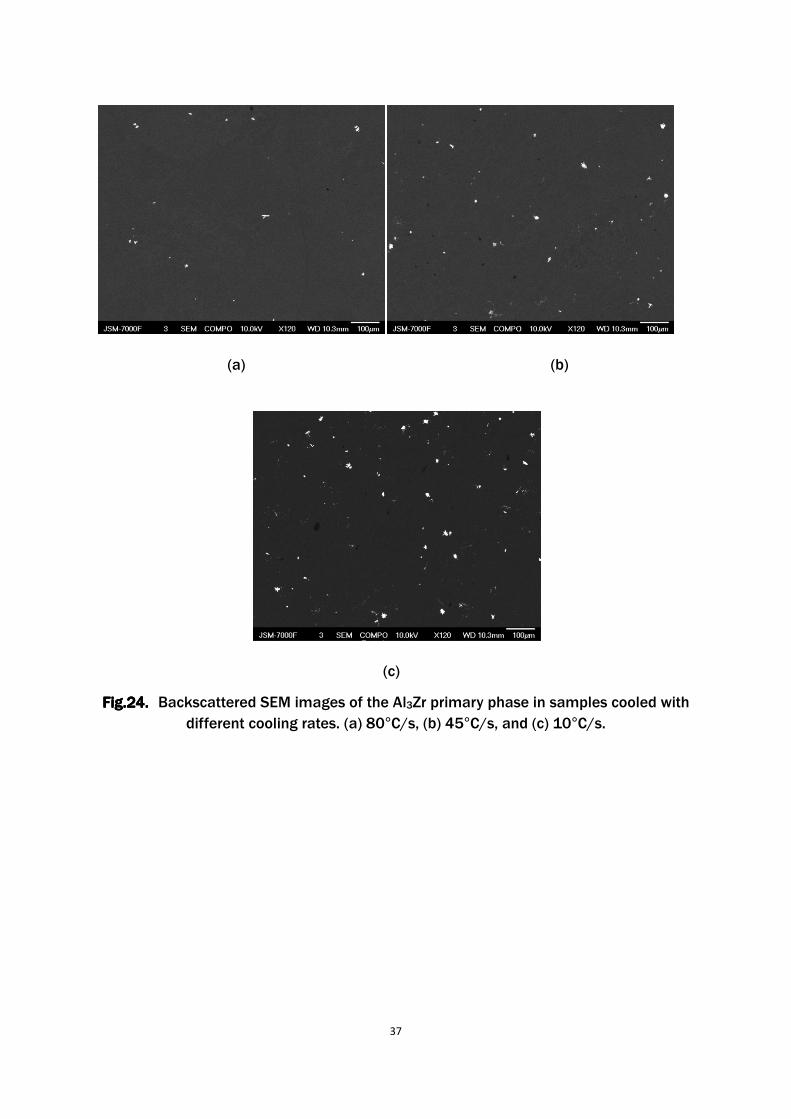
Al-0.4V-0.1Zr-0.2Si, Al-0.6V-0.15Zr and Al-0.6V-0.15Zr-0.2Si alloys. The EDS and SEM
image shown in Fig.26 indicate that the primary phase that forms in ternary Al-Zr-V
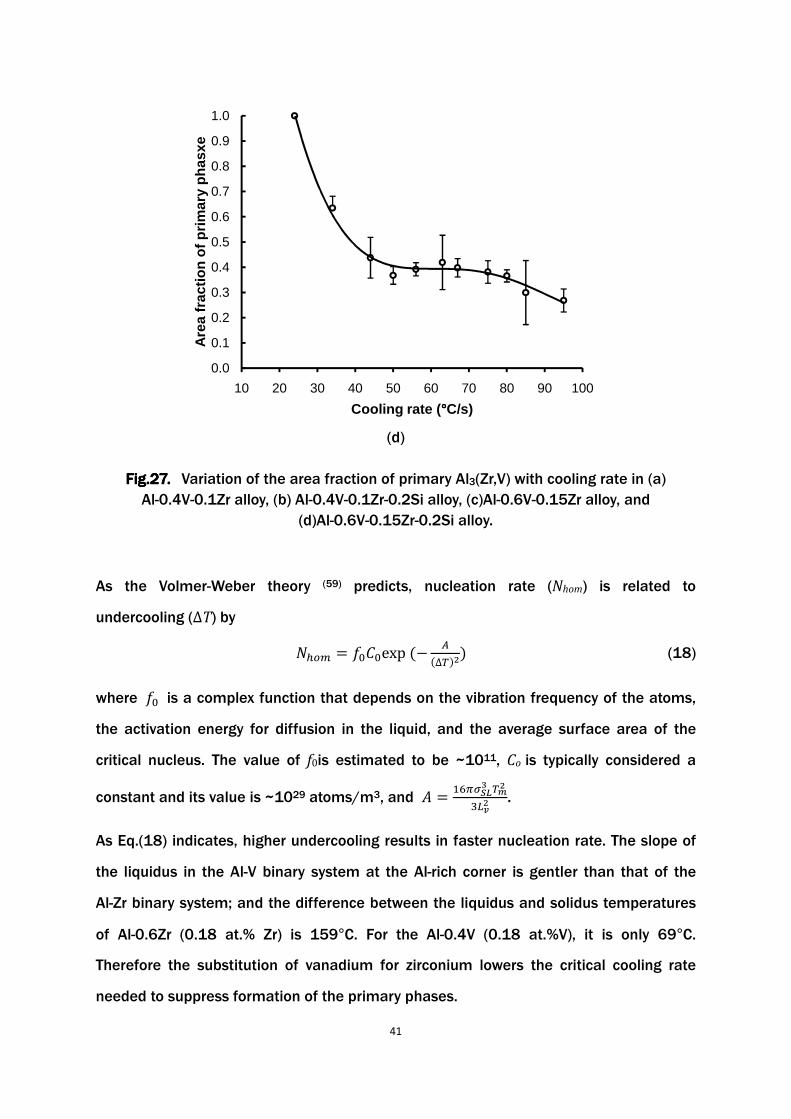
alloys is Al3(Zr,V) co-precipitate with a polygonal morphology. Fig. 27 shows the variation
of the area fraction of primary Al3(Zr,V) with cooling rate. The critical cooling rate of the
Al-0.4V-0.1Zr alloy is 35°C/s, which is lower than that of the Al-0.6Zr alloy. Moreover,
the combined mole fraction of vanadium and zirconium in the Al-0.4V-0.1Zr alloy is
higher than the mole fraction of zirconium in the Al-0.6Zr alloy. Therefore it can be
deduced that substituting vanadium for zirconium suppresses the formation of Al3M
primary precipitates. However, when the concentration of vanadium is 0.6 wt%, a higher
cooling rate (> 85°C/s) is necessary to suppress formation of the primary phase. Also, it
can be seen from Fig. 26 that adding Si to these alloys accelerates precipitation of the
primary phase.
0.0
0.1
0.2
0.3
0.4
0.5
0.6
0.7
0.8
0.9
1.0
0 20 40 60 80 100
Fra
ctio
n o
f P
rim
ary
Al 3
Zr
ph
ase
Cooling Rate (°°°°C/s)
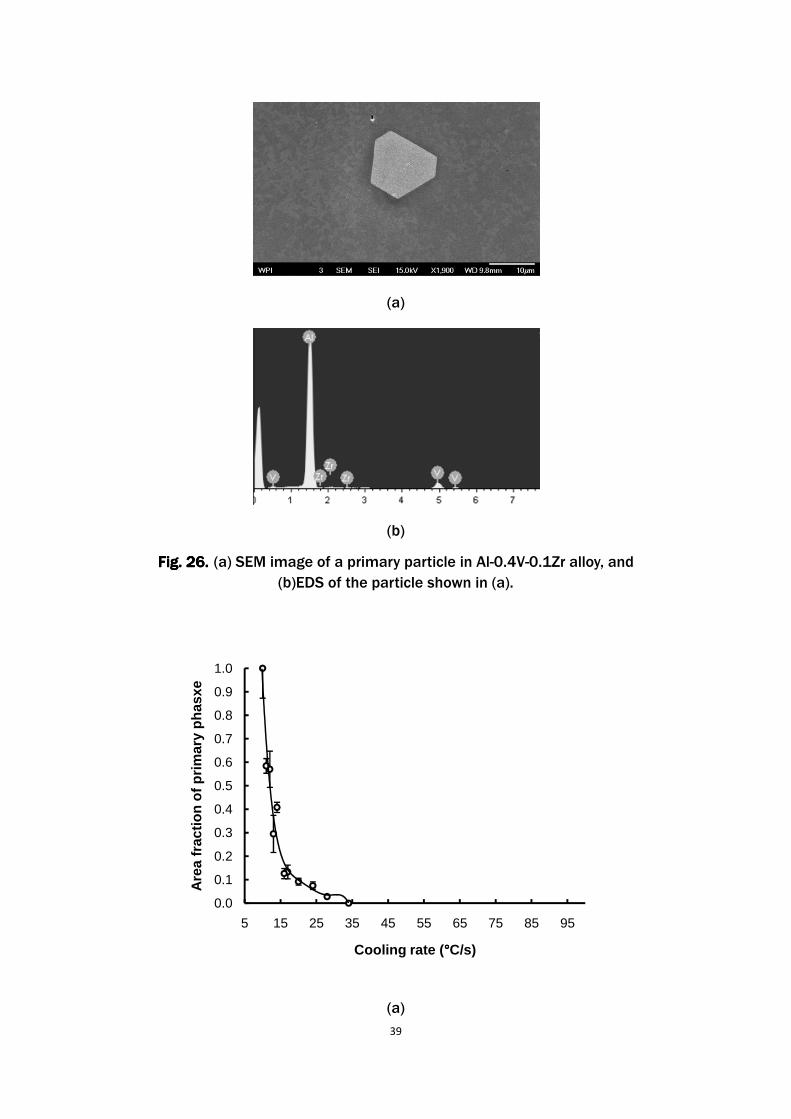
Fig. 26.Fig. 26.Fig. 26.Fig. 26. (a) SEM image
(b)EDS
0.0
0.1
0.2
0.3
0.4
0.5
0.6
0.7
0.8
0.9
1.0
5 15
Are
a fr
acti
on
of
pri
mar
y p
has
xe
39
(a)
(b)
image of a primary particle in Al-0.4V-0.1Zr alloy, and
(b)EDS of the particle shown in (a).
(a)
15 25 35 45 55 65 75 85 95
Cooling rate (°°°°C/s)
0.1Zr alloy, and
95
40
(b)
(c)
0.0
0.1
0.2
0.3
0.4
0.5
0.6
0.7
0.8
0.9
1.0
10 20 30 40 50 60 70 80 90 100
Are
a fr
acti
on
of
pri
mar
y p
has
xe
Cooling rate (°°°°C/s)
0
0.1
0.2
0.3
0.4
0.5
0.6
0.7
0.8
0.9
1
10 20 30 40 50 60 70 80 90 100
Are
a fr
acti
on
of
pri
mar
y p
has
xe
Cooling rate (°°°°C/s)
41
(d)
Fig.2Fig.2Fig.2Fig.27777.... Variation of the area fraction of primary Al3(Zr,V) with cooling rate in (a)
Al-0.4V-0.1Zr alloy, (b) Al-0.4V-0.1Zr-0.2Si alloy, (c)Al-0.6V-0.15Zr alloy, and
(d)Al-0.6V-0.15Zr-0.2Si alloy.
As the Volmer-Weber theory (59) predicts, nucleation rate (Nhom) is related to
undercooling (ΔT) by
��H � *̀ Q`exp &N j&∆n'�' (18)
where *̀ is a complex function that depends on the vibration frequency of the atoms,
the activation energy for diffusion in the liquid, and the average surface area of the
critical nucleus. The value of f0is estimated to be ~1011, Co is typically considered a
constant and its value is ~1029 atoms/m3, and r � (�DT��% nW�=� �
.
As Eq.(18) indicates, higher undercooling results in faster nucleation rate. The slope of
the liquidus in the Al-V binary system at the Al-rich corner is gentler than that of the
Al-Zr binary system; and the difference between the liquidus and solidus temperatures
of Al-0.6Zr (0.18 at.% Zr) is 159°C. For the Al-0.4V (0.18 at.%V), it is only 69°C.
Therefore the substitution of vanadium for zirconium lowers the critical cooling rate
needed to suppress formation of the primary phases.
0.0
0.1
0.2
0.3
0.4
0.5
0.6
0.7
0.8
0.9
1.0
10 20 30 40 50 60 70 80 90 100
Are
a fr
acti
on
of
pri
mar
y p
has
xe
Cooling rate (°°°°C/s)

42
4.2. 4.2. 4.2. 4.2. Isothermal Isothermal Isothermal Isothermal Heat Treatment of Binary AlHeat Treatment of Binary AlHeat Treatment of Binary AlHeat Treatment of Binary Al----Zr and Ternary AlZr and Ternary AlZr and Ternary AlZr and Ternary Al----ZrZrZrZr----V AlloysV AlloysV AlloysV Alloys
4.2.1 The Binary Al-Zr Alloy
The variation in Vickers microhardness of anAl-0.6Zr sample that has been quenched
at90°C/s is shown in Fig.28. As mentioned earlier, with a cooling rate of 90°C/s, the
Al-0.6Zr alloy is a supersaturated solid solution. Fig.28shows that this supersaturated
solid solution is age-hardenable at 400°C and 450°C, which is in agreement with other
works (61). The Al-0.6Zr supersaturated solid solution reaches its peak hardness of 41
HV200after aging for 12 hours at 450°C, after that time, the hardness begins to
decrease. When aged at 400°C, the Vickers hardness of the alloy continues to increase
steadily with time up to 24 hours, at which time aging was discontinued.
Fig. 29 is a composite plot that shows the hardness of the Al-0.6Zr alloy as a function of
cooling rate. As mentioned earlier, the lower cooling rates result in higher fractions of
the primary phase which does not contribute to precipitation hardening. When the
cooling rate is about 10°C/s, the hardness of the alloy is 27 HV200, and the alloy does
not respond to aging, which implies that at this cooling rate nearly all the zirconium
content of the alloy is in the primary phase.
Fig.2Fig.2Fig.2Fig.28888.... Variation of the hardness of optimally-quenched Al3Zr alloy
with aging temperature and time.
20
25
30
35
40
45
0 10 20 30
Vic
kers
mic
roh
ard
nes
s
Aging time (hours)
T=400
℃

Fig.2Fig.2Fig.2Fig.29999.... Variation of the hardness of Al
4.2.2 The Ternary Al-Zr
The Vickers microhardness
isothermally aged alloys were quenched with
30, the maximum microhardness of Al
samples aged at 400°C for 1
41 HV200and is achieved by aging at 400
80% of the vanadium and z
dissolved into the aluminum
quenched at 90°C/s, this alloy exhibited remarkably high
aged at 400°C for 24 hours (
holding the alloy for 36 hours
0.0
0.1
0.2
0.3
0.4
0.5
0.6
0.7
0.8
0.9
1.0
0 10 20 30
Fra
ctio
n o
f Z
r th
at p
reci
pit
ates
as
pri
mar
y p
has
e
43
Variation of the hardness of Al3Zr alloy cooling rate,
aging temperature and time.
Zr-V Alloys
The Vickers microhardness of alloys 2, 3, and 5 is shown in Fig.
isothermally aged alloys were quenched with a cooling rate of 90°C/s
the maximum microhardness of Al-0.4V-0.1Zr is 39 HV200 and it
for 18 hours. The peak hardness of Al-0.4V-0.1Zr
ieved by aging at 400°C for only 12 hours. Despite that only about
zirconium used to make the Al-0.6V-0.15Zr
aluminum to form a supersaturated solid solution when
alloy exhibited remarkably high micorhardness when
C for 24 hours (60 HV200) and the hardness remained constant
36 hours, upon which time the experiment was stopped
30 40 50 60 70 80 90
Cooling rate (°°°°C/s)
450°C 3hrs
450°C 6hrs
450°C 12hrs
450°C 24hrs
Zr alloy cooling rate,
Fig. 30. All these
C/s. As seen in Fig.
and it is achieved in
0.1Zr-0.2Si alloy is
. Despite that only about
0.15Zr-0.2Si alloy were
when the alloy was
micorhardness when it was
) and the hardness remained constant after
, upon which time the experiment was stopped.
20
25
30
35
40
45
100
Vick
ers M
icroh
ardn
ess

44
Fig.Fig.Fig.Fig.30303030.... Variation of the hardness of optimally-quenchedAl-0.4V-0.1Zr,
Al-0.4V-0.1Zr-0.2Si, and Al-0.6V-0.15Zr-0.2Si alloyswith aging temperature and time.
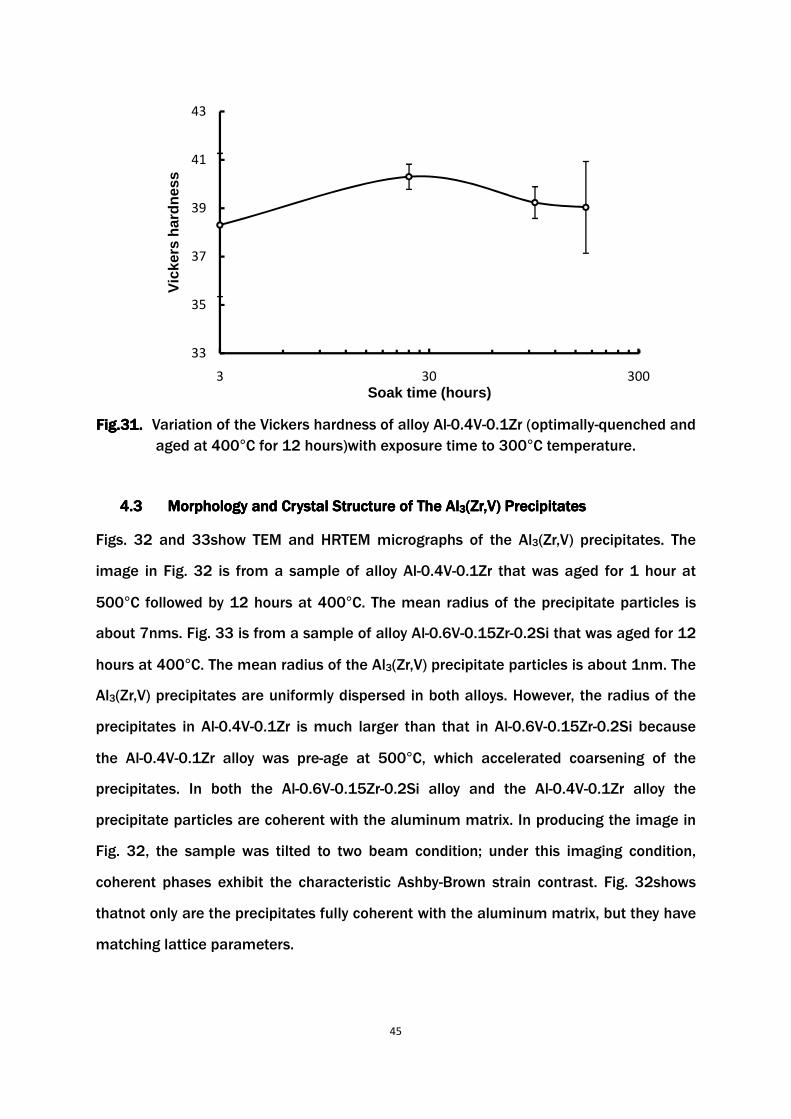
4.2.3 Thermal Stability of Al-0.4V-0.1Zr Alloy
A sample of alloy Al-0.4V-0.1Zr that was optimally-quenched and aged at 400°C for 12
hour swas soaked at 300°C in order to assess the thermal stability of the Al3(Zr,V)
precipitates. The result is shown in Fig.27 as a plot of Vickers hardness vs. time at
300°C. It is clear that the Vickers hardness remain sconstant at 39 HV200up to 100
hours, at which time the experiment was discontinued. Alloy Al-0.4V-0.1Zr is stable and
may be used in applications that require thermal stability at temperatures up to 300°C.
25
30
35
40
45
50
55
60
65
0 10 20 30 40 50
Vic
kers
har
dn
ess
Aging time (hours)
Al-0.4V-0.1Zr-0.2Si
Al-0.4V-0.1Zr
Al-0.6V-0.15Zr-0.2Si
45
Fig.Fig.Fig.Fig.31313131.... Variation of the Vickers hardness of alloy Al-0.4V-0.1Zr (optimally-quenched and
aged at 400°C for 12 hours)with exposure time to 300°C temperature.
4.34.34.34.3 Morphology Morphology Morphology Morphology and Crystal Structure and Crystal Structure and Crystal Structure and Crystal Structure of The Alof The Alof The Alof The Al3333(Zr,V) Precipitates(Zr,V) Precipitates(Zr,V) Precipitates(Zr,V) Precipitates
Figs. 32 and 33show TEM and HRTEM micrographs of the Al3(Zr,V) precipitates. The
image in Fig. 32 is from a sample of alloy Al-0.4V-0.1Zr that was aged for 1 hour at
500°C followed by 12 hours at 400°C. The mean radius of the precipitate particles is
about 7nms. Fig. 33 is from a sample of alloy Al-0.6V-0.15Zr-0.2Si that was aged for 12
hours at 400°C. The mean radius of the Al3(Zr,V) precipitate particles is about 1nm. The
Al3(Zr,V) precipitates are uniformly dispersed in both alloys. However, the radius of the
precipitates in Al-0.4V-0.1Zr is much larger than that in Al-0.6V-0.15Zr-0.2Si because
the Al-0.4V-0.1Zr alloy was pre-age at 500°C, which accelerated coarsening of the
precipitates. In both the Al-0.6V-0.15Zr-0.2Si alloy and the Al-0.4V-0.1Zr alloy the
precipitate particles are coherent with the aluminum matrix. In producing the image in
Fig. 32, the sample was tilted to two beam condition; under this imaging condition,
coherent phases exhibit the characteristic Ashby-Brown strain contrast. Fig. 32shows
thatnot only are the precipitates fully coherent with the aluminum matrix, but they have
matching lattice parameters.
33
35
37
39
41
43
3 30 300
Vic
kers
har
dn
ess
Soak time (hours)

46
Fig.Fig.Fig.Fig. 32323232.... TEM pictures of L12-structure of Al3(Zr,V) precipitates in Al-0.4V-0.1Zr alloy. The
sample was tilted to the [110] zone axis.
(a) (b)
Fig.Fig.Fig.Fig.33333333.... (a)HRTEM image of Al-0.6V-0.15Zr-0.2Si alloy. (b) higher magnification of the
image in (a)
The hardness of heat-treated Al-Zr alloys is negligible if the concentration of zirconium
in the alloy is below 0.4 wt.%. This is attributed to the limited volume fraction of L12
precipitates [68]that form with such low concentration of zirconium. However, as
Fig.30shows, the hardness of Al-Zr-V alloys increases upon aging at 400°C. The
hardness of aged Al-0.6V-0.15Zr-0.2S alloy is 60 HV200, which is almost three times as
high as the hardness of the heat-treated Al-0.27Zr alloy [67]. The substitution of
vanadium for zirconium increases the density of the L12 precipitates, and therefore, as
Ashby-Orowan theory predicts, it increases the hardness of the alloy.

47
The TEM images in Figs. 32 and 33 show a high volume density of L12 precipitates in
the matrix of Al-V-Zr alloys after proper heat treatment. Also, Fig. 33 shows that the
misfit between the Al3(Zr,V) precipitate particles and the α-Al matrix is eliminated when
the V:Zr atom fraction ratio in the precipitate is 0.875 (the Al3(Zr,V) precipitates in the
Al-0.6V-0.15Zr-0.2Si alloy are fully coherent with the matrix); for this reason alloy
Al-0.4V-0.1Zris thermally stable at temperatures up 300°C.
As Fig. 30shows, adding Si to Al-V-Zr alloys increases the critical cooling rate needed to
suppress formation of the primary phase. It has been suggested [66]that clusters of a
primary silicon phase which form during solidification act as heterogeneous nucleation
sites for the Al3M primary phases, and thus A in Eq. (19) becomes
r¡R¢ � (�DT��% nW�=� �
m *&�' (19)
where *&�' is a function of the contact angle between the liquid and the silicon clusters. The value of *&�' is between 0 and 1. Therefore, the critical cooling rate is increased with the addition of Si. Also, the silicon clusters are effective in precipitating
the Al3(Zr,V) L12 partials [64 -65]. This is clear from Fig.26 which shows that the
hardness of the Al-0.4V-0.1Zr-0.2Si alloy reaches its peak 6 hours earlier than that of
Al-0.4V-0.1Zr alloy.
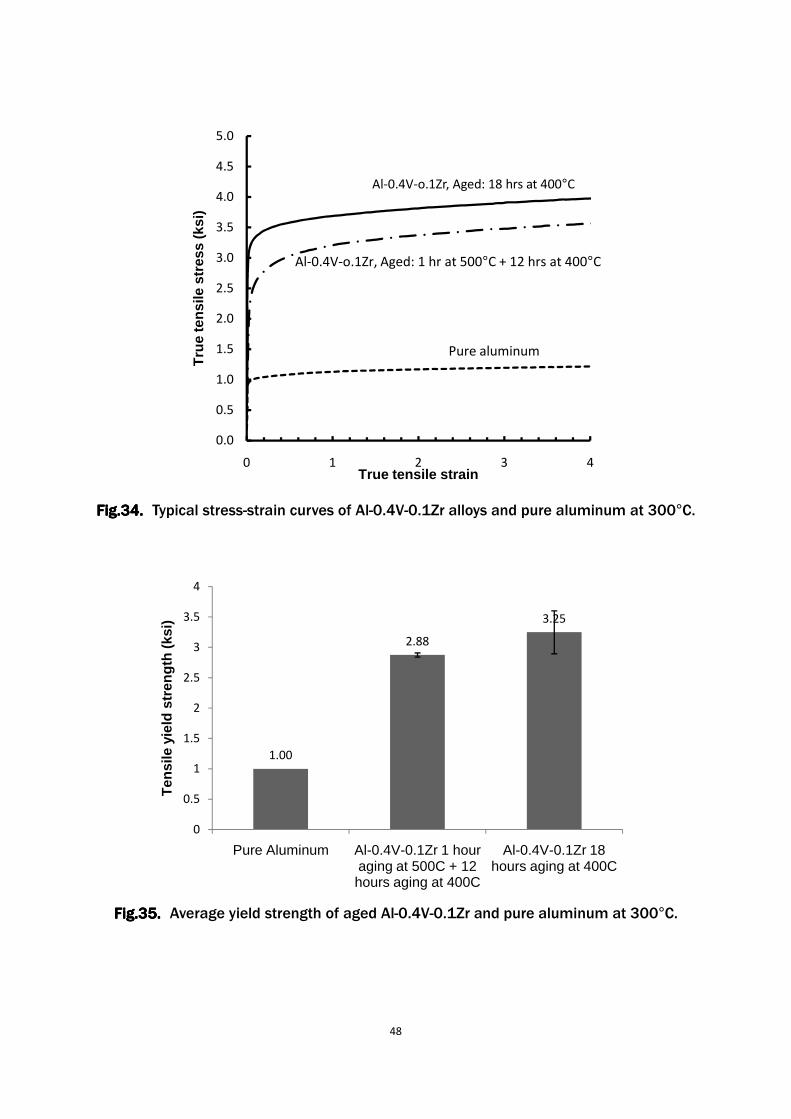
4.44.44.44.4 ElevatedElevatedElevatedElevated Temperature Tensile Temperature Tensile Temperature Tensile Temperature Tensile PropertiesPropertiesPropertiesProperties
Fig.34 shows the typical strain-stress curve of the heat-treated alloy 2 and also pure
aluminum at 300°C. The yield strength of the heat-treated Al-0.4V-0.1Zr alloy is 300%
higher than that of pure aluminum due to precipitation hardening. And the high
temperature yield strength is dependent on the aging schedule (Fig. 35). Pre-aging the
alloy at 500°C causes the precipitates to coarsen, and as the Ashby-Orowan equation
suggests, the yield strength drops as the mean radius of the precipitates increase.
48
Fig.3Fig.3Fig.3Fig.34444.... Typical stress-strain curves of Al-0.4V-0.1Zr alloys and pure aluminum at 300°C.
FFFFigigigig.3.3.3.35555.... Average yield strength of aged Al-0.4V-0.1Zr and pure aluminum at 300°C.
0.0
0.5
1.0
1.5
2.0
2.5
3.0
3.5
4.0
4.5
5.0
0 1 2 3 4
Tru
e te
nsi
le s
tres
s (k
si)
True tensile strain
Pure aluminum
Al-0.4V-o.1Zr, Aged: 1 hr at 500°C + 12 hrs at 400°C
1.00
2.88
3.25
0
0.5
1
1.5
2
2.5
3
3.5
4
Pure Aluminum Al-0.4V-0.1Zr 1 hour aging at 500C + 12 hours aging at 400C
Al-0.4V-0.1Zr 18 hours aging at 400C
Ten
sile
yie
ld s
tren
gth
(ksi
)Al-0.4V-o.1Zr, Aged: 18 hrs at 400°C

49
5.5.5.5. ConclusionConclusionConclusionConclusionssss
1. Substituting vanadium for zirconium in aluminum-zirconium alloys significantly
decreases the critical cooling rate of the alloy. The critical cooling rate of Al-0.6Zr
and Al-0.4V-0.1Zr alloys are measured to be 90°C/s and 35°C/s respectively. This is
an important finding since these thermally stable alloys can now be used to
manufacture components by high pressure die casting.
2. It has been shown that vanadium co-precipitates with zirconium and aluminum
upon proper aging and forms spherical, nanosize particles that have the L12 crystal
structure, and that are fully coherent with the α-aluminum matrix.
3. The Al3(Zr,V) precipitates are thermally stable up to 300°C and they add about 2 Ksi
to the yield strength of pure aluminum at 300°C.
50
6.6.6.6. ReferenceReferenceReferenceReferencessss
(1) Wilm, A., Metallurgie, vol.8, pp225 (1911).
(2) Merica, P.D., Waltenberg, R.G., and Scott, H., Sci.Paper, pp347 (1919).
(3) Guninier, A., Compt. Rend., vol.206, pp1641 (1938).
(4) Kelly, A., Nicholson, R.B., Progr. Mater. Sci., vol.10,pp151(1963).
(5) Mott,N.F., Nabarro,F.R.N., Proc. Phys. Soc., vol.52,pp86 (1940).
(6) Orowan, W., ‘Internal stress in metals and alloys’, p.451, The Institute of
Metals,London(1984).
(7) Ashby, M.F., Oxide Dispersion Strengthening, p.143, Gordon and Breach, New York
(1958).
(8) Mott, N.F., Nabarro, F.R.N., The Physical Society (1948).
(9) Zedalis, M.S., Fine,M.E., Scripta Metall., vol.19, pp647 (1985).
(10) Hirsch,P.B., Kelly,A., Phil. Mag., vol.12, pp220 (1965).
(11) Gerold,V., Hartmann,K., Trans. Japan. Inst. Metals, vol.9,pp509 (1968).
(12) Lifshitz,I.M., Slyozov, V.V., J. Phys. Chem. Solids,vol.19 pp35 (1961).
(13) Wanger,C., Z. Elektrochemie,vol.65 pp581 (1961).
(14) Röhrle, M. D., Pistons for Internal Combustion Engines, Verlag Moderne Industrie,
(1995).
(15) Okamoto,H., Phase Diagrams of Dilute Binary Alloys, ASM Internatioal, Materials
Park (2002)
(16) Murray, J.L., Peruzzi,A., Abriata,J.P., J. Phase Equil. Vol.13,pp277(1992).
(17) Fine, M.E., Metall. Trans. A, vol.6,pp625(1975).
(18) Okamoto,H., Phase Diagrams of Dilute Binary Alloys ASM International, Materials
Park (2002).
(19) Murray,J.L., J. Phase Equil.,vol.19, pp380 (1998).
(20) Massalski, T.B., Binary Alloy Phase Diagram, Vol.1., 2nd ed. ASM International,
Materials Park (1990).
(21) Liang, W.W., CALPHAD,vol.7, pp13 (1983).
(22) Murrary, J.L., Peruzzi,A., Abriata,J.P., J. Phase Equil.,vol.13,pp277 (1992).
(23) Murray, J.L., McAlister,A.J., Kahan,D.J., J. Phase Equil.,vol.19,pp376 (1998).
(24) Fujikawa, S.I., Def. Diff. Forum, vol.116, pp143 (1997).
(25) Bergner,D., van Chi,N., Wissenschaftliche Zeitschrift der padagogischen
Hochschle,vol.15, (1977)

51
(26) Marumo, T., Fujikawa, S., Hirano, K., J. Japan Inst. Light Metals,vol.23, pp17
(1973).
(27) Fujikawa,S.I., J.Japan Inst. Light Metals,vol.46, pp22 (1996).
(28) Rummel, G., Zumkley,T., Eggersman,M., Freitag,K., Mehrer, H., Z. Metallkd.
Vol.86,pp122 (1995).
(29) Murphy,J.B., Acta. Metall.,vol.9 pp563 (1961).
(30) Beerwald, A., Z. Elekrochem., vol.45,pp789 (1939).
(31) Marquis,E.A., Seidman,D.N., Acta. Mater.,vol.49, pp1909 (2001).
(32) Ryum,N., Acta. Metall.,vol.17,pp269 (1969).
(33) Zedalis,M.S., Fine, M.E., Metall. Trans. A, vol.17,pp2187 (1986).
(34) Keith E. Knipling, David C. Dunnand, Acta. Mater., vol.58,pp1182(2008).
(35) Christan B. Fuller, David N. Seidman, David C Dunand, Acta. Mater.,vol.51, pp4803
(2003).
(36) Belov,N.A.,Alabin,A.N., Eskin, D.G., J. Mater. Sci.,vol.41,pp.5890 (2006).
(37) Keith E. Knipling, Richard A. Karnesky, Acta. Mater.,vol.58, pp5184 (2010).
(38) Lefebvre,W., Danoix, F., J. Alloys and Compounds,vol.470, pp107 (2009).
(39) Senkov, O.N., Shagiev, M.R., Acta. Mater.,vol.56,pp3723 (2008).
(40) Tolley,A., Radmilovic, V., Scripta Mater.,vol.52, pp621 (2005).
(41) Christian B. Fuller, Joanne, L., Muarry, Acta. Mater.,vol.53 pp5401 (2005).
(42) Forbord,B. Lefebvre, W., Scripta Mater.,vol.51,pp333 (2004).
(43) Radmilovic, V., Tolley, A., Scripta Mater.,vol.58,pp529 (2008).
(44) Marsha E. van Dalen, J. Mater. Sci.,vol.41,pp7814(2006).
(45) Keith E. Knipling, David C. Dunand, Acta. Mater.,vol.56, pp114 (2008).
(46) Hallem, H., Lefebvre, W., Mater. Sci. and Eng. A,vol.421,pp154 (2006).
(47) Gang Du, Jingwei Deng, Scripta Mater.,vol.61,pp532 (2009).
(48) Matthew E. Krug, Alexandra Werber, and Dunand,D.C., Acta. Mater.,vol.58 pp134
(2010).
(49) Wen,S.P.,Gao,K.Y., Scripta Mater., In Press.
(50) Chun-Huei Tsau, Yen-Cheng Chen, Mater. Phy. and Chem.,vol.73,pp111(2002).
(51) Won-Wook Park, Mater. and Design.,vol.17, pp85 (1996).
(52) Chen, Y.C., Fine,M.E., Acta. Metall.,vol.38,pp771 (1990).
(53) srinivasan,S., Desch,P.B., Schwarz,R.B., Scripta Metall. Mater.,vol.25,pp2513
(1991).
(54) Nes,E., Acta Metall.,vol.20 pp499 (1972).
52
(55) Vecchio,K.S.,Williams, D.B., Acta Metall.,vol.35, pp2969 (1987).
(56) Xu,J.H.,freeman, A.J., J.Mater. Res.,vol.6, pp1188 (1991).
(57) S.K. das, J.H. Westbrook, R.L. Fleischer (Eds.) Intermetallic Compounds, Principles
and Practice, vol.2, pp175, John Wiley & Sons (1994).
(58) Turnbull,D.,fisher, J.C., J. Chem. Phys., vol.17,pp71(1949).
(59) Ryum, N., Acta. Metall.,vol.17, pp269 (1969).
(60) Keith. E. Knipling, David. C. Dunand, Metall. and Mater. Trans. A,vol.38 pp25532 (2007).
(61) Nes, E., Billdal, H., Acta Metall.,vol.25,pp1031 (1977).
(62) Chen, Y.C., Fine, M.E., and Weertman,J.R., Acta. Meter.,vol.38,pp771 (1990).
(63) Chen, Y.C., Fine, M.E., and Weertman,J.R., Scripta Metall.,vol.21 pp1003 (1987).
(64) Hori,S., Saji, S., and Higaki,Y., J. Japan Inst. Light Metals, vol.25, pp247 (1975).
(65) Takeshi Ikeda, Takashi Tachikaw and Masakio Ikeda., Mater. Trans., JIM, vol.38, pp413 (1997).
(66) Murray,J.L., McAlister,A.J., Bulletin of Alloy Phase Diagram, vol.5,pp74 (1984).
(67) Wen,S.P., Gao,K.Y., Li,Y., Huang,H., and Nie,Z.R., Scripta Materialia, (2011), Inpress.
(68) Belov,N.A., Alabin,A.N.,Eskin, D.G., Istomin Kastrovskii,V.V., J. Mater. Sci.
vol.42,pp5890 (2006).