precipitation - asad iqbal high wind velocity and heavy precipitation, and the extra‐tropical...
TRANSCRIPT

Precipitation


• The amount of water vaporh h h
•All forms of moistureti f th l d that the atmosphere can
carry (the saturation vaporpressure) is a function of
emanating from the cloudsand all forms of water likei h il d l t pressure) is a function of
temperature.rain, snow, hail and sleetderived from atmospheric
f lli t th
• Having water vapor in the
vapors, falling to theground.
• Having water vapor in theatmosphere is a necessarybut insufficient conditionbut insufficient conditionfor precipitation. Theremust also be a mechanismto promote uplift, coolingand condensation.

Formation of Precipitation


• Mechanism of Cooling
When the air ascends from near the surface to upperlevels in the atmosphere, pressure reduction takesplace. Due to this pressure reduction air crossesthrough the colder layers and this is the onlymechanism capable of producing the degree and rateof cooling needed to account for heavy rainfall.

• Condensation of Water VaporC d i f i l d d l kCondensation of water into cloud droplets takesplace on condensation nuclei or hygroscopicnuclei having affinity for waternuclei having affinity for water.
The source of these condensation nuclei is theThe source of these condensation nuclei is theparticles of dust, sea salt or such products ofcombustion of certain sulfurous and nitrouscombustion of certain sulfurous and nitrousacids.
Condensation occurs when the temperature is ≤ the dew point Tdp d
Typical CN = 0.2 μmTypical CN 0.2 μmTypical cloud droplets are 20‐100 μm

Relative sizes of CCN, cloud droplets and rain droplets

• Growth of Cloud Dropletsd h fBergeron‐Findeisen theory: If
ice and supercooled waterdroplets exist together in adroplets exist together in acloud, the ice crystals grow atthe expense of waterpdroplets, the reason beingthat the saturation vaporpressure over ice is lowerthan over water.
Solid precipitation that falls( t) lt tmay (or may not) melt at a
lower, warmer atmosphericlevel to become rainlevel to become rain.

Coalescence Occurs inwarm (liquid) clouds.
Falling droplets havea g d op ets a eterminal velocitiesdirectly related to theirdirectly related to theirdiameter, such that thelarger falling dropslarger falling dropsovertake and absorbsmaller drops thesmaller drops, thesmaller drops can alsob i h kbe swept into the wakeof larger drops and beabsorbed by them.

Moisture AccumulationMoisture Accumulation


Moisture accumulationMoisture accumulation
• Heavy rainfall amount over a river basin exceeds byfar the amount of water vapor at the atmosphericvolume vertically above the basin at the beginning ofthe rainfall.
• Clearly there must be a large net horizontal inflow ofea y e e us be a a ge e o o a o owater vapor into the atmosphere above the basinarea. This process is called convergence, which isp g ,defined as the net horizontal influx of air per unitarea.

Types of PrecipitationTypes of Precipitation

The air close to thewarm earth gets heatedgand rises due to its lowdensity, coolsadiabatically to form aadiabatically to form acauliflower shapedcloud, which finallybursts into a thunderstorm.
Convective precipitation tends to be localized.Keys to convective storm development are low atmosphericKeys to convective storm development are low atmosphericstability and ample atmospheric water vapor.
The stronger the decrease in temperature with height (themore negative the environmental lapse rate), and the morewater vapor that is available, the more favourable theconditions for convective storms.

• When two air masses due to contrastingtemperatures and densities clash with each othertemperatures and densities clash with each other,condensation and precipitation occur at thesurface of contact called Frontal Precipitation.surface of contact called Frontal Precipitation.
• This surface of contact is called a ‘front’ or ‘frontalThis surface of contact is called a front or frontalsurface’.
• If a cold air mass drives out a warm air mass’ it isIf a cold air mass drives out a warm air mass it iscalled a ‘cold front’ and if a warm air massreplaces the retreating cold air mass, it is called a‘warm front’.
• If the two air masses are drawn simultaneouslytowards a low pressure area, the front developedi t ti d i ll d ‘ t ti f tis stationary and is called a ‘stationary front


• Orographic precipitation resultsfrom ascent of air o er afrom ascent of air over amountain barrier, resulting inadiabatic cooling, condensationadiabatic cooling, condensationand precipitation on the upwindside of the barrier. The leewardside experiences a rain shadow.
• As it descends on the leewardside, it warms at the adiabaticl t d i t hi hlapse rate, and arrives at a highertemperature than it had beforethe ascent process. These warm,the ascent process. These warm,leeside conditions are oftenassociated with strong gustywinds called chinooks.

• Cyclonic precipitation is due to lifting of moist airconverging into a low pressure belt, i.e., due tog g p , ,pressure differences created by the unequalheating of the earth’s surface.
• Here the winds blow spirally inward counterclockwise in the northern hemisphere andclockwise in the southern hemisphere.
• There are two main types of cyclones—tropicall ( l ll d h i t h ) fcyclone (also called hurricane or typhoon) of
comparatively small diameter of 300‐1500 kmcausing high wind velocity and heavycausing high wind velocity and heavyprecipitation, and the extra‐tropical cyclone oflarge diameter up to 3000 km causing wideg p gspread frontal type precipitation.


F f i i iForms of precipitation

• DrizzleThese are the minute– These are the minuteparticles of water atstart of rain Thesestart of rain. Theseconsist of water dropsunder 0.5 mmdiameter and itsintensity is usually lessthan 1.0 mm/hr.
– Their speed is veryslow and we cannoteven feel them.Therefore they cannotfl th fflow over the surfacebut usually evaporate.

• RainTh i f d i thi– The size of drops in thiscase is more than 0.5 mmand less than 6.25 mm inand less than 6.25 mm indiameter.
– It can produce flow overpthe ground and caninfiltrate and percolate.
– Both the duration as wellas rate of rainfall areimportantimportant.
– If the rainfall per unit timeis greater than the rate ofis greater than the rate ofinfiltration, the rain watercan flow over the surfaceof earth.

• Glaze– It is the ice coatingformed on drizzle or
drain drops as it comesin contact with the coldsurfaces on the groundsurfaces on the ground.
• Sleetl f– Sleet is frozen raindrops cooled to the icestage while fallingstage while fallingthrough air atsubfreezingsubfreezingtemperatures.

• SnowSnow– Snow is precipitation in the form of ice crystals resultingfrom sublimation i.e. change of water vapor directly to ice.
– A number of snow crystals fuse together to form a snowfl kflake.

On CALTECH (California Institute of Technology)

• Hail
– Hail is the type of precipitation in the form of ballsor lumps of ice over 5 mm diameter formed byalternate freezing and melting as they are carriedup and down by highly turbulent air currents

Precipitation MeasurementPrecipitation Measurement

• The amount of precipitation means the verticaldepth of water that would accumulate on a levelsurface, if the precipitation remains where it falls. Itis usually measured in units of depth (inches, mm,cm etc).
• Amount of precipitation per unit time is called thep p pintensity of precipitation or rate of precipitation
• Precipitation is measured by a network of raingauges which may either be of non recording orgauges which may either be of non‐recording orrecording type.

• The US Weather BureauNon‐Recording RainGauge. 200mm
• When snow is expectedWhen snow is expectedboth the collector andtube is removed then 600tube is removed then.
h i id i
600mm
• The inside measuringtube has a cross sectional
1/10 h f harea 1/10th of thecollector, so that 2.5 mmi f ll ill fill h brain fall will fill the tube
to 25 mm depth.

Recording Rain gaugesRecording Rain‐gauges
hi i l ll d lf• This is also called self‐recording, automatic ori t ti iintegrating rain gauge.
• It has an automaticmechanical arrangementconsisting of a clockwork,a drum with a graph paper Mass curve of rainfall
fixed around it and apencil point, which drawsh f f llthe mass curve of rainfall

• The gauge is installed on a concrete org gmasonry platform 45 cm square in theobservatory enclosure.obse ato y e c osu e
Th i i t ll d th t th i f th• The gauge is so installed that the rim of thefunnel is horizontal and at a height of exactly75 b d f75 cm above ground surface.
• There are three types of recording raingauges—tipping bucket gauge, weighinggauges tipping bucket gauge, weighinggauge and float gauge.
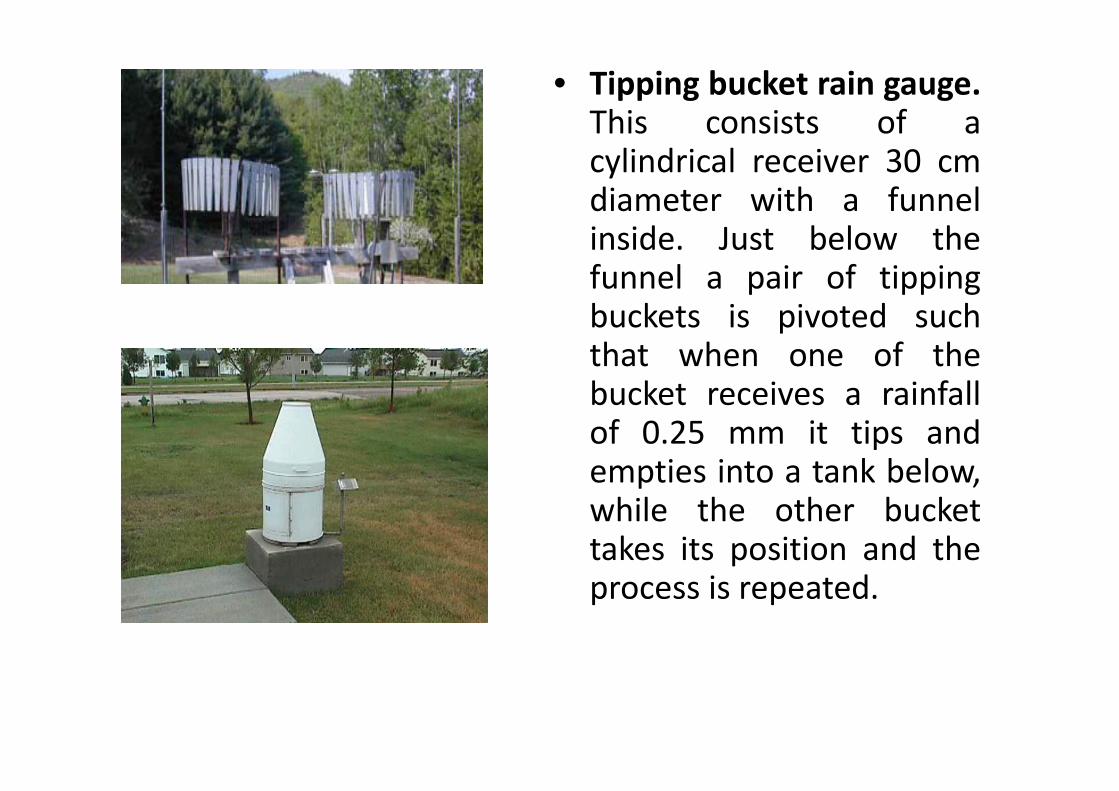
• Tipping bucket rain gauge.This consists of aThis consists of acylindrical receiver 30 cmdiameter with a funnelinside. Just below thefunnel a pair of tippingb k i i d hbuckets is pivoted suchthat when one of thebucket receives a rainfallbucket receives a rainfallof 0.25 mm it tips andempties into a tank below,p ,while the other buckettakes its position and the
dprocess is repeated.

1662 First Tipping Bucket Raingaugepp g g g
Sir Christopher Wren, England(1632‐1732, aged 90)(1632 1732, aged 90)


Snow Telemetry (SNOTEL)Snow‐Telemetry (SNOTEL)

Areal Rainfall
Non‐uniform
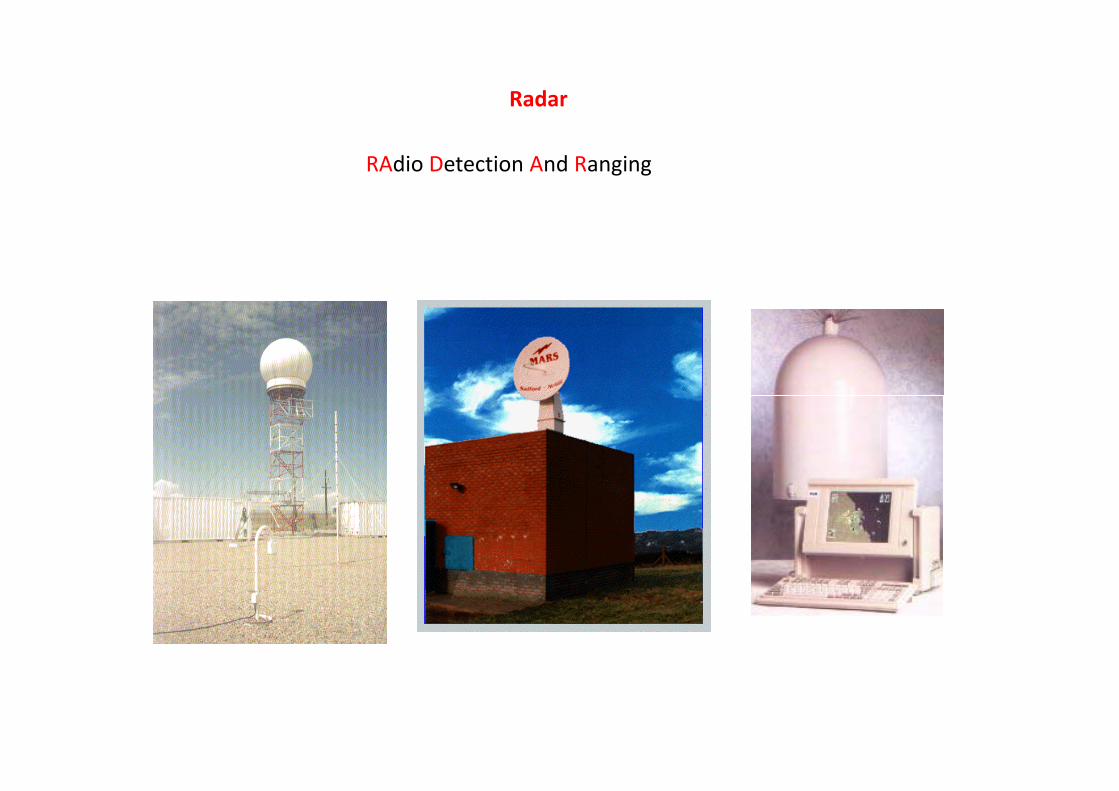
Radar
RAdio Detection And Ranging

TransmitterTransmitter
NOAA
Receiver
NOAA
∫≈ dDDNDZ )(6
∫≈ dDDNDR )(67.3
baRZ =
Source: www2010, Univ. of Illinois
∫≈ dDDNDR )(
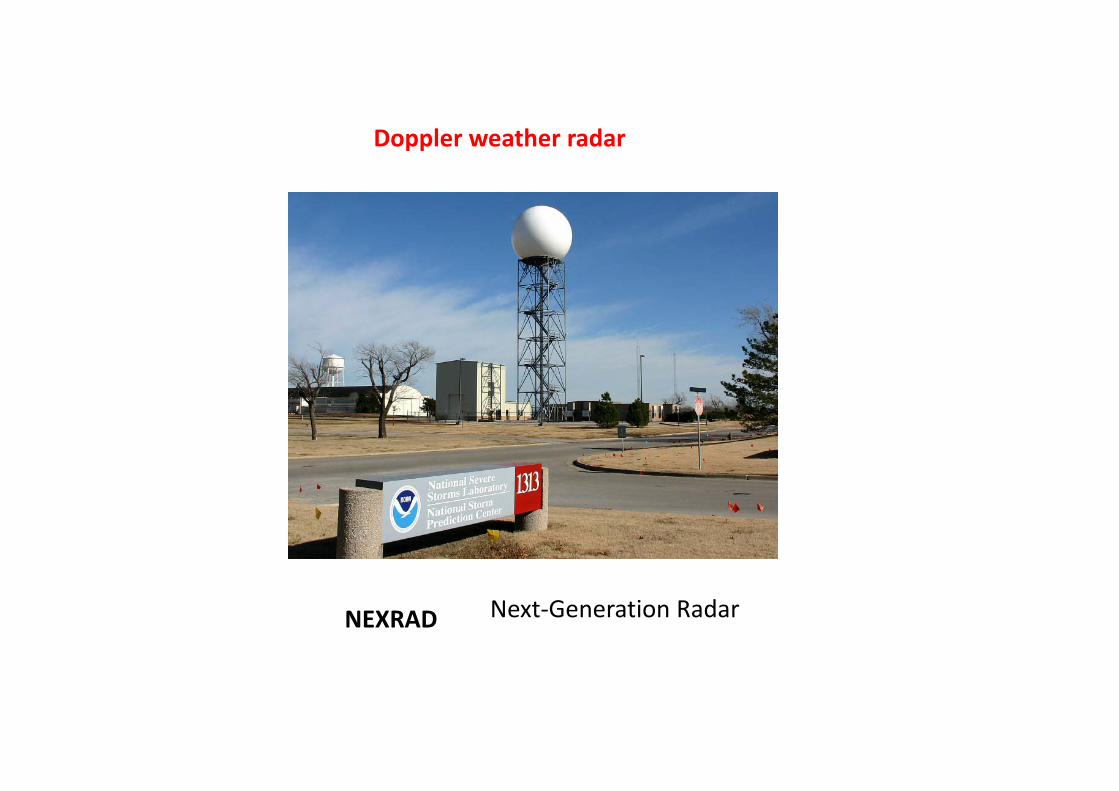
Doppler weather radar
NEXRAD Next‐Generation Radar

NEXRAD UK weather radars
158 17
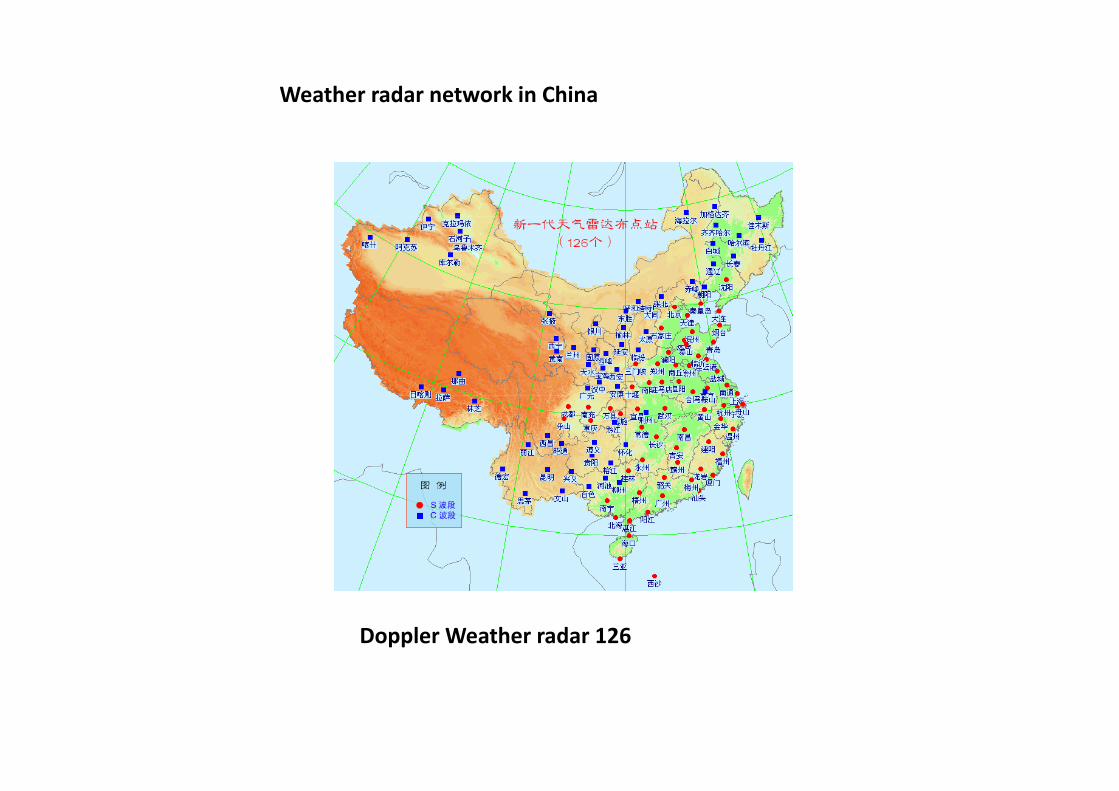
Weather radar network in China
Doppler Weather radar 126

Radar Network of PMD
10‐cm Doppler Radars1‐ Lahore2 Mangla2‐Mangla
QPM Radar1‐ Sialkot
5‐cm Wx. Surveillance RadarsIslamabad, D.I.KhanIslamabad, D.I.KhanRahim Yar KhanKarachi

Clutter removal using a Bayes classifierClutter removal using a Bayes classifier
Raw reflectivity Clutter Corrected Reflectivity
Clutter = Non precipitation echoes such as echoes fromClutter = Non‐precipitation echoes such as echoes from the ground, sea, ship, airplanes

Rain Gauge Network

In comparatively flat regions of Temperate (Latitudinalrange 40° and 60/70° e.g. Ireland), Mediterranean( d l 0 d 0 f
g g(Latitudinal range 300 and 450 e.g. Most part ofEurope) and Tropical Zones (Latitude range 50/100 to350e.g. Amazon)g )
Ideal is at least one station for 230 – 345 sq. miles.H t ti f 345 1155 il i lHowever one station for 345 – 1155 sq. miles is alsoacceptable.
In mountainous regions of Temperate, Mediterraneanand Tropical Zones, Ideal is at least one station for 3595 sq miles However one station for 95 385 sq– 95 sq. miles. However one station for 95 – 385 sq.
miles is also acceptable.
In arid (Saudi Deserts) and polar zones, one station for575 3860 il i t bl575 – 3860 sq. miles is acceptable

Analysis of Precipitation data

• Point Data AnalysisP i t i it ti d t f t i it ti f– Point precipitation data refers to precipitation of astation.
– This data could be in form of hourly record, dailyrecord, monthly precipitation or annualeco d, o t y p ec p tat o o a uaprecipitation.
– Data continuity and consistency of a rain gaugeshould be checked first.

Reasons for Missing Precipitation RecordReasons for Missing Precipitation Record • Absence of the observer
I t t l f il• Instrumental failures.• Hence missing data has to be estimated• There are two methods for estimation of missing dataThere are two methods for estimation of missing data.
– Arithmetic mean method.– Normal ratio method.
Th i t ti h d t i i i i• The gauging station whose data is missing iscalled interpolation station and
• The gauging stations whose data are used tocalculate the missing station data are called indexgstations.

• If the normal annual precipitation of the index stationslies within ±10% of normal annual precipitation oflies within ±10% of normal annual precipitation ofinterpolation station then we apply arithmetic meanmethod to determine the missing precipitation recordotherwise the normal ratio method is used for thisotherwise the normal ratio method is used for thispurpose.
• Consider that record is missing from a station ‘X’.
l• Now let,N = Normal annual precipitation. (Mean of 30 years ofannual precipitation data)a ua p ec p a o da a)P = Storm Precipitation.
• Let Px be the missing precipitation for station ‘X’ and Nx ,the normal annual precipitation of this station N N andthe normal annual precipitation of this station, Na, Nb andNc are normal annual precipitations of nearby threestations, A, B and C respectively while Pa, Pb and Pc are thestorm precipitation of that period for these stationsstorm precipitation of that period for these stations.

• Now we have to compare Nx with Na , Nb andNc separately. If difference of Nx ‐ Na, Nx ‐ Nb,Nx ‐ Nc is within 1/10% of Nx then we usex c / xsimple arithmetic mean method otherwisethe normal ratio method is usedthe normal ratio method is used.
• According to the arithmetic mean method themissing precipitation is given as:g p p g
h i b f b t tiPni
∑=1
where n is number of nearby stations.Piin∑=1

Normal Ratio Methodd h l h d h• According to the normal ratio method the missing
precipitation is given as:
Px =
h P i th i i i it ti f t t th
PNN
n ini
i i
x∑=
=1 1
• where Px is the missing precipitation for any storm at theinterpolation station ‘X’.
Pi i h i i i f h i d f h• Pi is the precipitation for the same period of same storm at the“ith” station of a group of index stations and
f ‘ ’• Nx and Ni are the normal annual precipitation values for the ‘X’and ‘ith’ stations e.g. in case of three index stations
][ 31
33
22
11
PNNPN
NPNN xxx
xP ++=321 NNN

• Example
– Find out the missing storm precipitation of station‘C’ given in the following table: (can we applySimple Arithmetic Mean Method to Approach theSolution?)
Station A B C D E
Storm precipitation (cm)
9.7 8.3 ---- 11.7 8.0
Normal Annual precipitation (cm)
100.3 109.5 93.5 125.7 117.5
p p ( )
Continued…

• SolutionIn this example the storm precipitation and normal annualp p pprecipitations at stations A, B, D and E are given andmissing precipitation at station ‘C’ is to be calculatedwhose normal annual precipitation is known. We willwhose normal annual precipitation is known. We willdetermine first that whether arithmetic mean or normalratio method is to be applied.
10% of Nc = 93.5x10/100 = 9.35
After the addition of 10% of Nc in Nc, we get93.5+9.35=102.85
And by subtracting 10% we get a value of 84.15
So Na, Nb, Nd or Ne values are to be checked for the range102.85 to 84.15.102.85 to 84.15.

If any value of Na, Nb, Nd or Ne lies beyond thisrange then normal ratio method would be usedrange, then normal ratio method would be used.It is clear from data in table above that Nb, Nd andNe values are out of this range so the normal ratioNe values are out of this range so the normal ratiomethod is applicable here, according to which
Px = PNN
n ini
i i
x∑=
=1 1
Nn i i=1
Pc= (1/4 )(93.5 x 9.7/100.3+ 93.5 x 8.3/109.5+ 93.5 x 11 7/125 7 93 5 8 0/117 5) 7 811.7/125.7+ 93.5 x 8.0/117.5) = 7.8 cm

• ExamplePrecipitation station “X” was inoperative for partof a month during which a storm occurred. Thestorm totals at three surrounding stations A, B andC were respectively 10.7, 8.9 and 12.2 cm.
The normal annual precipitation amounts atThe normal annual precipitation amounts atstations X, A, B and C are respectively 97.8, 112,93 5 and 119 9 cm Estimate the storm93.5 and 119.9 cm. Estimate the stormprecipitation for station ‘X’.
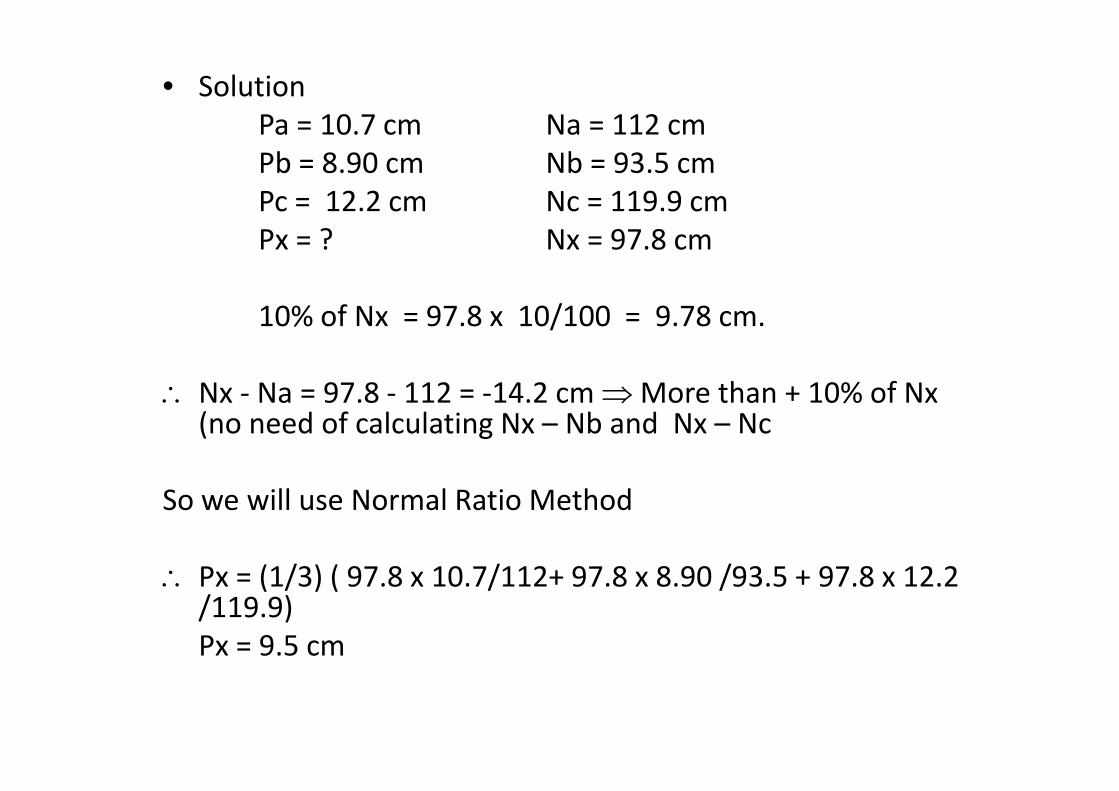
• SolutionPa = 10 7 cm Na = 112 cmPa = 10.7 cm Na = 112 cmPb = 8.90 cm Nb = 93.5 cmPc = 12.2 cm Nc = 119.9 cmPx = ? Nx = 97.8 cm
10% f N 9 8 10/100 9 810% of Nx = 97.8 x 10/100 = 9.78 cm.
∴ Nx ‐ Na = 97 8 ‐ 112 = ‐14 2 cm⇒More than + 10% of Nx∴ Nx ‐ Na = 97.8 ‐ 112 = ‐14.2 cm ⇒More than + 10% of Nx(no need of calculating Nx – Nb and Nx – Nc
So we will use Normal Ratio Method
∴ Px = (1/3) ( 97 8 x 10 7/112+ 97 8 x 8 90 /93 5 + 97 8 x 12 2∴ Px = (1/3) ( 97.8 x 10.7/112+ 97.8 x 8.90 /93.5 + 97.8 x 12.2 /119.9)Px = 9.5 cm

Consistency of Precipitation bl l iData or Double Mass Analysis

• In using precipitation in the solution of hydrologicproblems it is necessary to ascertain that time trends inproblems, it is necessary to ascertain that time trends inthe data are due to meteorological changes only and notother factors like
• Changes in the gauge location• Change in surroundings such as
– Construction of buildings or– Growth of trees etc.
• Frequently changes in gauge location are not disclosed inthe published record.
• Due to such changes the data might not be consistent.

• The consistency of the record then is required to bedetermined and the necessary adjustments be made Thisdetermined and the necessary adjustments be made. Thiscan be achieved by the method called the double masscurve technique.curve technique.
• The double mass curve is obtained by plotting theaccumulated precipitation at the station in question alongaccumulated precipitation at the station in question alongX‐axis and the average accumulated precipitation of anumber of other nearby stations which are situated underythe same meteorological conditions along Y‐axis.

• If the curve has a constant slope, the record of station “X” isconsistent. However, if there is any break in the slope of the, y pcurve, the record of the station is inconsistent and has to beadjusted by the formula.
( / )Pa = (Sa / So) x PoWhere Pa = Adjusted precipitation.
P Ob d i it tiPo = Observed precipitation.Sa = Slope prior to the break in the curveS = Slope after the break in the curveSo = Slope after the break in the curve.
• All values before break are to be adjusted.
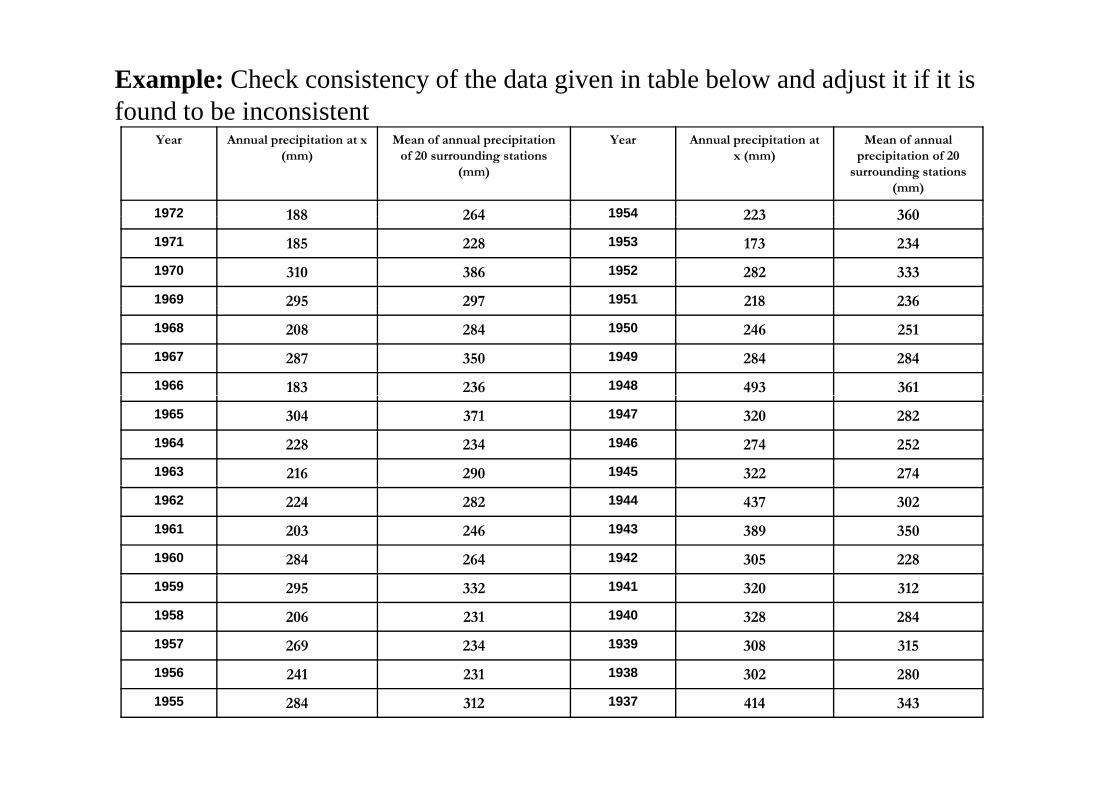
Example: Check consistency of the data given in table below and adjust it if it is found to be inconsistent
Year Annual precipitation at x (mm)
Mean of annual precipitation of 20 surrounding stations
(mm)
Year Annual precipitation at x (mm)
Mean of annual precipitation of 20
surrounding stations (mm)
1972 188 264 1954 223 3601972 188 264 1954 223 360
1971 185 228 1953 173 234
1970 310 386 1952 282 333
1969 295 297 1951 218 23695 97 8 36
1968 208 284 1950 246 251
1967 287 350 1949 284 284
1966 183 236 1948 493 361
1965 304 371 1947 320 282
1964 228 234 1946 274 252
1963 216 290 1945 322 274
1962 224 282 1944 437 302
1961 203 246 1943 389 350
1960 284 264 1942 305 228
1959 295 332 1941 320 312
1958 206 231 1940 328 284
1957 269 234 1939 308 315
1956 241 231 1938 302 280
1955 284 312 1937 414 343

• Solution– A double mass curve is plotted by taking cumulative of average precipitation of
surrounding stations along x‐axis and accumulative precipitation of station ‘X’ along y‐axis for which consistency of data is being investigated.g y y g g
10000
12000
6000
8000
S0=1 176
Sa/S0=0.7
0
2000
4000
Sa=0.854
S0 1.176
00 2000 4000 6000 8000 10000 12000

• The correction for slope is applied to readings before breakThe correction for slope is applied to readings before breakin slope (in time). The calculations are shown in table,below.
Slope of Ist line = Sa = 0.854Slope of deviating line = So = 1.176Correction to values (multiplying factor) = 0 854/1 176 = 0 70Correction to values (multiplying factor) = 0.854/1.176 = 0.70
• Now regime changes before 1950 So up to 1950 no• Now regime changes before 1950. So up to 1950 nocorrection is required. Before 1950 all readings aremultiplied by slopes ratio of 0.7 to get correctedprecipitation.
• Note that data in latter interval (1973‐1950) is consideredmore authentic so kept in initial reach of the graphmore authentic so kept in initial reach of the graph.

Year Cummulative Annual precipitation at x Cummulative precipitation of 20 surrounding Corrected Precipitation Remarks
Table: Adjusted Precipitation
p p(mm)
p p gstations (mm)
p
1972 188 264 188
1971 373 492 185
1970 683 878 3101970 683 878 310
1969 978 1175 295
1968 1186 1459 208
1967 1473 1809 287
1966 1656 2045 183
1965 1960 2416 304
1964 2188 2650 228
1963 2404 2940 216 No correction
1962 2628 3222 224
1961 2831 3468 203
1960 3115 3732 284
1959 3410 4064 295
1958 3616 4295 206
1957 3885 4529 269
1956 4126 4760 241
1955 4410 5072 284
1954 4633 5432 223
1953 4806 5666 173
1952 5088 5999 282
1951 5306 6235 218
1950 5552 6486 246

Year Cumulative Annual precipitation at x Cumulative precipitation of 20 surrounding Corrected Precipitation Remarks
Table: Adjusted Precipitation
Year Cumulative Annual precipitation at x (mm)
Cumulative precipitation of 20 surrounding stations (mm)
Corrected Precipitation Remarks
1949 5836 6770 190.8
1948 6329 7131 345
1947 6649 7413 224
1946 6923 7665 192
Precipitation of
1945 7245 7939 225.4
1944 7682 8241 306
f Station 'X' x0.7
1943 8071 8591 272.3
1942 8376 8819 213.5
1941 8696 9131 224
1940 9024 9415 229.6
1939 9332 9730 215.6
1938 9634 10010 211 41938 9634 10010 211.4
1937 10048 10353 290