precious metal streaming: the innovative funding solution - gary brown, silver wheaton
TRANSCRIPT

MINES & MONEY LONDONDECEMBER 2014
PRECIOUS METAL STREAMING: THE INNOVATIVE FUNDING SOLUTION

CAUTIONARY STATEMENTS
CAUTIONARY NOTE REGARDING FORW ARD LOOKING-STATEMENTSThe information contai ned herein contains “for ward-looking statements” within the meaning of the U nited States Private Securities Litigati on Reform Act of 1995 and “forward-lookinginformation” withi n the meaning of applicable Canadian securities l egislation. Forward-looki ng statements, which are all statements other than statements of historical fact, incl ude, butare not limited to, statements with respect to the future price of silver or gold, the es timation of mi neral reser ves and resources, the realization of mineral reser ve estimates , the timingand amount of estimated future producti on (including 2014 and 2018 attributable annual produc tion), costs of pr oduction, reserve determi nati on, reser ve conversion rates, statements asto any future di vidends , the ability to fund outstanding commitments and continue to acquire accreti ve pr ecious metal str eam i nteres ts and assessments of the i mpact and resolution ofvarious legal and tax matters. Generally, these forward-looking statements can be i dentified by the use of for ward-looking terminology such as “plans”, “expects” or “does not expect”, “isexpected”, “budget”, “schedul ed”, “ estimates”, “forecasts”, “intends”, “anticipates” or “does not anticipate”, or “believes”, or variations of such words and phrases or s tatements thatcertain actions, events or results “may”, “could”, “ would”, “might” or “will be taken”, “occur” or “be achieved”. Forward-looki ng statements are subjec t to known and unknown risks,uncertainti es and other fac tors that may cause the ac tual results , oper ations, level of acti vity, performance or achievements of Silver Wheaton to be materiall y differ ent from thoseexpressed or i mplied bysuch for ward-looking statements , incl uding but not limited to: fl uctuations i n the price of silver or gold; the absence of control over mini ng operations from whichSilver Wheaton purchases sil ver and gold and risks r elated to these mini ng operati ons i ncludi ng risks rel ated to fluctuati ons i n the price of the primar y commodities mined at suchoperations, actual results of mini ng and explor ation acti vities, environmental, economic and political risks of the jurisdictions in which the mini ng operations are l ocated and changes inproject parameters as plans continue to be refined; differences in the i nter pretation or application of tax laws and regul ations; and the Company’s interpretation of, or compliance with,tax laws, is found to be incorrect; as well as those fac tors discussed i n the section entitled “Description of the Busi ness - Risk F actors” in Sil ver Wheaton's Annual Infor mati on F ormavailable on SED AR at www.sedar.com and in Silver Wheaton's For m 40-F on file with the U.S. Securities and Exchange Commission i n Washington, D.C. F orward-looking s tatementsare based on assumptions management believes to be reasonable, including but not limited to: the continued operation of the mi ning operations from which Sil ver Wheaton purchasessilver and gold, no material adverse change in the mar ket price of commoditi es, that the mi ning operations will operate and the mining projects will be completed in accordance with theirpublic statements and achieve their stated producti on outcomes, the continuing ability to fund or obtain funding for outs tanding commitments , the ability to source and obtain accretiveprecious metal stream interests, expec tati ons regarding the resol ution of l egal and tax matters, and such other assumptions and factors as set out herein. Although Silver Wheaton hasattempted to identify important fac tors that could cause actual results to differ materially from those contai ned in forward-looki ng statements, there may be other factors that cause resultsnot to be as anticipated, estimated or intended. There can be no assurance that forwar d-looking statements will prove to be accur ate. Accor dingly, r eaders shoul d not pl ace unduereliance on forward-looki ng statements and are cautioned that actual outcomes may var y. Sil ver Wheaton does not undertake to update any for ward-looking statements that areincluded or incorporated by reference herein, except in accordance with applicable securities laws.
CAUTIONARY LANGUAGE REGARDING RESERVES AND RESOURCESFor further information on Mineral Reserves and Mineral Resources and on Sil ver Wheaton more generall y, readers shoul d refer to Sil ver Wheaton’s Annual Information Form for theyear ended D ecember 31, 2013, and other continuous disclosure documents filed by Silver Wheaton since January 1, 2014, available on SEDAR at www.sedar.com. Sil ver Wheaton’sMineral Reser ves and Mineral R esources are subject to the qualifications and notes set forth therein. Mineral Resources which ar e not Miner al Reser ves do not have demonstr atedeconomic viability.
Cautionary Note to United Stat es Investors Concerning Esti mates of Measured , Indicated and Inferred Mineral Resource s: T he i nfor mati on contained her ein uses the terms“Measured”, “Indicated” and “Inferred” Mineral Resources. United States inves tors are advised that while such terms are recognized and required by Canadi an regulations , the UnitedStates Securities and Exchange Commission does not recognize them and expressl y prohibits U.S. registered companies fr om i ncludi ng such terms in their filings with the SEC. “InferredMineral Resources” have a great amount of uncertai nty as to their existence, and as to their economic and legal feasi bility. It cannot be assumed that all or any part of an InferredMineral Resource will ever be upgraded to a higher categor y. Under Canadian rules, estimates of Inferred Miner al Resources may not form the basis of feasibility or other economicstudi es. United States investors are cautioned not to assume that all or any part of Measured or Indicated Mineral Resources will ever be converted into Mineral Reserves or that anyexploration potential will ever be converted to anycategory of Mineral R eser ves or Mineral Resources. United States i nvestors are also cautioned not to assume that all or any part of anInferred Mineral R esource exists, or is economically or legall y mineable. United States investors ar e urged to consider closel y the disclosure in Sil ver Wheaton’s F orm 40-F, a copy ofwhich may be obtained from Silver Wheaton or from http://www.sec.gov/edgar.shtml.
1
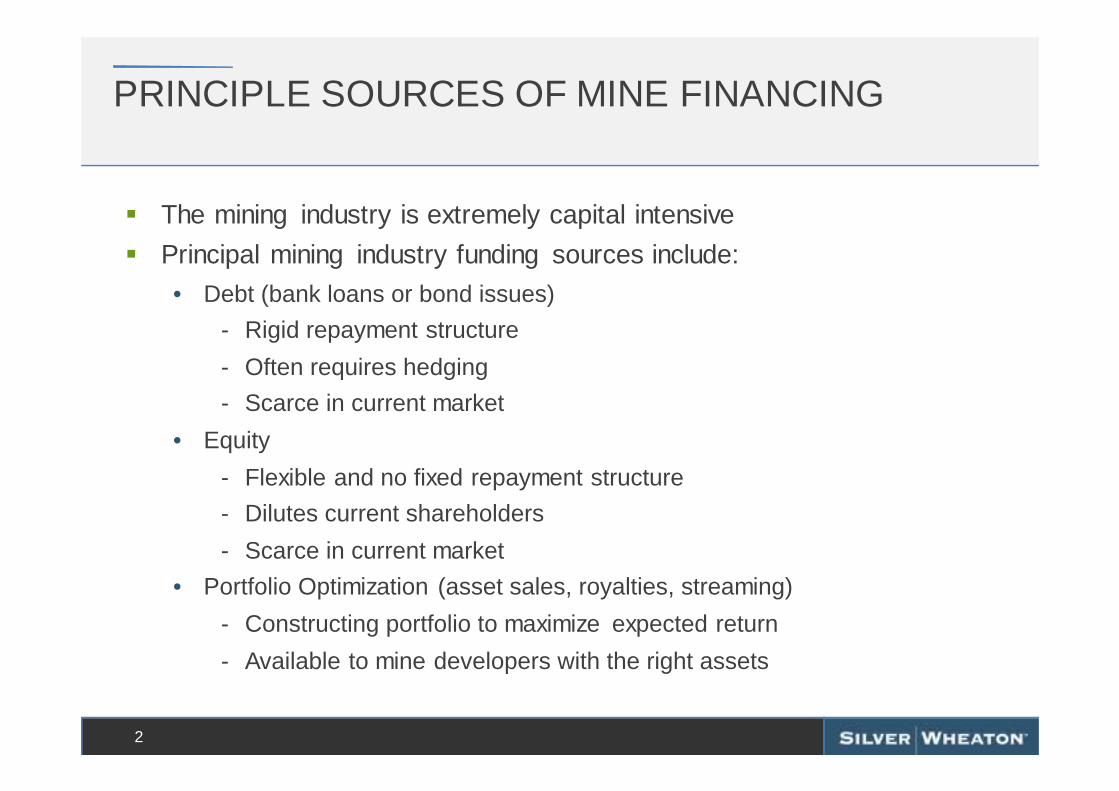
PRINCIPLE SOURCES OF MINE FINANCING
� The mining industry is extremely capital intensive
� Principal mining industry funding sources include:
• Debt (bank loans or bond issues)
- Rigid repayment structure
- Often requires hedging
- Scarce in current market
• Equity
- Flexible and no fixed repayment structure
- Dilutes current shareholders
- Scarce in current market
• Portfolio Optimization (asset sales, royalties, streaming)
- Constructing portfolio to maximize expected return
- Available to mine developers with the right assets
2

$0
$10
$20
$30
$40
$50
$60
$70
$80
2007 2008 2009 2010 2011 2012 2013 2014YTD
Bonds Loans Equity Portfolio Optimization
THE EVOLUTION OF MINE FINANCINGPRINCIPAL SOURCES OF FUNDING
3
Tota
l Min
e F
inan
cing
Alte
rnat
ives
(US
$ B
illio
ns)
60% Debt
Total mine financing represents over $50B per year, of which 60%was generated through the issuance of debt 2014 YTD
* Source: Scotiabank

$0
$5
$10
$15
$20
$25
$30
$35
$40
$45
2007 2008 2009 2010 2011 2012 2013 2014 YTD
Equity Portfolio Optimization
THE EVOLUTION OF MINE FINANCINGPRINCIPAL SOURCES OF FUNDING - NET OF DEBT
4
Tran
sact
ions
Siz
e (U
S$
Bill
ions
)
Portfolio optimization strategy is playing an incre ased role in mine financing
50%41%
18%25%
13%
21%
14%
21%
65%
* Source: Scotiabank

PRINCIPLE SOURCES OF MINE FINANCING
� Portfolio optimization can also be separated into the following:
• Asset Sale- Outright sale of entire mine/project or joint venture interest- High quality mines/projects that can find a bidder, are generally not the
assets the miner/developer wants to sell and likely selling at distressed levels
• Royalties- Sale of a percentage of the revenues from an asset- Typically a percentage of revenue from all metals produced, including
primary metal
• Streaming - Sale of a percentage of metal from an asset - Typically a non-core metal from within a core asset, with the primary
metal remaining in the hands of the miner
5

THE EVOLUTION OF MINE FINANCINGPORTFOLIO OPTIMIZATION ALTERNATIVES
6
The sale of entire mining assets represents a large segment of portfolio optimization efforts
Tran
sact
ions
Siz
e (U
S$
Bill
ions
)
$0
$2
$4
$6
$8
$10
$12
$14
$16
2007 2008 2009 2010 2011 2012 2013 2014 YTD
Asset Sales Royalties Streaming
* Source: Scotiabank

THE EVOLUTION OF MINE FINANCINGPORTFOLIO OPTIMIZATION (STREAMING & ROYALTY)
7
$33.20/share
Streaming has grown to represent ~90% of the capita l provided by streams and royalties
Tran
sact
ions
Siz
e (U
S$
Bill
ions
)
$0.0
$0.5
$1.0
$1.5
$2.0
$2.5
2007 2008 2009 2010 2011 2012 2013 2014 YTD
Royalties Streaming
* Source: Scotiabank

THE HISTORY OF THE STREAMING MODEL
8

� Wheaton River Minerals was focused on becoming a global leader in gold.
� In order to achieve this objective, capital was required
� In 2004, silver companies traded at a premium to gold companies
� A substantial amount of by-product silver was being produced, primarily from the San Dimas mine in Mexico
� Wheaton River recognized that its silver was not being valued at the same multiple in the market as silver from primary silver producers
� Silver Wheaton was created in 2004 in order to unlock the value of Wheaton River’s by-product silver
THE ORIGIN OF STREAMINGCREATED IN 2004
9

� Silver Wheaton makes an upfront payment in consideration for the future silver and/or gold production from a mine
� As the mine owner delivers precious metal to Silver Wheaton, an additional delivery payment is made to them
10
HOW STREAMING WORKS
Partner Mining Company
Upfront payment (Cash and/or Silver Wheaton shares)
Silver Wheaton receives a % of life-of-mine silver and/or gold production
Delivery payment ($ per ounce)

Traditional Miner
Value of Future Precious Metal
Production
A WIN-WIN MODEL WHY IT WORKS
11
� Precious metal stream agreements create shareholder value for both the purchaser (streamer) and the seller (traditional miner)
� Precious metal produced at a traditional miner is given a lower valuation by the market than if it had been produced by a streaming company
• Results in ‘value arbitrage’ opportunity
Streaming Company
Arbitrage opportunity exists to create value for both the Streamer and the
Partner’s shareholdersValue of Future Precious Metal
Stream

12
HOW WE VALUE NEW OPPORTUNITIESDETERMINING THE EQUILIBRIUM SILVER PRICE
Current Market Valuation
Existing Portfolio
Individual streams mapped out to resource exhaustion
Cash flows from streams discounted back using discount rates adjusted for various risk factors
The silver price that must exist to justify current market value of Silver Wheaton
Equilibrium Silver Price
Solvefor
0
200
400
600
800
1000
1200
1400
1600
1 2 3 4 5 6 7 8 9 10 11 12 13 14 15 16 17 18 19 20 21 22 23 24 25 26 27 28 29 30 31
Risk Factors include: asset quality, life cycle of mine, political risk, counter party risk, and geologic confidence (reserve, resource, exploration)
19%
16%
12%
8%7%
7%
5%
4%
22 %

13
HOW WE VALUE NEW OPPORTUNITIESDETERMINING THE APPROPRIATE DISCOUNT RATE
Existing Portfolio
Average discount rate of portfolio adjusted for risk factors aboveApplied
Discount Rate
Key Risk Factor Existing Portfolio
Asset Quality85% in 1st quartile of primary metal cost curve
Life Cycle of Mine 18 Operating, 5 Development
Political RiskMexico, Canada, US, Peru, Brazil, Argentina, Chile, Sweden, Portugal, Greece, Guyana
Counterparty Risk >45% of current production from investment grade counterparties
Geologic Confidence >50% of R&R are Reserves
Duration of streams Average stream has >10yr mine life
85%
1%13%
1%
1st Quartile
=

14
HOW WE VALUE NEW OPPORTUNITIESDETERMINING THE MAXIMUM PRICE PAYABLE
Potential Opportunity
Map out potential stream to resource exhaustionusing in-house technical team’s production profile
Discount cash flows from streams using:Value of
stream if it were in Silver
Wheaton’s portfolio
Applied Discount Rate
Equilibrium Silver Price
0
200
400
600
800
1000
1200
1 2 3 4 5 6 7 8 9 10 11 12 13 14 15

Value of stream if it
were in Silver
Wheaton’s portfolio
HOW WE VALUE NEW OPPORTUNITIESCREATING WIN-WIN TRANSACTIONS
15
Traditional MinerSilver Wheaton
Opportunity to create value for both Silver Wheaton
and potential partner
Value of stream in partner’s portfolio
� Value of stream in Silver Wheaton’s portfolio = Maximum price payable
� Value of stream as it resides in potential partners portfolio determined by deconstructing flows relative to market capitalization
� Arbitrage between values shared, resulting in value creating for both parties

TRADITIONAL STREAMING AGREEMENTS
16
Streaming Agreements are structured to reduce as mu ch risk as possible, including financing, permitting, and construction r isk.
* This is for illustrative purposes only as all streams are unique with minor variations around the basic structure. ** Standard condition for a stream agreement includes permits, financing, security, etc. *** Completion tests are generally based on mining operations, mill throughput, etc. reaching a defined level of design capacity.
Traditional Structure*: � Upfront payment made for stream on development project and/or operating mine in
either single or staged payments
Streaming Agreement
signed
Permitting and financing
in place**
Adjust stream or cancel stream & deposit returned
Ounces delivered & production
payments made
Upfrontpayment(s)
made
Streaming Agreement
signed
Ounces delivered & production
payments made
Upfrontpayment (s)
made
Development Project
Operating Mine
Completion Test***
Satisfied?
Yes
No

EARLY DEPOSIT STREAMING AGREEMENTSNEW STRUCTURE FOR EARLY STAGE DEVELOPERS
17
With the Early Deposit Streaming Agreement, “at risk ” capital is limited.
* Standard condition for a stream agreement includes permits, financing, security, etc. ** If stream is cancelled, Silver Wheaton is entitled to a return of the deposit less a small non-refundable amount. *** Once upfront payment is made, the Early Deposit Streaming agreement acts as a traditional streaming agreement and is subject to a completion test.
Early Deposit Structure:
� The right to purchase a stream on an early-stage development project for minimal upfront capital
� Initial early deposit payment typically set at only 5-10% of predefined upfront payment
� Decision to proceed is made once feasibility, permitting and financing are in place
Pay Early Deposit
Positive feasibility study
received
Negative feasibility study
received
Construction commences
Advance remaining upfront payment***
Cancel stream and early deposit
returned**
Permitting & financing*
in place?
Yes
No

41%
37%
21%
1%
Silver Wheaton Franco-Nevada
Royal Gold Sandstorm
SOURCES OF STREAMS EXPAND ROYALTY COMPANIES HAVE BECOME STREAMERS
18
Total Enterprise Value*
* Source: ThomsonReuters as of November 7, 2014, Royal Gold Q1 2015 Financials, Silver Wheaton, Franco Nevada, and Sandstorm Q3 2014 Financials
Streaming / royalty companies now represent +$18 bi llion in enterprise value
Royal Gold
Franco-Nevada
SilverWheaton
� Streaming companies now represent +$18 billion in enterprise value
� Traditional royalty companies now rely more on streaming than royalties
� New entrants service smaller, high risk portion of market
� Principal Streaming Companies:

THE BENEFITS OF PRECIOUS METAL STREAMING TO MINERS
19
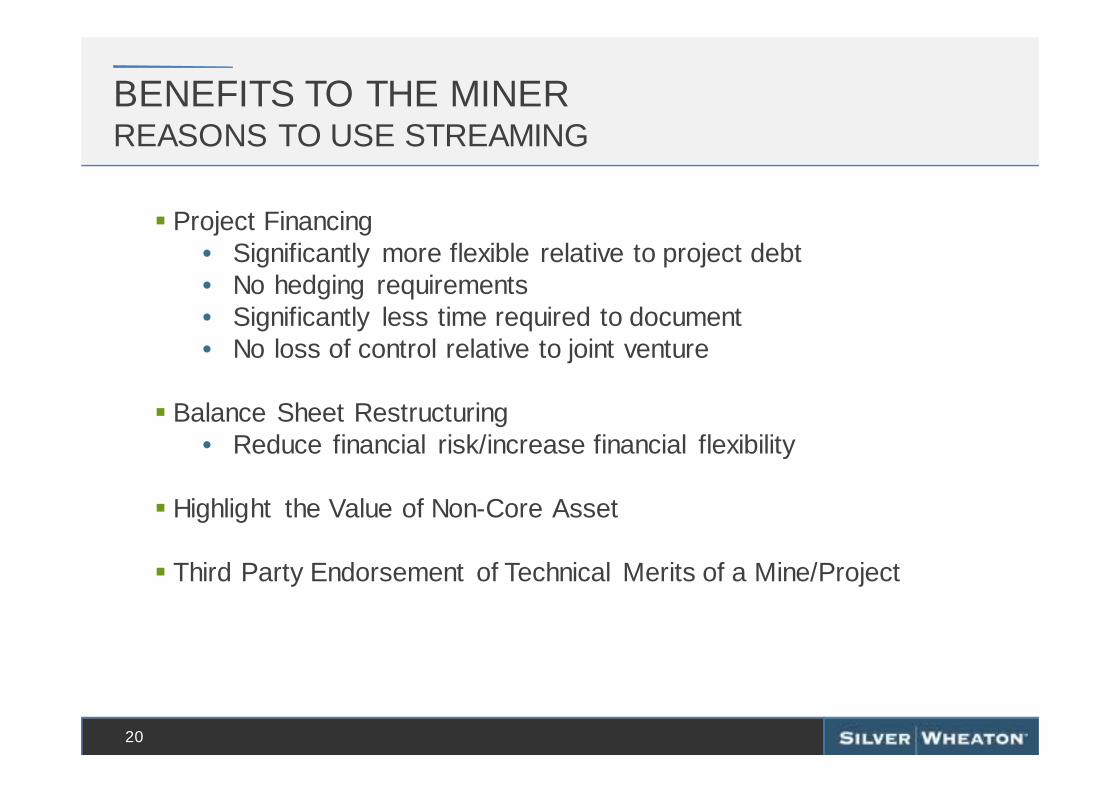
BENEFITS TO THE MINERREASONS TO USE STREAMING
20
� Project Financing• Significantly more flexible relative to project debt• No hedging requirements• Significantly less time required to document• No loss of control relative to joint venture
� Balance Sheet Restructuring• Reduce financial risk/increase financial flexibility
� Highlight the Value of Non-Core Asset
� Third Party Endorsement of Technical Merits of a Mine/Project

BENEFITS TO THE MINERLEVERAGE BECOMING UNTENABLE FOR MINERS
21
Precious metal mining companies’ balance sheets bec oming extended in current market creating opportunity for streaming to help fund new project and reduce debt burden
North American Gold Industry Net Debt
Source: Bloomberg, Company reports, RBC Capital Markets estimates
$0
$250
$500
$750
$1,000
$1,250
$1,500
$1,750
-$5
$0
$5
$10
$15
$20
$25
$30
2000 2002 2004 2006 2008 2010 2012 H1/2014
Gol
d P
rice
($/
oz)
Net
Deb
t Pos
itio
n ($
Bn)
Tier I Net Debt ($Bn; LHS) Tier II Net Debt ($Bn; LHS) Avg Gold Price ($/oz)
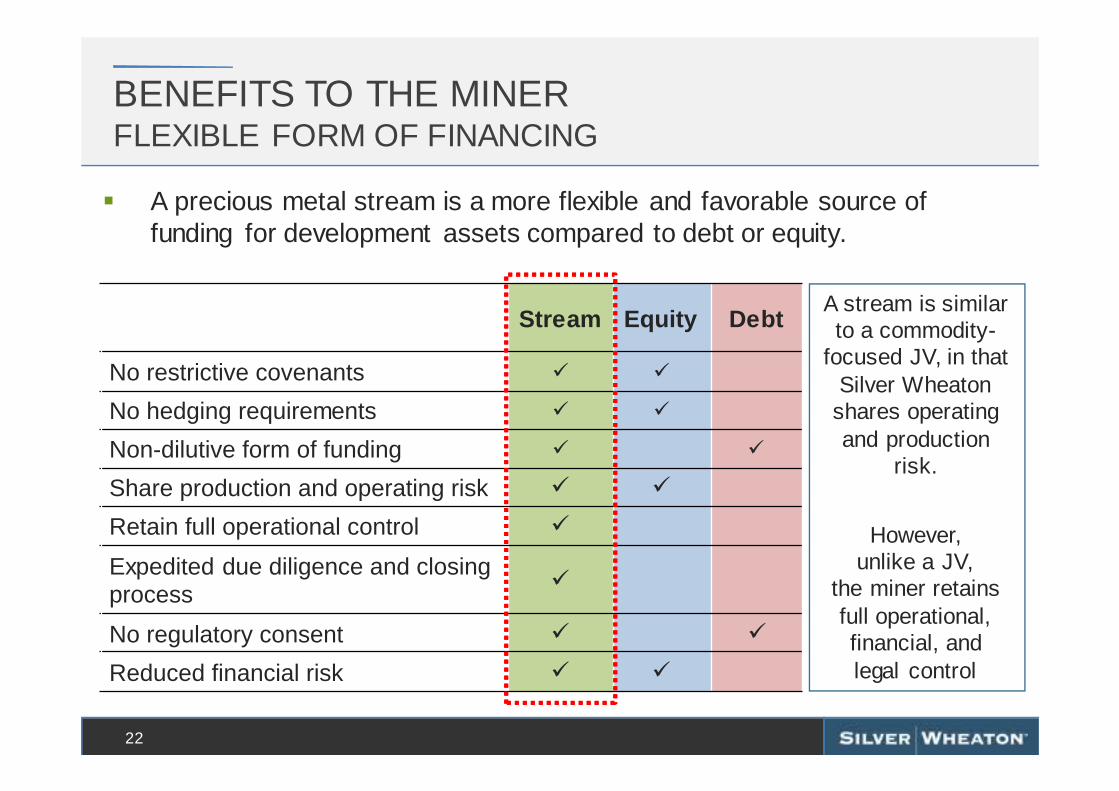
BENEFITS TO THE MINERFLEXIBLE FORM OF FINANCING
22
� A precious metal stream is a more flexible and favorable source of funding for development assets compared to debt or equity.
Stream Equity Debt
No restrictive covenants � �
No hedging requirements � �
Non-dilutive form of funding � �
Share production and operating risk � �
Retain full operational control �
Expedited due diligence and closing process
�
No regulatory consent � �
Reduced financial risk � �
A stream is similar to a commodity-
focused JV, in that Silver Wheaton
shares operating and production
risk.
However, unlike a JV,
the miner retains full operational,financial, and legal control
$0
$2,000
$4,000
$6,000
$8,000
$10,000
$12,000
2004 2006 2007 2008 2009 2010 2011 2012 2013 2014
Other StreamerSilver Wheaton
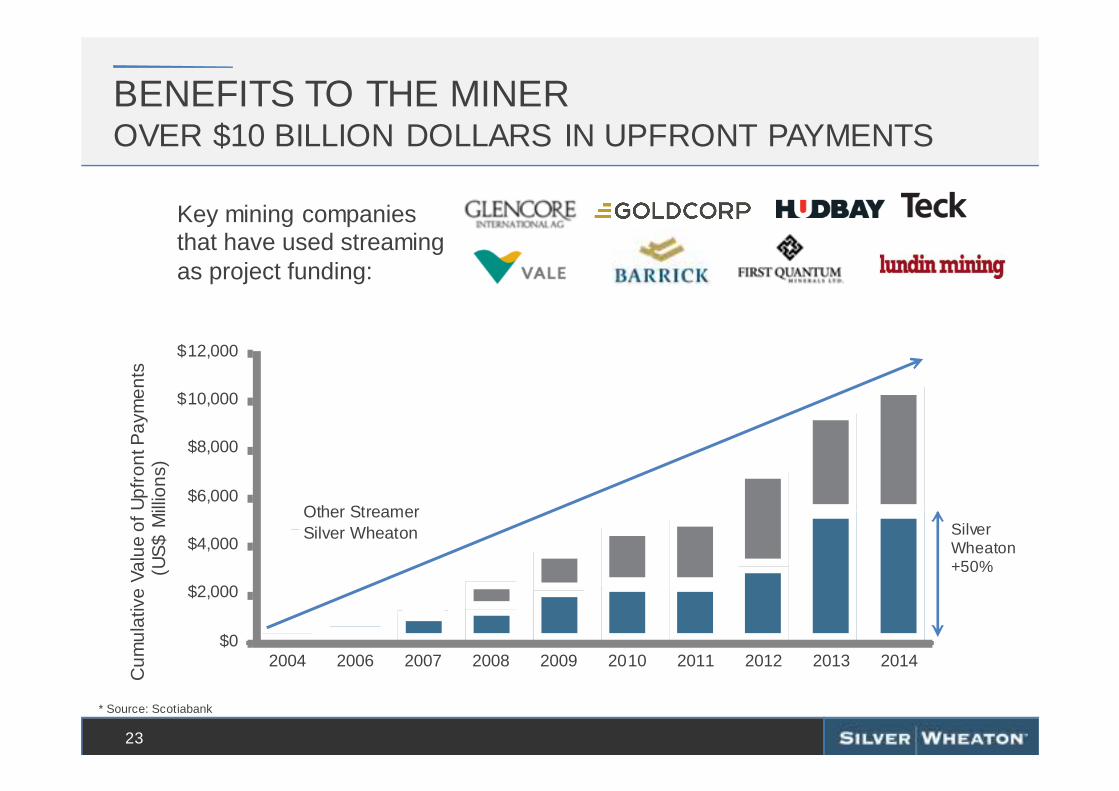
BENEFITS TO THE MINEROVER $10 BILLION DOLLARS IN UPFRONT PAYMENTS
23
Cum
ulat
ive
Valu
e of
Upf
ront
Pay
men
ts(U
S$
Mill
ions
)
Key mining companies that have used streaming as project funding:
Silver Wheaton +50%
* Source: Scotiabank

95%
4.1%0%
10%20%
30%40%50%
60%70%80%
90%100%55%
3.8%
0%
10%
20%
30%
40%
50%
60%
24
NEW MINE EXAMPLE: PEÑASQUITO
EXPANSION EXAMPLE: SALOBO
Upfront payment generally represents larger portion of capex than what a stream represents as a portion of reven ue
Upfront paymentas a percentage of
total capex
Stream as apercentage of mine revenue
Upfront paymentas a percentage ofexpansion capex
Stream as apercentage of mine revenue
BENEFITS TO THE MINERSTREAMING ENHANCES RETURNS

-100%
-80%
-60%
-40%
-20%
0%
20%
40%
60%
80%
100%
Nov
-09
Jan-
10
Mar
-10
May
-10
Jul-1
0
Se
p-1
0
Nov
-10
Jan-
11
Mar
-11
May
-11
Jul-1
1
Se
p-1
1
Nov
-11
Jan-
12
Mar
-12
May
-12
Jul-1
2
Se
p-1
2
Nov
-12
Jan-
13
Mar
-13
May
-13
Jul-1
3
Se
p-1
3
Nov
-13
Jan-
14
Mar
-14
May
-14
Jul-1
4
Se
p-1
4
Nov
-14
BENEFITS TO THE MINERNEW STRUCTURE BENEFITS JUNIOR DEVELOPERS
25
Early Deposit Structure
� Allows junior mining companies secure financing to advance project to feasibility stage
Junior mining companies are challenged to raise equ ity in current market or can do so only by excessively diluting existing shareholders
Junior Gold Miners Index (GDXJ) down ~70% over 5 years

BENEFITS TO THE MINERNEW STRUCTURE BENEFITS JUNIOR DEVELOPERS
20
� No dilution – especially at a time when share price may not reflect full mine potential
� Mine is provided with the funds required to advance the asset to the next phase, deferring any equity to be raised to a later stage (and thus higher share price)
� Mine has, through the remaining portion of the upfront funds to be advanced by Silver Wheaton, a significant portion of the CAPEX financed
� Investors provided with confidence that a third party (Silver Wheaton’s) technical team has reviewed the project and attests to its potential
Advantages of the Early Deposit Structure

THE BENEFITS OF PRECIOUS METAL STREAMING TO INVESTORSTHE SILVER WHEATON EXAMPLE
27

HIGH-QUALITY ASSET BASEDIVERSIFIED PORTFOLIO
28
Well-diversified with low political risk and strong partnerships
Operating Mines (18) Development Projects (5)
Partners:
ValeGlencoreGoldcorpBarrick
EldoradoLundin
Pan AmericanHudbayPrimero
CapstoneNyrstarAlexco
Sandspring

2014 Forecast Productionby Cost Quartile*
2018 Forecast Productionby Cost Quartile*
29
HIGH-QUALITY ASSET BASELOW-COST PRODUCTION
* From Company reports and Wood Mackenzie estimates of July 2014 byproduct cost curves for gold, zinc, copper, nickel and silver mines.
Over 85% of SLW’s production comes from assets in t he lowest half of the cost curve
~35%
ProductionGrowth
85%
1%13%
1%
74%
12%
13%
1%

0
10
20
30
40
50
60
2010A 2011A 2012A 2013A 2014E 2018E
Pascua Lama
Toroparu
Salobo
Sudbury
777
Constancia
Rosemont
Peñasquito
San Dimas***
Yauliyacu
Zinkgruvan
Barrick (other)**
Other
FIVE YEAR PRODUCTION GROWTHSTRONG GROWTH PROFILE WITH SIGNIFICANT OPTIONALITY
30
Silv
er E
quiv
alen
t Pro
duct
ion*
(M
oz)
Production is forecast to grow ~35% to 48 Moz Ag Eq . in 2018Pascua Lama is not in 2018 forecast but would add a n additional 9Moz / yr in its first 5 years* Assumes a Au/Ag ratio of 60:1; ** Comprised of the Veladero, Lagunas Norte and Pierina mines; *** Production includes Goldcorp’s four year commitment from August 2010 –2014, to deliver to Silver Wheaton 1.5Moz of Ag per annum resulting from their sale of San Dimas to Primero
5 Year Forecast Production Growth of ~35%
29.4Moz
35.8Moz ~36Moz
~48Moz ~9Moz
~1.4Moz
Optionality
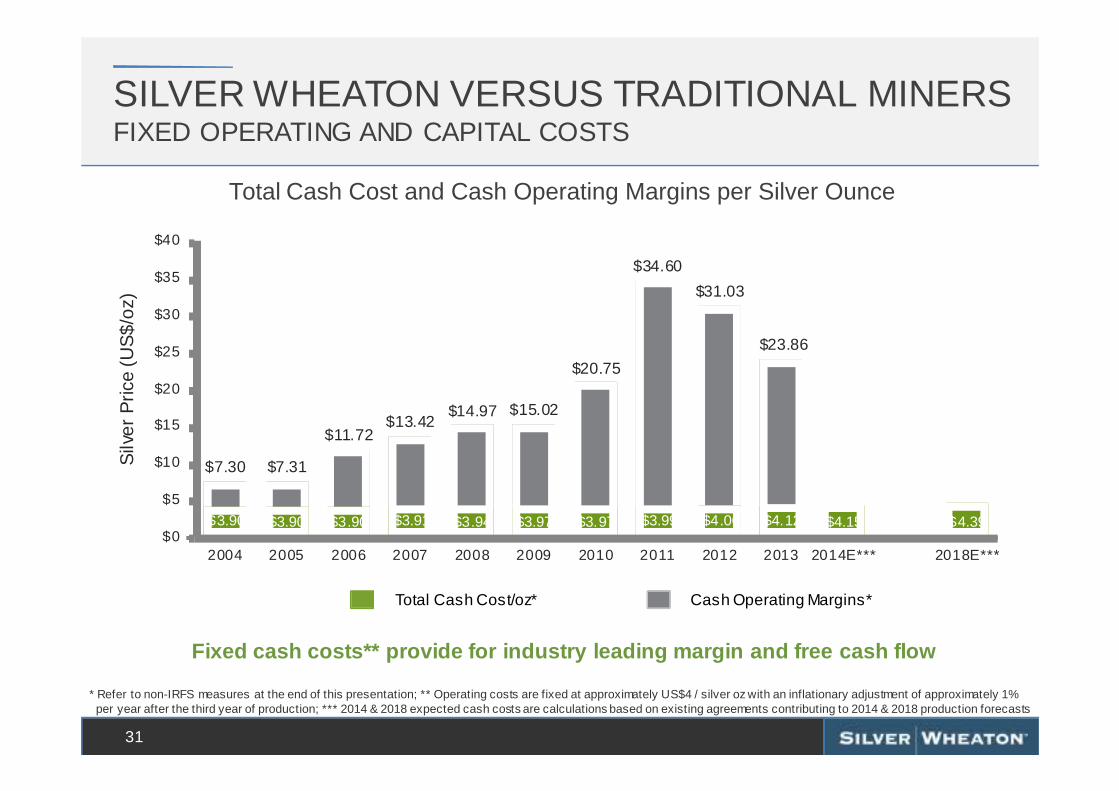
$7.30 $7.31
$11.72$13.42
$14.97 $15.02
$20.75
$34.60
$31.03
$23.86
$3.90 $3.90 $3.90 $3.91 $3.94 $3.97 $3.97 $3.99 $4.06 $4.12 $4.15 $4.39 $0
$5
$10
$15
$20
$25
$30
$35
$40
2004 2005 2006 2007 2008 2009 2010 2011 2012 2013 2014E*** 2018E***
Silv
er P
rice
(US
$/oz
)SILVER WHEATON VERSUS TRADITIONAL MINERSFIXED OPERATING AND CAPITAL COSTS
31
* Refer to non-IRFS measures at the end of this presentation; ** Operating costs are fixed at approximately US$4 / silver oz with an inflationary adjustment of approximately 1% per year after the third year of production; *** 2014 & 2018 expected cash costs are calculations based on existing agreements contributing to 2014 & 2018 production forecasts
Cash Operating Margins*Total Cash Cost/oz*
Fixed cash costs** provide for industry leading mar gin and free cash flow
Total Cash Cost and Cash Operating Margins per Silver Ounce

SILVER WHEATON VERSUS ETF / BULLION EXPANSION AND GROWTH THROUGH ACCRETIVE ACQUISITIONS
32
Total attributable silver equivalent reserves and resources per share since inception*
Reserves Measured & Indicated Inferred
*From Dec. 31, 2004 to Dec. 31, 2013, Reserves and Resources are as of Dec. 31 for each year (see Silverwheaton.com); **Current reserves and resources include reserves and resources updated to Dec. 31, 2013
Significant growth in reserves and resources per sh are since inception
0.0
1.0
2.0
3.0
4.0
5.0
6.0
7.0
2004 2005 2006 2007 2008 2009 2010 2011 2012 2013
Silv
er E
q oz
/sha
re

-100%
-50%
0%
50%
100%
150%
200%
250%D
ec-0
7M
ar-0
8
Jun-
08
Sep
-08
Dec
-08
Mar
-09
Jun-
09S
ep-0
9
Dec
-09
Mar
-10
Jun-
10
Sep
-10
Dec
-10
Mar
-11
Jun-
11
Sep
-11
Dec
-11
Mar
-12
Jun-
12
Sep
-12
Dec
-12
Mar
-13
Jun-
13
Sep
-13
Dec
-13
Mar
-14
Jun-
14
Sep
-14
33
BENEFITS TO INVESTORSSHARE PRICES OF STREAMERS HAVE OUTPERFORMED
Streamer Average**
*Source: ThomsonOne, as of January 8, 2014. Performance measured since Franco-Nevada was spun out of Newmont in Dec. 2007; **Streamer Average includes Silver Wheaton, Franco-Nevada, and Royal Gold; ***PHLX is the Philadelphia Gold & Silver Index
Silver
PHLX***
Streaming companies have significantly outperformed the price of gold and silver and the North American producers
Gold

� For mining companies , streaming is a flexible, non-dilutive form of funding.
� For investors , streaming is the investment of choice for precious metals exposure.
34
PORTFOLIO OPTIMIZATIONTHE STREAMING WAY

For more information contact:Silver Wheaton Investor RelationsTel: 604-684-9648Toll Free: 1-800-380-8687Email: [email protected]
NYSE: SLW TSX: SLWwww.silverwheaton.com
35
PORTFOLIO OPTIMIZATIONTHE STREAMING WAY

APPENDIX
36

37
LIQUID STOCK CAPITAL STRUCTURE AS OF SEPTEMBER 30, 2014
Shares Outstanding 364.4 million
Warrants Outstanding (in-the-money) 0.0 million
Options Outstanding (in-the-money) 0.6 million
Shares Fully Diluted 365.0 million
3 Month Average Daily Trading Volume:
TSX: 1.3 million sharesNYSE: 5.0 million shares

� Silver is a unique precious metal• Silver price has high correlation with gold price
• Produced primarily as a by-product
• Significant industrial applications
� Silver is a store of value• Physical silver demand has risen significantly in the past several years
reflecting strong investor interest
• ETF inventories remain at historically high levels
� Silver is a versatile industrial metal• The best conductor of heat and electricity, the most reflective, malleable yet
strong
• Used in a very wide range of products
• New uses are being developed at a staggering pace
• Relied upon in advancement of developed and emerging economies
38
WHY SILVER?

39
THE SILVER STREAM STRUCTURESILVER CREDIT MODEL
Mine X
Smelter & Refinery
Production Report
Silver Credits Purchased From
Broker
Production PaymentUpfront Payment
Silver Production
1) Silver Wheaton makes an upfront payment to the Vendor2) Mine X, affiliated with the Vendor, produces and sells its concentrates/dore 3) Mine X production is a reference point for the amount of silver to be delivered4) The Vendor then purchases Silver credits in an amount equal to that
deliverable to Silver Wheaton 5) Silver Wheaton then makes the necessary on-going per ounce production
payment to the Vendor6) Silver Wheaton sells silver credits on spot market
Mining Co. or Affiliate (Vendor)
11
22
44
33
55
Silver Credits sold on spot
market
66
0
5
10
15
20
25
30
35
40
45
50
2004 2005 2006 2007 2008 2009 2010 2011 2012 2013 2014
Silv
er P
rice
(US
$ / o
z.)
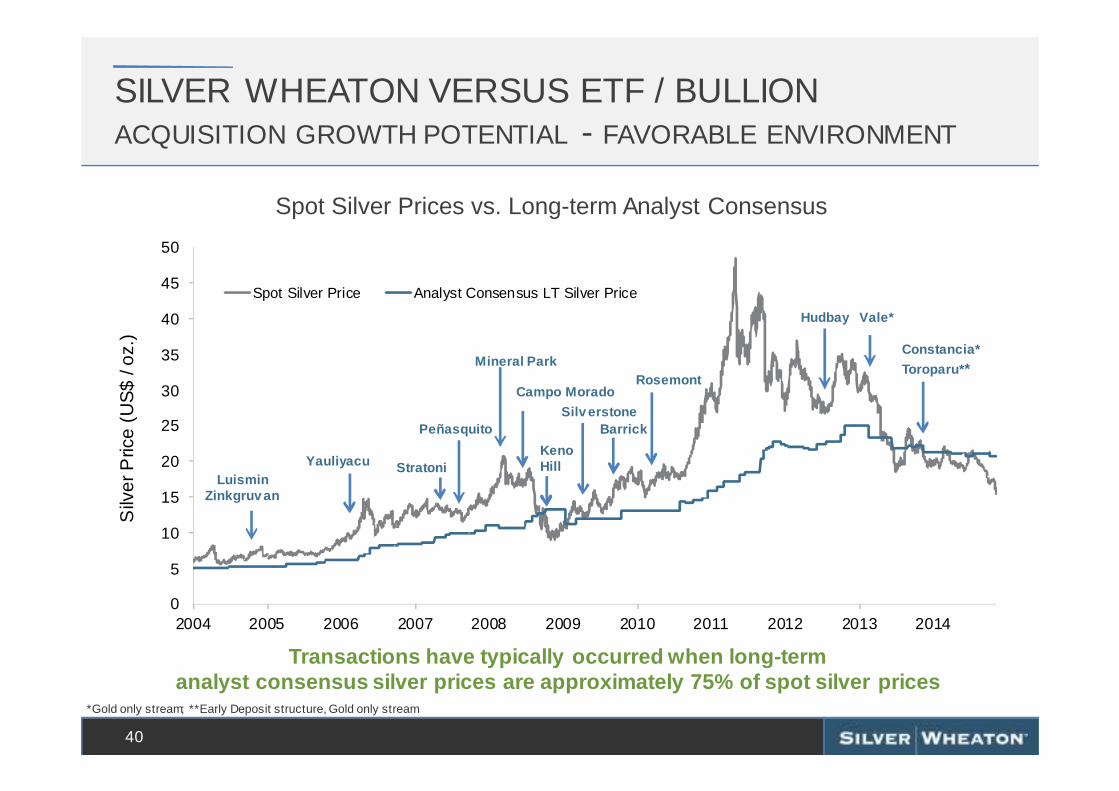
Spot Silver Price Analyst Consensus LT Silver Price
40
SILVER WHEATON VERSUS ETF / BULLION ACQUISITION GROWTH POTENTIAL - FAVORABLE ENVIRONMENT
Spot Silver Prices vs. Long-term Analyst Consensus
LuisminZinkgruv an
Yauliyacu
Peñasquito
Stratoni
Barrick
Keno Hill
Mineral Park
Campo MoradoRosemont
Silv erstone
Hudbay
Transactions have typically occurred when long-term analyst consensus silver prices are approximately 7 5% of spot silver prices
Vale*
*Gold only stream; **Early Deposit structure, Gold only stream
Constancia*
Toroparu* *
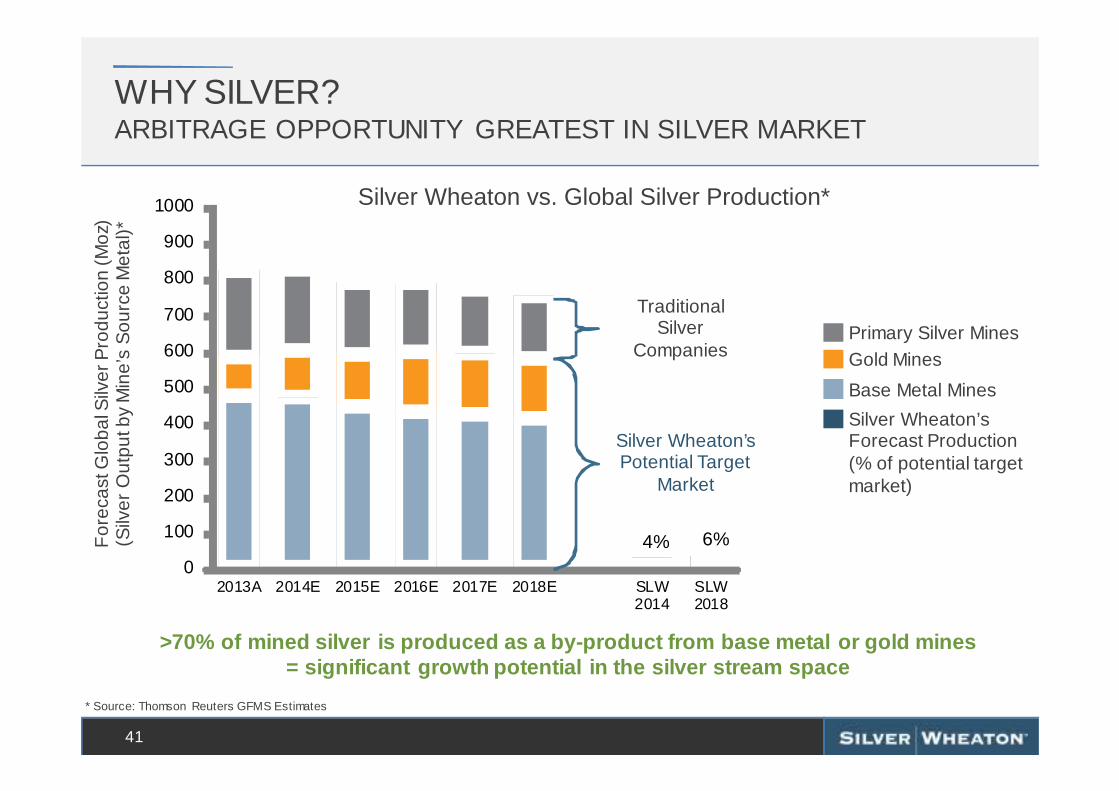
0
100
200
300
400
500
600
700
800
900
1000
2013A 2014E 2015E 2016E 2017E 2018E SLW2014
SLW2018
41
WHY SILVER?ARBITRAGE OPPORTUNITY GREATEST IN SILVER MARKET
Silver Wheaton vs. Global Silver Production*
For
ecas
t Glo
bal S
ilver
Pro
duct
ion
(Moz
)(S
ilver
Out
put b
y M
ine’
s S
ourc
e M
etal
)*
Silver Wheaton’s Potential Target
Market
4% 6%
Traditional Silver
Companies
Silver Wheaton’s Forecast Production (% of potential target market)
>70% of mined silver is produced as a by-product fr om base metal or gold mines = significant growth potential in the silver stream space
Primary Silver MinesGold Mines
Base Metal Mines
* Source: Thomson Reuters GFMS Estimates

42
COMPANY ACQUISITION HISTORYTIMELINE
2004 2005 2006 2007 2008 2009 2010 2011 2012
Date of Contract: 10/15/2004Current Owner: Primero MiningUpfront Payment: $190 million Term of Agreement: LOM Attr. Production: 100% Silver
San Dimas (Mexico)
Date of Contract: 12/8/2004Current Owner: Lundin MiningUpfront Payment: $78 millionTerm of Agreement: LOMAttr. Production: 100% Silver
Zinkgruvan (Sweden)
Date of Contract: 3/23/2006Current Owner: GlencoreUpfront Payment: $285 millionTerm of Agreement: 20 yearsAttr. Production: 100% Silver
Yauliyacu (Peru)
Date of Contract: 4/23/2007Current Owner: Eldorado GoldUpfront Payment: $58 millionTerm of Agreement: LOMAttr. Production: 100% Silver
Stratoni (Greece)
Date of Contract: 7/24/2007Current Owner: GoldcorpUpfront Payment: $485 millionTerm of Agreement: LOMAttr. Production: 25% Silver
Peñasquito (Mexico)
Date of Contract: 3/17/2008Current Owner: Mercator MineralsUpfront Payment: $42 millionTerm of Agreement: LOMAttr. Production: 100% Silver
Mineral Park (United States)
Date of Contract: 5/13/2008Current Owner: Nyrstar NVUpfront Payment: $79 millionTerm of Agreement: LOMAttr. Production: 75% Silver
Campo Morado (Mexico)
Date of Contract: 10/2/2008Current Owner: AlexcoUpfront Payment: $50 millionTerm of Agreement: LOMAttr. Production: 25% Silver
Keno Hill (Canada)
Date of Contract: 10/15/2004Current Owner: GoldcorpUpfront Payment: $4 millionTerm of Agreement: 25 yearsAttr. Production: 100% Silver
Los Filos (Mexico)
Date of Contract: 2/11/2010Current Owner: Augusta ResourcesUpfront Payment: $230 millionTerm of Agreement: LOMAttr. Production: 100% Silver
100% Gold
Rosemont (United States)
Date of Contract: 8/8/2012 & 11/4/2013Current Owner: HudbayUpfront Payment: $430 millionTerm of Agreement: LOMAttr. Production: 100% Silver
50% Gold
Constancia (Peru)
Date of Contract: 8/8/2012Current Owner: HudbayUpfront Payment: $455 millionTerm of Agreement: LOMAttr. Production: 100% Silver
100% / 50% Gold*
777 (Canada)
Date of Transaction: 5/21/2009Interests Acquired: (mine / owner / location)Minto Capstone Mining CanadaCozamin Capstone Mining MexicoNeves-Corvo Lundin Mining PortugalAljustrel I’M SGPA Portugal
Silverstone Resources
Date of Contract: 9/8/2009Current Owner: BarrickUpfront Payment: $625 millionTerm of Agreement: LOMAttr. Production: 25% SilverAdditional Consideration: (mine / location)Lagunas Norte PeruPierina PeruVeladero Argentina
Pascua-Lama (Chile / Argentina)
10/22/2004: Silver Wheaton began trading on the TSX under the symbol SLW. In December, the Company’s name was changed from Chap Mercantile Inc. to Silver Wheaton Corp. and the outstanding shares were consolidated on a 5 for 1 basis.
Note: Upfront payment denoted in US$ millions; excludes closing costs and capitalized interest, where applicable
*Silver Wheaton is entitled to acquire 100% of the life of mine gold production from Hudbay’s 777 mine until Hudbay’s Constancia project satisfies its completion test, or the end of 2016, whichever is later. At that point, Silver Wheaton’s share of gold production from 777 will be reduced to 50% for the life of the mine; **Early Deposit structure
Date of Contract: 2/28/2013Current Owner: ValeUpfront Payment: $1.33 billionTerm of Agreement: LOMAttr. Production: 25% Gold
Salobo (Brazil)
Date of Contract: 2/28/2013Current Owner: ValeUpfront Payment: $570 millionTerm of Agreement: 20 yearsAttr. Production: 70% GoldAdditional Consideration:10 million SLW warrants w/$65 strike & 10yr term
Sudbury (Canada)
2013 2014
Date of Contract: 11/11/2013Current Owner: Sandspring ResourcesUpfront Payment: $148.5 millionTerm of Agreement: LOMAttr. Production: 10% Gold Early Deposit: $13.5 million
Toroparu (Guyana)**
NON-IFRS MEASURES
43
Silver Wheaton has included, throughout this presentation, certain non-IFRS performance measures, including (i) average cash costs of silver and gold on a per ounce basis; (ii) operating cash f low s per share (basic and diluted) and; (iii) cash operating margin.
i. Average cash cost of silver and gold on a per ounce basis is calculated by dividing the cost of sales by the ounces sold. In the precious metals mining industry, this is a common performance measure but does not have any standardized meaning. The Company believes that, in addition to conventional measures prepared in accordance w ith IFRS, certain investors use this information to evaluate the Company’s performance and ability to generate cash f low .
ii. Cash operating margin is calculated by subtracting the average cash cost of silver and gold on a per ounce basis from the average realized selling price of silver and gold on a per ounce basis. The Company presents cash operating margin as it believes that certain investors use this information to evaluate the Company’s performance in comparison to other companies in the preciousmetals mining industry w ho present results on a similar basis.
iii. Operating cash f low per share (basic and diluted) is calculated by dividing cash generated by operating activities by the w eighted average number of shares outstanding (basic and diluted). The Company presents operating cash f low per share as it believes that certain investors use this information to evaluate the Company’s performance in comparison to other companies in the preciousmetals mining industry w ho present results on a similar basis.
These non-IFRS measures do not have any standardized meaning prescribed by IFRS, and other companies may calculate these measures differently. The presentation of these non-IFRS measures is intended to provide additional information and should not be considered in isolation or as a substitute for measures of performance prepared in accordance w ith IFRS. For more detailed information, please refer to pages 19 to 21 of Silver Wheaton’s Q2 2012 Management Discussion and Analysis available on the Company’s w ebsiteat w ww.silverwheaton.com and posted on SEDAR at w ww.sedar.com.