pre-water audit for the volta river basin, west africa · appendix 1a metadata for river flow...
TRANSCRIPT

Pre-water audit for the Volta River Basin,
West Africa (River bank restoration along White Volta in northern Ghana)
Bart J.M. Goes for the PAGEV Project and IUCN-BRAO Ouagadougou, Burkina Faso, July 2005
ii
Table of contents Figure ..................................................................................................................................................................... iii List of tables........................................................................................................................................................... iii List of appendices .................................................................................................................................................. iii Abbreviations......................................................................................................................................................... iv 1 Introduction..................................................................................................................................................... 1
1.1 The Volta River Basin............................................................................................................................. 1 1.2 The PAGEV Project................................................................................................................................ 3 1.3 Objectives and terms of reference........................................................................................................... 3 1.4 Outline of report...................................................................................................................................... 3
2 Surface water .................................................................................................................................................. 5 2.1 River flow ............................................................................................................................................... 5
2.1.1 River flow data................................................................................................................................ 5 2.1.2 Current river flow............................................................................................................................ 7 2.1.3 Predicted river flow......................................................................................................................... 9
2.2 Surface water uses................................................................................................................................... 9 2.2.1 Data on Surface water uses ............................................................................................................. 9 2.2.2 Analysis of surface water uses ...................................................................................................... 10
2.3 Surface water quality ............................................................................................................................ 15 2.3.1 Data on Surface water quality ....................................................................................................... 15 2.3.2 Surface water quality field survey................................................................................................. 16 2.3.3 Analysis of surface water quality .................................................................................................. 17
3 Groundwater ................................................................................................................................................. 18 3.1 Groundwater data.................................................................................................................................. 18 3.2 Analysis of the aquifer in the Volta Basin ............................................................................................ 18 3.3 Groundwater uses.................................................................................................................................. 18 3.4 Further analysis of groundwater data.................................................................................................... 19
4 Rainfall.......................................................................................................................................................... 20 4.1 Rainfall data .......................................................................................................................................... 20 4.2 Analysis of rainfall data ........................................................................................................................ 20
5 Water audit.................................................................................................................................................... 21 5.1 Introduction........................................................................................................................................... 21 5.2 Candidates for the water audit............................................................................................................... 21 5.3 Proposed TOR for the water audit ........................................................................................................ 23
5.3.1 Relevance of current activities in the basin................................................................................... 23 5.3.2 Relevant experiences and studies for the water audit.................................................................... 23 5.3.3 Exclusion from water audit ........................................................................................................... 23 5.3.4 Strategy for minimizing delays during water audit ....................................................................... 23 5.3.5 Water audit components................................................................................................................ 24
5.4 Estimated time to carry out the water audit........................................................................................... 26 5.5 Surface water quality study................................................................................................................... 26
6 Summary, conclusions and recommendations .............................................................................................. 28 6.1 Summary ............................................................................................................................................... 28 6.2 Conclusions........................................................................................................................................... 28 6.3 Recommendations ................................................................................................................................. 29
6.3.1 Technical recommendations.......................................................................................................... 29 6.3.2 Collaboration and networking related recommendations.............................................................. 30
Acknowledgements............................................................................................................................................... 31 Reviewed literature ............................................................................................................................................... 32

iii
Figure Figure 1 GIS map of the Volta River Basin (see Appendix 1c for river flow stations)..................................... 2 List of tables Table 1 Overview of the annual surface water resources in the Volta River Basin ........................................ 7 Table 2 Overview of the major surface water uses in the White Volta sub-basin. ....................................... 10 Table 3 Overview of the major surface water uses in the Black Volta sub-basin......................................... 11 Table 4 Overview of the major surface water uses in the Oti sub-basin. ...................................................... 11 Table 5 Overview of the major surface water uses in Lower Volta sub-basin.............................................. 12 Table 6 Overview of possible expansions of currents water uses and possible new future water uses ......... 14 Table 7 Water quality parameters tested for this assignment........................................................................ 16 Table 8 Summary of groundwater production for rural and urban water supply (excluding irrigation) in the
Volta Basin in Ghana and Burkina Faso ........................................................................................... 19 Table 9 Estimated time required to carry out the Water Audit (working days) ............................................ 26 List of appendices Appendix 1a Metadata for river flow stations in Burkina Faso (Kam, 2002). Appendix 1b Metadata for river flow stations in Ghana (HSD) Appendix 1c Metadata for river flow stations obtained from GRDC Appendix 2 Results of field water quality tests Appendix 3 Itinerary

iv
Abbreviations
AGRYMET a specialized institute of the Permanent Interstate Committee for Drought Control in the Sahel (CILSS), it includes Burkina Faso and not Ghana (Niamey, Niger)
CERSGIS Centre for Remote Sensing and Geographical Information Services, University of Ghana, Legon
CIDA Canadian International Development Agency CSIR Council for Scientific and Industrial Research (Accra, same as WRI) CGIAR Consultative Group on International Agricultural Research (Washington) CWSA Community Water and Sanitation Agency responsible for rural water supply (Accra,
represented in the Board of WRC) DGIRH Directorate General for the Inventory of Hydraulic Resources (Burkina Faso, part of
MAHR, key institutional beneficiary and partner of the PAGEV Project) DRAHRH-HB Direction Régionale de l’Agriculture, de l’Hydraulique et des Ressources Halieutiques de
Hauts-Bassin (Bobo Dioulasso, hydrological data collected by this governmental organisation is sent to DGRIH)
DSS Decision Support System EC Electrical Conductivity of water EIER L’Ecole Inter-Etats d’Ingénieurs de l’Equipment Rural (Burkina Faso) FFEM Le Fonds Français pour l’Environment Mondial (France) GCM Global Climate Model GeEau a project focussed on irrigation in the upstream part of the Black Volta, bassin du Kou
(Bobo Dioulasso, funded by Belgium) GEF-Volta Global Environmental Facility Volta Project (part of UNEP) GIS Geographical Information System GLOWA-Volta Global Change and the Water Cycle Project for the Volta Basin (funded by the German
Ministry of Research and Education and lead by ZEF) GWCL Ghana Water Company Limited, responsible for domestic and industrial water supply
(Accra, represented in the Board of WRC) GWP-WAWP West African Water Partnership of the Global Water Partnership GRDC Global Runoff Data Centre (Koblenz, Germany) HSD Hydrological Services Division, Ministry of Works and Housing (Accra, represented in
the Board of WRC) IDA Irrigation Development Authority responsible for agriculture (Accra, represented in the
Board of WRC) IRD Institut de Recherche pour le Dévelopment (Ouagadougou & Montpellier, France) IUCN-BRAO The West Africa Office of the World Conservation Union (Ouagadougou) IWMI International Water Management Institute (Accra) MAHRH Ministère de l’Agriculture, de l’Hydraulique et des Ressources Halieutiques
(Ouagadougou) MMCE Ministère des Mines, des Carrières et de l’Energie (Ouagadougou) MOB Maîtrise d’Ouvrage de Bagré, responsible for the management of the Bagré Dam
(Ouagadougou) MSD Meteorological Services Department (Accra, represented in the Board of WRC) OCP Onchocercosis (river blindness) Control Project (Ghana), a former project ran by the
WHO ONEA Office National de l’Eau et de l’Assainissement, responsible for providing water to urban
centres in Burkina Faso (Ouagadougou) PAGEN Projet de Partenariat l’Amélioration de la Gestion des Ecosystèmes Naturels (Burkina
Faso) PAGEV Volta Water Governance Project (Ouagadougou, IUCN-BRAO and GWP-WAWP are the
project facilitators) RESO Programme Ressources en Eau du Sud-Ouest SONABEL Société Nationale d’électricité du Burkina, responsible for electrical power production in
Burkina Faso (Ouagadougou) TOR Terms Of References UNEP United Nations Environmental Programme Volta-HYCOS Hydrological Cycle Observing System in the Volta a project launched by the WMO at
EIER

v
VRA Volta River Authority responsible for electrical power production in Ghana (Accra, represented in the Board of WRC)
VREO Programme de Valorisation des Ressources en Eau de l’Ouest, an EU sponsored project that focuses on the water management in the Burkinabe part of the Black Volta sub-basin
WEAP Water Evaluation And Planning, water management software developed by the Stockholm Environment Institute
WHYCOS World Hydrological Cycle Observing System a project launched by the WMO WHO World Health Organization WMO World Meteorological Organisation WRC Water Resources Commission, an umbrella institution for national water policy in Ghana
(Accra, key institutional beneficiary and partner of the PAGEV Project) WRCU Water Research Coordination Unit of ECOWAS, set up in 2004 to coordinate water
management related initiatives in West Africa (Ouagadougou) WRI Water Research Institute (Accra, represented in the Board of WRC) ZEF Centre for Development Research (Bonn, Germany)

1
1 Introduction 1.1 The Volta River Basin The Volta River Basin in West Africa has a surface of approximately 400,000 km2 and covers five countries, namely, Burkina Faso, Ghana, Togo, Côte d’Ivoire, Benin and Mali. The largest part of the basin lies in Burkina Faso and Ghana. The basin is divided into four sub-basins: the Black Volta, the White Volta, the Oti and the Lower Volta. The sub-basins and hydropower plants (Figure 1), as well as river flow stations (Appendix 1) are shown on a GIS map prepared by the Consultant for this report. The climate in the Volta Basin ranges from arid in the far north of Burkina Faso (mean precipitation <500 mm/y), semi-arid in the middle part of Burkina Faso (~700 mm/y) to sub-humid in southern Ghana (~1600 mm/y). There has been increasing pressure on the surface water resources of the basin during the past two decades. There are two principal factors responsible for this - the first is an increase in water uses. In 1964 the closure of the Akosombo Dam in southern Ghana (hydropower plant 6, Figure 1) created one of the largest man-made lakes in the world, the Volta Lake. The dam was built to generate hydropower. In order to increase the hydropower production, a second dam (the Kpong Dam, hydropower plant 5), was completed in 1982 just downstream of the Akosombo Dam. Still, plans exist to build more hydropower dams in Ghana; for example at Bui and Pwalagu (proposed hydropower plants 1 and 4). Similarly, Burkina Faso constructed two smaller (<2% of the capacity behind Akosombo Dam) hydropower/irrigation dams on the upstream part of the basin in the late 1980s and 1990s (hydropower plants 2 and 3). Furthermore, Giesen, et al. (2002) stated that the number of small dams constructed in northern Ghana and especially in Burkina Faso for irrigation, cattle and domestic uses has been rising since the 1980s. In 1998, the water level in Volta Lake fell below the operating level of the power plants resulting in severe power shortages (IUCN-BRAO, 2004). There are therefore some concerns in Ghana that increased water uses upstream of Lake Volta would threaten the operation of hydropower plants downstream of the lake. The second factor leading to an increasing pressure on water resources is a decrease in annual rainfall, especially in the 1970s and 1980s, which caused a reduction in river flow in the middle and lower part of the basin (e.g. Gyau-Boakye and Tumbulto, 2000). A decrease in and a less reliable timing of annual rainfall make rain-fed agriculture much more difficult (especially in the northern semi-arid part of the basin), thus, the demand for new small agricultural reservoirs increases. Other hydrological issues of concern in the Volta River Basin (IUCN-BRAO, 2004) are: • A suspected degradation of river water quality. • An increase in the growth of aquatic weeds, especially in the lower reaches of the basin. • Floods in the northern part of Ghana are sometimes related to alleged water releases from dams in Burkina
Faso. The floods resulted in the loss of human lives in 1994/5. Presently, flood releases from the larger dam in Burkina Faso (Bagré) only affects farmland because there is a warning system in place between Burkina Faso and Ghana on flood releases.

2
Figure 1 GIS map of the Volta River Basin (see Appendix 1c for river flow stations).

3
1.2 The PAGEV Project The Project for Improving Water Governance in the Volta River Basin (French acronym “PAGEV”) is a joint initiative of the IUCN-GWP/WAWP (The World Conservation Union and the West African Water Partnership of the Global Water Partnership) that supports Burkina Faso and Ghana in their joint management of trans-boundary water resources (see IUCN-BRAO, 2004 for a complete outline of the project). The project has a time-span of 3 years (mid 2004 to mid 2007). The key governmental institutions in Ghana and Burkina Faso are, respectively, the WRC (Water Resources Commission) of Ghana and the DGIRH (Department of Water Resources Assessment) of Burkina Faso. A major component of the PAGEV Project is the building of a Decision-Support Knowledge Base. The key objectives of this component are to: • join together and share scientific knowledge available on the statute and the dynamics of the quantity and
the quality of water in the Volta Rivers Systems; • develop water management options on the basis of scenarios on water availability and water demand in the
Volta Basin. 1.3 Objectives and terms of reference A Water Audit is an assessment of current, and anticipated water availability and demand. This report is a pre-water audit that is defined as the preparation for the water audit by determining the available and missing data for the work and a proposed step-by-step work plan on how the water audit can be executed. The PAGEV Project gave an assignment with the objective to: conduct a pre-water audit study of the Volta River Basin, as a basis for defining the scope of a water audit of the basin, and in assessing the impacts of existing and planned water developments, climate variability, and also to fill identified information gaps. In practical terms, this exercise (pre-water audit) will provide a format for compiling and improving on existing information on water availability, quality and demand, with emphasis on water resources in the basin that are shared by Ghana and Burkina Faso. The itinerary can be found in Appendix 3. The scope of this study is modest in terms of time (10 working days) and budget, and will rely substantially on existing sources of data, articles and discussions with experts working in the basin. The focus is on surface water and activities for the assignment consist of:
1. Carrying out a first order inventory of the available surface water resources data (quantity and quality) and collection networks at the sub-basins of the Volta River from available literature.
2. Compiling (from accessible reports and published papers) the hydrological information on prevailing water availability and demand with respect to the sub-basins.
3. Visiting the basin and assessing the status of the hydrometric network in the basin as a whole and more specifically in the portion of the basin shared by Burkina Faso and Ghana.
4. Assessing the adequacy of the existing data and data collection network for carrying out a water audit, and to develop water management scenarios to cope with trends in water demand and availability, and water resources planning in general.
5. Conducting interviews with appropriate key persons and institutions in Burkina-Faso and Ghana, including the water resources and environmental agencies in order to identify research institutions, consulting firms and experts, especially in Ghana and Burkina Faso or in the West Africa sub-region that could be considered to carry out the water audit.
6. Preparing the scope of the water audit and the TOR for consultancy to conduct the water audit. 7. Proposing an estimate of the cost to carry out the water audit 8. If necessary advise on requirements in terms of additional investments aimed at improving the quality
of hydrometric data, and harmonising the data collection systems in riparian countries.
1.4 Outline of report Chapter 2 presents information on the water availability; the current and predicted river flows. The hydrological characteristics of the rivers in the basin and the hydrometric network are also discussed. Chapter 2 continues with the demand side of the water audit; the present and potential future water uses. The final section of the chapter is on surface water quality. Chapters 3 and 4 provide a short overview on groundwater and rainfall in the Volta Basin. Chapter 5 proposes a work method for the water audit. Furthermore, consultants who may be considered to participate in the water audit are presented. The last section of chapter 5 proposes a work method for a surface water quality study in the basin. Chapter 6 comprises the conclusions and recommendations. A data

4
cd is also submitted with this report. The cd includes: the GIS map that was prepared for this assignment (Figure 1), reports and papers that were obtained in a digital format, all the digital information from the GLOWA Volta Project, river flow data from the GRDC and meta-data files on river flow, rainfall and evaporation.

5
2 Surface water 2.1 River flow 2.1.1 River flow data An overview of the river flow stations in the Volta basin and information on the availability of data are presented in Appendix 1. Whilst Figure 1 is a map indicating the river flow stations. In the basin, the responsibility for monitoring river flow lies with a number of governmental organisations. However, a number of research institutions have also monitored (or plan to monitor) river flows while others have a database for river flows. Furthermore, it is also worth mentioning that the GLOWA-Volta Project has a GIS map on the rivers and its tributaries (on enclosed cd). The following governmental organisations have responsibility for monitoring river flow in the basin: • The Directorate General for the Inventory of Hydraulic Resources or National Hydrological Services of
Burkina Faso (DGIRH) collected in 2004 daily river flow data for 43 river flow stations (MAHRH, 2004). The river flow data is available in a digital database (HYDROM 3.2, works under DOS). For this report we received a metadata file on available data in the HYDROM database (on enclosed cd). Unfortunately not all the older (<1995) river flow data is captured in the HYDROM database (e.g. for Wayen). This was also observed by Kam (2002). The metadata table (Appendix 1a) on river flow stations in Burkina Faso is therefore based on Kam (2002). The HYDROM data can be exported into ASCI format and are therefore easily accessible for use in Excel. The data can be bought for fixed rates (e.g. 1 year of monthly data costs ~500 CFA). There is no agreement between DGRIH and WRC or HSD (Ghana) to share the data but DGIRH is very open to do so (probably at some costs). The data can also be me made available to PAGEV for the Water Audit (free of charge because DGIRH is a partner of the project).
• Hydrological Services Division (HSD) that is part of the Ministry of Works and Housing. This division collects daily river flow data for ~60 stations (see Appendix 1b). All the river flow data are digital. A quality control check of the data is ongoing. About 60% of the data has been checked; it may be difficult to obtain the other 40% of the data that has not yet undergone the quality check. The WRC has obtained part of the White Volta River flow data from HSD. The metadata are available in Access and the river flow data itself is stored in a digital database (HYDATA 4.2, 2001). The data can be exported into ASCI format. Generally one has to pay for the data, the rates are not yet exactly fixed. The HSD also said that they currently do not share their data with DGIRH but expressed their interest in doing so (probably at some costs).
• SONABEL (Société Nationale d’électricité du Burkina) registers for Bagré and Kompienga reservoirs: the inflow, the outflow, the evaporation and the inflow into the Bagré irrigation project. Since the construction of the dams the monthly data have been published in their annual reports. The data can easily be obtained from SONABEL (for this assignment data was obtained for 2003 and 2004, on enclosed cd).
• SONABEL has a satellite (Immarsat-C) warning system in place at five sites along rivers in the White Volta sub-basin upstream of Bagré Reservoir (Wayen, Komtoega, Sanogo, Niaggo, Kaïbo Sud). The system transmits an automatic warning to the operators of Bagré Dam when the water level exceeds a threshold that may lead to flood flows. The system is very expensive and therefore not used for regular water level monitoring.
• The Volta River Authority (VRA, Ghana) has information on the water releases from the Akosombo Dam.
Research institutions and projects that have monitored (or plan to monitor) river flow in the basin are: • The Onchocercosis Control Project (OCP, Ghana) ran by the WHO, collected a lot of river flow data in
Ghana from 1975 to 1995 (Giesen et al, 2001). The OPC river flow data are included in the database of the HSD (HSD).
• The Volta-HYCOS project (WMO) plans to collect near real time hydrological (such as river flow) information in the Volta Basin. The project will be executed by the EIER (L’Ecole Inter-Etats d’Ingénieurs de l’Equipment Rural) and the IRD in Burkina Faso (contacts: Michel Gautier, [email protected] and Emmanuel Patruel). Test measurements are currently being executed and the first stations are expected to be (re)installed in 2005. The sites for river flow monitoring are not yet

6
known. According to ZEF (2002) the total number of Volta-HYCOS hydrometric station sites in the whole basin will be 25.
Research institutions that have a database on river flow data are: • The Global Runoff Data Centre (GRDC) has monthly and sometimes daily river flow data for 52 stations
in the Volta basin. For most stations, the period for which the data is available does not extend beyond the 1980s. A summary of the GRDC data is presented in Appendix 1c. The complete dataset is available on the enclosed cd (please follow the GRDC the users conditions that are enclosed on the cd).
• AGRYMET (Niamey, Niger) has a regional hydrological database for West Africa. The database stores river flow data for 522 stations. It is not clear whether or not they also have river flow data on the Volta basin (I enquired by email but they did not respond).
• L’institut de Recherche pour le Dévelopment (IRD) has a database on daily river flow data for Burkina Faso. The content of their database is not exactly known but it contains at least daily river flow data (1965-1998) for Wayen on the White Volta (station 27, Figure 1) for the period 1965 to 1998 (Mahe et al., 2005). A lot of the older IRD river flow data and rating curves for many stations in the whole basin can be found in Ostrom (1977, book in IUCN-BRAO library).
2.1.2 Observations on the river flow data and the hydrometric network The following observations are made on the river flow stations and their data in the basin: • There is an enormous amount of river flow stations in the basin (over 200) but quite a number of stations:
are no longer functioning, are situated on relatively small tributaries, only have water level data (no reliable rating curves), only have data for a couple of years or have large data gaps. This a forest in which one can easily be lost. For the water audit it is therefore recommended to focus on a limited number of key river flow stations (20 to 30) in the basin.
• At this moment most directly accessible river flow data is in monthly form (GRDC, Ostrom, 1977). • The DGIRH has spent quite some effort and time on reorganising, including the revision of rating curves,
their hydrological database (Kam, 2002). The metadata for Burkina Faso (Appendix 1a), which is taken from this report, is very elaborate (including coordinates, years for which data are available, etc.). The available information in the metadata file for Ghana (Appendix 1c) is limited.
• The hydrometric network in Burkina Faso has two main weaknesses (MAHRH, 2004): 1) a number of stations only have only water-level data since no reliable rating curves are available; 2) an increasing number of stations are menaced by modifications in the river (e.g. reservoirs) that disturb the measurements.
• Up-to-date time series of discharge will not be available for any, or only few, stations in the Ghanaian part of the White Volta. However water level data have been collected. The process of making new discharge measurements, constructing rating curves and calculating the discharge is ongoing (NIRAS, 2004).
• During a field trip 14 hydrometric stations in the White Volta sub-basin in Ghana were visited. It was concluded that many of the stations suffer frequent visits, proper maintenance and timely repair. For example most automatic water level recorders were not functioning during the visit (NIRAS, 2004).
• It is encouraging that most river flow stations with automatic water level recorders, that malfunction regularly, have a backup in the form of a stageboard reader. Still, it is recommended that the relevant organisations spend more effort on enhancing the commitment of the readers to the work by, for example, paying the readers in time, providing them a bicycle if they live far from the stageboard and letting them have annual results of their work (river flow graph for the site).
• Recently there are lots of donor-supported activities (FFEM through Volta-Hycos in the whole basin, DANIDA in Ghana, the French through IRD in Burkina Faso) going on in Burkina Faso and Ghana to reinstate the hydrometric network. So the Pre-Water Audit recommends not to do field measurements on river flow, but to rely on the existing river flow databases.
• In order to make the best use of the limited resources for the maintenance of the hydrometric network it is recommended that key river flow stations in the basin (at the most 20) that need to be monitored be identified for getting a good overview of the available surface water resources in the basin. This can be done by comparing river flow data from various stations along the same river. For example if there is a strong relation between an up- and downstream station than, in the case of limited resources, the flow measurements at one of the stations can be temporarily halted. This process is called optimisation of the hydrometric network. Optimisation of the network does not imply that measurements at ‘second class’ stations should be stopped completely because river flow relations can change in time due to, for example, land use change or the construction of a dam. Burkina Faso already proposed priority river flow

7
stations in their part of the Volta Basin (MAHRH, 2004; Tables 4 and 5). For the White Volta in Ghana also a list of priority stations has been prepared (NIRAS, 2004).
• River flow data sharing is not taking place between Burkina Faso (DGIRH) and Ghana (HSD). The databases from both institutions can export the data into ASCI format, which can be manipulated within Ms-Excel into any desired format. Furthermore, the interviewed people from both organisations showed a positive attitude towards data sharing (negotiations are required on the finances). So there are good opportunities for the PAGEV Project to assume the role of facilitator for data sharing.
2.1.2 Current river flow 2.1.2.1 Basin Characteristics An overview of surface water resources in the basin is presented in Table 1. The table is based on the river flow data that was obtained from the GRDC (Appendix 1c). The table shows that there are strongly varying annual runoffs (water availability) in the Volta Basin. The runoff is on average (1936-96) 9% of the annual rainfall (Andreini et al., 2002). The discharge in the Volta Basin upstream of Lake Volta has distinct wet (mid-May to early November) and dry (mid-November to early May) seasons. The mean historical (1937-63, prior to the closure of Akosombo Dam) water availability at Senchi, just before the Volta River flows into the Atlantic Ocean, was ~40 109 m3/y.
Table 1 Overview of the annual surface water resources in the Volta River Basin Sub-basin River flow
station No.# Catchm.
area** Period No.
years Mean annual flow
Stand. dev.
Minimum discharge (year)
Maximum discharge (year)
Period of predominant flow
103km2 [106 m3] [mm]
[106 m3] [106 m3] [106 m3]
Black Volta Nwokuy (BF) 6 15 1957-88 31 814 55 358 157 (1984) 1,616 (1970) perennial: peak Boromo (BF) 10 48 1956-90 32 1,036 22 413 145 (1984) 1,727 (1958) Sept/Oct Dapola (BF) 15 67 1952-90 36 3,133 47 1,375 854 (1984) 6,307 (1952) Bamboi (Gh) 19 134 1951-73 23 8,402 63 3,686 3,361 (1972) 16,853 (1963)
Red Volta Nangodi (Gh) 33 12 1958-73 16 727 63 320 205 (1972) 1,348 (1964) ephemeral: June to Oct. White Volta Wayen (BF) 27 21 1955-87 24 230 11 151 66 (1966) 602 (1974) Bagré (BF) 31 33 1974-90 13 995 30 573 279 (1984) 2,087 (1974) Pwalagu (Gh) 34 63 1951-73 23 3,948 62 1,472 1,495 (1972) 6,481 (1957) ephemeral: May to Nov. Nawuni (Gh) 38 93 1954-73 20 7,694 83 2,269 2,200 (1972) 11,881 (1963) perennial: peak Sept.
Oti Tagou/Kom- pienga (BF)
39 6 1980-87 8 290 51 131 108 (1984) 523 (1985) ephemeral: Jun.-Sept.
Mango (Tg) 45 36 1954-73 19 4,330 121 1,805 1,790 (1953) 7,776 (1956) ephemeral: Jun. -Dec. Sabari (Gh) 49 59 1960-73 14 11,247 192 4,229 5,934 (1972) 18,115 (1963) perennial: peak Sept.
Lower Volta Senchi (Gh) 52 394 1937-63* 24 40,010 102 18,965 11,308 (1958) 94,453 (1963) perennial: peak Oct. * period prior to closure of Akosombo Dam # locations of river flow stations on Figure 1 ** average at Boromo from GRDC (37 103km2) and Shanin, 2002 (58 103km2) based on river flow data from GRDC The four sub-basins (Figure 1) are discussed below. The White Volta or the Nakambé River. The White Volta sub-basin contributes about 23% of the annual flow into Volta Lake (Andreini et al., 2000). The landscape in the largest part of the White Volta is relatively flat with some gently sloping hills (<100 m) in the upstream part and a very broad floodplain area surrounded by hills (up to 500 m) in the downstream part of the sub-basin. In the upstream part the river only carries water in the wet season (July to mid-October). Downstream of Bagré the river flow is influenced by releases from the Bagré Dam in Burkina Faso (hydropower plant 2, Figure 1). The Black Volta or the Mouhoun River. The Black Volta sub-basin contributes about 23% of the annual flow into Volta Lake (Andreini et al., 2000; Shanin, 2002). The Black Volta is the only sub-basin that does not have large dams and hardly any small dams. The river carries water all year round. In the slightly hilly upstream part of the Black Volta, near Bobo Dioulassou (Burkina Faso, Figure 1), the river flows roughly north, opposite to the general flow direction in the basin. The river makes a 180° turn where it meets the Sourou River situated in a

8
north-south depression. This depression routes the flood wave of the river and retains much of its sediment (Shanin, 2002). The low runoff at Boromo (22 mm, station 10, Figure 1) compared to the upstream station (Nwokuy, 55 mm) can be attributed to the flood routing in the depression and the low slope of the area (Shanin, 2002). On the border between Ghana and Ivory Coast the river flows from north to south through a valley that is surrounded by hills (up to 500 m high). At Bui in Ghana, the Black Volta passes through a gorge. A dam (the Bui Dam) construction has started at this site and has reached an advanced development stage (planned power plant 1, Figure 1) but the construction is currently stalled (IUCN-BRAO, 2004). The Oti. The Oti sub-basin (though only about 18% of the total basin), contributes between 35 and 40% of the annual flow into Volta Lake (Gyau-Boakye and Tumbulto, 2000; Andreini et al., 2000). This is because the catchment of the Oti River is the most hilly and mountainous (>900 m) in the whole Volta Basin. The Oti River carries water all year round as a result of regular releases from the Kompienga Dam in Burkina Faso (hydro power plant 3, Figure 1). The Lower Volta. The Lower Volta consists of the smaller tributaries to Lake Volta and the Volta River downstream of the lake. The smaller tributaries contribute about 17% of the annual flow into Volta Lake (Andreini et al., 2000). Some of the hills surrounding the lake, from which the tributaries originate, are over 800 m high. The Volta River passes through a narrow gorge roughly 100 km before it flows into the Atlantic Ocean. The Akosombo Dam was constructed on this site in 1964. The dam reduced the seasonal and inter-annual variation in discharge at the downstream end of the Volta River (Senchi, station no. 52). And it reduced the sediment load. 2.1.2.2 Influences on river flow Three important factors influence river flow in the basin, namely rainfall, change in landuse and water uses. Rainfall. Water balance studies for the Volta Basin as a whole indicate a non-linear response of annual river flow to rainfall. The non-linear response indicates that until the mean annual rainfall reaches a threshold (~343 mm) most rainwater wets the soil and recharges the groundwater. After this threshold has been reached, more than half of the rainwater becomes river flow (Andreini, 2000; Giesen et al. 2001; Friesen et al. 2005). The non-linear relationship also means that the river flow is very sensitive to climatic variations. Between 1950-70 and 1971-90, for instance, due to a decrease in rainfall, the mean annual runoff in the White Volta and the Oti decreased by 23.1% and 32.5%, respectively (Gyau-Boakye and Tumblutu, 2000). Change in Landuse. Between 1955/65-70 and 1972-98, in the upstream part of the White Volta in Burkina Faso (Nakambé River) at Wayen (station 27), the mean river flow increased by 108% despite a reduction in rainfall and an increase in the number of dams. The increase was the highest during the first part of the rainy seasons (July and August). The increase was due to a reduction in the Water Holding Capacity of the soil as a result of changes in land use. The changes in land use were: increase in cultivated area, increase in area with bare soil and a decrease in area with natural vegetation (Mahe et al., 2003 and 2005a). An amplified runoff despite a reduction in rainfall can only be found in the Sahelian part of West Africa north of the 700 mm annual precipitation line. South of the 700 mm isohyet the river flow variations follow the rainfall (Mahe et al., 2003 and 2005b). Outside the Volta Basin, in neighbouring Niger, a similar change in land use is linked to a long-term rise in the groundwater table due to an increase in groundwater recharge (Leduc et al., 2001). Water uses. It is expected that an increase in the number of dams and storage of surface water would lead to an increase in evaporation and a decrease in river flow. But, between the periods 1966-80 and 1981-95 for the mean river flow at a basin wide level no change in hydrological behaviour (excluding rainfall variations) was found. This is partially explained by the fact that the change in landuse and increased surface water uses are human impacts with contrary effects on the river flow (Friesen et al, 2005). Two issues that are worth investigating are: • How the discharge in the upstream part of the Black Volta River (north of ~700 mm isohyet) responded to
changes in land use. • How the floods in northern Ghana (IUCN-BRAO, 2004) are related to unanticipated high inflows in the
reservoir of the upstream Bagré Dam in Burkina Faso (hydropower station 2, Figure 1) as a result of land use changes in the upstream part of the White Volta (Nakambé River)

9
2.1.3 Predicted river flow Kunstmann and Jung (2005) investigated the impact of downscaled global climate scenarios on the water resources in the Volta Basin. The principal climate scenario in the paper assumes an annual increase of 1% in atmospheric CO2-content commencing in 1990. The predicted impact of this scenario is an increase of 5%, in annual precipitation but also a significant decrease of precipitation at the transition from the dry to the rainy season. Consequently, there will be a reduction in the duration of the rainy season and a predicted increase in mean annual surface runoff of 18%. Such a high increase after a slight increase in rainfall is related to the described (Section 2.1.2.2) non-linear response of the river flow to variations in rainfall. In addition, an increase in temperature is predicted, especially in the northern part of the basin. An increase in temperature would lead to an increase in evaporation from reservoirs. Also, Andah et al. (2003) predicted the impact of four different down scaled global climate change scenarios on river flow. For all the used climate scenarios, average yearly inflow into Volta Lake is predicted to increase (ranging from 13 to 34%). Variability in river flow is predicted to increase as well. According to the report, the predicted increase in runoff more than compensates for the extra water used by the irrigation development. The report concludes that it is not wise to rely entirely on hydropower because there will still be regular periods during which the water level in the reservoir would be too low to generate hydropower. It is suggested that the above predictions not be taken at face value; as an earlier calculation (Opoku-Ankomah, 2000 quoted in GEF 2002) predicts a 16% and 37% reduction in runoff in the White Volta River (on the basis of a Global Climate Model - GCM) by 2020 and 2050 respectively. The GLOWA Volta Project (Phase 2, Sub-project A1) is trying to provide estimates on how precipitation behaviour will change in the Volta Basin due to global climate change and regional land use. There is also a plan to predict the effect of this possible change on surface and groundwater balance (ZEF, 2002). The EIER is currently working on the impact of climate change on the river flow in the White Volta in Burkina Faso (contacts: Hamma Yacouba and Harouna Karambiri). 2.2 Surface water uses 2.2.1 Data on Surface water uses The following governmental organisations have responsibility for estimating surface water uses: • The WRC for Ghana (VRA for hydropower, IDA for irrigation, GWCL for urban water supply and
industrial uses, CWSA for rural water supply). • Ministry of Agriculture in Burkina Faso for irrigation. • Maîtrise d’Ouvrage de Bagré (MOB) for agricultural water uses by the Bagré Dam in Burkina Faso. • Société Nationale d’électricité du Burkina (SONABEL) for hydropower uses in Burkina Faso. • Office National de l’Eau et de l’Assainissement (ONEA) for industrial and domestic water uses in
Burkina Faso. • Ministry of Agriculture in Ghana and le Ministère d’Elevage in Burkina Faso have data on livestock
populations. • DGIRH has information on the surface area of all the major reservoirs in Burkina Faso.
The following research institutions and projects have a database on surface water use: • GLOWA-Volta Project (Liebe, 2002) localised reservoirs in northern Ghana and southern Burkina Faso.
The project has also information on the surface of the reservoirs. • The EIER has an inventory of small dams with their characteristics (volume, level and sometimes flow
and abstractions) in Burkina Faso. The data can be made available for the Water Audit (there is a link between EIER and the GLOWA-Volta Project through Bruno Barbier based at EIER). This is probably the same database as at DGIRH.
• The GEF (2002) report (pages 41-42) present tables on present and future water demands in the basin, per riparian country and water use sector,
• L’institut de Recherche pour le Dévelopment (IRD) has calculated evapotranspiration for a large part of Burkina Faso for the period 1950-97 for a grid 0.5° x 0.5° (Ouedraogo et al., 2001). These data are useful for estimating evaporation from reservoirs in the region.
• The Volta Challenge Project may contribute by providing estimates on water uses per crop type in the basin.

10
2.2.2 Analysis of surface water uses 2.2.2.1 Current surface water uses Table 2, Table 3, Table 4 and Table 5 present an overview of all the major surface water uses in the White Volta, Black Volta, Oti and Lower Volta, respectively. The most prominent anthropogenic water uses in the Volta Basin are: water uses by small-scale reservoirs in the upstream part of the basin and hydropower in the downstream part of the basin.
Table 2 Overview of the major surface water uses in the White Volta sub-basin.
Sites Country Type of use* References with information on quantities
small dams and reservoirs BF, GH agriculture, cattle, domestic Vescovi et. al. (2002); Giesen at al. (2002); Mahe et al. (2005); GLOWA-Volta, IRD
Goinré Reservoir BF urban water supply to Ouahigouya, 0.07 106 m3/y (2002)
ONEA
Ouagadougou reservoirs 1,2 & 3 (tributary to White Volta)
BF urban water supply (Ouagadougou), 5.2 106 m3/y (2004)
ONEA
Ziga dam BF urban water supply (Ouagadougou), completed in November 2004, surface 72 km2
ONEA
Loumbila dam (Massilli River, a tributary)
BF urban water supply (Ouagadougou), 13.9 106 m3/y (2004)
ONEA
Itengué Reservoir (tributary to White Volta)
BF urban water supply (Koupela & Pouytenga), 0.59 106 m3/y (2004)
ONEA
Bagré dam BF hydropower: 16 MW, surface 255 km2; irrigation: 600 ha (1999) and expanding to 2,100 ha (June 2006, mainly rice)
Berger et al. (2001); MOB (irrigation); SONABEL & DANIDA (2001) (hydropower)
Vea dam (tributary to White Volta)
GH irrigation 1000 ha; urban water supply **; regular water shortage (CSIR, 2000)
IDA
Tono dam (tributary to White Volta)
GH irrigation 2,500 ha; regular water shortage (CSIR, 2000)
IDA
Tiogo Yarugu GH irrigation, 138 ha, 2.4 106 m3/y IDA Dinga (Diare) GH irrigation, 115 ha, 1.5 106 m3/y IDA Sogo GH irrigation, 151 ha, 1.5 106 m3/y IDA Dipali GH irrigation, 148 ha, 1.5 106 m3/y IDA Yapei GH irrigation, 194 ha, 1.8 106 m3/y IDA Yendi dam (Daka River, a tributary)
GH abstraction for urban water supply, 0.40 (WRC) to 0.95 (GWCL) 106 m3/y; no water in dry-season (CSIR, 2000)
GWCL, WRC
Saboba dam GH small urban water supply abstraction GWCL Bolgatanga dam (Yaregantanga River, a tributary)
GH abstraction for urban water supply, 1.8 to 2.7 106 m3/y and irrigation 450 ha (rice and vegetables)
GWCL, WRC, IDA
Tamala dam GH abstraction for urban water supply 7.1 106 m3/y GWCL, WRC * hydropower capacities based on the GLOWA-Volta data cd and GEF (2002) ** there is an agreement that the water intake for irrigation stops when the water level drops below a
threshold level (IDA)

11
Table 3 Overview of the major surface water uses in the Black Volta sub-basin.
Sites Country Type of use* References with information on quantities
small dams and reservoirs (much less than in White Volta)
Mali, BF, CI, GH
agriculture, cattle, domestic Vescovi et. al. (2002); Giesen at al. (2002); GLOWA-Volta, IRD
Bobo Dioulasso (water taken from sources)
BF urban water supply to Bobo Dioulasso, ~0.8 106 m3/y (2004)
ONEA
Bobo Dioulasso area BF small scale irrigation (e.g. cotton) that uses surface water from rivers and sources (hardly any reservoirs), vallé du Kou: 1,260 ha (potential 2,300 ha)
GeEau, VREO
La Mare aux Hippopotames BF ecological, wetland of international importance (~19 km2)
PAGEN?
Sourou Dam BF irrigation, 5,000 ha (rice, maize, vegetables)
DGHA
Salbisbogo Reservoir BF urban water supply to Koudougou, ~0.5 106 m3/y (2004)
ONEA
Tiogo (Ténado, water taken direct from river)
BF urban water supply to Koudougou, ~0.8 106 m3/y (2004)
ONEA
Poura (water taken direct from river)
BF urban water supply to Poura, ~0.07 106 m3/y (2004)
ONEA
Bui National Park GH ecological Bagri GH irrigation, 100 ha IDA * ‘wetland of international importance’ from Wetlands International
Table 4 Overview of the major surface water uses in the Oti sub-basin.
Sites Country Type of use* References with information on quantities
small dams and reservoirs (much less than in White Volta)
BF, GH Togo, Benin
agriculture, cattle, domestic Vescovi et. al. (2002); Giesen at al. (2002); GLOWA-Volta, IRD
Kompienga dam BF hydropower: 14 MW; urban water supply to Kompienga 0.06 106 m3/y (2004)
SONABEL; ONEA; DANIDA (2001)
? (name unknown) Benin hydropower: 15 MW GEF (2002) Parc National de la Keran Togo ecological, wetland of international
importance (~163 km2)
* hydropower capacities based on the GLOWA-Volta data cd and GEF (2002) ‘wetland of international importance’ from Wetlands International

12
Table 5 Overview of the major surface water uses in Lower Volta sub-basin.
Sites Country Type of use* References with information on quantities
Hohoe (Dayi River) GH water abstraction for urban water supply, 0.8 106 m3/y
GWCL, WRC
Kpeve (Volta Lake) GH water abstraction for urban water supply, 3.3 106 m3/y
GWCL, WRC
Tsito (Wuve River) GH water abstraction for urban water supply, 0.08 106 m3/y
GWCL, WRC
Volta Lake GH net-evaporation 7.7 km3/y*, surface at full supply level: 8,500 km2
Andreini et al. (2000); Friesen et al. (2005); WRI, GLOWA-Volta, VRA
Akosombo dam GH hydropower: 912 MW Obeng-Asiedo (2004); VRA Kpong GH abstraction for urban water supply
(eastern Accra), 62 (GWCL) to 77.5 (WRC) 106 m3/y
GWCL, WRC
Kpong dam GH hydropower (160 MW), irrigation on right bank 4,000 ha, ~44 106 m3/y
Obeng-Asiedo (2004); IDA; VRA
Anum Boso GH water abstraction for urban water supply, 0.08 106 m3/y
GWCL, WRC
Bosuso (Yaya River) GH water abstraction for urban water supply, 0.08 106 m3/y
GWCL, WRC
Sege GH water abstraction for urban water supply, 0.58 106 m3/y
GWCL, WRC
Ada GH small urban water supply abstraction GWCL, WRC Anlo-Keta lagoon complex GH ecological, wetland of international
importance (~128 km2), RAMSAR site
Dorm-Adzobu et al. (2004)
* evapotranspiration from Lake - part of rainfall falling on Lake that would have returned to the atmosphere (Friesen et al. 2005) ‘wetland of international importance’ from Wetlands International
Hydropower generation requires a fairly full reservoir behind the dam. The creation of such large body of water results in water loss due to evapo(transpi)ration. By far, the largest hydropower dam in the basin (the Kpong dam below Lake Volta), is presently used at unsustainable rates. The pressure to produce more energy is so high that the Volta River Authority lets too much water through the dam in the hope that next year’s rains will replenish the reservoirs. When the rains are not so good for a single year, such as happened in 1997/98, there is no buffer and hydropower production comes to a halt (Andah, et al. 2003). Most irrigation that depends on reservoirs takes place in the White Volta sub-basin (Andah et al., 2003). The GLOWA-Volta Project (contacts: Marc Andreini, Jens Liebe, www.smallreservoirs.org) is doing a lot of work on estimating water uses by the small dams in northern Ghana and southern Burkina Faso. Using satellite images, they identified reservoirs and their surfaces in the area (Vescovi et. al. (2002). Based on an extensive field survey of 61reservoirs, a relation was established between the surface area of reservoirs and its depth and volume. Total evaporative losses from the reservoirs’ surfaces have also been estimated (Liebe, 2002). Water use from these reservoirs (mainly irrigation) has not yet been estimated. However, GLOWA Volta Project Phase 2 (sub-project W1) is working on this (ZEF 2002) and their interpretation of satellite images are being extended to the whole Volta Basin. It should be confirmed that the water use by livestock is clearly represented in the ongoing study on water abstractions from small reservoirs. Surface water uses by livestock is probably relatively small. Still, this should be quantified since it is seen as a very important water use by many people in the upstream part of the basin. DANIDA (2002) provides estimates for the water use per animal and the water use by livestock for Burkina Faso as a whole (ground- and surface water lumped together). The report also provides estimates for the water use per ha irrigated area for Burkina Faso. The water uses by the formal irrigation projects (evaporation from reservoirs and irrigation) are mostly not monitored in Ghana. Still, figures for the surface of the area under irrigation and the crop type are often available. These data, together with the surface area of the reservoirs and the evaporation rates, can be used to estimate the water uses by the larger irrigation projects. In the upstream part of the Black Volta (near Bobo Dioulasso) a lot of irrigation is taking place that depends on surface and groundwater. There are hardly any reservoirs in the area, which is partly related to the fact that the

13
Black Volta generally carries water throughout the year. The GeEau Project knows the size of the cultivated area in a small part of the Black Volta sub-basin (Kou). The VREO Project wants to assess the water uses in the Black Volta sub-basin that lies within Burkina Faso, but this phase of the project will only start in May 2006. The most prominent surface water abstractions for urban water supply are: Ouagadougou and the eastern part of Accra. The water supply of Ouagadougou depends on reservoirs at three sites: Ouagadougou (3 small reservoirs), Loumbilla and Ziga. Because of the recent construction of Ziga Reservoir (November 2004), the intake of surface water from the three small reservoirs in Ouagadougou for urban water supply will stop within the coming two or three years (ONEA). There are no significant direct surface water abstractions by industries in Ghana (GWCL) and Burkina Faso (ONEA). The most prominent ecological surface water uses are wetlands. The total surface area of wetlands in the basin is estimated at 20,000 km2 (Andah et al., 2003; the source for this estimate is not given in the report). The most important wetlands are listed in the tables above. Locations of ‘wetlands of international importance’ are shown in Figure 1. Ecological flow requirements for wetlands are generally defined in the form of hydrographs that are as close as possible to the natural situation before human interventions took place. The ecological flow requirements (seasonal floods) are almost always in conflict with the relatively constant releases from hydropower dams. Majority of the wetlands are in the upstream part of the Volta Basin and therefore not affected by the large hydropower dams downstream of Lake Volta (Akosombo and Kpong dams). However, in the Anlo-Keta lagoon complex (wetland 1, Figure 1) downstream of the two large dams the seasonal floods have become erratic due to hydropower releases from the dams. And, the length of the estuarine salt wedge has reduced from 30 to less than 5 km (Andah et al. 2003). Together with the decreased sediment load these factors created favourable circumstances for the growth of aquatic weeds (Grove, 1985; Andah et al., 2003). The VRA is taking measures (mainly dredging) to stimulate the return of the salt wedge (Kalitsi, 1999). What is notable from the reviewed literature is that river flow requirements for ecological uses are seldom mentioned. Even the existence of wetlands and Ramsar sites are easily overlooked in papers on the Volta Basin. No concrete figures have been found in the reviewed literature on required environmental river flows (quantity and timing) in the basin. There are also no available water balance studies for the wetlands. 2.2.2.2 Potential future water uses The potentially irrigable area in Ghana is enormous, over 1 million hectares (FAO 1997 quoted in Obeng-Asiedo, 2004). However, irrigation development in northern Ghana, although spoken of frequently, has thus far been given low priority. In Ghana, water is most often seen as a source of hydropower (Andreini, et al. 2002). Still, the Irrigation Development Authority (IDA) perceives hydropower dams as a benefit because they provide energy and a part of the required infrastructure for irrigation projects. Furthermore, the general opinion in Ghana (based on discussions with IDA, WRC and WRI) is that the expansion of large irrigation projects is rather limited by available funds, lack of infrastructure and the fact that some of the potential areas are thinly populated than by lack of political will. If the Ghanaian government decides to reduce the import of rice then the expansion of the number and size of large irrigation projects may come high on the political agenda. So the planned expansions of existing and new irrigation projects in Ghana should be included in the development of scenarios for the water audit (Table 6). The need for the development of large-scale irrigation projects in southern Ghana (Lower Volta) does not seem to be very appropriate since there is abundant rainfall in this area. Concerning large-scale irrigation the focus in Burkina Faso is on the expansion of the Bagré irrigation project. The total potentially irrigable area for Burkina Faso is estimated at 160.000 ha. Giesen et al. (2002), indicates that if this area were to be completely developed and if it is assumed that irrigated areas evaporate at full potential rate throughout two growing seasons, the total evapotranspiration from reservoirs and irrigation schemes will amount to 2.6 km3 or about 7% of the outflow of Volta Lake before the construction of Akosombo Dam. Large-scale irrigation projects in the basin are not profitable while small-scale schemes do extremely well in every part of the basin (Obeng-Asiedu, 2004). So the continued expansion of small-scale irrigation projects in the relatively dry northern part of the basin (northern Ghana and Burkina Faso) is, from an economical perspective, more likely than the expansion of large-scale irrigation projects.

14
Compared to the height of the energy crisis in Ghana during the late 1990s, the pressure on the hydropower dams downstream of Volta Lake has temporarily decreased. The Valco Aluminium factory, that uses the largest part of the hydropower, has new owners with new (less tight) power delivery conditions. Furthermore, the gas pipeline from Nigeria will provide additional energy to Ghana. In the long-term, depending on the population growth, the economic development and the gas price; the pressure to construct more hydropower dams may increase again. In Burkina Faso only one new large hydropower site has been identified. The demand for water in Ouagadougou is at the moment much higher than the water availability. After the completion of Ziga Reservoir (November 2004, capacity 200 106 m3) the urban water supply is limited by the capacity of the water treatment plants. For now it is expected that the urban water use will rise by 30 to 50% in the coming two years. When funds are obtained for the expansion of the capacity of the treatment plant the urban water use for Ouagadougou is expected to experience another significant rise. The urban surface water abstractions in Ghana will also continue to rise if Ghana’s Vision 2020 is realised (safe water supply for all). The above-identified differences in capabilities, requirements and focus between Ghana and Burkina Faso underscore the need for a basin-wide water management. In order to develop water management scenarios for the basin the possible future water uses need to be identified and quantified. The following possible future uses are identified and in some cases quantified (Table 6): • Increase in the number of small dams and reservoirs in the basin. Based on satellite images, the
GLOWA-Volta project monitored increments in the number and surface of dams for southern Burkina Faso and northern Ghana (Vescovi et al., 2002; Giesen et al. 2002). These data may help in determining a trend.
• Significant expansion of the area under irrigation downstream of the Bagré Dam (Burkina Faso, Table 6). The number of fishponds in the area (small scale at present) may also increase. An irrigation project at the Kompienga Dam (Burkina Faso) is not likely because the local soil conditions are not so good and the space is limited since the dam is very close to the border with Togo.
• Expansion of large-scale irrigation at the identified sites in Ghana and Burkina Faso. • The construction of large hydropower dams at several sites in Ghana (the planning for Bui Dam is the
most advanced), at one site in Burkina Faso and at one site in Benin. • Expansion of urban water uses (notably Ouagadougou and Accra). • Figures on the population growth in the basin (about 2.5 to 3% per year), the level of development and
the mean domestic water uses are required to estimate future domestic water uses. These figures are generally available for both countries (e.g. Gleick, 2002, UN Population Study Reports, Ministry of Works and Housing, Accra, etc.).
• Increased evapo(transpi)ration from reservoirs if the predicted temperature rise in the basin (Section 2.1.3) will materialize.
Table 6 Overview of possible expansions of currents water uses and possible new future water uses
Sites Country Sub-basin Type of use* References with information on quantities
expansion of small dams and reservoirs in northern part of Volta Basin
BF, GH White Volta, Black Volta, Oti
agriculture, cattle, domestic Vescovi et. al. (2002); Giesen at al. (2002); Mahe et al. (2005); GLOWA-Volta, IRD
Pouya (Natitingou), suggested dam site
Benin Oti hydropower
Juale, suggested dam site GH Oti hydropower (90 MW, originally 300 MW)
VRA
Ouahigouya dam, suggested dam site
BF White Volta urban water supply to Ouahigouya
ONEA
Ziga dam BF White Volta ~5 (replacement for Ouagadougou res.) + ~8 (extra within 3 years) 106 m3/y; more growth when treatment plant is expanded
ONEA

15
Bagré dam BF White Volta expansion of irrigation from 2,100 ha (2006) to 4,200 ha (rice and vegetables) and in long-term to 30,000 ha; urban water supply to Tenkodogo, Koupéla & Fada
MOB; ONEA; Obeng-Asiedo (2004)
Tamili (Bawku area, tributary to White Volta)
GH White Volta irrigation, 1,500 ha (rice and onions), 80 106 m3/y
IDA
Pwalagu, suggested dam site GH White Volta hydropower (36 MW) and irrigation 110,000 ha (rice and vegetables)
VRA, IDA
Kulpawn, suggested dam site (tributary to White Volta)
GH White Volta hydropower (40 MW) VRA
Daboya GH White Volta hydropower (40 MW) and irrigation 10,000 ha, 180 106 m3/y (phase 1: sugar cane) expanding to 25,000 ha
VRA, IDA
Tamale(expansion) GH White Volta urban water supply expansion in phases from 7 to 16.1 and 25.2 106 m3/y
GWCL
Samendeni, suggested dam site (relatively advanced)
BF Black Volta small scale hydropower and irrigation 20,000 ha
DGHA
Sourou Dam BF Black Volta expansion of irrigated area from 5,000 to 30,000 ha
DGHA
Ouessa, suggested dam site BF Black Volta irrigation ~20,000 ha DGHA Noumbiel, suggested dam site
BF Black Volta hydropower 48 MW (initially 62 MW) and irrigation >20,000 ha; reservoir volume: 11.3 km3 (total), 8.3 km3 (active), surface: 1,430 km2
MMCE (2001); SONABEL; DGHA; Obeng-Asiedo (2004)
Koulbi, suggested dam site GH Black Volta hydropower (68 MW) VRA Ntereso, suggested dam site GH Black Volta hydropower (64 MW) VRA Lanka, suggested dam site GH Black Volta hydropower (95 MW) VRA Kamba, suggested dam site GH Black Volta irrigation 29,400 ha (rice) 35
106 m3/y IDA
Bui, suggested dam site (relatively advanced)
GH Black Volta hydropower (260 MW, originally 400 MW) and irrigation 64,000 ha
VRA; IDA; Obeng-Asiedo (2004)
Buipé, suggested dam site GH Black Volta 95 ha IDA Mpaha, suggested dam site GH Black Volta 5,400 ha IDA Jambito, suggested dam site GH Black Volta hydropower (55 MW) VRA Yendi dam GH Lower Volta,
tributary to Volta Lake
urban water supply expansion from ~0.7 to ~2.4 106 m3/y
GWCL
Afram Plains GH Lower Volta 110,000 ha IDA Accra Plains GH Lower Volta 200,000 ha, 2,700 106 m3/y IDA Kpong GH Lower Volta urban water supply Accra,
expansion from ~70 to 183 106 m3/y; irrigation left bank 10,000 ha, right bank extension from 4,000 to 10,000 ha (total irrigation use ~220 106 m3/y)
GWCL, IDA
Aveyime GH Lower Volta 6,000 ha IDA Sogakope GH Lower Volta urban water supply for Lomé,
116 106 m3/y GWCL
2.3 Surface water quality 2.3.1 Data on Surface water quality The following governmental organisations have responsibility for monitoring the quality of the surface water in the basin:

16
• The Environmental Protection Agency (EPA, Ghana) monitors the water quality of industries releasing water in the rivers.
• Ghana Water Company Limited (GWCL) monitors the water quality at intake points for urban water supply.
• The Water Research Institute (WRI, Accra) has water quality data from some ad-hoc studies. • The National office of Water and Housing monitors the water quality at surface water abstraction sites
(ONEA, Burkina Faso). The surface water quality network in the basin consists of nine sites (MAHRH, 2004: maps 3 & 4, Table 8; Kam, 2002). ONEA also does occasional water quality tests for private clients.
• The DGIRH runs a ground- and surface water quality-monitoring network in Burkina Faso. The surface water quality network consists of 18 sites (MAHRH, 2004: maps 3 & 4, Table 8; Kam 2002). The sampling of the network is irregular; it depends on the available resources. For example, the most recent samples for the Black Volta were taken in 2000 (Appendix 2).
The following research institutions and projects have analysed the quality of the surface water in the basin: • Onchocercosis Control Project (OCP, ran by WHO) during the 1980s up to 1995 in Ghana. • EIER is within the framework of a project called ‘Eutrophication and sedimentation in small dams’
monitoring the surface water quality in 10 small reservoirs in Burkina Faso (contact: Prof. Amadou Maïga).
• The RESO programme also has a water quality-monitoring network that includes six sites along the Black Volta River. Unfortunately the network was not functioning in 2004 (MAHRH, 2004).
2.3.2 Surface water quality field survey For this assignment, a number of field water quality tests (Appendix 2) were carried out on 15 surface water samples from various locations in the White and Black Volta sub-basins. An overview of the water quality tests is presented in Table 7. It should be noted that the survey is a one-time measurement and therefore not conclusive as the water quality is, amongst other things, a function of human activities upstream of the sampling sites which change with time.
Table 7 Water quality parameters tested for this assignment.
Water quality parameter***
Explanation Results of field tests
Accepted limits
Electrical Conductivity (EC)**
indication for the amount of ions in the water 21 tot 114 μS/cm 750 to 1500 μS/cm*
pH acidity of the water, 7 is neutral 6.4 to 6.6 6.5-8.5 (WHO) Nitrite (NO2) indicates the presence of biological waste such as
manure, nitrite is broken down by bacteria into nitrate
<0.5 mg/l 0 mg/l (WHO) 0.5 mg/l (EU)
Nitrate (NO3) indicates the presence of biological waste such as manure
<5 mg/l 10 mg/l (WHO) 50 mg/l (EU)
Total hardness sum of ions which can precipitate as ‘hard particles’; calcium, magnesium and sometimes iron
<107 mg/l
Carbonate (CaCO3) hardness
sum of calcium ions which can precipitate as ‘hard particles’; influences pH and CO2
<53 to 107 mg/l 500 mg/l (WHO)
* or roughly 500 to 1000 mg/l Total Dissolved Solids ** measured with an EC meter from Hanna Instruments (USA) *** measured with test strips from eSHA (The Netherlands) All the results from the water quality test (including some unpublished data from DGIRH) are presented in Appendix 2. In some of the samples the Ph is a bit low (slightly acidic), but besides that all water samples show, for the tested parameters, values that indicate a very low mineral content. Furthermore, no indication for the presence of biological waste (nitrite, nitrate) was found. Special attention was paid to the Bagré irrigation project on the White Volta River in Burkina Faso since there are some concerns in Ghana that drainage water from the irrigation project may pollute the White Volta River. The EC just downstream of the irrigation project was slightly higher (90 μS/cm, sample 11) than just upstream of the irrigation project (77 μS/cm, sample 12). Still, both samples indicate a low mineral content and variation like these are not uncommon between sites along the same river.

17
2.3.3 Analysis of surface water quality There is very little information in the available literatures on surface water quality for the basin. The only fairly elaborate dataset found is presented in a summary table and covers one site per each of the four sub-basins during the period 1976-78 (GEF 2002; Andah et al., 2003). GEF (2002) provides a more recent (1995) summary table for one site on the Lower Volta. The report identified (potential) surface water pollution sources in all the riparian countries in the Volta Basin. According to the report, the surface water quality is deteriorating due to an increase in development and population pressure. Iron and phosphate are the components with the most elevated values. Still, outside the developed areas the water is generally of good quality, such that, mineral content of the water is suitable for potable drinking water and agriculture (Andah et al., 2003). A notable parameter is the relatively high mean Biological Oxygen Demand (BOD)1 in the White Volta (105 mg/l) compared to the other rivers (<5 mg/l). A high BOD results in a reduction of available oxygen in the water for plant and animal life. Most datasets on which these conclusions are based are almost 30 years old so there is an urgent need for more recent water quality measurements. Furthermore microbiological contaminants raise concern; Faecal Coliforms (16-18 / 100 ml) have been found in the White Volta (Dalon) and Lower Volta rivers (Sogakope; Amoah, 1999; GEF, 2002). For a water quality study in Burkina Faso (2001) nine surface- and groundwater samples from various sites at which an agricultural pollution was suspected were taken for analyses on nutrients and pesticides. The conclusion was that in general no the water did not contain pesticides (a very slight pollution was found at two sites) and that at a number of sites an elevated nutrient content was found (MAHRH, 2004). Theoretically, potential sources that may lead to a degradation of surface water quality are: • Waste releasing industries (e.g. textile and tanning factories, slaughterhouses, etc.). • Gold mines may introduce chemical like cyanide into the river. • Human waste in densely populated areas. • Agriculture may introduce fertilizers and pesticides (relatively low in Burkina Faso because of the
traditional agricultural production system, see Section 2.2.2.1 for sites of large irrigation projects). The possible consequences of increased surface water pollution in the basin are: • The introduction of phosphates and nitrates creates a favourable circumstance (eutrophication) for the
development of weeds such as the water hyacinth. A map of the location of aquatic weeds can be found in GEF (2002, Appendix D-11).
• Water pollutants have a negative effect on all the uses (ecological, domestic, etc.) along the river. Surface water quality can be improved by reducing the discharge of waste on the surface waters. It can also be improved by introducing artificial wetlands downstream of developed areas.
1 The BOD is defined as the amount of oxygen needed for the bacterial decomposition of rotting organic material to reach a stable stage [to compare, a crude sewage has a BOD of 600 and unpolluted water of <5 mg/l; (Jones, 1997).

18
3 Groundwater 3.1 Groundwater data Organisations and projects that have groundwater data are: • The DGIRH runs a monitoring network of observation wells in Burkina Faso. About 38 wells from the
network are situated in the Volta Basin. In most wells the monitoring started in the 1980s. The metadata on all wells in the network, including a quality label, can be found in MAHRH (2004; Table 1). The piezometers are also listed in KAM (2002).
• There is no monitoring network of observation wells in Ghana. Some ad-hoc water level measurements have been made. The WRC/WRI is currently setting up a by CIDA (Canadian International Development Agency) assisted well monitoring programme in the White-Volta sub-basin (~20 wells, contact: Enock B. Asare).
• The GLOWA-Volta Project has a database on urban and rural boreholes and wells in Burkina Faso and Ghana. It contains hydrogeological information but the quality is questionable and differs, depending on the drilling agent, very much per drilling, (contact: Nicola Martin, [email protected]; see also Martin and Giesen, 2005).
• DANIDA (2002) estimated the groundwater uses and availability for Burkina Faso. 3.2 Analysis of the aquifer in the Volta Basin The underlying rocks of the basin (basement complex and consolidated sedimentary formations) have no primary porosity. The aquifer can be conceptualised as a two components system; the weathered mantle and the fractured bedrock. The weathered mantle consists of a more or less homogeneous cover ranging from clay to clayey sand with a generally high porosity and a low permeability. The fractured bedrock has a low porosity and a high permeability. The amount of weathering and the intensity of fracturing depend on the nature of the bedrock. A hydraulic contact is present between both components. The depth to the water table decreases from 13 to 14 m in the central region of Burkina Faso to about 6 m in northern Ghana (Sommen and Geirnaert, 1988). According to local reports the water level in boreholes along the White Volta in northern Ghana is currently declining, there are no water level measurements available to proof this. The observation is based on the fact that many of the over 1000 boreholes drilled by CIDA in the 1970s and 1980s in northern Ghana stopped, especially in the dry season, producing water. Some of the boreholes had to be rehabilitated by drilling a little deeper and reinstalling the pumps (PAGEV, 2005 and pers.com. PAGEV staff). This is the basis for CIDA sponsoring a groundwater monitoring system in the northern Ghana (see above). The thickness of the aquifer varies from several metres up to roughly 100 m, while the mean thickness is approximately 20 m. The mean yield from the boreholes in the basin is relatively low, between 2 and 9 m3/h (Sommen and Geirnaert, 1988; Dapaah-Siakwan and Gyau-Boakye, 2002; GEF, 2002; Glowa-Volta data cd). Generally, high yield wells are at locations where both components of the aquifer system (weathered mantle and fractured bedrock) are well developed (Sommen and Geirnaert, 1988). The groundwater potential varies over the basin. For example, the region that contains the headwaters of the Black Volta has a good groundwater potential while, at the other end, the Middle Voltaian Obosum Sediments in Ghana have generally a low groundwater potential (Martin and Giesen, 2005). A local groundwater recharge study near Lake Volta based on isotopes concluded that modern recharge is taking place and that the studied groundwater system does not derive significant recharge from Lake Volta (Acheampong and Hess, 2000). Based on: water balance calculations, water table fluctuations and isotope analysis, Sommen and Geirnaert (1988) provide a rough estimate of an annual recharge in the range of 2 to 16% of the annual precipitation (i.e. 17 to 136 mm/y). Based on a literature study Martin and Giesen (2005) present annual recharge rates that vary with the rainfall; up to 13% in sandstone and up to 8% in weathered rock. The GLOWA-Volta Project is currently studying the groundwater contribution over time to stream flow in representative river catchments in the basin. 3.3 Groundwater uses To assess the development of groundwater use, an inventory of drilled wells and data on existing pipe-borne systems based on groundwater has been compiled by the GLOWA-Volta Project for the part of the Volta Basin

19
that is located in Ghana and Burkina Faso. Since 1970 the number of drilled wells equipped with hand pumps have increased from several hundreds to almost 20,000. A summary of the rural and urban groundwater uses by drilled wells in the Volta Basin (Burkina Faso and Ghana) estimated by the GLOWA-Volta Project is presented in Table 8. Groundwater abstraction for irrigation is not included in this estimate. In the Ghanaian part of the basin groundwater abstraction for irrigation is expected to be small because it is based on hand-dug shallow wells near riverbeds (pers.com. N.C. van de Giesen). In the headwaters of the Black Volta in Burkina Faso significant groundwater abstraction for irrigation is taking place. The mean urban and rural groundwater extraction by drilled wells (2001) from the part of the Volta Basin that is located in Ghana and Burkina Faso is much less (<1 mm) than the estimated mean annual recharge (≥17 mm, see above). This is a basin-wide perspective and does not rule out the possibility of local over-abstractions from the aquifer. Martin and Giesen (2005) concluded that groundwater production is still less than 5% of the average annual groundwater recharge in most of the Volta Basin and that the present groundwater production should not be expected to have any significant impact on the regional groundwater balance. They attribute a decline of the water table in wells as local problems caused by low transmissivities unable to sustain a yield large enough to match the pumping rate.
Table 8 Summary of groundwater production for rural and urban water supply (excluding irrigation) in the Volta Basin in Ghana and Burkina Faso
Uses in 2001 Quantity [106 m3/y]* Quantity in [mm/y]** Borehole with hand pump 61.2 Modern hand dug well 1.7 Boreholes with a piped system 15.4 Total 88.3 0.26
* source: GLOWA-Volta Project data cd, and Martin and Giesen (2005) ** surface area of Volta Basin shared by Burkina Faso and Ghana ~346,000 km2 (GEF, 2002) 3.4 Further analysis of groundwater data The above information and analysis of groundwater resources in the basin is far from complete, given the limited time available for this assignment, and for the fact that the focus of this assignment was skewed towards surface water rather than on groundwater and because surface water is more of a shared trans-boundary resource than groundwater. However, there is a need to pay attention to groundwater during the water audit exercise because surface water and groundwater are closely linked, and the fact that, at this stage, it is already possible to draw the conclusion that the information on groundwater resources is too scarce and too dispersed for the development of a groundwater flow model for the basin. For further analysis of the groundwater in the basin the following is recommended:
1. Expand the GLOWA database on boreholes for rural and urban water supply with information on boreholes for agricultural groundwater abstractions.
2. Link the current (Burkina Faso) and coming (Ghana) groundwater level and quality monitoring networks to the database(s) and map (Martin and Giesen, 2005) on groundwater production. This can serve as a primary indicator to areas where over-abstraction occurs and/or areas that should be included in the groundwater-monitoring network.
3. Start with the building up of a database that may in the future serve as the basis for groundwater model(s) for the basin. The database should at least include:
• information on location and direction of faults (these are potential preferential groundwater flow paths);
• information on boreholes (abstraction rate, diameter, depth of screens, water level, description of lithology, well logs, etc.);
• pumping test information (for permeability of aquifer); • geophysical measurements (for determination of thickness of aquifer); • groundwater recharge studies; • groundwater levels (levelled piezometers to determine groundwater gradient); • reports and papers on groundwater studies in the basin.

20
4 Rainfall 4.1 Rainfall data The following governmental organisations have responsibility for monitoring meteorological parameters in the basin: • The Direction de la Météorologie collects rainfall (~180 stations, first station started ~1900) and
evaporation data (~20 stations, first station started ~1970) for Burkina Faso. The data are digitally available and can be bought for a fixed price. A map with the locations of stations is available (see enclosed cd).
• The Meteorological Services Department (MSD) collects rainfall (~100 for the whole of Ghana, digital) and evaporation data (~15 for the whole of Ghana, digital and analogue). The data can be bought for a fixed price. A map with the locations of stations is available (see enclosed cd). The MSD has no bilateral cooperation with Burkina Faso, but the MSD receives the data for the synoptic stations in Burkina Faso through the WMO. MSD knows that the VRA is very interested in receiving rainfall data from Burkina Faso.
The following research institutions have monitored or plan to monitor rainfall in the basin: • The WHYCOS Project collects rainfall data for various sites in Burkina Faso.
The following research institutions and projects have a database on meteorological data: • The GLOWA Volta has a meteorological database for Burkina Faso and Ghana for the period 1960-2002,
the data comes from the meteorological departments of both countries. • The Institut de Recherche pour le Dévelopment (IRD) has meteorological data (potential
evapotranspiration and rainfall) for the White Volta sub-basin in Burkina Faso for the period 1950-1995 (Mahe et al, 2005a).
• AGRYMET has long-term rainfall data for at least five stations in Burkina Faso (Hubert, 1989; Hôte et al. 2002; Mahe et al., 2002).
4.2 Analysis of rainfall data As described above (Section 2.1.2.2), the non-linear relation between rainfall and river flow makes the runoff in the Volta Basin very sensitive to climatic variations. There have been many publications that analyse rainfall in the Sahel (Hôte et al., 2002; Ozer et al., 2003; Dai et al., 2004) and West Africa from the Sahel down to the Atlantic coast (Mahe et al. 2002; Ardoin et al., 2003). All these publications agree that there has been rainfall deficit in the Sahel and the coastal parts of western Africa (west of the Togo-Benin boundary) during the 1970s, 1980s and the first half of the 1990s. In the literature, there is some discussion on whether or not the rainfall deficit continued in the Sahel during the second half of the 1990s and beyond. It can be summarised as: 1) there are signs of recovery of rainfall since the late 1990s but that longer time series are required before it can be confirmed statistically; 2) another interesting observation is the fact that large multi-year oscillations appear to be more frequent and extreme after the late 1980s (Dai et al., 2004). This is likely to result in large inter-annual variations in river flow.

21
5 Water audit 5.1 Introduction A water audit consists of an assessment of current and anticipated water availability and demand. There are two important choices to be made before doing a water audit: • The time scale of the audit (annually or monthly or weekly or daily), • The spatial scale or the size of river sections for which the water audit is executed (whole basin, four sub-
basins, four sub-basins each divided into 3 to 4 sections, all first order tributaries to the river, all second order tributaries, etc.).
The factors that influence the choice of time and spatial scales are: 1) The aim for the water audit, in other words, what PAGEV plans to do with the information. For example, a detailed time and spatial scale are required when the outcome of the water audit is going to be used for the management of dams and reservoirs in the basin. Based on discussions with the PAGEV project and the project proposal (IUCN-BRAO, 2004) it can be stated that the outcome of the audit will be used to help policy makers in the basin to take informed decisions on water management planning. Generally, supporting decision makers requires a less detailed scale than advising on day-by-day water management of the dams. 2) The available data for the water audit. An important attribute of the presently available data is that there is more monthly than daily river flow data. 3) The timeframe of the water audit. For example, it should be noted that the ongoing study on the water uses of all the small reservoirs in the basin (GLOWA-Volta) will become fully available after the related PhD study is finished (June 2007). The PAGEV plans to have the bulk of the water audit executed in 2005 and 2006. 4) The available financial budget for the water audit. The smaller the budget, the less detailed the water audit will be. For example, a water audit based on an annual time scale for the basin as a whole requires a relatively small budget, while a water audit on a daily time and detailed spatial scale would require a larger budget. Basin wide annual water audits mask intra-annual and local variations on water availability and water uses. An audit at a detailed time (days or weeks) and spatial (2nd order tributaries) scale probably goes beyond the available budget and requires a lot of detailed data in order to make it reliable at the presented scale. Furthermore, this scale is more important for day-by-day management than providing decision support to policy makers. So it is recommended to do a water audit for a monthly time scale in which the four sub-basins have been divided into three or four larger sections. A water audit generally focuses on water quantity. Still, the water quality is important to determine if the available water is good enough for all the uses. This is particularly so, considering the fact that the only elaborate water quality data set that is quoted in the accessible literature is almost 30 years old and covers only four sites. For several reasons such as the facts that: 1) doing a water quality study requires a different discipline than a water quantity study, 2) there is much less information available on water quality than on water quantity, and 3) the focus of the water quality study will be more location specific (mainly downstream of potentially polluting activities) than the quantitative water audit (basin wide); it is recommended that the water quality study be separated from the water audit. Still, the predicted impact of water management scenarios on the water quality should be included in the water audit. 5.2 Candidates for the water audit In order to ensure acceptance of the outcome of the surface water quantity audit by all stakeholders in the basin, it is recommended that the study be executed as collaboration between parties from both the riparian countries with the largest landmass in the Volta Basin; Burkina Faso and Ghana. An independent consultant from outside the basin can also generate an output that will be accepted as non-biased by all stakeholders, but for a long-term water management in the basin it would be better if relatively young local experts do the bulk of the water audit work. It would also be useful if the candidates have good contacts with the two organisations in the basin that have relevant information and the most published papers in international hydrological journals on the basin

22
(GLOWA-Volta Project and IRD). In the TOR for the consultants special attention should be given to the facilitation of the close cooperation between the experts from both countries. Another aspect that should be monitored, especially if people with recently obtained PhD’s are hired, is that the work remains practical and does not go too deep into academic details that do not have a large impact on the outcome of the scenarios that are going to be developed within the water audit. Identified people/organisations who may participate in the surface water audit: Graduated PhD. students from the GLOWA-Volta Project: • Barnabas Amisigo ([email protected]; Ghanaian, Phd. Student on groundwater-surface water
interaction with Prof. N. van de Giesen in Delft who will finish his PhD. in 2005, recent publication on filling data gaps in river flow data in the basin).
• Dr. Patrick Obeng-Asiedu ([email protected]; Ghanaian, University of Bonn, PhD. in 2004 on an hydrologic-agronomic-economic model for the basin).
It is recommended that information be obtained from Prof. van de Giesen (Technical University Delft, former team leader of GLOWA-Volta Project, at email: [email protected]) on which graduated Ghanaian PhD. students from the GLOWA-Volta Project are most suited for the work. IRD has, as far I know, only French hydrologists working at their office in Ouagadougou. So they are not suitable candidates to do the bulk of the water audit work, assuming that local capacity building is an important goal for PAGEV. Experts at EIER: • Dr. Harouna Karambi (assistant researcher, Burkinabe). • Dr. Bacabar Dieng (Professor in hydrology, Senegalese). • Dr. Christophe Laroche (Professor in surface water hydrology, French).
It should be noted that many experts at EIER come from outside the Volta Basin and that they may not be available fulltime for longer periods due to their work at EIER. Consultants who have worked for DGRIH (ranked in order of recommendation from DGIRH): • Kam Sié Ludovic (surface water expert, very experienced on hydrometric network in Burkina Faso but
quite mature so no long-term capacity building if he is chosen). • Savadogo Kandaogo (expert on hydrometric networks). • Abel Tigassé.
Mr. Innocent Ouédraogo (Burkinabe, former director at DGRIH, worked for IWACO and the FEM-Volta Project, works currently for WRCU and as an independent hydrological consultant). People who work(ed) at/for the WRI (number of people working in the surface water department has decreased during the past few years) are: • Dr Philip Gyau-Boyake (Current Head of Surface Water at WRI, scientific publications on the filling of
data gaps in river flow data and surface water flow in the Volta Basin), • Nii Boi Ayibotele (Ghanaian, former director of WRI, very experienced but very busy,
[email protected]), • Dr Yaw Opoku-Ankouah (Deputy Director of WRI and head of GEF-Volta project, scientific
publication on surface water resources in south-western Ghana). Dr Kwabena Obeng Nyarko (Ghanaian, hydrological consultant, currently working in Botswana). Prof. Chris Gordon from the university of Ghana is an expert on wetlands in the Volta Basin that may be able to assist with the filling of the information gap on required environmental flows in the basin ([email protected]). Furthermore, IUCN has in-house experts on environmental flows (e.g. Dr. G. Bergkamp). It should also be noted that the PAGEV Project employs two experienced hydrologists (Burkinabe and Ghanaian) from the basin who can, provided that they have the time, execute parts of the Water Audit.

23
5.3 Proposed TOR for the water audit 5.3.1 Relevance of current activities in the basin As shown above (Chapters 2 and 3), there is already a lot of work being done on water resources in the basin. The situation is a big advantage, as existing work can be used as building blocks, thereby releasing more energy that can be channelled into filling the information gaps. Hopefully this will produce a better outcome. Close cooperation with other organisations is also important in order to prevent policy makers from being fed with competing DSS (Decision-Support systems) for the management of water resources. The research institutions that do work that are most relevant to the water audit are the GLOWA-Volta Project, IRD and the recently started GEF-Volta Project. The VREO Project also plans to start working on the improvement of the water management in a part of the basin (the Black Volta in Burkina Faso) by May 2006. The overall objective of the GLOWA-Volta Project: ‘the implementation of a Decision Support System for the assessment, sustainable use and development of water resources in the Volta Basin’ is congruent to the objectives of the water audit. So close cooperation with this organisation is specially recommended (GLOWA contact for DSS at basin level: Charles Rodgers, [email protected]). Close collaboration with the relevant governmental organisations in Burkina Faso (DGIRH) and Ghana (WRC) is also essential in order to pave the ground for acceptance of the outcome of the work. 5.3.2 Relevant experiences and studies for the water audit A crucial factor for the acceptance of the water audit is that the outcome be not a water management ‘plan’ but water management ‘options’ for the basin. The options and their consequences for water availability for the uses in the basin will assist policy makers to make decisions based on sound scientific knowledge. Some studies that may help in executing the water audit are: the impact of five water management scenarios on the Volta River Basin developed by the GLOWA-Volta Project (Amisigo et al. 2003) and an hydrologic-agronomic-economic model on the water uses and resources in the basin developed by Obeng-Asiedu (2004). Another important study is DANIDA (2001), which estimated the surface and groundwater availability and demand for the year 2000 per sub-basin in Burkina Faso. The report also used rainfall-runoff models to fill data gaps in the river flow data. Although old, Ostrom (1977, available in the IUCN-BRAO library) can help with the river flow data quality analyses because it provides many rating curves and monthly river flow data for the whole basin. Water management experiences in Botswana can also provide technical inspiration for the water audit. In eastern Botswana the increasing water demand of small-scale upstream farm reservoirs has been known to have an impact on the availability of water from the major reservoirs. A daily model has been developed to quantify the effects of the existing small reservoirs and the possible impacts of future proposed ones on the water resources of the major downstream reservoirs (Meigh, 1995). Also the water management options prepared for the Komadugu-Yobe Basin in Nigeria may serve as a useful example (IUCN-HNWCP, 1999; Goes 2002). Dyson et al. (2003) provides a guideline on determining environmental flow requirements. 5.3.3 Exclusion from water audit The development of new future water uses in the Lower Volta (the smaller tributaries to Volta Lake and the river downstream of Akosombo Dam) will not be included in the scenarios. This is done to limit the amount of work for the water audit and because the development of these uses is considered to be a national Ghanaian issue and not a trans-boundary issue. The impact of present and future uses in the three other sub-basins on water availability and water uses in the Lower Volta will still be an important part of the water audit. The other three sub-basins (Black Volta, White Volta and Oti) should all be covered completely in the water audit. Still, the most detailed analysis should be done on the sub-basin with the largest pressure on its water resources; the White Volta. Thus initially, for the Black Volta and the Oti, fewer river flow stations and only major water uses need to be considered for the development of scenarios. 5.3.4 Strategy for minimizing delays during water audit Obtaining river flow data may, especially in Ghana, take some time. In order to prevent large delays during the water audit it is therefore recommended to obtain all available river flow data (including gaugings and rating curves) before the Water Audit officially starts. In the event that it is decided to hire experts from Burkina Faso

24
and Ghana, it is recommended that TOR explicitly reflect and facilitate that the experts physically share an office for at least two thirds of the time. 5.3.5 Water audit components The proposed water audit should comprise the following components: 1) Collect and compile monthly data on present and future water uses (see Section 2.2) from all identified sources. Collect water level data from the well monitoring network in Burkina Faso and available studies in Ghana. 2) Select stations that are candidates to be qualified as key river flow station for the water audit based on location and length of period for which data are available. Execute quality checks on the river flow data for these stations (including rating curves) and determine which data are reliable enough to be used in the water audit. Make a final selection of key river flow stations for the water audit (20 to 30 in total; the stations presented in Table 1 should be included). If only water level data are available for certain periods for the key stations than the discharge should be estimated using available river gaugings and rating curves. When data gaps in runoff series for key station are limited and/or other data (e.g. rainfall or discharge at neighbouring stations) are available, the missing data should be estimated. This can for example be done by using a procedure that was especially developed for rivers in West Africa (Gyau-Boyake and Schultz, 1994) or by using a method that have recently been applied on flow data from various rivers in the Volta Basin (Amisigo and Giesen, 2005). 3) Collect relevant rainfall (to fill data gaps in runoff series) and evaporation data (to estimate losses from reservoirs). 4) Fill the data gaps. The identified data gaps are: • Quality control and filling of gaps in the river flow data (see above). • Information on environmental river flow requirements. • Information on direct abstractions from the river and springs for irrigation in the Burkinabe part of the
Black Volta Basin. • Information on groundwater abstractions for irrigation. • Information on flow requirements/releases by the existing and planned dams in Ghana (VRA). • Because the focus of most projects in the basin is on Burkina Faso and Ghana the data on water uses and
water availability in the other riparian countries is scarce (Oti River in Togo and Benin, Black Volta River in Côte d’Ivoire and Mali). A visit to, at least, the relevant institutions in Togo is required.
5) Divide, on the basis of the available data and number of surface water uses, the four sub-basins into at least four sub-sections that will form the basis for the water audit. The proposed subdivision should be presented in the form of a schematic diagram with motivation and overview of data availability per element of the diagram. 6).Determine the monthly water availability (very-dry year, dry year, normal year, wet year, very-wet year, standard deviation, etc.) for all the water audit sections in the basin on the basis of statistical analyses of river flow data. 7) Determine the future water availability for all the water audit sections for at least three different (sometimes conflicting) climate change scenarios. The scenarios should be based on existing work (e.g. impact of on river flow down-scaled global climate scenarios) as identified above (Section 2.1.3). Rank the future water availability scenarios on the basis of their likelihood. 8) Quantify, on a monthly basis, the present surface water uses for all water audit sections in the basin. Estimate future water uses for the water audit sections for three future years (e.g. 2010, 2020 and 2030) for at least five different development scenarios. Rank the future water uses scenarios on the basis of their likelihood. For the development of the scenarios the rainfall distribution over the basin should be taken into account. For example areas that have a low potential for rain-fed agriculture are more dependant on river flow than areas with a high potential for rain-fed agriculture. Also the millennium development goals ('reduce by half the proportion of people without sustainable access to safe drinking water by 2015') should be reflected in at least one of the scenarios (www.un.org/millenniumgoals).
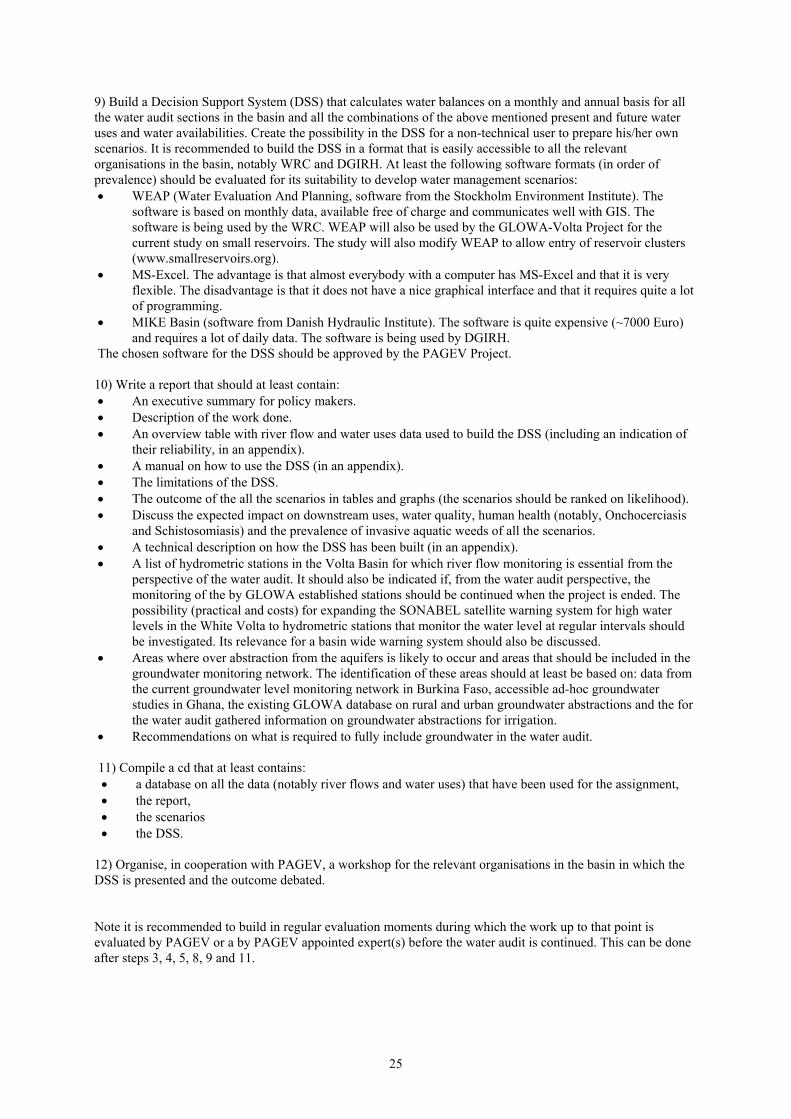
25
9) Build a Decision Support System (DSS) that calculates water balances on a monthly and annual basis for all the water audit sections in the basin and all the combinations of the above mentioned present and future water uses and water availabilities. Create the possibility in the DSS for a non-technical user to prepare his/her own scenarios. It is recommended to build the DSS in a format that is easily accessible to all the relevant organisations in the basin, notably WRC and DGIRH. At least the following software formats (in order of prevalence) should be evaluated for its suitability to develop water management scenarios: • WEAP (Water Evaluation And Planning, software from the Stockholm Environment Institute). The
software is based on monthly data, available free of charge and communicates well with GIS. The software is being used by the WRC. WEAP will also be used by the GLOWA-Volta Project for the current study on small reservoirs. The study will also modify WEAP to allow entry of reservoir clusters (www.smallreservoirs.org).
• MS-Excel. The advantage is that almost everybody with a computer has MS-Excel and that it is very flexible. The disadvantage is that it does not have a nice graphical interface and that it requires quite a lot of programming.
• MIKE Basin (software from Danish Hydraulic Institute). The software is quite expensive (~7000 Euro) and requires a lot of daily data. The software is being used by DGIRH.
The chosen software for the DSS should be approved by the PAGEV Project. 10) Write a report that should at least contain: • An executive summary for policy makers. • Description of the work done. • An overview table with river flow and water uses data used to build the DSS (including an indication of
their reliability, in an appendix). • A manual on how to use the DSS (in an appendix). • The limitations of the DSS. • The outcome of the all the scenarios in tables and graphs (the scenarios should be ranked on likelihood). • Discuss the expected impact on downstream uses, water quality, human health (notably, Onchocerciasis
and Schistosomiasis) and the prevalence of invasive aquatic weeds of all the scenarios. • A technical description on how the DSS has been built (in an appendix). • A list of hydrometric stations in the Volta Basin for which river flow monitoring is essential from the
perspective of the water audit. It should also be indicated if, from the water audit perspective, the monitoring of the by GLOWA established stations should be continued when the project is ended. The possibility (practical and costs) for expanding the SONABEL satellite warning system for high water levels in the White Volta to hydrometric stations that monitor the water level at regular intervals should be investigated. Its relevance for a basin wide warning system should also be discussed.
• Areas where over abstraction from the aquifers is likely to occur and areas that should be included in the groundwater monitoring network. The identification of these areas should at least be based on: data from the current groundwater level monitoring network in Burkina Faso, accessible ad-hoc groundwater studies in Ghana, the existing GLOWA database on rural and urban groundwater abstractions and the for the water audit gathered information on groundwater abstractions for irrigation.
• Recommendations on what is required to fully include groundwater in the water audit. 11) Compile a cd that at least contains: • a database on all the data (notably river flows and water uses) that have been used for the assignment, • the report, • the scenarios • the DSS.
12) Organise, in cooperation with PAGEV, a workshop for the relevant organisations in the basin in which the DSS is presented and the outcome debated. Note it is recommended to build in regular evaluation moments during which the work up to that point is evaluated by PAGEV or a by PAGEV appointed expert(s) before the water audit is continued. This can be done after steps 3, 4, 5, 8, 9 and 11.

26
5.4 Estimated time to carry out the water audit It is envisaged that two local water resources experts (Burkinabe and Ghanaian), an ecologist and two juniors will carry out the water audit. Table 9 presents a rough estimate of the time required to carry out the water audit components. The estimate does not include data related delays such as obtaining difficult accessible data or transferring analogue data into a readable digital format. Furthermore, the water audit team needs an office space for a period of ~7 months and access to a vehicle for a period of approximately 6 weeks.
Table 9 Estimated time required to carry out the Water Audit (working days)
Water audit component
Water Res. Expert 1 Water Res. Expert 2 Ecological flows expert Assistant 1 Assistant 2
1 3 3 - 5 5 2 10 10 - - - 3 - - - 2 2 4 10 10 10 6 6 5 2 2 1 - - 6 2 2 - 2 2 7 4 4 - 2 2 8 3 3 1 2 2 9 10 10 2 - - 10, 11 15 15 2 5 5 12 2 2 2 - - unforeseen delays
9 9 3 6 6
Total 70 70 21 30 30 5.5 Surface water quality study First it is recommended is to try to obtain the water quality data from the relevant organisations (Section 2.3.1) and to put them in a database. Than, together with these organisations, the most critical sites can be determined for additional water quality measurements. It should be taken into account that for Burkina Faso a water quality network, that is partly based on the existing networks (Section 2.3.1), has already been proposed (MAHRH, 2004: Table 17). The surface water quality study can possibly be executed by PAGEV staff in collaboration with the governmental organisations responsible for the water quality monitoring in Burkina Faso and Ghana. As described in Section 2.3.2 simple and cheap field tests can easily give a rough indication of the water quality. At sites where the field tests show elevated values and other sites that raise concern (e.g. the Bagré irrigation project) additional samples can be taken and send to laboratories for a more elaborate analyses. Prior to the submission of samples information should be obtained on how the selected laboratories ensure quality of their work. It is also recommended that some of the samples be analysed at two different laboratories in order to ensure reliability of the result. The focus of the water quality study should be on densely populated areas and just downstream of potentially polluting activities. For locations of potentially polluting activities that should receive attention in the water quality study the reader is referred to Section 2.2.2.1 of this report for sites of large irrigation projects and GEF (2002, p. 93-95) for sites of other potentially polluting activities such as industries. The survey should at least contain one wet and one dry season survey. It is recommended to also include the four sites for which the water quality had been monitored in the late 1970s in order to monitor changes in time (Sabra on Oti River, Daboya on White Volta, Bamboi on Black Volta and Ameda on Lower Volta). Parameters that require special attention are: Faecal Coliforms (downstream of urban areas), Biological Oxygen Demand (notably White Volta), nitrate, pesticides (drainage water from irrigation projects), iron and phosphate. In order to examine the cause for the slight EC difference between up- and downstream of Bagré irrigation project in more detail (Section 2.3.2) it is recommended to do more elaborate laboratory tests (including pesticides) on water samples from both sites at various moments in the year. If possible drainage water from the irrigation plots, before the water enters the river, should be sampled as well.

27
The possible relation between the nutrients and salt content of the surface water and the prevalence of aquatic weeds is worth examining within the water quality study, knowing that other possible causes for aquatic weed development are: flow regulation and a change in sediment load. In the event of non-availability of qualified personnel, a water quality expert may be hired to assist with the planning of the survey and the reporting. The following people/organisations may be considered for this task: • A member of the group in the EIER who do the water quality study in small reservoirs in Burkina Faso
(contact: Prof. Amadou Maïga), • Silga Matias (no further details, name mentioned by DGRIH), • Dr. Enoch B. Asane (Ghanaian, WRC), • Dr. Bisque Hamilton (WRC).
The following laboratories for analysing water samples have been identified: • EIER (Ouagadougou), • ONEA (Ouagadougou), • Bureau des Mines et de la Géologie du Burkina, Service Laboratoire et Pétrographie (Bobo Dioulasso
and Ouagadougou), • WRI (Accra and Tamale), • GWCL (Accra).

28
6 Summary, conclusions and recommendations 6.1 Summary A pre-water audit study was executed for the Volta Basin in Burkina Faso and Ghana. The study (ten working days) relied substantially on existing sources of data, articles, short field trips and discussions with experts working in the basin. The study: 1) determined the available and missing data on present and future water resources and uses, 2) assessed the hydrometric network, 3) proposed a step-by-step work plan on how the water audit can be executed , 4) identified a number of consultants who can contribute to the water audit, 5) made an inventory of water quality studies and monitoring networks, 6) executed surface water quality tests, 7) prepared a work plan for a surface water quality study, 8) assessed briefly the groundwater resources and the rainfall in the basin. 6.2 Conclusions The identified information gaps for the surface water audit are: • Quality control and filling of gaps in the river flow data. • Information on environmental river flow requirements. • Information on direct abstractions from the river and springs for irrigation in the Burkinabe part of the
Black Volta Basin. • Information on flow requirements/releases by the existing and planned dams in Ghana. • Information on groundwater abstractions for irrigation. • Because the focus of most projects in the basin is on Burkina Faso and Ghana the data on water uses and
water availability in the other riparian countries is scarce (Oti River in Togo and Benin, Black Volta River in Côte d’Ivoire and Mali).
Getting access to information on present and future surface water uses in the Volta Basin is relatively easy. All governmental organisations visited in Burkina Faso and Ghana that are responsible for the use of surface water in the basin are very open to sharing information. Furthermore, there is also a lot of information on water uses in the basin in accessible literature and reports. A fairly large but incomplete, especially for the period before 1980, river flow data set on the whole basin have been obtained for this assignment from the Global Runoff Data Centre. Monthly release data on the two hydropower dams in Burkina Faso are easily obtainable from SONABEL (data for the last two years have already been obtained). The relevant governmental institutions in Ghana (HSD) and Burkina Faso (DGIRH) provided an overview of the available river flow data (metadata). A number of observations were made on the metadata: 1) the metadata file for Ghana does not provide details on data gaps, 2) possibly more river flow data are available at other institutions than presented in the metadata files (notably at IRD), 3) the accessibility to the rating curves and the gaugings, that are required for the quality control, is unclear, and 4) the relevant governmental organisations may be reluctant to give out data that have not yet undergone a quality check (roughly 40% of the data for Ghana). So obtaining the river flow data may take some time. There is an enormous amount of river flow stations in the basin (over 200) but quite a number of stations: are no longer functioning, are situated on relatively small tributaries, only have water level data (no reliable rating curves), only have data for a couple of years or have large data gaps. This is a forest in which one can easily be lost. A number of potential consultants in Burkina Faso and Ghana exist who can participate in the water audit. Most people have a long experience in executing consultancies in the basin, but at the same time their available time for the work is probably limited. There are some ad-hoc surface water quality data for the basin. Still, it is not so easy to obtain the data because they are dispersed over many different organisations in the basin. The scarce accessible data and the field survey executed for this assignment revealed that the river water has generally a very low mineral content, and has thus a good quality (EC is generally < 100 μS/cm). But, the presence of microbiological contaminants (Faecal Coliforms), especially in the White and Lower Volta, raise the most concern.

29
Conclusions on water resources and uses in the basin: • There is an enormous amount of suggested future surface water uses in the basin in Ghana and, to a lesser
extend, also in Burkina Faso. This underlines the need for a water audit in the basin. • The non-linear relation between the rainfall and the river flow (Andreini, 2000) makes the runoff in the
Volta Basin very sensitive to climatic variations. • Large multi-year oscillations appear to be more frequent and extreme after the late 1980s (Dai et al.,
2004). This may result in large inter-annual variations in river flow. • Two studies that investigated the impact of downscaled global climate scenarios on the water resources in
the Volta Basin predict an increase in river flow, while a third study predicts a decrease in river flow. • Between 1955/65-70 and 1972-98, in the upstream part of the White Volta in Burkina Faso the mean
river flow increased despite a reduction in rainfall and an increase in the number of dams. The increase was due to the following changes in land use; increase in cultivated area, increase in area with bare soil and a decrease in area with natural vegetation (Mahe et al., 2003 and 2005a).
• The estimated quantity of used groundwater by drilled wells for rural and urban water supply in 2001 (GLOWA Volta) is less than 5% of the mean annual groundwater recharge.
• At this stage the information on groundwater resources is too scarce and too dispersed for the development of a groundwater flow model for the basin.
6.3 Recommendations 6.3.1 Technical recommendations The following recommendations are made for improving the quality of the water audit:
1. Obtain all available river flow data (including gaugings and rating curves) before the water audit officially starts as this will prevent large delays during the water audit.
2. A visit to the VRA is recommended to get more information on water requirements by existing and planned large dams in Ghana (no VRA staff was available in Accra during the assignment).
3. Focus on a limited number of key river flow stations (20 to 30) in the basin. 4. The starting point for the determination of environmental flows can be historical (before human
induced changes in the river) daily hydrographs for sites upstream of the ecological sites. Collaboration should be sought with an hydro-ecologist to examine the impact of flow removal from the hydrographs on the ecosystem.
Recommendations on a surface water quality study in the basin:
1. Obtain water quality data from relevant organisations and put them in a central database so as to ensure their accessibility to researchers, policy makers and program managers.
2. Use relatively cheap field tests for rough indication of the water quality and send additional samples for sites that show elevated values and other sites that raise concern to laboratories for a more elaborate analyses.
3. Focus water quality studies on densely populated areas and just downstream of potentially polluting activities and contain at least one wet and one dry season survey. It is recommended to also include the four sites for which the water quality had been monitored in the late 1970s in order to monitor changes in time.
4. Parameters that require special attention are: Faecal Coliforms (downstream of urban areas), Biological Oxygen Demand (notably White Volta), nitrate, pesticides (drainage water from irrigation projects), iron and phosphate.
Recommendations on the functioning of the hydrometric network in the Volta Basin:
1. Identify key river flow stations in the basin (at the most 20) that need to be monitored in order to give a good overview of the available surface water resources in the basin (optimisation of the hydrometric network). This will allow optimal use of limited resources for the maintenance of the hydrometric network. An optimisation should, however, not be done at the expense of ‘second class’ stations because river flow relations can change in time due to, for example, the construction of a dam.
2. Spend more effort on enhancing the commitment of the readers to do their work by for instance providing them a bicycle if they live far from the stageboard and giving them annually the results of their work (river flow graph for the site).

30
3. The possibility (practical and costs) for expanding the SONABEL satellite warning system for high water levels in the White Volta to hydrometric stations that monitor the water level at regular intervals and its relevance for a basin wide warning system should be investigated.
Other surface water related topics that may be worth investigating:
1. How the discharge in the upstream part of the Black Volta River (north of ~700 mm isohyet) responded to changes in land use.
2. How the floods in northern Ghana are related to unanticipated high inflows in the reservoir of the upstream Bagré Dam in Burkina Faso as a result of land use changes in the upstream part of the White Volta.
3. The introduction of artificial wetlands downstream of developed areas to capture surface water pollution is a topic that may be examined.
For further analysis of the groundwater in the basin the following are recommended:
1. Link the current (Burkina Faso) and coming (Ghana) groundwater level and quality monitoring networks to the database(s) on groundwater abstractions. This can serve as a primary indicator to areas where over abstraction occurs and/or areas that should be included in the groundwater-monitoring network.
2. Start with the building up of a database that may in the future serve as the basis for a groundwater model for the basin.
6.3.2 Collaboration and networking related recommendations To improve the outcome and acceptance of the water audit study, the following recommendations are made:
1. Harmonize the coming work for the water audit with water management related activities from other projects in the basin. The most relevant projects to cooperate with are: GLOWA-Volta, IRD, GEF-Volta and VREO for the Black Volta. Possibly the WRCU of ECOWAS and/or the IWMI can assist with the facilitation of this process. The cooperation can be done by defining a common goal, for example the establishment of a Volta River Basin Authority that takes informed decisions, and an organogram with a timeframe that defines what each project will contribute to achieve the common goal.
2. The PAGEV Project can start on improving the water governance in the basin by facilitating the sharing of river flow data between Burkina Faso (DGRIH) and Ghana (HSD). The interviewed people from both organisations showed a positive attitude towards data sharing (negotiations are required on the finances).
3. PAGEV and its consultants should offer their assistance, especially to HSD (Ghana), with the quality control study. The consultants should be aware of the sensibilities of organisations in providing data that are of poor quality.
4. In order to ensure that the water audit will be a common work between Burkina Faso and Ghana it is recommended to pay special attention to consultants from both countries physically working together in one office for the majority of the time. For capacity building purposes and availability it may be worth to focus on recruiting relatively young consultants who are keen on establishing their name.
5. In order to ensure a good cooperation with the for the Water Audit most relevant project in the basin (GLOWA-Volta) and also to get a high scientific standard it is recommended to recruit at least one graduated Ghanaian PhD student that worked for GLOWA-Volta Project.
6. Since a significant part of the main channel of the Oti River flows though Togo a visit to the relevant institutions in that country is recommended.

31
Acknowledgements All the interviewed people and organisations mentioned in the itinerary are thanked for their frank and open discussions and for the provision of meta-data. The two hydrologists from the PAGEV Project, Ludovic Tapsoba and Jacob Tumbulto, provided very valuable information for this assignment, contributed a lot in the discussions with the visited organisations and were also very pleasant company during our travels through the basin. My appreciation goes to Victor for his safe drive on all the trips. Isaac Asamoah (WRC) helped us a lot by arranging all the appointments in Accra under a very tight time schedule and by providing very useful answers to our questions on the water management in the basin. Kwamé Odame-Ababio (PAGEV), Olumide Akinsola and Madiodio Niasse (IUCN-BRAO) provided a lot of support while in Ouagadougou. Timely comments by Michael van der Valk on an earlier version of this report are appreciated. The Global Runoff Data Centre (Koblenz, Germany) is thanked for giving out river flow data.

32
Reviewed literature Acheampong, S.Y. and J.W. Hess (1998). Hydro-geologic and hydro-chemical framework of the shallow groundwater system in the southern Voltaian Sedimentary Basin, Ghana. Hydrogeology Journal, 6, p. 527-537. Acheampong, S.Y. and J.W. Hess (2000). Origin of the shallow groundwater system in the southern Voltaian Sedimentary Basin of Ghana: an isotopic approach. Journal of Hydrology, 233, p. 37-53. Amisigo, B., T. Berger, M. Iskandarani, W. Laube, J. Liebe, O. Müller, P. Obeng-Asiedu, Y. Osei-Asare, C. Ringler, N. van de Giesen, A. van Edig and C. van der Schaaf (2003). Optimising water use for future supply and demand. Centre for Development Research, Bonn University, Germany. Amisigo, B.A. and N.C. van de Giesen (2005). Using a spatio-temporal dynamic state-space model with the EM algorithm to patch gaps in daily river flow series, with examples from the Volta Basin, West Africa. Hydol. Earth Sys. Sci. Discuss., 2, p. 449-481. Amoah, C.A. (1999). Overview of microbiological studies on the Volta Lake. in: C. Gordon and J.K. Amatekpor, The sustainable integrated development of the Volta Basin in Ghana. Volta Basin Research Project, p.33-39. Andah, W.E.I., N. van de Giesen and C.A. Biney (2003). Water, climate, food and environment in the Volta Basin. Contribution to the project ADAPT, Adaptation strategies to changing environments. Andreini, M., N. van de Giesen, A. van Edig, M. Fosu and W. Andah (2000). Volta basin water balance. ZEF-Discussion Papers on Development Policy no. 21, Bonn, Germany. Andreini, M., P. Vlek and N. van Giesen (2002). Water sharing in the Volta Basin. in: Regional Hydrology: Bridging the Gap between Research and Practice, IAHS Publication 274, p. 329-335. Ardoin, S., H. Lubes-Niel, E. Servat, A. Dezetter, J.F. Boyer, G. Mahe and J.E. Paturel (2003). Analyse de la sécheresse en Afrique de l’ouest: caractérisation de la décennie 1990. in: Hydrology of the Mediterranean and Semi-arid Regions, IAHS publication, 278, p. 223-228. Asante, F., T. Berger, S. Engel and M. Iskandarani (2002). Water security in the Ghanaian Volta Basin: Patterns, determinants, and consequences. Quarterly Journal of International Agriculture 41, No. 1/2, p.145-167. Berger, T., S. Park, F. Vescovi, P.L.G. Vlek, N. van de Giesen (2001). Sustainable water use under changing land use, rainfall reliability, and water demands in the Volta basin (GLOWA Volta). IHPD Newsletter 6, p.14-15. Chisholm, N.G. and J.M. Grove (1985). The lower Volta. In: A.T. Grove (ed.). The Niger and its neighbours, Balkema, Rotterdam. CSIR (2000). Water Resources Management Problems Identification, Analysis and Prioritisation Study. CSIR Water Research Institute, Water Resources Commission, Ghana. Dai, A., P.J. Lamb, K.E. Trenberth, M. Hulme, P.D. Jones and P. Xie (2002). The recent Sahel drought is real. International Journal of Climatology, 24, p.1323-1331. DANIDA (2001). Etat des lieux des ressources en eau du Burkina Faso et de leur cadre de gestion. Ministere de l’Environment et de l’Eau, Secretariat General, Direction General, Direction Generale de l’Hydraulique, Royaume de Danemark Ministeres des Affaires Etrangeres. Dapaah-Siakwan, S. and P. Gyau-Boakye (2000). Hydrogeologic framework and borehole yields in Ghana. Hydrogeology Journal 8, p. 405-416. Diello, P., G. Mahe, J.M. Paturel, A. Dezetter, F. Delclaux, E. Servat and F. Ouattara (2005). Relations indices de végétation-pluie au Burkina Faso: cas du bassin versant du Nakambé. Hydrological Sciences Journal, 50(2), p. 207-221.

33
Dorm-Adzobu, C., E. H. Owusu, C. C. Amankwah and J. S. Ayivor (2004). Inventory of Wetlands in Ghana. Report submitted to IUCN-BRAO. Dyson, M., G. Bergkamp and J. Scanlon (2003). Flow, the essential of environmental flows. IUCN - The World Conservation Union. Edig, A. van, S. Engel and W. Laube (2003). Ghana’s water institutions in the process of reform: from the international to the local level (2003). GLOWA Project, University of Bonn. Edig, A. van, N. van de Giesen, M. Andreini and W. Laube (2001). Transboundary, institutional and legal aspects of the Water Resources Commission in Ghana. IHP/OHP Nationalkommittee, Hydrological Challenges in Transboundary Water Resources Management, Sonderhelft 12, Koblenz, p.391-400. Friesen, J., M. Andreini, W. Andah, B. Amisgo and N. van de Giesen (2005). Storage capacity and long-term water balance of the Volta Basin, West Africa. in: Regional Hydrological Impacts of Climatic Change - Hydroclimatic Variability, IAHS publication 296, p. 138-145. GEF (2002). Volta River Basin preliminary transboundary diagnostic analysis, final report. Global Environment Programme Project Facility. Giesen, N. van de, M. Andreini, A. van Edig and P. Vlek (2001). Competition for water resources in the Volta basin. in: Regional Management of Water Resources, IAHS Publ. no. 268, p.199-205. Giesen, N. van de, H. Kustmann, G. Jung, J. Liebe, M. Andreini and P.L.G. Vlek (2002). The GLOWA Volta Projects: integrated assessment of feedback mechanisms between climate, landuse and hydrology. in: Beniston M. (ed.) Climatic Change. Implications for the hydrological cycle and for water management, Advances in Global Change Research, 10, p.151-170. Gleick, P. (2002). The World’s Water, The Biennial Report on Freshwater Resources 2002-2003. Island Press, Washington. Goes, B.J.M. (2002). Effects of river regulation on aquatic macrophyte growth and floods in the Hadejia-Nguru Wetlands and flow in the Yobe River, northern Nigeria; implications for future water management. River Research and Applications, Vol.18, Issue 1, p. 81-95. Gyau-Boakye, P. and G.A. Schultz (1994). Filling gaps in runoff time series in West Africa. Hydrological Sciences Journal, 39, p. 621-636. Gyau-Boakye, P. and J.W. Tumbulto (1999). The Volta Lake and declining rainfall and stream flows in the Volta River Basin. Environment, Development and Sustainability 2, p. 1-10. l’Hôte, Y., G. Mahé, B. Somé and J.P. Triboulet (2002). Analysis of a Sahelian annual rainfall index from 1896 to 2000; the drought continues. Hydrological Sciences Journal, 47(4), p.563-572. Hubert, P., J.P. Carbonnel and A. Chaouche (1989). Segementation des séries hydrométéorologiques - application à de séries de précipitations et de débits de l’Afrique de l’Ouest. Journal of Hydrology, 110, p. 349-367. IUCN-BRAO (2004). Improving water governance in the Volta Basin. Project Proposal, The World Conservation Union - West Africa Office. IUCN-HNWCP (1999). Water Management Options for the Hadejia-Jama’are-Yobe River Basin. IUCN-Hadejia-Nguru Wetlands Conservation Project, Nigeria. Jones, J.A.A. (1997). Global Hydrology: Processes, recourses and environmental management. Longman Singapore Publishers.

34
Kalitsi, E.A.K. (1999). The role of Volta River Authority in the development of the Volta Basin. in: C. Gordon and J.K. Amatekpor, The sustainable integrated development of the Volta Basin in Ghana. Volta Basin Research Project, p.13-24. Kam, S.L.E. (2002). Mission d’appui à l’amélioration de la qualité et à la reorganisation des données de la DIRH. Ministere de l’Agriculture de l’Hydraulique et des Ressources Halieutiques. Kunstman, H. and G. Jung (2003). Investigation of feedback mechanisms between soil moisture, land use and precipitation in West Africa. in: Water Resources Systems - Water Availability and Global Change, IAHS publication 280, p. 149-159. Kunstman, H. and G. Jung (2005). Impact of regional climate change on water availability in the Volta basin of West Africa. in: Regional Hydrological Impacts of Climatic Variability and Change - Impact Assessment and Decision Making, IAHS publication 295, p. 75-85. Kunstman and Stadler (in press). Operational High Resolution Meteorological and Hydrological Analysis as Decision Support System in integrated water resources management. Paper submitted for publication in IAHS Redbook Series. Laube, W. and N. van de Giesen (in press). Ghanaian water reforms, institutional and hydrological perspectives. Paper accepted for publication in: The Role of Hydrological Information in Water Law and Policy: Current Practice and Future Potential, ed. by J. S. Wallace, P. Wouters, and S. Pazvakavamba. Kluwer Academic Publishers. Lawson, G.W. (1963). Volta Basin Research Project. Nature, 199, p. 858-859. Leduc, C., G. Favreau, and P. Schroeter (2001). Long-term rise in a Sahelian water-table: the Continental Terminal in South-West Niger. Journal of Hydrology, 243, p. 43-54. Liebe, J. (2002). Estimation of water storage capacity and evaporation losses of small reservoirs in the upper east region of Ghana. Diploma thesis, University of Bonn. MAHRH (2004). Plan de conception et de mise en œuvre du Système National d’Information sur l’Eau (SNIEau). Ministère de l’Agriculture, de l’Hydraulique et des Ressources Halieutiques, Direction Générale de l’Inventaire des Ressources hydrauliques. Martin, N. and N. van de Giesen (2005). Spatial distribution of groundwater production and development potential in the Volta River Basin of Ghana and Burkina Faso. Water International, Volume 30, Number 2, p. 239-249. MMCE (2001), Mémorandum pour les négociations avec le Ghana (sur Projet Numbriel). Ministère des Mines, des Carrières et de l’Energie, Ouagadougou. Mahe, G, Y. l’Hote, J.C. Olivry and G. Wotling (2001). Trends and discontinuities in regional rainfall of West and Central Africa: 1951-1989. Hydrological Sciences Journal, 46(2), p. 211-226. Mahe, G., C. Leduc, A. Amani, J.E. Paturel, S. Girard, E. Servat and A. Dezetter (2003). Augmentation récente du ruissellement de surface en région soudano-sahélienne et impact sur les ressources en eau. in: Hydrology of the Mediterranean and Semiarid Regions, IAHS publication 278, p. 215-222. Mahe, G., J.E. Patruel, E. Servat, D. Conway and A. Dezetter (2005a). The impact of land use change on soil water holding capacity and river flow modelling in the Nakambé River, Burkina-Faso. Journal of Hydrology, 300, p. 33-43. Mahe, G., J.C. Olivry and E. Servat (2005b). Sensibilité des cours d’eau ouest-africains aux changement climatiques et environmentaux: extrêmes et paradoxes. in: Regional Hydrological Impacts of Climatic Change - Hydroclimatic Variability, IAHS Publication 296, p. 169-177.

35
Meigh, J. (1995). The impact of small farm reservoirs on urban water supplies in Botswana. Natural Resources Forum, 19(1), p.71-83. Meigh, J., S. Folwell and C. Sullivan (2005). Linking water recourses and global change in West Africa: options for assessment. in: Regional Hydrological Impacts of Climate Change - Impact Assessment and Decision Making, IAHS publication 295, p. 297-306. NIRAS (2004). Field visit White Volta 26-29 August 2004 Surface Water Investigations Adviser. Integrated Water Ressources Management Component of the DANIDA-assisted WSSPS II (2004-2008), Water Resources Commission, Ghana. Obeng-Asiedu, P. (2004). Allocating water resources for agricultural and economic development in the Volta River Basin. Glowa-Volta Project. Opoku-Ankomah, Y. and M.A. Forson (1998). Assessing surface water resources of the South-Western and Coastal basin systems of Ghana. Hydrological Sciences Journal, 43(5), p. 733-740. Ostrom (1977). Le Bassin du Volta. Monographies Hydrologiques Ostrom, Paris. Ouedraogo, M., J.E. Paturel, G. Mahe, E. Servat, A. Dezetter and D. Conway (2001). Influence de la nature et de l’origine des données sur la modélisation hydrologique de grands bassins versant en Afrique de l ‘Ouest. in: Soil-Vegetation-Atmosphere Transfer Schemes and Large-Scale Hydrological Models, IAHS Publication 270, p. 209-214. Ozer, P., M. Erpicum, G. Demarée and M. Vandiepenbeeck (2003). The Sahelian drought may have ended during the 1990s. Hydrological Sciences Journal, 48(3). PAGEV (2005). Project for Improving Water Governance in the Volta Basin. Volta Water Governance Project, Ouagadougou. Pouyard, B. (1987). Variabilité spatiale et temporelle des bilans hydriques de quelques bassins versants d’Afrique de l’ouest en liason avec les changements climatique. in: The Influence of Climate Change and Climate Variability on the Hydrologic Regime and Water Resources, IAHS Publ. 168, p. 447-461. Reij, C., G. Tappan and A. Belemvire (in press). Changing land management practices and vegetation on the Central Plateau of Burkina Faso (1968-2002). Paper accepted for publication in Journal of Arid Environments. Sander, P. M.M. Chesley and T.B. Minor (1996). Groundwater assessment using remote sensing and GIS in a rural groundwater project in Ghana: lessons learned. Hydrogeology Journal 4 (3), p. 40-49. Shahin, M. (2002). Hydrology and water resources of Africa. Kluwer Academic Publishers. Sommen, J.J. van der and W. Geirnaert (1988). On the continuity of aquifer systems on the crystalline of Burkina Faso. in: I. Simmer (ed.), Estimation of Natural Groundwater Recharge, NATO ASI Series Vol.222, p.29-45. Vescovi, F.D., S. Duadze and G. Menz (2002). Use of remote sensing for land use and natural resources investigations in the Volta basin. GLOWA Project, University of Bonn. ZEF (2002). GLOWA Volta Phase II. Zentrum für Entwicklungsforschung.

1
Appendix 1a: Metadata for river flow stations in Burkina Faso, White Volta & Oti (Kam, 2002) IDENTIFICATION DES STATIONS HYDROMETRIQUES
BASSIN VERSANT DU NAKANBE
N° Superficie
Bassin VersantKm² (2)
Cours d’eau (3)
Nom de la station (4)
Coordonnées (5)
Ancien Code ( précédent)
(6)
Code OMM Proposé
p/c 2001 (7)
Année création ( ouverture)
(8)
Equipement station E/LG
(9)
Nature station N/D
(10)
Objectif (11)
Observations (12)
1 16965 Nakanbé Bissiga 12°46' N 01°09' W 19315140 03/1975 LG D S
2 2375 Nakanbé Rambo 13°36' N 02°04 N 1931420 19315010 1983 LG D S
3 20800 Nakanbé Wayen 12°23' N 01°05' W 1931725 19315160 1955 LG D Stat témoin
Ressces en eau S
4 33120 Nakanbé Bagré 11°27' N 00°33' W 1931830 19315300 05/1974 LG D Etudes Barrage
hydroélectrique F
5 ………… Nakanbé Ziga 12°33'20" N 01°04’W 19315150 1984 LG D Etudes site
barrage F
6 3960 Nakanbé Tampelga 13°07'54" N 01°17' W 19315135 1997 LG D corrélation
avec Bissiga
7 8000 Nakanbé Dourou 13°01' N 02°0 W 19315021 1996 E N ?
8 34 Petit Bagré 11°28’40’’N 0°32’W 1931760 19315310 ~1984 Hydraulique
agricole S
9 30200 Nazinon Niaogho 11°46' N 00°45' W 1931770 19315260 06/1963 LG D S
10 3400 Nakanbé Ramsa 13°29'35" N 02°06'53" W 19315020 1983 LG D F
11 4540 Nazinon Dakaye 11°46' N 01°36' W 1931565 19316020 04/1975 LG D S
12 7600 Nazinon Nobéré 11°26' N 01°11' W 1931695 19316030 1965 LG D S
13 1210 Nazinon Sakoinsé 12°12'N 02°01' W 1931535 19316010 1963/1975 LG D F
14 2100 Massili Gonsé 12°29' N 01°24' W 1931590 19315200 1975 LG D S
15 2120 Massili Loumbila 12°29' N 01°24' W 1931650 19315190 1956 E N Stat. témoin
AEP Ouaga S
16 4050 Nouhao Bittou 11°11' N 1931845 19315330 1973 LG D S
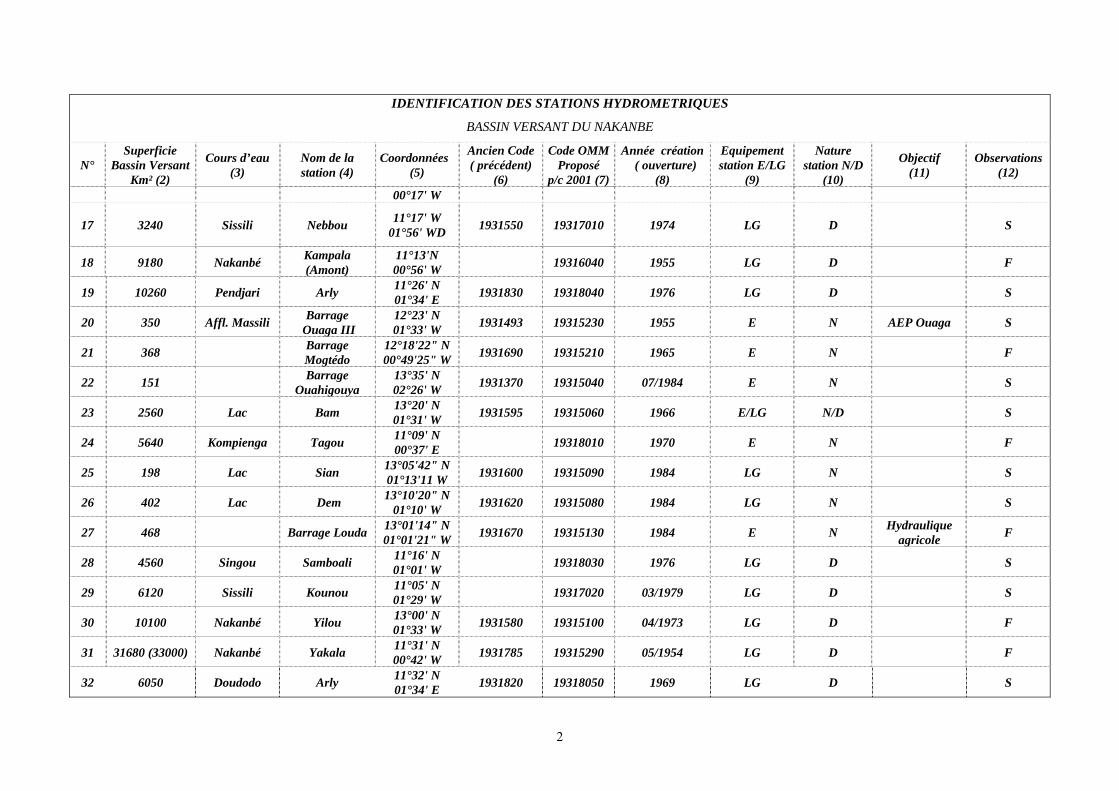
2
IDENTIFICATION DES STATIONS HYDROMETRIQUES
BASSIN VERSANT DU NAKANBE
N° Superficie
Bassin VersantKm² (2)
Cours d’eau (3)
Nom de la station (4)
Coordonnées (5)
Ancien Code ( précédent)
(6)
Code OMM Proposé
p/c 2001 (7)
Année création ( ouverture)
(8)
Equipement station E/LG
(9)
Nature station N/D
(10)
Objectif (11)
Observations (12)
00°17' W
17 3240 Sissili Nebbou 11°17' W 01°56' WD 1931550 19317010 1974 LG D
S
18 9180 Nakanbé Kampala (Amont)
11°13'N 00°56' W 19316040 1955 LG D F
19 10260 Pendjari Arly 11°26' N 01°34' E 1931830 19318040 1976 LG D S
20 350 Affl. Massili Barrage Ouaga III
12°23' N 01°33' W 1931493 19315230 1955 E N AEP Ouaga S
21 368 Barrage Mogtédo
12°18'22" N 00°49'25" W 1931690 19315210 1965 E N F
22 151 Barrage Ouahigouya
13°35' N 02°26' W 1931370 19315040 07/1984 E N S
23 2560 Lac Bam 13°20' N 01°31' W 1931595 19315060 1966 E/LG N/D S
24 5640 Kompienga Tagou 11°09' N 00°37' E 19318010 1970 E N F
25 198 Lac Sian 13°05'42" N 01°13'11 W 1931600 19315090 1984 LG N S
26 402 Lac Dem 13°10'20" N 01°10' W 1931620 19315080 1984 LG N S
27 468 Barrage Louda 13°01'14" N 01°01'21" W 1931670 19315130 1984 E N Hydraulique
agricole F
28 4560 Singou Samboali 11°16' N 01°01' W 19318030 1976 LG D S
29 6120 Sissili Kounou 11°05' N 01°29' W 19317020 03/1979 LG D S
30 10100 Nakanbé Yilou 13°00' N 01°33' W 1931580 19315100 04/1973 LG D F
31 31680 (33000) Nakanbé Yakala 11°31' N 00°42' W 1931785 19315290 05/1954 LG D F
32 6050 Doudodo Arly 11°32' N 01°34' E 1931820 19318050 1969 LG D S

3
IDENTIFICATION DES STATIONS HYDROMETRIQUES
BASSIN VERSANT DU NAKANBE
N° Superficie
Bassin VersantKm² (2)
Cours d’eau (3)
Nom de la station (4)
Coordonnées (5)
Ancien Code ( précédent)
(6)
Code OMM Proposé
p/c 2001 (7)
Année création ( ouverture)
(8)
Equipement station E/LG
(9)
Nature station N/D
(10)
Objectif (11)
Observations (12)
33 10700 Nazinon Ziou 11°05'46"N 00°42'12" 1931681 19316050 1990 LG D S
34 11360 Nakanbé Yabo 12°59' N 01°28' W 1931530 19315110 1984 E D F
35 972 Tcherbo Bagré 11°36' N 01°34' W 1931816 19315320 1976 LG D
S
36 6984
Barrage de Kompienga
11°05’N 0°43’E 19318020 1988 LG N S
37 28 Barrage Napagtenga
12°13'31" N 01°21'14" W 19315570 19315250 1966 E N F
38 470 (Massili) Barrage Nagbangré
12°11'32" N 01°24'14" W 1931560 19315240 1983 E N F
39 66,3 Bge Koubri II 12°12'16" N 01°21'07" N 19315241 1995 E N F
40 148 Bge Wedbila 12°08' N 01°25' W 19311815 19315242 1986 LG N F
41 11800 Mané 12°58' N 01°20' W 19315120 06/1955 E D F
42 2536 Dougoulamondi
Komtoega nouvelle
11°54' 34’’N 00°41' W 1931720 19315270 1994 LG D S
43 100 Bge Tensobentenga
11°59' N 00°16' W 19315271 1989 E N F
44 102 Bge Itengué 12°12' N 00°23' W 19315272 1989 E N S
45 272 Tcherbo Sanogho 11°43' N 00°33' 35" W 19315340 1994 LG D S
46 (94) Barrage Manga (Louré)
11°40' N 01°02'33" W 19315295 1989 E N S
47 44 Bge Pibaoré 12°54' N 00°49' W 19315122 1995 E N S
48 1000 Bge Korsimoro 12°49' N 01°02' W 19315121 1989 E N F
49 1110 Kourigui Niessega 13°07' N 19315025 1995 E D S

4
IDENTIFICATION DES STATIONS HYDROMETRIQUES
BASSIN VERSANT DU NAKANBE
N° Superficie
Bassin VersantKm² (2)
Cours d’eau (3)
Nom de la station (4)
Coordonnées (5)
Ancien Code ( précédent)
(6)
Code OMM Proposé
p/c 2001 (7)
Année création ( ouverture)
(8)
Equipement station E/LG
(9)
Nature station N/D
(10)
Objectif (11)
Observations (12)
02°21' W
50 660 Barrage Seguénega
13°28' N 01°57' W 19315026 1995 E N F
51 400 Bge Titao 13°46'37" N 02°04' W 19315011 1989 E N F
52 70 Bge Sylia 13°44'14" N 02°10' W 19315012 1989 E N F
53 450 Bge Tougou 13°40' 47" N 02°12'47" W 19315050 1982 E N F
54 151
Bge Goinré 13°37'28" N 02°26'34" 19315030 1985 E N S
55 245 Bge Koulniéré 13°14'26" N 01°42'03"W 19315053 08/1989 E N Agricole F
56 192 Barrage de Donsé
12°34'47" N 01°24'27" W 19315180 1983 E N F
57 72 Bge Nagréongo 12°29'36" N 01°10'21" W 19315155 1995 E N F
58 175 Bge Tamasgo 13°15' N 01°16' W 1931640 19315070 07/1984 E N F
59 22 Bge Gha 13°12'38" N 01°17' W 19315065 1995? E N F
60 450 Bourzanga 13°40' N 01°33' W 19315051 1990 E N F
61 33120 Barrage de Bagré
11°28'38" N 00°32'44" W 19315310 1994 E N S
62 Bagré aval 11°28'38" N 00°32'44" W 19315311 1996 E D Débit turbiné S
63 Koulpélé Niarba 11°41' N 00°52' W 19315280 ? D Etude de
barrage S
64 198 Bge Pabré 12°30'20" N 01°35' W 19315170 1983 E N F
65 Koulpélégo Gonaba Amont 11°29’17’’N 19318017 4/1984 LG D S

5
IDENTIFICATION DES STATIONS HYDROMETRIQUES
BASSIN VERSANT DU NAKANBE
N° Superficie
Bassin VersantKm² (2)
Cours d’eau (3)
Nom de la station (4)
Coordonnées (5)
Ancien Code ( précédent)
(6)
Code OMM Proposé
p/c 2001 (7)
Année création ( ouverture)
(8)
Equipement station E/LG
(9)
Nature station N/D
(10)
Objectif (11)
Observations (12)
0°21’23’’E
66 ’’ Gonaba aval 11°28’N 0°23’39’’E 19318018 1984 D S
67 150 Bge Kamboinsé 12°27’23’’N 1°33’09’’W 19315176 ? E N F
68 434?/125? Bge Boulbi 12°14’11’’N 1°02’22’’W 19315237 ? E N F
69 Kompienga Kompienga aval 11°05’N 0°43’E 19318021 E S
Legend: D=Discharge (Débits); N=Water Level (Niveau); LG=Water Level Recorder (Liminigraphe); S=active in 2000 (Suivi en 2000); F=closed (Fermée); E=stageboard (Echelle limnimétrique)

6
PARCOURS CHRONOLOGIQUE DES STATIONS HYDROMETRIQUES DU BASSIN VERSANT DU NAKANBE
Années
N° Station/BR 1955
1956
1957
1958
1959
1960
1961
1962
1963
1964
1965
1966
1967
1968
1969
1970
1971
1972
1973
1974
1975
1976
1977
1978
1979
1980
1981
1982
1983
1984
1985
1986
1987
1988
1989
1990
1991
1992
1993
1994
1995
1996
1997
1998
1999
2000
2001
1 Bissiga -- -- -- -- -- -- -- -- -- -- -- -- -- -- -- -- -- -- -- -- -- -- -- -- --
2 Rambo -- -- -- -- -- -- -- -- -- -- -- -- -- -- -- -- -- -- --
3 Ramsa -- -- -- -- -- -- -- -- -- -- -- -- -- -- -- --
4 Wayen -- -- -- -- -- -- -- -- -- -- -- -- -- -- -- -- -- -- -- -- -- -- -- -- -- -- -- -- -- -- -- -- -- -- -- -- --
5 Bagré -- -- -- -- -- -- -- -- -- -- -- -- -- --
6 Ziga -- -- -- -- --
7 Tampelga -- -- -- -- --
8 Dourou -- -- -- --
9 Petit Bagré -- -- -- -- -- -- -- -- -- -- -- -- -- -- -- -- -- --
10 Niaogho -- -- -- -- -- -- -- -- -- -- -- -- -- -- -- -- -- -- -- -- -- -- -- -- -- -- -- -- --
11 Gonsé -- -- -- -- -- -- -- -- -- -- -- -- -- -- -- -- -- -- -- -- -- -- --
12 Loumbila -- -- -- -- -- -- -- -- -- -- -- -- -- -- -- -- -- -- -- -- -- -- -- -- -- -- -- -- -- -- -- -- -- -- -- --
13 Bge Ouaga 1 -- -- -- -- -- -- -- -- -- -- -- -- -- -- -- -- -- -- -- -- -- -- -- -- -- -- -- -- -- -- --
14 Bge Ouaga 2 -- -- -- -- -- -- -- -- -- -- -- -- -- -- -- -- -- -- -- -- -- -- -- -- -- -- -- -- -- -- -- -- -- --
15 Bge Ouaga3 -- -- -- -- -- -- -- -- -- -- -- -- -- -- -- -- -- -- -- -- -- -- -- -- -- -- -- -- -- -- -- -- -- -- -- -- -- -- --
16 Mogtédo -- -- -- -- -- -- -- -- -- -- -- -- -- -- -- -- -- -- -- -- -- -- --
17 Ouahigouya -- -- -- -- -- -- -- -- -- -- -- -- -- --
18 Goinré -- -- -- -- -- -- -- -- -- -- -- -- -- -- -- -- --
19 Lac Sian -- -- -- -- -- -- -- -- -- -- -- -- -- --
20 Lac Dem -- -- -- -- -- -- -- -- -- -- -- -- --
21 Lac Bam -- -- -- -- -- -- -- -- -- -- -- -- -- -- -- -- -- -- -- -- -- -- -- -- -- -- -- -- -- -- -- -- -- -- --
22 Louda -- -- -- -- -- -- -- -- -- -- --
23 Yilou -- -- -- -- -- -- -- -- -- -- -- -- -- --
24 Yabo -- -- -- -- --
25 Yakala -- -- -- -- -- -- -- -- -- -- -- -- -- -- --
26 Tcherbo/Bagré -- -- -- -- -- -- -- -- --
27 Npagatenga -- -- -- -- -- -- -- -- -- -- -- -- -- -- -- -- -- -- -- -- -- -- -- -- -- --
28 Nagbangré -- -- -- -- -- -- -- -- -- -- --
29 Koubri II -- -- --

7
PARCOURS CHRONOLOGIQUE DES STATIONS HYDROMETRIQUES DU BASSIN VERSANT DU NAKANBE Années
N° Station/BR 1955
1956
1957
1958
1959
1960
1961
1962
1963
1964
1965
1966
1967
1968
1969
1970
1971
1972
1973
1974
1975
1976
1977
1978
1979
1980
1981
1982
1983
1984
1985
1986
1987
1988
1989
1990
1991
1992
1993
1994
1995
1996
1997
1998
1999
2000
2001
30 Ouédbila -- -- -- -- -- --
31 Mané -- -- -- -- -- -- -- -- -- -- --
32 Komtoèga -- -- -- -- -- -- -- --
33 Donsé -- -- -- -- -- 34 Kampala Amont -- -- -- --
35 Sakoinsé -- -- -- -- -- -- -- -- -- -- -- -- -- -- -- -- -- -- -- -- --
36 Dakaye -- -- -- -- -- -- -- -- -- -- -- -- -- -- -- -- -- -- -- -- -- -- -- -- --
37 Nobéré -- -- -- -- -- -- -- -- -- -- -- -- -- -- -- -- -- -- -- -- -- -- -- -- -- -- -- -- -- -- -- --
38 Ziou -- -- -- -- -- -- -- -- --
39 Bittou -- -- -- -- -- -- -- -- -- -- -- -- -- -- -- -- -- -- -- -- -- -- -- -- -- -- -- --
40 Nebbou -- -- -- -- -- -- -- -- -- -- -- -- -- -- -- -- -- -- -- -- -- -- -- --
41 Kounou -- -- -- -- -- -- -- -- -- -- -- -- -- -- -- --
42 Samboali -- -- -- -- -- -- -- -- -- -- -- -- -- -- -- -- -- -- -- --
43 Doudodod/Arly -- -- -- -- -- -- -- -- -- -- -- -- -- -- -- -- -- -- -- -- -- -- --
44 Pendjari/Arly -- -- -- -- -- -- -- -- -- -- -- -- -- -- -- -- -- -- -- --
45 Tagou -- -- -- -- --
46 Sanogho -- -- -- -- -- -- -- --
47 Séguénega -- -- -- --
48 Titao -- -- -- -- -- -- -- --
49 Silia -- -- -- -- -- -- -- --
50 Tougou -- -- -- -- -- -- -- -- -- -- -- -- -- -- -- -- -- -- -- --
51 Koulniéré -- -- -- -- -- -- -- -- -- -- --
52 Nagréongo -- -- --
53 Tamasgo -- -- -- -- -- -- -- -- --
54 Gah --
55 Bourzanga -- -- -- --
56 Gonaba Amont -- -- -- -- -- -- --
57 Gonaba Aval -- -- -- -- -- -- --
58 Bge Bagré -- -- -- -- -- -- -- -- --
59 Bagré Aval -- -- -- -- --

8
PARCOURS CHRONOLOGIQUE DES STATIONS HYDROMETRIQUES DU BASSIN VERSANT DU NAKANBE Années
N° Station/BR 1955
1956
1957
1958
1959
1960
1961
1962
1963
1964
1965
1966
1967
1968
1969
1970
1971
1972
1973
1974
1975
1976
1977
1978
1979
1980
1981
1982
1983
1984
1985
1986
1987
1988
1989
1990
1991
1992
1993
1994
1995
1996
1997
1998
1999
2000
2001
60 Tensobentenga -- -- -- --
61 Itengué -- -- -- -- -- -- -- --
62 Gonaba Aval -- -- -- -- -- -- --
63 Manga ( Louré) -- -- -- -- -- -- -- --
64 Bge Korsimoro -- -- -- --
65 Niésséga -- -- -- -- -- --
66 Moro Naba -- -- -- -- -- -- -- --
67 Bge Pibaoré -- -- -- --
68 Bge Boulbi -- -- -- -- -- --
69 Bge Kamboinsé -- -- -- -- -- -- --
70 Bge Kompienga -- -- -- -- -- -- --
71 Kompienga Aval -- --
72 Kompienga site -- -- -- -- -- -- 73 Pont Université --
74 Canal Université -- Total 3 7 6 6 5 4 6 7 8 8 13 15 13 13 7 5 3 5 6 9 11 12 11 17 19 22 22 25 31 39 42 43 42 39 39 40 39 33 22 26 39 44 43 35 32 35 36

9
Appendix 1a: Metadata for river flow stations in Burkina Faso, Black Volta (Kam, 2002) IDENTIFICATION DES STATIONS HYDROMETRIQUES
BASSIN VERSANT DU MOUHOUN
N° Superficie
Bassin Versant (2)
Cours d’eau (3)
Nom de la station(4)
Coordonnées (5)
Ancien Code (précédent)
(6)
Code OMM Proposé
(7)
Année création (ouverture)
(8)
Equipement station E/LG
(9)
Nature station
N/D (10)
Objectif (11)
Observations (12)
1 1100 Plandi Lanviéra 11°16’N 04°56’W 19311020 1961 LG D S
2 780 Dienkoa Guéna 11°05’N 04°41’N 19311040 1962 LG D S
3 2816 Mouhoun Banzo 11°19’N 04°49’W 19311050 1959 LG D S
4 4580 Mouhoun Samandéni 11°28’N 04°28’W 19311100 1955 LG D S
5 405 Kou Nasso (Amont) 11°12’N’ 04°26’W 19311200 1961 LG D S
6 412 Kou Dindéresso 11°13‘ N 04°31‘ W 19311230 1975 LG D S
7 632 Kou Diaradougou 11°18' N 04°31'W 19311240 1959 LG D S
8 Canal porcherie 11°21’20’’ N 04°24’ W 19311250 1982 (83?) E D S
9 971 Kou Badara 11°22’N 04°22’W 19311260 1955 LG D S
10 14800 Mouhoun Nwokuy PT 12°31’N 03°33’W 19311500 1955 LG D S
11 Mouhoun Nwokuy Aval 12°31’29’’ N 03°32’43’’ W 19311510 1986 LG D
Calcul hydraulique / Manning S.
S
12 Sourou Barrage Léry 12°45’N 03°26’W 19312050 1976 E N S
13 Sourou Pt Léry Nord 12°45’N’ 03°26’W 19312060 09/1952 E D F
14 Sourou Yaran 12°58’N’ 03°27’W 19312040 1955 E N Agriculture
+ AEP S
15 47000 Sourou Confluent
Sourou/Mouhoun
12°45’N 03°25’ W 19312070 1955 E D F

10
IDENTIFICATION DES STATIONS HYDROMETRIQUES
BASSIN VERSANT DU MOUHOUN
N° Superficie
Bassin Versant (2)
Cours d’eau (3)
Nom de la station(4)
Coordonnées (5)
Ancien Code (précédent)
(6)
Code OMM Proposé
(7)
Année création (ouverture)
(8)
Equipement station E/LG
(9)
Nature station
N/D (10)
Objectif (11)
Observations (12)
16 Sourou Di 13°11’N 03°25’W
19312020 1955 E N F
17 (47000) Mouhoun Manimenso 12°44’32’’ N 03°24’W 19313030 1955 E D St. témoin
AEP Kdgou S
18 1890 Vranso Ninion 12°31’N 02°23’W 19313120 1971 LG D S
19 32700 Mouhoun Ténado 12°13’N 02°50’W 19313200 1975 LG D St. témoin
AEP Kdgou S
20 37140 Mouhoun Boromo 11°47’N 02°55’W 19313300 1955 LG D S
21 1720 Bolo Poura 11°42’53’’ N 02°44’6’’ W 19313320 1984 LG D S
22 3510 (3780 ird) Grand Balé Pa 11°36’N 03°11’W 19313400 1966 LG D S
23 50820 Mouhoun Ouessa 11°01’N 02°49’W 1931310 19313600 05/1969 LG D S
24 6345 Bougouriba Dan 10°55’N 03°39’W 1931130 19314100 1970 LG D S
25 12200 Bougouriba Diébougou 10°56’N 03°10’W 1931250 19314200 1955 LG D S
26 66540 (sans Sourou) Mouhoun Dapola 10°34’N
02°55’W 1931270 19314750 1955 LG D S
27 5630 Bambassou Batié 09°59’N 02°54’W 1931280 19314800 06/1971 LG D S
28 87100 Mouhoun Noumbiel 09°41'N 02°49' W 1931330 19314900 07/1975 LG D S
29 ? Mare aux Hypopotames
11°33’50’’ N 04°09’10’’ W 19311390 E N Stat témoin
Zone humid S
30 1600 Confuent Kou/Niamé
11°21‘10‘‘ N 04°20‘10‘‘ W 19311330
9/1980 LG D Assain. vallée du Kou
S
31 ? Niamé Pesso 11°19'15'' N 04°15'26'' W 19311310 Zone
humide S

11
IDENTIFICATION DES STATIONS HYDROMETRIQUES
BASSIN VERSANT DU MOUHOUN
N° Superficie
Bassin Versant (2)
Cours d’eau (3)
Nom de la station(4)
Coordonnées (5)
Ancien Code (précédent)
(6)
Code OMM Proposé
(7)
Année création (ouverture)
(8)
Equipement station E/LG
(9)
Nature station
N/D (10)
Objectif (11)
Observations (12)
32 ? Niamé Desso 11°21’10 N 04°17‘15‘‘ W 19311320 D Zone
humide S
33 ? Kou Guinguette 11°11’ N 04°26’25’’ W 19311190 D Source S
34 13600 Mouhoun Tourouba 12°22’N 03°43’W 19311450 1954 D F
35 49500 Mouhoun Niompourou Douroula
12°36’ N 03°15’ W 19313050 09/1952 E D F
36 6700 Vounhou Bourasso 12°37’ N 03°41’ W 19311440 8/1962 E D F
37 ? Mouhoun Poura 19313750 1984 D AEP Mine F
38 2500 Vranso Poun 12°26'N 02°35'W 19313140 1977 LG D F
39 2500 Sourou Pont de Léry Sud 12°45’N’ 03°26’W 19312060 09/1952 E D S
40 Sourou Toumani 12°47'N 03°27'W 19312050 10/1952 E F
41 405 Kou Nasso milieu 11°12’N’ 04°26’W 19311201 1961 LG D S
42 405 Kou Nasso aval 11°12’N’ 04°26’W 19311202 1961 LG D S
43 166 Barrage Sambisgo
12°09’ N 02°21’ W 19313210 ? E N AEP Kdgou S par ONEA
44 Poni Gaoua 10°19’45’’N 03°11’50’’W 19314600 ? D F
45 ? Pouéné Batié 10°20’N 03’ 12’W 19314950 ? D F
46 ? Kou Kodala 11°03'N 04°26'15''W 19311170 D F
47 162 Yengué Moami 11°03'N
20''N 04°26'30'' W
19311210 D S
48 260 Yengué Nasso 11°12’N’ 19311220 E D S

12
IDENTIFICATION DES STATIONS HYDROMETRIQUES
BASSIN VERSANT DU MOUHOUN
N° Superficie
Bassin Versant (2)
Cours d’eau (3)
Nom de la station(4)
Coordonnées (5)
Ancien Code (précédent)
(6)
Code OMM Proposé
(7)
Année création (ouverture)
(8)
Equipement station E/LG
(9)
Nature station
N/D (10)
Objectif (11)
Observations (12)
04°26’W
49 Mouhoun Lahirasso 11°52'N 04°05'N 19311420 N F
50 38 Farako Pt de Farakoba 11°05'N 04°21'W 19311160 1961 E D F
51 Kou Koumi 11°08' N 04°25'N 19311180 S
Legend: D=Discharge (Débits); N=Water Level (Niveau); LG=Water Level Recorder (Liminigraphe); S=active in 2000 (Suivi en 2000); F=closed (Fermée); E=stageboard (Echelle limnimétrique)

13
PARCOURS CHRONOLOGIQUE DES STATIONS HYDROMETRIQUES DU BASSIN VERSANT DU MOUHOUN
Années
N° Station/BR 1955
1956
1957
1958
1959
1960
1961
1962
1963
1964
1965
1966
1967
1968
1969
1970
1971
1972
1973
1974
1975
1976
1977
1978
1979
1980
1981
1982
1983
1984
1985
1986
1987
1988
1989
1990
1991
1992
1993
1994
1995
1996
1997
1998
1999
2000
2001
1 Sambisgo -- -- --
2 Guéna -- -- -- -- -- -- -- -- -- -- -- -- -- -- -- -- -- -- -- -- -- -- -- -- -- -- --
3 Lanviéra -- -- -- -- -- -- -- -- -- -- -- -- -- -- -- -- -- -- -- -- -- -- -- -- -- --
4 Banzo -- -- -- -- -- -- -- -- -- -- -- -- -- -- -- -- -- -- -- -- -- -- -- -- -- -- -- -- -- -- -- -- -- -- -- -- -- -- -- -- -- -- --
5 Samandéni -- -- -- -- -- -- -- -- -- -- -- -- -- -- -- -- -- -- -- -- -- -- -- -- -- -- -- -- -- -- -- -- -- -- -- -- -- -- -- -- -- -- -- -- -- -- --
6 Koumi -- -- -- -- -- -- -- -- -- -- -- --
7 Dindérésso -- -- -- -- -- -- -- -- -- -- -- -- -- --
8 Nasso Amont -- -- -- -- -- -- -- -- -- -- -- -- -- -- -- -- -- -- --
9 Bana --
10 Badara -- -- -- -- -- -- -- -- -- -- -- -- -- -- -- -- -- -- -- -- -- -- -- -- -- -- -- -- -- -- -- -- --
11 Confl Niamé Baoulé -- -- -- -- -- -- -- -- -- -- -- -- -- -- -- -- -- -- --
12 Nwokuy Amont -- -- -- -- -- -- -- -- -- -- -- -- -- -- -- -- -- -- -- -- -- -- -- -- -- -- -- -- -- -- -- -- -- -- -- -- -- -- --
13 Bourasso --
14 Nwokuy Aval -- -- -- -- -- -- -- -- --
15 Bge Léry -- -- -- -- -- -- -- -- -- -- -- -- -- -- -- -- -- -- -- -- -- --
16 Yaran -- -- -- -- -- -- -- -- -- -- -- -- -- -- -- -- -- -- -- -- -- -- -- -- -- -- -- -- -- -- -- -- -- -- -- -- -- -- -- -- -- -- -- -- -- -- --
17 Diaradougou -- -- -- -- -- -- -- -- -- -- --
18 Léry Nord -- -- -- -- -- -- -- -- -- -- -- -- -- -- -- -- -- -- -- -- -- -- -- -- -- -- -- -- -- -- -- -- -- -- -- -- -- -- -- -- -- -- -- -- -- -- --
19 Manimenso -- -- -- -- -- -- -- -- -- -- -- -- -- -- -- -- -- -- -- -- -- -- -- -- -- -- -- -- -- -- -- -- -- -- -- -- -- -- -- -- -- -- -- -- -- -- --
20 Confluent S/Mhn -- -- -- -- -- -- -- -- -- -- -- -- -- -- -- -- -- -- -- -- -- -- -- -- -- -- -- -- -- -- -- -- -- -- -- -- -- -- -- -- -- -- -- -- --
21 Niampourou -- -- -- -- -- -- -- -- -- -- -- -- -- --
22 Tourouba -- -- -- -- -- -- -- -- -- -- -- -- --
23 Baï -- -- -- -- -- -- --
24 Di -- -- -- -- --
25 Tenado -- -- -- -- -- -- -- -- -- -- -- -- -- -- -- -- -- -- -- -- -- -- -- -- --
26 Ninion -- -- -- -- -- -- -- -- -- -- -- -- -- -- -- -- -- -- -- -- -- -- --
27 Boromo -- -- -- -- -- -- -- -- -- -- -- -- -- -- -- -- -- -- -- -- -- -- -- -- -- -- -- -- -- -- -- -- -- -- -- -- -- -- -- -- -- -- -- -- -- -- --
28 Bolo/Poura -- -- -- -- -- -- -- -- -- -- -- -- -- -- -- -- -- --
29 Ouessa -- -- -- -- -- -- -- -- -- -- -- -- -- -- -- -- -- -- -- -- -- -- -- -- -- -- -- -- -- -- -- -- --

14
PARCOURS CHRONOLOGIQUE DES STATIONS HYDROMETRIQUES DU BASSIN VERSANT DU MOUHOUN Années
N° Station/BR 1955
1956
1957
1958
1959
1960
1961
1962
1963
1964
1965
1966
1967
1968
1969
1970
1971
1972
1973
1974
1975
1976
1977
1978
1979
1980
1981
1982
1983
1984
1985
1986
1987
1988
1989
1990
1991
1992
1993
1994
1995
1996
1997
1998
1999
2000
2001
30 Dapola -- -- -- -- -- -- -- -- -- -- -- -- -- -- -- -- -- -- -- -- -- -- -- -- -- -- -- -- -- -- -- -- -- -- -- -- -- -- -- -- -- -- -- -- -- -- --
31 Dan -- -- -- -- -- -- -- -- -- -- -- -- -- -- -- -- -- -- -- --
32 Diébougou -- -- -- -- -- -- -- -- -- -- -- -- -- -- -- -- -- -- -- -- -- -- -- -- -- -- -- -- -- -- -- -- -- -- -- -- -- -- -- -- -- -- -- --
33 Batié -- -- -- -- -- -- -- -- -- -- -- -- -- -- -- -- -- -- -- -- -- -- -- -- -- -- -- --
34 Kodara -- --
35 Noumbiel -- -- -- -- -- -- -- -- -- -- -- -- -- -- -- -- -- -- -- -- -- -- -- -- --
38 Pa -- -- -- -- -- -- -- -- -- -- -- -- -- -- -- -- -- -- -- -- -- -- --
39 Poun -- --
40 Kouri/52 -- -- -- -- -- -- -- -- -- -- -- -- -- -- -- -- -- -- -- -- -- -- -- -- -- -- --
41 Sakabi -- --
42 Bourasso --
43 Lahirasso -- -- --
44 Farakoba -- -- -- --
45 Pont Léry sud -- -- -- -- -- -- -- -- -- -- -- -- -- -- -- -- -- -- -- -- -- -- -- -- -- -- -- -- -- -- -- -- -- -- -- -- -- -- -- -- -- -- -- -- -- -- --
46 Mouhoun à Poura -- -- -- -- -- -- -- --
47 Desso -- -- --
48 Guiédougou -- -- -- --
49 Lawra ( GH) -- -- -- -- -- --
50 Bama -- -- -- -- -- -- -- --
51 Toumani -- -- -- -- -- -- -- -- -- --
53 Yengué/ Nasso --
54 Mare aux hypo -- -- -- -- -- -- -- -- -- --
TOTAL 15 18 17 19 19 20 19 23 22 21 19 17 17 16 17 17 17 17 16 18 18 19 20 20 21 22 23 21 21 27 30 31 31 30 25 27 28 32 29 26 23 26 25 26 26 25 25

15
Appendix 1b: Metadata for river flow stations in the Volta Basin in Ghana (source: HSD)
Sub Basins River Type Station Name StationID Area Gauge Zero Region Project Established Closed
Afram Kyeremfa Tributary Kyeremfaso U/S 1014005 466.00 1038. ft Ashanti GoG 01-Dec-71 Afram Afram Tributary Aframso 1014002 493.00 83.54 ft Ashanti WRIS 1-Jan-67 Afram Kowire Tributary Agogo 1014009 139.00 885.4 ft Ashanti GoG 1-Jan-67 1-Mar-90 Afram Awura Tributary Awuraso 1014004 2.00 ft Ashanti GoG 10-Jan-69 1-Oct-93 Afram Chirade Tributary Chiradeso 1014003 116.00 973.0 ft Ashanti GoG 1-Jan-67 31-Dec-81Afram Afram Tributary Drabonso 1014010 Ashanti GoG 17-Dec-75 31-Dec-79Afram Drobon Tributary Drobonso 1014011 703.00 92.34 ft Ashanti GoG 01-Feb-80 30-Jun-84 Afram Ongwam Tributary Kumawu 1014006 83.63 ft Ashanti GoG 15-Oct-71 Afram Kyeremfa Tributary Kyeremfaso D/S 1014008 133.00 90.97 ft Ashanti GoG 22-Jun-72 Afram Sumampa Tributary Mampong (Ash) 1014007 173.00 981.1 ft Ashanti GoG 22-Jun-72 Afram Afram Tributary Mankrong 1014001 101.00 113.0 ft Ashanti GoG 10-Jan-63 01-Feb-78Aklakpa Aklakpa River Aflavenu 1000023 1648.00 Volta GoG 24-Feb-76 1-Jul-78 Alabo Alabo Tributary Podoe 1015001 4037.00 43.36 m Volta WRIS 25-Apr-62 Asukawkaw Asukawkaw Tributary Dodo Tamale 1011006 153.00 189.3 m Volta WRIS 13-Mar-78 Asukawkaw Asukawkaw Tributary Breniasi 10111002 0.00 Volta GoG 1-Jan-63 04-Aug-64Asukawkaw Asukawkaw Tributary Asukawkaw 1011003 262.00 83.02 m Volta WRIS 10-Aug-65 Asukawkaw Wawa Tributary Ahamansu 1011004 228.00 311.5 ft Volta GoG 13-Mar-78 Asukawkaw Menu Tributary Menuso 1011005 43.00 515.2 ft Volta GoG 13-Mar-78 Asukawkaw Asukawkaw Tributary Worawora 10110001 1622.00 Volta GoG 27-Jul-62 28-Feb-66Black Volta Kuon Tributary Kunyukuon 1006011 43.00 772.4 ft Upper GoG 12-Jul-68 Black Volta Sorri Tributary Kalbuipe 1006008 51.00 94.13 m Northen WRIS 10-Apr-63 Black Volta Pale Tributary Pise 1006013 141.00 759.9 ft Upper GoG 17-May-70 Black Volta Dagare Tributary Mahatanga 1006012 88.16 ft Upper GoG 23-Oct-71 Black Volta Black Volta Tributary Buipe 1006004 52283.0 235.2 ft Northen GoG 26-May-58 Black Volta Sorri Tributary Damongo 1006019 387.00 Northen GoG 01-Apr-76 01-Feb-77Black Volta Kamba Tributary Panyani 1006017 37.00 82.41 ft Upper GoG 5-Jun-75 Black Volta Pale Tributary Pisi 1006016 104.00 83.34 ft Upper GoG 1-Oct-71 Black Volta Black Volta Tributary Lawra 1006002 49714.0 224.1 m Upper WRIS 01-May-51 Black Volta Black Volta Tributary Dab 1006006 46728.0 721.3 ft Upper GoG 03-Apr-63 01-Feb-79Black Volta Black Volta Tributary Chache 1006007 43460.0 202.5 m Northen WRIS 06-Apr-63 Black Volta Dagare Tributary Jingu 1006015 93.36 ft Upper GoG 01-0ct-71 31-Aug-77Black Volta Black Volta Tributary Bui D/S 1006009 461.00 101.9 m Northen WRIS 17-Feb-65 Black Volta Black Volta Tributary Bamboi 1006001 34.75 m Northen WRIS 8-Mar-50 Black Volta Kamba Tributary Tampoe 1006014 101.00 851.1 ft Upper GoG 5-Jun-75 Black Volta Tain Tributary Tainso U/S 1006005 42115.0 40.76 m Ashanti WRIS 03-May-62 Black Volta Tain Tributary Tainso D/S 1006010 289.00 540.6 ft Ashanti GoG 1-Jul-67 Black Volta Subin Tributary Subinso 1006018 528.4 ft Ashanti GoG 03-Aug-76 Black Volta Black Volta Tributary Bui U/S 1006003 48300.0 330.1 ft Northen GoG 10-Mar-54 31-Jul-66 Daka Daka Tributary Grube 1008001 3433.00 210.3 ft Northen GoG 1-Jun-57 31-Jan-66 Daka Daka Tributary Sabongida 1008003 352.00 68.45 ft Northen GoG 06-Feb-61 30-Jun-01 Daka Daka Tributary Yendi 1008002 352.00 505.4 ft Northen GoG 01-Apr-58 Daka Tanfi Tributary Tanfiano 1008006 821.00 Ashanti GoG 15-Sep-86 31-Dec-86Daka Daka Tributary Ekumdipe 1008004 597.00 307.9 ft Northen GoG 15-May-63 Daka Daka Tributary New Sabongida 1008005 20.86 m Northen WRIS 01-May-97 Dayi Dayi Tributary Vakpo (Afeyi) 1013001 55.00 260.9 ft Volta GoG 06-Feb-62 Dayi Dayi Tributary Hohoe 1013002 26.00 512.1 ft Volta GoG 21-Feb-62 Dayi Tsi Tributary Soba 1013003 Volta GoG 15-Jul-72 28-Feb-79

16
Dayi Dayi Tributary Gbefi 1013006 113.6 m Volta WRIS 16-Apr-02 Dayi Dayi Tributary New Ayoma 1013004 136..00 850.3 ft Volta GoG 1-Jun-87 Dayi Tsatsadu Tributary Alavanyo 1013005 136.00 432.0 ft Volta GoG 01-May-86 Kulpawn Kulpawn Tributary Kulum 1003003 60.81 ft Upper GoG 7-Jun-65 22-Jul-66 Kulpawn Sissili Tributary Wiase 1003002 36864.0 125.5 m Upper WRIS 08-May-61 Kulpawn Kulpawn Tributary Yagaba 1003001 35003.0 126.3 m Upper WRIS 20-Feb-58 Kulpawn Sissili Tributary Nakong 1003004 2359.00 696.2 ft Upper WRIS 25-Jun-65 Kulpawn Kulpawn Tributary Wahabu 1003005 1254.00 ft Upper GoG 1-Jun-76 01-Feb-78Mole Mole Tributary Lankatere 1005001 98.20 m Northen WRIS 12-Oct-58 Niasia Dindebuo Tributary Gbensi (Walewale) 1004002 58.00 318.3 ft Upper GoG 1-Sep-69 1-Mar-76 Niasia Nasia Tributary Nasia 1004001 853.00 106.8 m Northen WRIS 01-May-51 Oti Kpassa River Kpassa 1010009 105.9 m Volta WRIS 11-Mar-78 Oti Oti Tributary Kpandai 1010005 Northen GoG 30-Jun-65 31-Aug-65Oti Oti Tributary Damanko 1010011 226.2 ft Northen GoG 08-May-79 01-Feb-95Oti Kulaw River Benja 1010007 566.00 77.59 ft Northen GoG 5-Oct-66 01-Feb-81Oti Oti Tributary Kpetchu 1010001 969.00 Northen GoG 27-Jul-52 1-Nov-72 Oti Bonakye Tributary Bonakye 1010010 136.00 464.7 ft Volta GoG 17-May-78 Oti Oti Tributary Sabari 1010003 82.55 m Northen WRIS 6-Jun-59 Oti Kulaw River Zegbeli 1010012 0.00 22.75 m Northen WRIS 23-Feb-99 Oti Oti Tributary Saboba 1010002 310.6 ft Northen GoG 20-Mar-53 Oti Oti Tributary Paliba 1010004 296.2 ft Northen GoG 1-Jul-62 30-Nov-66Oti Pembik River Nabosng 1010008 257.00 25.91 m Upper WRIS 5-Oct-66 Pru Pru Tributary Asauoso 1007004 696.00 82.07 ft Ashanti GoG 16-Dec-71 Pru Pru Tributary Banafour 1007005 184.00 568.0 ft Ashanti GoG 01-Aug-76 30-Jun-82 Pru Pru Tributary Pruso 1007001 2711.00 500.5 ft Ashanti WRIS 01-May-57 Pru Pru Tributary Prang 1007002 2543.00 41.43 m Ashanti WRIS 01-May-57 Pru Fia Tributary Nkoranza 1007003 670.7 ft Ashanti GoG 1-Nov-68 Red Volta Red Volta Tributary Nangoli 1002001 184.1 m Upper WRIS 1-Jul-58 Sene Sene Tributary Seneso 1009001 149.0 ft Ashanti WRIS 9-Mar-00 Volta Volta River Anyanui 1000017 Volta 24-Oct-62 01-Aug-76Volta Volta River Senchi Ferry 1000001 152161. 18.21 ft Eastern GoG 8-Nov-30 31-Dec-48Volta Volta River Senchi-Halcrow 1000009 Volta GoG 5-Jul-54 31-Dec-82Volta Volta River Volta Bridge 1000011 3102.00 42.68 ft Volta GoG 17-Feb-55 31-Dec-82Volta Volta River Aveyime 1000013 -2.44 ft Volta GoG 01-Aug-60 1-Nov-79 Volta Volta River Sogakope 1000016 38.12 ft Volta GoG 18-Oct-62 Volta Volta River Ada 1000020 18.22 ft Volta GoG 12-Sep-63 Volta Volta River Accra Tefle Rd. Gd. 1000024 0.00 Volta GoG 18-Oct-68 15-Oct-70 Volta Volta River Misikrom 1000007 152068. Eastern GoG 23-Jul-51 3-Jun-64 Volta Volta River Adidome 1000019 0.00 Volta GoG 1-Jan-63 30-Apr-66 Volta Volta River Senchi New Gauge 1000003 152161. Eastern GoG 01-Apr-48 07-Feb-55Volta Volta River Amedica 1000018 177.00 0.79 ft Volta GoG 1-Jan-63 30-Apr-82 Volta Volta River Akwamu West 1000002 152130. Eastern GoG 01-May-47 31-Dec-52Volta Volta River Akosombo U/S 1000012 119.00 Eastern GoG 23-Sep-56 Volta Volta River Akosombo D/S 1000015 12.00 30.84 ft Eastern GoG 30-Jun-62 Volta Volta River Ajena Lower 1000010 152085 Eastern GoG 01-Feb-55 30-Jun-64 Volta Volta River Ajena Halcrow 1000004 152085 Eastern GoG 01-Aug-50 30-Jun-64 Volta Volta River Yeji 1000006 125.00 30.32 m Ashanti WRIS 13-May-51 Volta Volta River Accra Tefle Rd. Gd II 1000025 0.00 Volta GoG 18-Oct-68 15-Oct-70 Volta Volta River Kpandu 1000022 Volta GoG 26-May-64 31-Dec-80Volta Volta River Kpong 1000005 152175. -0.04 ft Eastern GoG 01-Apr-51 31-Dec-72Volta Volta River Dodi 1000021 304.00 753.7 ft Volta GoG 06-May-64 01-May-79Volta Volta River Kete-Krachi 1000014 0.00 Volta GoG 22-May-62 31-Dec-76

17
Volta Volta River Obentenya 1000008 125.00 0.01 ft Volta GoG 3-Jul-52 31-Dec-80White Volta White Volta Tributary Sougu 1001020 222.00 78.40 ft Northen GoG 6-Jul-77 White Volta Tamne Tributary Garu 1001011 586.3 ft Upper GoG 1-Sep-66 White Volta Morgo Tributary Nayoko 1001019 594.00 93.86 ft Upper GoG 1-Sep-70 31-Oct-80 White Volta Tono Tributary Navrongo 1001010 78.95 ft Upper GoG 24-Aug-66 31-Dec-76White Volta Diegouro Tributary Navio 1001024 0.00 94.27 m Upper GLO 26-Apr-04 White Volta Yaragatanga Tributary Sumbrungu 1001013 272.00 85.70 ft Upper GoG 1-Sep-66 White Volta Morago Tributary Nankpanduri 1001004 47.00 536.6 ft Upper GoG 1-Jul-58 White Volta Bopare Tributary Tugu 1001004 640.00 352.2 ft Northen GoG 2-Sep-66 1-Nov-90 White Volta Bongtanga Dam Voggo 1001015 158.00 379.6 ft Northen GoG 9-Sep-69 31-Dec-75White Volta Jolo Tributary Aduyeli 1001018 341.00 409.3 ft Northen GoG 01-Aug-70 31-Dec-97White Volta White Volta Tributary Nawuni 1001003 311.6 ft Northen GoG 08-May-53 White Volta Atamore Tributary Bolgatanga 1001012 11.00 537.0 ft Upper GoG 1-Sep-66 31-Dec-79White Volta White Volta Tributary Yarugu 1001008 383.00 981.1 ft Upper GoG 12-Jul-62 19-Apr-89 White Volta Goshie Dam Diare 1001017 32.00 Northen GoG 15-Jul-70 31-Dec-75White Volta Pasam Tributary Pagaza 1001009 73.00 354.2 ft Northen GoG 19-Jul-66 1-Mar-91 White Volta White Volta Tributary Yarugu (Kabori) 1001021 317.00 24.69 m Upper WRIS 24-Jun-95 White Volta White Volta Tributary Daboya 1001007 1647.00 86.81 m Northen WRIS 18-Apr-62 White Volta White Volta Tributary Kpasenkpe 1001006 263.00 89.69 m Upper GoG 04-Apr-62 01-Feb-81White Volta White Volta Tributary Pwalugu 1001001 3134.00 123.7 m Upper WRIS 01-May-51 White Volta White Volta Tributary Yarugu (Bazua) 1001022 0.00 Upper GoG 19-Apr-89 31-Dec-99White Volta Atankuidi Tributary Kandiga 1001023 0.00 93.98 m Upper GLO 27-Apr-04 White Volta Sillum Tributary Kumbungu 1001016 233.00 394.4 ft Northen GoG 10-Jul-70 01-Feb-77White Volta Nabogo Tributary Nabogo 1001005 845.00 335.5 ft Northen GoG 01-Apr-62 White Volta White Volta Tributary Yapei 1001002 257.00 76.98 m Northen GoG 01-May-51

18
Appendix 1c: Metadata for river flow stations obtained from GRDC (data available on enclosed cd and locations are plotted on Figure 1)
no. Daily data Monthly data GIS Station Major Country River River Latitude Longitude Area Altitude start end years missing start end years missing Sourcemap station system [degr.] [degr.] [km2] [m asl] [%] [%]
1 Guena BF Black Volta Black Volta
11.080 -4.680 800 383 1962 1983 22 66.03 GRDC
2 Banzo BF Black Volta Black Volta
11.320 -4.820 2816 323 1956 1986 31 9.19 GRDC
3 Nasso BF Kou Black Volta
11.200 -4.430 406 1961 1974 14 6.25 GRDC
4 Badara BF Kou Black Volta
11.370 -4.370 971 1955 1985 31 56.91 GRDC
5 Samandeni BF Black Volta Black Volta
11.470 -4.470 4580 296 1977 1983 7 6.7 1955 1987 33 1.78 GRDC
6 Nwokuy y BF Black Volta Black Volta
12.520 -3.550 14800 1956 1988 33 0.00 GRDC
7 Kouri BF Black Volta Black Volta
12.730 -3.480 20000 248 1955 1982 28 31.08 GRDC
8 Manimenso BF Black Volta Black Volta
12.750 -3.400 20000 247 1956 1984 29 0.00 GRDC
9 Tenado BF Black Volta Black Volta
12.170 -2.820 23700 1976 1985 10 0.00 GRDC
10 Boromo y BF Black Volta Black Volta
11.780 -2.920 37140 238 1955 1991 37 0.70 GRDC
11 Ouessa BF Black Volta Black Volta
11.020 -2.820 50820 1969 1986 18 16.67 GRDC
12 Dan BF Bougouriba Black Volta
10.920 -3.650 6345 275 1977 1983 7 8.1 1970 1985 16 18.18 GRDC
13 Diebougou BF Bougouriba Black Volta
10.930 -3.170 12200 240 1963 1987 25 9.72 GRDC
14 Lawra GH Black Volta Black Volta
10.633 -2.917 93820 224 1975 1995 21 50.6 1951 1974 24 0.00 GRDC
15 Dapola y BF Black Volta Black Volta
10.570 -2.920 66540 228 1977 1977 1 0.0 1951 1991 41 0.63 GRDC
16 Batie BF Bambassou Black Volta
9.980 -2.900 5630 230 1971 1985 15 2.86 GRDC
17 Noumbiel BF Black Volta Black Volta
9.680 -2.770 79700 214 1975 1985 11 27.20 GRDC
18 Vonkoro CI Black Volta Black Volta
9.190 -2.710111500
1979 1993 15 80.8 1979 1982 4 50.00 GRDC
19 Bamboi y GH Black Volta Black Volta
8.150 -2.033134200
35 1975 1995 21 68.2 1950 1974 25 0.00 GRDC
20 Sakoinse BF Red Volta Red Volta
12.200 -2.020 1210 297 1970 1986 17 29.38 GRDC
21 Dakaye BF Red Volta Red Volta
11.780 -1.600 4540 270 1977 1983 7 1.7 1975 1987 13 1.39 GRDC
22 Bagre BF Tcherbo Red Volta
11.600 -1.570 972 1978 1987 10 29.46 GRDC
23 Nobere BF Red Volta Red Volta
11.430 -1.180 7600 254 1965 1991 27 22.48 GRDC
24 Rambo BF Nakambé White Volta
13.600 -2.070 2375 1983 1987 5 0.00 GRDC
25 Yilou BF Nakambé White Volta
13.000 -1.550 10100 280 1977 1982 6 1.2 1973 1983 11 4.24 GRDC
26 Bissiga BF White Volta White Volta
12.750 -1.150 16965 1976 1985 10 5.83 GRDC
27 Wayen y BF Nakambé White Volta
12.380 -1.080 20880 1955 1988 34 27.27 GRDC
28 Niaogho BF Nakambé White Volta
11.770 -0.750 30200 1964 1986 23 18.18 GRDC
29 Yakala BF Nakambé White Volta
11.550 -0.700 33000 1977 1977 1 11.8 1956 1985 30 16.57 GRDC
30 Bittou BF Nouhao White Volta
11.180 -0.280 4050 1974 1986 13 16.22 GRDC
31 Bagre y BF White Volta White Volta
11.250 -0.330 33120 210 1974 1990 17 6.37 GRDC
32 Yarugu GH White Volta White Volta
10.980 -0.400 41550 170 1975 1990 16 83.6 1966 1974 9 0.00 GRDC
33 Nangodi y GH White Volta Red Volta
10.867 -0.617 11570 184 1975 1990 16 92.9 1958 1974 17 0.00 GRDC

19
34 Pwalagu
y GH White Volta White Volta
10.583 -0.850 63350 123 1975 1995 21 73.1 1951 1974 24 0.00 GRDC
35 Nebbou BF Sisili White Volta
11.280 -1.930 3240 1974 1987 14 14.56 GRDC
36 Wiasi GH Sisili White Volta
10.330 -1.350 9500 126 1975 1991 17 77.7 1962 1974 13 0.00 GRDC
37 Yagaba GH Kulpawn White Volta
10.230 -1.283 10600 126 1975 1980 6 41.6 1958 1974 17 3.65 GRDC
38 Nawuni y GH White Volta White Volta
9.700 -1.080 92950 96 1975 1995 21 16.0 1953 1974 22 0.00 GRDC
39 Tagou y BF Kompienga Oti 11.150 0.620 5640 1980 1988 9 0.00 GRDC 40 Tiele BJ Magou Oti 10.720 1.200 836 1961 1992 32 45.7 1961 1992 32 45.24 GRDC 41 Samboali BF Singou Oti 11.280 1.020 4560 1978 1983 6 15.3 1978 1983 6 11.11 GRDC 42 Arly BF Doudodo Oti 11.530 1.420 6050 1978 1987 10 27.36 GRDC 43 Arly BF Pendjari Oti 11.430 1.570 10960 1978 1986 9 35.42 GRDC 44 Porga BJ Pendjari Oti 10.200 0.970 22280 1952 1992 41 29.1 1952 1992 41 23.41 GRDC 45 Mango y TG Oti Oti 10.300 0.470 35650 108 1953 1974 22 0.00 GRDC 46 Koumangou TG Koumangou Oti 10.200 0.450 6730 120 1959 1974 16 0.00 GRDC 47 Lama Kara TG Kara Oti 9.530 1.180 1560 270 1978 1982 5 21.8 1978 1982 5 21.67 GRDC 48 Kpesside TG Kara Oti 9.620 0.950 2787 180 1962 1974 13 0.00 GRDC 49 Sabari y GH Oti Oti 9.280 0.230 58670 83 1959 1974 16 0.00 GRDC 50 Ekumdipe GH Daka Lower
Volta 8.470 -0.220 6810 1975 1995 21 68.1 1963 1974 12 0.00 GRDC
51 Prang GH Pru Lower Volta
7.983 -0.883 6355 41 1957 1967 11 0.00 GRDC
52 Senchi y GH Volta Lower Volta
6.200 0.100394100
5 1936 1984 49 3.24 GRDC
53 Bolgatanga GH White Volta
10.806 -0.825 1966 1968 GLOWA
54 Nakong GH Sisni White Volta
10.798 -1.481 1966 1968 GLOWA
55 Navrongo GH Belepieni White Volta
10.876 -1.142 1966 1968 GLOWA
56 Soboba GH Oti 9.705 0.313

20
Appendix 2: Results of field water quality tests No. Site Sub-basin Coun-
try x-coordinate y-coordinate Date EC Temp. NO3 NO2 Hardness Hardness Ph
(at 25oC)
total carbonate
[uS/cm] [oC] [mg/l] [mg/l] [mg/l] [mg/l] 1 Bupe Bridge Black Volta GH W1o27.255' N8o45.921' 25-6-05 92 29.5 <5 <0.5 <107 <53 6.6 2 Yapei Bridge White Volta GH W1o09.535' N9o08.436' 25-6-05 51 28.1 <5 <0.5 <107 <53 6.5 3 Nabogo Bridge White Volta (small tributary) GH W0o49.443' N9o44.439' 26-6-05 43 27.4 <5 <0.5 <107 <53 ~6.4 4 Nasia Bridge White Volta (Nasia River) GH W0o48.224' N10o09.315' 26-6-05 55 28.3 <5 <0.5 <107 <53 6.5 5 Pwalugu Bridge White Volta GH W0o50.499' N10o35.140' 26-6-05 57 28.4 <5 <0.5 <107 18-53 ~6.4 6 Bolgatanga - Bawku Road (bridge) White Volta (tributary) GH W0o50.295' N10o47.200' 26-6-05 73 28.2 <5 <0.5 <107 ~53 ~6.4 7 Nangodi - Tilli road (bridge) White Volta (Red Volta) GH W0o36.422' N10o52.698' 26-6-05 41 28.4 <5 <0.5 <107 ~53 ~6.4 8 Kobore Bridge (Zebilla-Bawku road) White Volta GH W0o23.421' N10o58.989' 26-6-05 55 28 <5 <0.5 <107 ~53 ~6.4 9 Between Bawku & border (bridge) White Volta (small tributary to
Nouhao) GH W0o12.207' N11o07.998' 26-6-05 114 30.9 <5 <0.5 <107 53-71 ~6.4
10 Road to Bitou (bridge) White Volta (Nouhao River) BF W0o15.458' N11o12.878' 26-6-05 46 30 <5 <0.5 <107 <53 ~6.4 11 Bagré Bridge (downstream of turbine) White Volta BF W0o32.601' N11o28.381' 26-6-05 77 30.6 <5 <0.5 <107 ~53 ~6.4 12 bridge just downstream of Bagré irrigation
project White Volta BF W0o30.963' N11o24.554' 26-6-05 90 29.9 <5 <0.5 <107 ~53 ~6.4
13 Wayen Bridge White Volta BF W1o04.814' N12o22.740' 26-6-05 59 30.4 <5 <0.5 <107 ~53 ~6.4 14 Boromo Bridge Black Volta BF W2o54.842' N11o46.848' 28-6-05 50 27.5 <5 <0.5 <107 ~53 ~6.4 15 Saboinse Bridge White Volta (Red Volta) BF W2o00.355' N12o11.633' 28-6-05 21 26.5 <5 <0.5 <107 <53 ~6.4 16 Ouagadougou (water from tap in hotel Soritel) White Volta (water from tap) BF 28-6-05 122 27.1 <5 <0.5 <107 53-107 6.5 17 Bossora Black Volta BF ~8-3-2000 156 24.1 <10 7.55 18 Samandeni (RRNS2) Black Volta BF ~29-6-
1999 41 25.6 2.35 0.44 6.62
19 Samandeni Black Volta BF ~2-3-2000 107 21.4 <10 7.06 20 Noumbiel (RRMI3) Black Volta BF ~29-6-
1999 66 25.7 2.62 0.49 6.85
21 Marc aux Hippos Black Volta BF ~14-3-2000
109 25 0 0.21 7.21

21
Appendix 2: Results of field water quality tests No. Source Observations
1 this study 2 this study 3 this study stageboard 4 this study automatic water-level recorder, meteo-station 5 this study old automatic water-level recorder, diver, meteo-station (GLOWA) 6 this study river coming from urban area 7 this study 8 this study old automatic water-level recorder, water level: 73 cm 9 this study
10 this study PAGEV want to establish a gauging station at this site to monitor flood flows 11 this study no water is being released for hydropower because it is Sunday 12 this study drainage water from the Bagré Irrigation Project passes this site, EC slightly higher than upstream of irrigation project (sample 11) 13 this study automatic water-level recorder (DGIRH), satellite water-level warning system (SONABEL), water level: 1.21 m 14 this study automatic water-level recorder 15 this study 16 this study 17 DRAHRH-HB P2O5: 1-2.5; O2:6 [mg/l] 18 DRAHRH-HB HCO3
-=21.35; CO32-=0; Cl-=0;PO4
3-=3.24;SO42-=0.08;F-=0;Ca2+=2.9;Mg2+=2.61; FeTot=1.2;Mn2+=0;K+=7.5;Zn+=0;NH4
+=0.45;Na+=1 [mg/l] 19 DRAHRH-HB20 DRAHRH-HB HCO3
-=30.5; CO32-=0; Cl-=0;PO4
3-=3.16;SO42-=0.16;F-=0;Ca2+=5.8;Mg2+=3.28; FeTot=1.9;Mn2+=0;K+=6.8;Zn+=0;NH4
+=0.52;Na+=3.5 [mg/l] 21 DRAHRH-HB HCO3
-=87.84; CO32-=0; Cl-=0;PO4
3-=0.04;SO42-=0;F-=0;Ca2+=10.02;Mg2+=6.55; FeTot=0;Mn2+=0;K+=21.3;Zn+=0;NH4
+=0;Na+=2.1 [mg/l]

22
Appendix 3: Itinerary Date Day Activities June 2005
• Literature search in university libraries (the Netherlands) and on the internet. • Prepare a GIS map of the Volta Basin. • Obtain river flow data on the Volta Basin from the Global Runoff Data Centre.
June 15th • Telephone conversation with Prof. P.Vlek (GLOWA-Volta Project, Bonn, Germany). June 18th 1 • Literature reading.
• Travel from Amsterdam to Ouagadougou. June 20th 2 • Obtain visa for Burkina Faso and Ghana.
• Meeting with staff from IUCN-BRAO (Madiodio Niasse, Olumide Akinsola) and PAGEV (Kwame Odame Ababio, Jacob Tumbulto, Ludovic Tapsoba) on the Water Audit.
• Literature reading. June 21st 3 Meetings with the following organisations in Burkina Faso (together with Jacob Tumbulto & Ludovic
Tapsoba from PAGEV): • DGRIH (Mr. Jean Pierre Mihin - Directeur des Etudes et de l’Information sûr de l’Eau, Mrs. Belemlilga
Eléonore), • EIER (Mr. Babacar Dieng, Dr. Harouna Karambiri - Chercheur Assistant) • MOB (Mr. Alassoun Sori - Directeur des Etudes et Travaux), • Direction de la Météorologie (Mr. Kouka Dénis Ouedraogo - Ingénieur Agro-météorologiste). A meeting with IRD was also planned but all the relevant staff had travelled.
June 22nd
4 • Travel by car from Ouagadougou to Accra.
June 23rd 5 Meetings with the following organisations in Accra (together with Jacob Tumbulto & Ludovic Tapsoba from PAGEV and Isaac Asamoah from WRC): • GWCL (Mr. Gilbert Quaye - Head of Projects & Construction Management), • HSD (Mr. Harold T. Clottey, Mr. Ebeuezer Allotey), • IDA (Mr. Kwabena Boateng - Director, Mr. Daniel Nyarko Ohemeng - Deputy Chief Executive
Agronomy, B.S. Ouwsu, Yaw Yeboah), • MSD (G.A. Wilson - Deputy Director, Kwa Wunodu, Erasmus Mavfui, Andrew Hkansal), • WRC/WRI (Dr. Charles A.. Biney - Director), WRC (Enock B. Asare - Groundwater Specialist), WRI
(Ben Nobiya, Dr Philip Gyau-Boyake, Head of Surface Water). A meeting with GEF-Volta was also planned but all the relevant staff had travelled.
June 24th 6 Continued meetings in Accra: • Volta Challenge Programme (Dr. Winston E.I. Andah - Volta Basin Coordinator), • GLOWA-Volta Project (Dr. Boubacar Barry), • IWMI (Dr. Pay Drechsel - Head West Africa Office). A meeting with VRA was also planned but all the relevant staff had travelled. • Report writing.
June 25th 7 • Travel from Accra to Tamale • Water quality checks at 2 sites along Black and White Volta Rivers
June 26th 8 • Travel from Tamale to Ouagadougou • Water quality checks at 11 sites in the White Volta sub-basin • A short coincidental meeting with a field team from the GLOWA-Volta Project working on small
reservoirs (Mr. Jens Liebe - PhD Student and Mr. Kofi Nwarko) • Visit Bagré Dam and Bagré irrigation project
June 27th 9 • Meeting (together with Ludovic Tapsoba) with Sonabel in Ouagadougou (Mr. Bouda Ouiraogo) • Travel from Ouagadougou to Bobo Dioulasso Meetings in Bobo Dioulasso (together with Ludovic Tapsoba from PAGEV): • GEeau (Ir. Joost Wellens - Coopérant Scientifique), • VREO (Mr. Denis C. Dakoure - Coordonnateur National & Mr. Y. Nestor Fiarce Compaore - Chef de
Composante Appui Institutionnel), • DRAHRH-HB (Mr. Karimou Bicaba).
June 28th 10 • Travel from Bobo Dioulasso to Ouagadougou. • Water quality checks at 2 sites along Black and Red Volta Rivers. • Meeting (together with Ludovic Tapsoba) with ONEA (Mr. Mahamadou Koné - Chef de Service
Gestion de la Demande et des Ressources en Eau). June 29th 11 • Report writing.

23
• Short meeting with Innocent Ouédrafo in PAGEV office (WRCU-ECOWAS). • Visit to DGIRH to obtain meta-data on river flow.
June 30th 12 • A meeting (together with Ludovic Tapsoba) with DGHA (Ouermi Zambendé - Directeur de la Coordination des Aménagements Hydro-Agricoles).
• Report writing. July 1st 13 • Report writing. July 4th • Submission of: draft report, equipment for water quality tests, cd with collected information and
photocopies of reports that are not digital to PAGEV (Kwame Odame Ababio) July 6th 14 • Discussion on draft report with staff from IUCN-BRAO (Madiodio Niasse, Olumide Akinsola) and
PAGEV (Kwame Odame Ababio, Jacob Tumbulto). July 7th 15 • Travel from Ouagadougou to Amsterdam. July 19th • Written comments on draft report from PAGEV. July 28th • Revise draft report.
• Submission of final report to PAGEV (Kwame Odame Ababio).