pre-study of a development platform for in-car electrical energy
TRANSCRIPT

THESIS FOR THE DEGREE OF MASTER OF SCIENCE
Pre-Study of a Development Platform for In-Car Electrical Energy Management
HENRIK JONSSONSTEFAN SUNDSTRÖM
DEPARTMENT OF ENERGY AND ENVIRONMENTCENTRE FOR DIGITAL MEDIA AND HIGHER EDUCATIONChalmers University of TechnologySE-412 96 Göteborg, Sweden

Pre-Study of a Development Platform for In-Car Electrical Energy Management
© Henrik Jonsson, Stefan Sundström 2006
Department of Energy and EnvironmentCentre for Digital Media and Higher EducationChalmers University of TechnologySE-412 96 Göteborg, SwedenTelephone +46 31 772 1000
In Cooperation with:Volvo Car CorporationDepartment of Power Supply SystemsSE-405 31 Göteborg, SwedenTelephone +46 31 59 0000
Cover:[ev. bildtext till första sidan]
TeknologtryckGöteborg, Sweden 2006

JONSSON │SUNDSTRÖM
ABSTRACT
This master thesis examines the requirement for the implementation of an operational development platform for in-car electrical energy management. It has its starting point in the growing demands on the automotive battery, and the desire of the Department of Power Supply System at Volvo Cars for a test and evaluation platform for energy management algorithms and ideas. Focus is on battery status detection methods, conditions for integrating the platform with the present power supply system in a typical Volvo car, and on platform hardware and software possibilities and restrictions. Further, a user guide for such a platform is developed and evaluated.
A battery state of charge calculation model is created in Simulink. The model is designed for implementation in a test car and configured for execution on the development platform. The process of generating executable code from the model is described and documented for easy use. In order to establish the accuracy of the model it is tested and evaluated compared to a reference model using battery data recorded in real car tests. Compared to the reference model, test results show that the Simulink model is acceptable for determining battery state of charge. However, no data is available for the true battery state of charge value from the real car test. Therefore a true comparison can not be done.
A requirement for a fully operational development platform is the implementation of a communication interface between the platform and the Simulink model, handling the input and output signals. Proposed solutions for this problem is either the implementation of an underlying operating system on the platform, or the development of signal handling blocks directly in Simulink.
iii


JONSSON │SUNDSTRÖM
ACKNOWLEDGEMENTS
We would like to express our gratitude towards the persons who have made this master thesis possible through their support and guidance.
At the Volvo Car Corporation, we would like to thank first of all our supervisors Johan Hellsing and Torbjörn Larsson, for giving us the opportunity to perform this thesis work. Thanks also to the rest of the team at the Department for Power Supply Systems for inputs and encouragement. A special thanks to Axel Nicklasson at the Department of Analysis and Verification for literature recommendations, report feedback and reference software model simulations.
At Chalmers, we would like thank Marianne Karlsson at the Department of Product and Production Development for literature recommendations concerning technical documentation. Finally we would like to thank to our examiners, Torbjörn Thiringer at the Department of Energy and Environment and Sven Andersson at the Centre for Digital Media and Higher Education, for inputs and report feedback.
Henrik Jonsson & Stefan SundströmGöteborg, September 2006
v


JONSSON │SUNDSTRÖM
PREFACE
The Volvo Car Corporation, from now on referred to as Volvo Cars, was founded in 1927 in Göteborg, Sweden, as a spin off from ball bearing manufacturer SKF. Over the years Volvo Cars made a reputation for building practical cars for the whole family with an extra focus on safety. In 1998 the plans to divide Volvo Cars from the rest of the Volvo Group was announced and in March 1999 Volvo Cars became a subsidiary of the Ford Motor Company. Volvo is today marketed as a premium car and placed in Ford’s Premier Automotive Group with the vision to be the worlds most desired and successful premium car brand [1].
The Volvo trademark is closely linked to the core values; Safety, Quality and Environmental Care [1]. Developing and ensuring these unique properties is an important task for the product developing departments. The introduction of new features for fuel economy, performance, safety and comfort in future automobiles will bring up many new, power-hungry electrical systems [2]. The development of these new systems constitutes a challenge for the Department of Power Supply Systems.
vii


JONSSON │SUNDSTRÖM
TABLE OF CONTENTS
ABSTRACT ............................................................................................................... iii
ACKNOWLEDGEMENTS ............................................................................................. v
PREFACE ................................................................................................................. vii
TABLE OF CONTENTS .............................................................................................. ix
1 INTRODUCTION ..................................................................................................... 1 1.1 Background .............................................................................................................. 1 1.2 The idea .......................................................................................................... 1 1.3 Purpose and limitations .................................................................................... 3 1.4 Method ........................................................................................................... 3 1.5 Outline ........................................................................................................... 4
2 POWER SUPPLY .................................................................................................... 5 2.1 Alternator ........................................................................................................ 5 2.2 Battery ............................................................................................................ 5 2.3 In-car communication networks ....................................................................... 6 2.3.1 Controller Area Network ....................................................................... 6 2.3.2 Local Interconnect Network .................................................................. 7 2.4 Power supply system ........................................................................................ 7
3 ELECTRICAL ENERGY MANAGEMENT .................................................................. 9 3.1 Battery monitoring .......................................................................................... 9 3.2 Battery state detection .................................................................................... 10 3.2.1 State of charge based on specific gravity measurements ........................... 10 3.2.2 State of charge based on porosity ............................................................... 11 3.2.3 State of charge based on voltage ................................................................ 11 3.2.4 State of charge based on current ................................................................ 11 3.2.5 State of charge based on a combination of voltage and current ............... 12
4 DEVELOPMENT PLATFORM HARDWARE ............................................................. 13 4.1 Battery sensor ................................................................................................ 13 4.2 Development board ......................................................................................... 15 4.3 Hardware system design ........................................................................................... 16
ix

JONSSON │SUNDSTRÖM
5 SOFTWARE IMPLEMENTATION .............................................................................. 17 5.1 Software ......................................................................................................... 17 5.1.1 MATLAB / Simulink / Real-Time Workshop ............................................... 17 5.1.2 XCC / Background Debug Mode ............................................................. 19 5.2 Software model .............................................................................................. 21 5.2.1 Input signals ................................................................................................ 21 5.2.2 Battery sensor mode computation ................................................................. 22 5.2.3 State of charge calculation............................................................................ 23 5.2.4 Output signals .............................................................................................. 25
6 RESULTS ............................................................................................................. 27 6.1 Battery sensor mode evaluation ........................................................................ 27 6.2 State of charge accuracy .................................................................................. 28
7 DOCUMENTATION ................................................................................................ 33 7.1 Introduction ................................................................................................... 33 7.1.1 Purpose and limitations ............................................................................... 33 7.2 Method .......................................................................................................... 34 7.2.1 Feasibility study ........................................................................................... 34 7.2.2 User studies.................................................................................................. 35 7.3 Result of user study 1 ...................................................................................... 36 7.4 Revision of manual ........................................................................................ 38 7.5 Result of user study 2 ...................................................................................... 39 7.6 Evaluation ...................................................................................................... 40
8 DISCUSSION ........................................................................................................ 41 8.1 Conclusions .................................................................................................... 41 8.1.1 Development platform ................................................................................ 41 8.1.2 SOC calculation model ............................................................................... 41 8.1.3 Documentation ............................................................................................. 42 8.2 Future work ................................................................................................... 42 8.2.1 Development platform .................................................................................. 42 8.2.2 SOC calculation model ............................................................................... 42
REFERENCES ........................................................................................................... 43
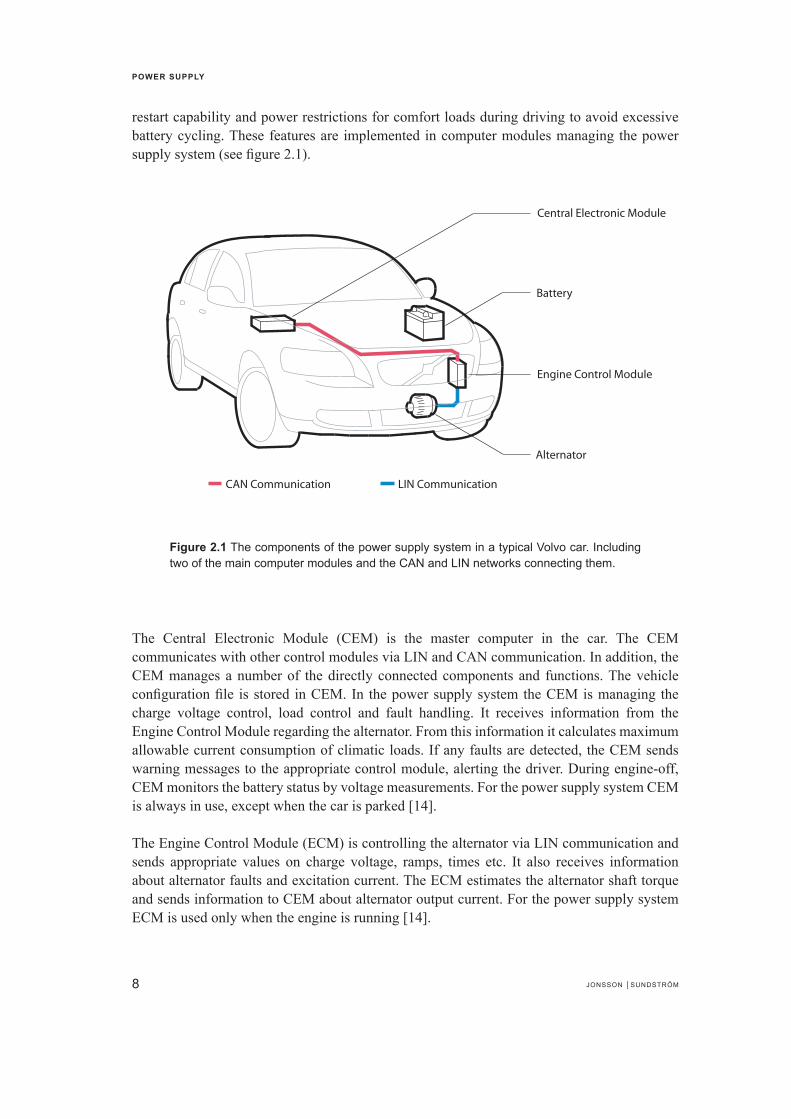
APPENDIX A – SIMULINK MODEL ............................................................................ 45 A.1 Main model with input and output signals .............................................................. 47 A.2 Battery sensor mode computation block ................................................................ 48 A.3 State of charge calculation block .............................................................................. 49
APPENDIX B – MANUAL ........................................................................................... 51 B.1 Interview questions .................................................................................................. 53 B.2 Questionnaire ........................................................................................................... 54 B.3 Final version of manual ............................................................................................ 55
TABLE OF CONTENTS
x

JONSSON │SUNDSTRÖM
1
INTRODUCTION
In this chapter the reader is introduced to the thesis. The background for the task is explained and the purpose and limitations of the thesis are stated. Further, methodology and the outline of this report are presented.
1.1 Background
A consequence of more power-hungry electrical systems is that the demands on the automotive battery will grow substantially, e.g. regarding reliability, energy throughput and charge acceptance [3]. Upcoming features like regeneration of electrical energy for fuel economy, e.g. electrical brake energy recovery, requires knowledge about the capability of the battery to accept charge [4]. Hence the battery as energy storage and its inspection via battery diagnostics becomes more and more important. Therefore, to ensure a fully operational battery, Volvo Cars aims to introduce electrical energy management to optimize the way the battery is operated and managed. The energy management balances the electric energy requested by the consumers with the energy supplied by the alternator and the battery. Thus the energy management provides a balance between consumed, produced and stored energy [5]. Potential benefits include extended battery life time, early warnings of deterioration and an improved match to the vehicle’s requirements [6].
1.2 The idea
In order to test and evaluate in-car energy management algorithms and ideas, the Department of Power Supply Systems at Volvo Cars is in need of a platform, i.e. somewhere to implement their models. Today there is no fast and easily accessible way to do this. All power supply functions are integrated in complex systems managed by other departments. The idea is to develop an easy to use development platform, designed for exactly the purpose of electrical energy management testing and evaluation [7].
Benefits with the introduction of a development platform for electrical energy management is visualised in Figures 1.1 and 1.2, which represents the schematic work process for the Department of Power Supply System, with and without the development platform respectively.
1

JONSSON │SUNDSTRÖM
The present work process, represented in Figure 1.1, shows that today the department is specifying desired functionality in text and flow charts. The text documentation is then provided to suppliers that have to interpret and translate the text into code and implement it in the car. The department then has to evaluate the functionality by conducting in-car testing and verification. In case of a functionality failure the entire process has to start over again, involving the suppliers once more, until desired functionality is achieved [7].
With the introduction of a development platform for electrical energy management in the work process, as presented in Figure 1.2, there are several potential improvements. With a development platform the Department of Power Supply Systems do not need to specify desired functionality in text, but instead realise functionality in computer models [7]. With this comes the ability to direct evaluation, without having to involve suppliers. This results in savings in both time and money. And when the department is satisfied with the outcome, the suppliers are provided with the computer models for in-car implementation, leaving less room for misinterpretation and no need for translation compared to text specifications.
����
����
�����������������������������
��������������
�����������������
��������������
�����������������
�������������������������
�����������������
��
��
���
Figure 1.1 The present work process for the Department of Power Supply Systems at Volvo Cars.
Figure 1.2 The potential work process for the Department of Power Supply Systems with the introduction of a development platform for electrical energy management.
INTRODUCTION
2

JONSSON │SUNDSTRÖM
1.3 Purpose and limitations
The purpose of this master thesis is to:
● Examine the conditions for implementing a development platform for electrical energy management to be used in a test car.
● Create and test a first draft for a battery state of charge calculation model to be used with the development platform
● Document the platform for easy use, and in such a way that it can be an alternative for other applications at Volvo Cars.
This is an initial study that will present the requirements for an operational development platform, configured for the present power supply system. Focus is on battery status detection methods, implementation conditions and on hardware and software possibilities and restrictions.
The platform hardware and software are predetermined by the Department of Power Supply Systems. They are selected on the basis of availability and functionality. No alternatives to the specified hardware or software will be taken into consideration or examined.
1.4 Method
In the beginning of this thesis work relevant information about the subject was collected and examined. This was to narrow the subject down to the parts that had to be carried out in order to fulfil the purpose. Information about electrical energy management was studied. Also studies about the power supply system and the development platforms hardware and software possibilities and restrictions were made. A consequence of the literature studies was the realisation that the communication interface between the development platform and the modelling software was not as developed as assumed.
Information is collected in mainly three different ways; through literature study, informal interviews and testing. Literature includes, in the case of electrical energy management studies, mainly articles and books. In the case of hardware and software studies the literature consists mainly of user guides and fact sheets. The Internet is also used widely in both cases. The informal interviews consists of personal conversation, spontaneous or planned, with persons connected to the subject. These persons has mainly been from the Department of Power Supply Systems and have given a lot of information and new input on primarily power supply functions and requirements. In the case of coding and computer modelling information is collected through both literature studies and personal conversation but also through testing and verification.
INTRODUCTION
3
JONSSON │SUNDSTRÖM
1.5 Outline
This report presents the outcome of this master thesis work. The aim with the report is to make the content understandable for any prospective reader who will find it useful. However, the technical level in this report is set on the level of a Master of Science student. The report is thought to address mainly the automotive industry, especially Volvo Cars or other members of the Ford Motor Company, but also others who may find its area of expertise interesting.
The first chapter gives an introduction to the thesis and the problem. Purpose, limitations and methodology is presented. In chapter two the power supply system in today’s Volvo cars is described, particularly the alternator, the battery and the in-car communication networks is explained. In chapter three the theory of electrical energy management is introduced and explained. The reason for monitoring the battery and how to use the data acquired for calculating battery status is described. Chapter four presents the hardware of the development platform. The configuration of a future integration of the hardware with the present power supply system is also presented. In chapter five the software implementation is described. Software features is presented and the process of implementing the software to the hardware is examined and explained. A software model is created for battery state of charge calculation and input and output parameters is described. The sixth chapter presents the results of simulations made from the software model. The test conditions are stated and the results are evaluated. Chapter seven describes the developing process of the platform documentation. The process is described from draft one, through user study and test evaluation, to a final draft. In chapter eight the results and outcome of the thesis is discussed. Also, recommendations for future work are made.
INTRODUCTION
4

JONSSON │SUNDSTRÖM
2
POWER SUPPLY
In this chapter the alternator, the battery and the in-car communication networks is presented. Further, the system design of the power supply system in a typical Volvo car is described
2.1 Alternator
The alternator produces the electrical energy needed to charge the battery and to supply electrical equipment when the engine is running. It is converting mechanical power from the engine into electrical power and thereby generating current for the car. The alternator is located on the engine and driven by the crankshaft either via the front-end accessory belt or directly via a gear. The two main parts of the alternator are the rotor and the stator. The rotor winding is fed with a current to create a magnetic field. When the magnetic field rotates inside the stator windings a current is induced in the stator. The output voltage from the alternator is controlled by controlling the rotor current. It is done by the controller which samples the output voltage and changes the intensity of the rotating magnetic field by adjusting the current fed to the rotor. The stator windings are positioned with even intervals at a phase angle of 120°. This produces three-phase alternating current. In order to get direct current to the battery a diode bridge rectifier that converts alternating current to direct current is used [4][8].
2.2 Battery
The battery is used for energy storing, for starting the engine, for loads when the engine is not running and to sustain the alternator when the output is insufficient. The two dominant substances in a standard car battery are lead and sulphuric acid. There are six cells in a 12 V battery each consisting of a positive electrode made of lead-dioxide and a negative electrode composed of finely distributed sponge lead. Between the two electrodes is the sulphuric acid which forms an electrolyte that ensures the flow of ionic current between the poles. Maximum conductivity of the electrolyte is obtained at a density of 1.28 kg/dm3. Each cell has a rest potential of 2.13 V and six of these series-connected electrode stacks form a 12 V battery.
5

JONSSON │SUNDSTRÖM
The alternator begins the battery charging process as soon as the engine starts running, if possible. Normal charge voltage in a 12-volt system should be 14.2-14.4 V at +25° C measured over the battery poles. Too high charge voltage will electrolyze the water, thus lowering the electrolyte level over time. If the charging voltage is set too low the battery will not be charged properly. The charge voltage should be increased with 0.3 V for every ten degrees the temperature decreases and be lowered 0.3 V for every ten degrees the temperature rises [9][10].
2.3 In-car communication networks
The usage of computer networks in vehicles is becoming more and more common. However, when adding so many computers to the car several different types of communication networks are required to reach cost effective solutions. This section presents the two serial communication networks used by the power supply system.
2.3.1 Controller area network
Controller Area Network (CAN) is a serial data communications bus with a high level of data integrity for real-time applications. It is a serial bus system with multi-master capabilities, that is, all CAN nodes are able to transmit data and several CAN nodes can request the bus simultaneously. In CAN networks there is no addressing of subscribers or nodes in the conventional sense, but instead, prioritized messages are transmitted. A transmitter sends a message to all CAN nodes (broadcasting). Each node decides on the basis of the identifier received whether it should process the message or not. The identifier also determines the priority that the message enjoys in competition for bus access. This method allows for uninterrupted transmission when a collision is detected [11].
The CAN protocol was developed by Robert Bosch GmbH in the early 1980’s for automotive applications needing high levels of data integrity and data rates of up to 1 Mbps [12]. It is documented in ISO 11898 for applications up to 1 Mbps, and ISO 11519 for applications up to 125 kbps. The maximum transmission rate of 1 Mbps applies to networks up to 40 m. For longer distances the data rate must be reduced. A typical Volvo car contains of two CAN-networks; a High Speed CAN-network (HS-CAN) that operates at 500 kbps and a Low Speed CAN-network (LS-CAN) that operates at 125 kbps.
Each CAN message can transmit from 0 to 8 bytes of user information. Of course longer data information can be transmitted by using segmentation. One of the outstanding features of the CAN protocol is its high transmission reliability. The CAN controller registers a node’s error and evaluates it statistically in order to take appropriate measures. These may extend to disconnecting the CAN node producing the errors. This makes CAN suitable for safety critical applications. The physical medium is a twisted-pair wire that protects from electromagnetic interference.
POWER SUPPLY
6

JONSSON │SUNDSTRÖM
To monitor the CAN bus traffic a tool called CANalyzer can be used. It has the features of network monitoring, analysis and verification. It is also possible to simulate CAN nodes in CANalyzer [11].
2.3.2 Local interconnect network
Local interconnect Network (LIN) is a serial bus system especially suited for networking intelligent sensors and actuators within a sub-system. It is a time triggered master slave network, having one master and one or more slaves, where the master has a schedule that defines when each frame is to be sent. All frames include a header, which is sent by the master. The header includes information on which node that should send the data frame. If a slave node recognises its identification it either sends or receives the data of the frame specified in the header. The LIN bus does not need to resolve bus collisions because only one message is allowed on the bus at a time.
The LIN Protocol is based on the SCI/UART serial data link format, which is supported by a wide range of products. The LIN standard is specified by the LIN consortium, a workgroup started in the late 1990’s by Volvo and other car manufacturers. The LIN standard includes the specification of the transmission protocol, the transmission medium, the interface between development tools, and the interfaces for software programming. LIN guarantees the interoperability of network nodes from the viewpoint of hardware and software, and a predictable EMC behaviour.
The maximum communication speed on a LIN bus is 19.2 kbps over a maximum cable length of 40 meters. LIN nodes can send/receive a full 8 byte command every 10 ms, or shorter commands every 5 ms. The LIN bus may be used as a sub-bus for a CAN bus interface. The purpose of LIN is to be a low cost complement for connecting simple functions. LIN is used for functions that have low bandwidth requirements and where the nodes are of quite simple architecture e.g. doors, seats and internal lights. The physical medium is a single-wire implementation. A tool for monitoring the LIN bus is LINspector, featuring network monitoring, analysis and verification [13].
2.4 Power supply system
The power supply system’s main responsibility is to supply and manage the use of electric power in the car. This includes generation of electric power, storage of electric energy and consumption control. The generation of electrical power is made by the alternator. The generated power shall supply all electric loads in the vehicle and in addition handle the recharging of the battery. Storage of electrical energy is made by the 12 V lead-acid battery. Consumption control consists of sub-functions such as; load shut-off at engine-off to ensure
POWER SUPPLY
7
JONSSON │SUNDSTRÖM
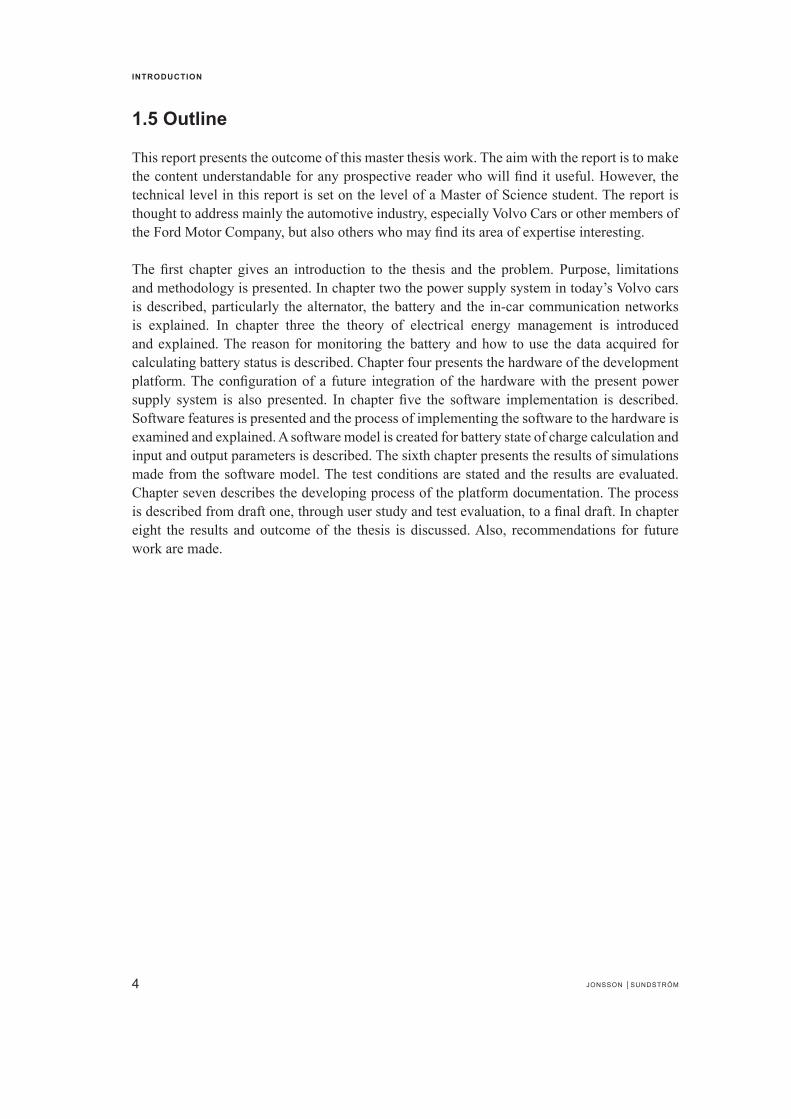
restart capability and power restrictions for comfort loads during driving to avoid excessive battery cycling. These features are implemented in computer modules managing the power supply system (see figure 2.1).
The Central Electronic Module (CEM) is the master computer in the car. The CEM communicates with other control modules via LIN and CAN communication. In addition, the CEM manages a number of the directly connected components and functions. The vehicle configuration file is stored in CEM. In the power supply system the CEM is managing the charge voltage control, load control and fault handling. It receives information from the Engine Control Module regarding the alternator. From this information it calculates maximum allowable current consumption of climatic loads. If any faults are detected, the CEM sends warning messages to the appropriate control module, alerting the driver. During engine-off, CEM monitors the battery status by voltage measurements. For the power supply system CEM is always in use, except when the car is parked [14].
The Engine Control Module (ECM) is controlling the alternator via LIN communication and sends appropriate values on charge voltage, ramps, times etc. It also receives information about alternator faults and excitation current. The ECM estimates the alternator shaft torque and sends information to CEM about alternator output current. For the power supply system ECM is used only when the engine is running [14].
�������
���������������������
����������
�������������������������
������������������ � �����������������
Figure 2.1 The components of the power supply system in a typical Volvo car. Including two of the main computer modules and the CAN and LIN networks connecting them.
POWER SUPPLY
8

JONSSON │SUNDSTRÖM
In this chapter the conditions for electrical energy management is presented. The importance of battery monitoring is stated and different methods on how to determine the battery state of charge is described.
The aim of electrical energy management is to guarantee the electrical power supply of vital devices in every situation, or in special cases. Electrical power supply is usually provided by the alternator when the engine is running. The energy balance can be improved if the available energy is too low by a decrease of energy consumption or by an increase of the energy generation. Lowering the energy consumption is helpful in order to improve the short-term energy situation. It can be done by reducing non-essential loads, which can be done in a stepwise manner. Increasing the energy generated is a solution that enables all applications to function as desired. The disadvantage of increasing the generated energy is that it is done by raising the engine rpm, which can only be done when the engine is running in idle [2].
3.1 Battery monitoring
In vehicles the battery is a completely passive energy storage device. It is discharged if more energy is consumed than generated, and energy for recharge is supplied to the battery if more energy is available than is actually needed. Today no supervision is done, such as checking if the battery actually is able to give requested energy or assimilate offered energy [2]. Hence a key component for electrical energy management is monitoring of the battery status.
To analyse the battery status both voltage and current are measured. Temperature is also measured to compensate for its influence on battery properties. Battery monitoring includes processing and evaluating the data received. The accuracy that can be achieved depends on the precision of the sensor, the reproducibility of battery performance and tests, and the algorithms. Battery monitoring also permits for best use of the capability of a battery of a given size and to guarantee power supply for vital devices [2][4].
3
ELECTRICAL ENERGY MANAGEMENT
9

JONSSON │SUNDSTRÖM
3.2 Battery state detection
To determine the battery status, one of the essential measures is its state of charge (SOC). The SOC of a battery is its available capacity expressed as a percentage of its rated capacity (see 3.1).
Available capacitySOC = ————————— • 100 % (3.1)
Rated capacity
Knowing the amount of energy left in a battery compared with the energy it has when it is fully charged gives an indication of how much longer a battery will continue to perform before it needs recharging. The SOC reference is normally the rated capacity of a new battery. Therefore SOC can exceed 100% as individual capacity of a new battery may fluctuate due to variations of manufacturing parameters.
The battery capacity gradually reduces as it ages and is also affected by temperature and discharge rate. Towards the end of the battery’s life its actual capacity will be significantly lower than its rated capacity. Consequently its SOC would not be 100% even if the battery was fully charged. To define SOC reference as the currently fully charged capacity of the battery, adjustment factors have to be applied to the rated capacity to determine the new reference capacity. In this case a fully charged battery would have a SOC of 100% but it would have a significantly lower capacity then of a new battery. Therefore state of health (SOH) is used to describe the degree of degradation of the battery. The SOH of a battery is its present maximum capacity expressed as a percentage of its rated capacity (see 3.2).
Present maximum capacitySOH = ———————————— • 100 % (3.2)
Rated capacity
Several methods of estimating the SOC of a battery can be used. Most methods depend on measuring one or more parameters which varies with the state of charge [4][15].
3.2.1 State of charge based on specific gravity measurements
Specific gravity measurement is the customary way of determining the charge condition of lead acid batteries. It depends on measuring changes in the weight of the active chemicals. As the battery discharges, the sulphuric acid in the electrolyte reacts with the electrodes and its concentration is reduced. This in turn reduces the specific gravity of the solution in direct proportion to the state of charge. The actual specific gravity of the electrolyte can therefore
ELECTRICAL ENERGY MANAGEMENT
10

JONSSON │SUNDSTRÖM
be used as an indication of the state of charge of the battery. Specific gravity is measured by using, for example, a suction type hydrometer to take a sample of the battery’s electrolyte. The accuracy of the method increases with time as the sulphuric concentration is evenly distributed in the electrolyte. Although the method can be very accurate it is not practical to use in an operating vehicle [15].
3.2.2 State of charge based on porosity
Porosity based calculations depends on measuring changes in the porosity of the electrodes. In order to minimize the energy loss at the electrode surface and to increase the electrode efficiency, it is preferred to have a large electrode surface area. This is accomplished with the use of a porous electrode design. A porous electrode can provide an area per unit volume several decades higher than that of a solid electrode.
Both the positive and negative electrode has a porous structure, thereby increasing the surface area of the electrode to the bulk electrolyte. Due to the reaction that occurs during charge/discharge, the porosity of both electrodes will change. The maximum porosity of the electrode, i.e. the maximum amount of open space in the electrode, will be reached when the electrode is fully charged. This dependency between electrode porosity and charged/discharged energy makes it possible to estimate SOC. The method is not applicable in a vehicle but can be modelled in a computer simulation to give a very precise calculation of SOC [10][16].
3.2.3 State of charge based on voltage
This method uses the voltage of the battery cell as the basis for calculating SOC or the remaining capacity. The relation between voltage and SOC is that a high voltage indicates a high SOC. Results can vary widely depending on actual voltage level, temperature, discharge rate and the age of the cell. Compensation for these factors must be provided to achieve a reasonable accuracy. The method is most accurate when open circuit voltage (OCV) is measured and the battery has not been used for several hours. Hence the method is not useful during continuous battery load [15].
3.2.4 State of charge based on current
This method measures the current entering and leaving the battery as a basis for remaining capacity calculation. The simplest method of determining the current is by measuring the voltage drop across a low ohmic resistor. The charge transferred in or out of the battery is obtained by integrating the current over time [15]. To calculate SOC, the integrated current is divided by the battery’s rated capacity and added to the previous SOC value (see 3.3).
ELECTRICAL ENERGY MANAGEMENT
11

JONSSON │SUNDSTRÖM
∫ I dtSOCn = SOCn-1 + ——————— • 100 % (3.3)
Rated capacity
This method provides a high accuracy during continuous battery load but the accuracy decreases as the battery approaches maximum SOC level. Due to chemical limitations the current that is actually ’accepted’ by the battery, and could be retrieved by subsequent discharging, is reduced with increased SOC level. The charge acceptance is not a constant parameter since it depends largely on the SOC level [17]. Therefore all current added to the battery can not be assimilated to the SOC value as the battery reaches its maximum charging capacity. Another source of error is that the initial SOC value can be incorrect due to self discharge if the battery has not been used for several hours. If there is no correction of these possible miscalculations the method can generate accumulated errors.
3.2.5 State of charge based on a combination of voltage and current
An initial value of SOC can be determined by using the voltage method when the battery has not been used for several hours. With the initial value of SOC established the current method is used to continue to calculate the present SOC level. This prevents accumulated errors that may be generated from the current method. Both methods are relatively easy to apply in a vehicle and both have different advantages. Therefore implementing a combination of the voltage method and the current method appears to be an acceptable and practically viable method to determine SOC in an operating vehicle [15].
ELECTRICAL ENERGY MANAGEMENT
12

JONSSON │SUNDSTRÖM
4
DEVELOPMENT PLATFORM HARDWARE
In this chapter the development platform hardware is presented. The hardware possibilities and restrictions are stated. Furthermore, the configuration of a future integration of the hardware with the present power supply system is presented.
At present, the supervision of the battery done in a Volvo car is made by voltage measurements only. This is, as stated in chapter three, not sufficient enough for total battery status monitoring. So in order to monitor the battery status a battery sensor is implemented, supervising battery voltage, current and temperature. The battery data collection and processing is implemented in a development board. On the board all functions for battery state of charge calculation is executed. The development board also manage the work of the battery sensor. Both the battery sensor and the development board are predetermined by the Department of Power Supply Systems at Volvo Cars based on their availability and functionality.
4.1 Battery sensor
The battery sensor synchronously records measured values of voltage, current and temperature. Recorded data is transmitted via the LIN bus to the development board. LIN communication is implemented in accordance with LIN Specification 1.3. The sensor can operate at 16 different frequencies, divided into three different modes: high rate, low rate and stand-by mode. In high rate mode the battery sensor operates at 200 Hz and in low rate mode at 1 Hz. The frequency at stand-by mode can be set to 14 different values in accordance to 4.1 [18].
1 Stand-by frequency = —— Hz , k integer 1 ≤ k ≤ 14 (4.1) 2k
The mechanical structure of the battery sensor consists of the negative battery terminal, the ground cable including the cable lug and the encapsulated electronics module with the embedded shunt (see figure 4.1).
13

JONSSON │SUNDSTRÖM
The battery voltage is measured within the battery sensor in relation to the positive supply applied. Measurement of the battery current is conducted in relation to the ground path. Due to low nominal resistance of 120 µΩ in the manganin shunt, the sensor is capable of handling start-up currents of 1000A. Although the temperature is measured within the electronic module, the selection of high heat-conductive materials in the sensor reflects the battery temperature very well. The battery sensor operating data and measurement data are presented in table 4.1 and table 4.2 [18].
Table 4.1 Operating data for the battery sensor
Parameter Min Type Max Unit Comments
Operating voltage 6 14 18 V Overvoltage 18 27 32 V Max for 400 msReverse polarity voltage - 4 -14 -16 V Operating current 0 +/- 150 A Overcurrent 0 +/- 1000 A Max for 5 sOperating temperature -40 25 85 °C
Table 4.2 Measurement data for the battery sensor
Measured value Rate Range Rel. error Abs. error Resolution (Hz) (deviation) (offset)
Battery voltage 1 6 – 18V < 0.2 % +/- 3mV 5mV 200 6 – 18V < 0.2 % +/- 30mV 5mVBattery current 1 0 – +/-30A < 0.5 % +/- 5mA 1mA 200 0 – +/-1000A < 0.5 % +/- 100 mA 50mABattery temperature 1 -40 – 85°C +/- 3K 1K 200 -40 – 85°C +/- 3K 1K
DEVELOPMENT PLATFORM HARDWARE
Figure 4.1 The battery sensor mounted on the battery.
��������������
�������������
���
����������������
���������
14

JONSSON │SUNDSTRÖM
4.2 Development board
The development board is intended for research and development efforts within the automotive electronics. It was developed in a project called GAST whose participants are a number of actors in the automotive industry as well as Swedish universities. Within the GAST project the development board was labelled G1 [19].
Power supply ranging from 12-48 V can be used to supply the board. It is protected from currents above 2.0 A through a fuse mounted on the board. The development board uses a Freescale MC9S12DG256B micro controller unit of the HCS12 family, and versatile IO-signals with signal levels as specified for automotive electronics. The 16-bit HCS12 central processing unit has a programmable memory of 256 kB and a clock frequency of 8 MHz. There are two CAN-drivers on the board that both can be used as either HS-CAN or LS-CAN. It can be configured to use dual LIN, dual RS232 or one of each driver. This is determined through jumper settings. When the LIN driver is used, the board can function as either LIN master or LIN slave.
To program the development board a debug adapter is used. It is a hardware interface between the background debug mode protocol and the standard serial communication line (RS232). The debug adapter is connected to the board through a 6 pole flat cable, which also supplies it with power (see figure 4.2) [19].
�����������������
���������������
�������������
���
���
�����
�����
Figure 4.2 The development board and the debug adapter with present configuration of the CAN, LIN and RS232 connections.
DEVELOPMENT PLATFORM HARDWARE
15

JONSSON │SUNDSTRÖM
4.3 Hardware system design
The hardware system design consists of integrating the battery sensor and the development board with the existing power supply system. The hardware configuration in a vehicle is shown in figure 4.3.
The battery sensor is mounted to the battery’s negative pole and is then grounded in the vehicle. The development board can be placed inside the vehicle compartment, provided that the connecting cables are long enough. To ensure power supply for the development board at all times, two power cables are required directly from the battery to the board. A single-wire cable for the LIN communication between the battery sensor and the development board is also needed. The development board is connected via a twisted-pair cable to the CAN bus socket inside the vehicle compartment.
With this configuration the development board is connected to the battery sensor via LIN and it can broadcast signals on the CAN bus. The broadcasted output signals from the development board can be requested by both the CEM and the ECM in the vehicle. A computer can be connected to the serial connection (RS232) on the development board in order to monitor the signals processed on the board.
DEVELOPMENT PLATFORM HARDWARE
Battery
Engine Control Module
Alternator
Central Electronic Module
CAN Communication LIN Communication
Development Board
Battery Sensor
Figure 4.3 The power supply system with the battery sensor and the development board mounted.
16

JONSSON │SUNDSTRÖM
In this chapter the software and its implementation with the hardware is presented. It is explained why the specific software is selected and its functionalities and advantages are described. The process of implementing the software to the hardware, i.e. how to generate executable code and how to compile and load that code on to the development board, is explained. A software model for SOC calculation is created and its input and output parameters are described. The model is designed for implementation in a test car and configured for execution on the development board.
5.1 Software
To support the hardware, a chain of software is used to model, compile and load desired functionality on to the development board. MATLAB with software packages Simulink and Real-Time Workshop are used for software modelling and code generation. The MATLAB product family is selected because it is an easy to use standard modelling software, already available within Volvo Cars. XCC and Background Debug Mode are used for compiling and loading the code on to the hardware. These software’s were used in the GAST project and are suited for the development board. XCC and Background Debug Mode are also already available within Volvo Cars.
5.1.1 MATLAB / Simulink / Real-Time Workshop
MATLAB, short for Matrix Laboratory, is a highly configurable software environment used for technical computation such as math computation, algorithm development, modelling, simulation and prototyping. It is highly acclaimed in both the academic and industrial environment. One reason for the strong position in the industrial environment is the many different software packages that exist for MATLAB. These software packages provide an environment for a specific technical computation. An example of this is Simulink which is an environment for modelling and simulation [20]. In MATLAB a .mat file is created for setup parameters (see figure 5.1).
5
SOFTWARE IMPLEMENTATION
17

JONSSON │SUNDSTRÖM
Simulink is a software package added to MATLAB for modelling, simulating and analysing dynamical systems. It is commonly used in university and industrial environments. Simulink provides a graphical model programming language that enables MATLAB to build graphical block diagrams using drag-and-drop operations. A model is created by simply connecting different blocks to each other. The package includes a comprehensive library of sinks, sources, linear and nonlinear components and connectors. In addition to its extensive set of built-in blocks, Simulink offers features for creating customized blocks and block libraries. Model library support makes it easy to build and maintain libraries of customized blocks. A block with defined properties can be created in the model library. Changes made to the library version of the block then propagate through any model using that block. Models are hierarchical and can be built using both top-down and bottom-up approaches. A system can be viewed at top level containing individual blocks that each can be opened for increased level of details. The Simulink model is saved in a model.mdl file. After a model has been defined, it can be simulated, using a wide range of integration methods, selected either from the Simulink menus or by entering commands in the MATLAB command window. Using scopes and other display blocks, simulation results can be visualised while the simulation is still running. In addition parameters can be changed during runtime with effects immediately visible. The simulation results can be put in the MATLAB workspace for post processing and visualisation [20]. Simulink uses the setup parameters in the .mat file from MATLAB in the .mdl file (see figure 5.2).
SOFTWARE IMPLEMENTATION
���
����������������
���������
����
��������
����
����
�����������������
����
�������
����
Figure 5.2 Simulink uses the .mat file for setup parameters to its .mdl file.
���
����������������
���������
����
��������
����
�����������������
����
�������
����
Figure 5.1 The .mat file is created in MATLAB for setup parameters.
18

JONSSON │SUNDSTRÖM
Real-Time Workshop (RTW) is another software package for MATLAB. It is used in Simulink to generate C code for specific targets from the Simulink model. A target is the environment the generated code is intended to run on. The HCS12 processor on the development board is such a target. When generating code for a specific target, RTW first creates an intermediate description file model.rtw from the Simulink model.mdl file. The model.rtw file is an ASCII file which describes the model, i.e. which blocks it contains and how they are connected. The next step in order to generate code is for the Target Language Compiler (TLC) to read the model.rtw file and produce code for the different blocks accordingly. The TLC compiler does this by using certain mark-up language files with the file extension .tlc. These files contain a description of what the generated code should look like for a specific block (for a certain target). You can write your own .tlc files in order to produce your own code for blocks. This makes RTW a highly configurable system. The TLC compiler outputs target specific code for the model and also a make file to be used for compiling the code. This make file is based on a template file .tmw which also can be configured. RTW creates the make file by expanding model specific tokens in the .tmw file [20]. The C code intended for the development board is generated in C (.c) and header (.h) files (see figure 5.3).
5.1.2 XCC / Background Debug Mode
XCC, short for Cross C Compiler, is used to compile the C (.c) and header (.h) files generated by RTW into a load file for the development board. The fundamental use of a cross compiler is to separate the build environment from the target environment. A cross compiler is a compiler capable of creating executable code for a platform other than the one on which the cross compiler is running. Such a tool is handy when you want to compile code for a platform that you do not have access to, or because it is inconvenient or impossible to compile on that platform (as is the case with embedded systems, on which various kinds of microcontrollers run with a minimal amount of memory for their own purpose). In addition to the .c and .h files XCC uses a HCS12 specific start-up file .s12 for the compilation (see figure 5.4). The result is executable code in a .s19 file [19][21].
���
����������������
���������
����
��������
����
�����������������
����
�������
����
����
Figure 5.3 From the .mdl file RTW generates C code and additional files.
SOFTWARE IMPLEMENTATION
19

JONSSON │SUNDSTRÖM
The Background Debug Mode (BDM) is a background debug interface which supports in-circuit programming of on-chip non-volatile memory and debug capabilities. The system does not interfere with normal application resources. It does not use any user memory or locations in the memory map and does not share any on-chip peripherals. The BDM is used to program flash and EEPROM memory in the application system after final assembly. It can also be used to perform diagnostics and code upgrades in the field. The .s19 executable file generated by XCC is via the BDM and the debug adapter loaded to the HCS12 processor on the development board (see figure 5.5) [19][21].
SOFTWARE IMPLEMENTATION
���
����������������
���
����
������
����
��������
����
�����������������
����
�������
����
Figure 5.5 The compilation in XCC results in an executable .s19 file that via BDM is loaded on to the processor.
���
����������������
�������
����
���������
����
��������
����
�����������������
����
�������
����
Figure 5.4 XCC compiles the .c and .h files generated from RTW and a .s12 start-up file specific for the HCS12 processor.
20

JONSSON │SUNDSTRÖM
5.2 Software model
As a part of the software implementation, a model for SOC calculation is created in Simulink. The model is designed for implementation in a test car and configured for execution on the development board. The purpose of the model is to collect and process battery data, execute SOC calculation algorithms and manage the status of the battery sensor. For this reason the model can be divided into two blocks. One block calculates SOC and the second block determines operating conditions for the battery sensor. Both these blocks are merged in a main model (see appendix A.1). The input signals to the model are selected based on the data required to fulfil the model purpose. The output signals are selected based on the out data desired for evaluating the model.
5.2.1 Input signals
The model is dependent on a number of input signals that are used by either one or both blocks. The output signal from the battery sensor mode computation block also serves as an input to the SOC calculation block. All signals are imported simultaneously to the model and are evaluated in the same execution. The input signals used by the computer model are displayed in table 5.1.
Table 5.1 Input signals to the computer model.
Signal Bus Source Descripion Unit
Ibat LIN Battery sensor Battery current AUbat LIN Battery sensor Battery voltage VTbat LIN Battery sensor Battery temperature °CClock CAN From CEM Time value sPM CAN From CEM Power mode
The battery current Ibat , the battery voltage Ubat and the battery temperature Tbat is collected via the battery sensor. This indata is required to monitor the battery status and to perform SOC calculation. The Clock signal is generated from the internal clock in CEM. It gives a time value that is used in the model to calculate the time difference between two specific events. The PM signal carries the power mode parameter that describes the ignition-key position. It is of importance since it is the parameter indicating present work condition for the vehicle, and thereby is a main influence on the desired working condition for the battery sensor. Power mode is available on the CAN bus and used by several control modules in the vehicle. It can hold one of eleven values, not only describing the present key position, but also previous position, i.e. from what position the key is turned and to what position it is going. The eleven power mode values with corresponding interpretation is presented in table 5.2.
SOFTWARE IMPLEMENTATION
21

JONSSON │SUNDSTRÖM
Table 5.2 Power mode values.
Value Interpretation Value Interpretation
0 Key out 6 Ignition on 1 Key recently out 7 Running 2 Key approved 8 Not used 3 Post accessory 9 Crank 4 Accessory 10 Not used 5 Post ignition
5.2.2 Battery sensor mode computation
A battery sensor mode computation block (see appendix A.2) is needed to establish the desired frequency for which the battery sensor should operate. The sensor mode also determines the execution frequency for the entire model. This way the SOC calculation is performed every time new data is collected from the battery sensor. There are three different sensor modes used in the model. These modes are based on how the battery sensor can measure current and also aims to maintain a low current consumption during engine off. The conditions for altering sensor mode are presented in figure 5.6.
SOFTWARE IMPLEMENTATION
Stand-by mode(1/4096 Hz)
PM ≥ 2
Yes
NoIbat ≥ 70 mA
Yes
NoTime < 1800 s
Yes
No
Engine-off mode(1 Hz)
PM ≥ 6
Yes
No
Engine-on mode(200 Hz)
Figure 5.6 The battery sensor mode computation flowchart.
22

JONSSON │SUNDSTRÖM
Battery sensor mode 1, Stand-by mode, denotes that the battery sensor operates at 1/4096 Hz and has a measuring range of +/- 30 A with a resolution of 1 mA. The chosen stand-by frequency is the closest possible to obtain an hourly measurement of the battery voltage, current and temperature. The mode can only be set when the PM value is 0 or 1, and the current transferred to/from the battery is less than 70 mA. Small currents indicate that the vehicle is not in use and a low current consumption is desirable. When the engine is turned off, an engine cooling fan may run for up to 30 minutes. The duration depends on engine temperature and makes it possible for the fan to switch on and off as the temperature fluctuates. The signal that regulates the cooling fan is sent directly from the ECM to the fan and is therefore not available as a parameter in the model. Hence the stand-by mode can not be set until 30 minutes after the engine has been turned off.
Battery sensor mode 2, Engine-off mode, denotes that the battery sensor operates at 1 Hz and has a measuring range of +/- 30 A with a resolution of 1 mA. This mode can be set if PM ranges between 0 and 5. The mode is used when the current flow is higher then 70 mA and the engine is off. The threshold of 70 mA is set to ensure that larger currents will be measured with higher frequency.
Battery sensor mode 3, Engine-on mode, denotes that the battery sensor operates at 200 Hz and has a measuring range of +/- 1000 A with a resolution of 50 mA. This mode is always set when the PM value is 6 or higher. These values for PM are used when the ignition is on, the engine is running or the starter is cranking the engine. Short pulses during crank can make the current from the battery peak up to 900 A. The reason for setting the battery sensor to operate at 200 Hz when ignition is on, although engine is still off, is to ensure that the high peaks of currents during crank will be measured.
5.2.3 State of charge calculation
The SOC calculation block (see appendix A.3) is based on a combination of the voltage method and the current method.
The voltage method is used if the vehicle has been in stand-by mode for at least 8 hours. Voltage and temperature are measured hourly in stand-by mode since the behaviour of lead-acid batteries is strongly influenced by temperature. The relation between voltage and temperature gives that an increased battery temperature, with constant SOC, results in decreased battery voltage. After 8 hours, every measurement is compared in a look-up table to determine a new SOC value. The look-up table is associated with the specific battery type in the vehicle and has been developed by the battery manufacturer. The currents consumed by the vehicle in stand-by mode are small and therefore the battery voltage is considered to be OCV. This method sets an initial value for SOC and corrects errors that may have originated from the current method. The initial SOC value is then multiplied by the rated capacity for the battery in order to obtain the available capacity expressed in ampere hours (Ah). This value serves as an initial value for the current method.
SOFTWARE IMPLEMENTATION
23

JONSSON │SUNDSTRÖM
The current method implies that the current from the battery is integrated over time. This is done by dividing the current with the battery sensor operating frequency. The integrated current is also divided by 3600 in order to express the current in Ah. This value is then added to the previous Ah value, or the initial value calculated with the voltage method (see figure 5.7). The new Ah value is finally divided by the battery’s rated capacity and multiplied by 100 in order to obtain the available capacity expressed as SOC.
To make the model dynamic, there are two setup parameters that are defined in MATLAB. One parameter represents the sample time and obtains the inverted operating frequency value. The sample time parameter is used to integrate the current over time when the current method is applied. The other parameter represents the battery’s rated capacity and is set to the value nominated by the manufacturer for the specific battery.
SOFTWARE IMPLEMENTATION
Previous Ah from current method
Stand-by mode
Yes
No
Ah initiation from voltage method
Time ≥ 8 h
Yes
No
Integrated Ahfrom battery
Figure 5.7 The SOC calculation flowchart.
24

JONSSON │SUNDSTRÖM
5.2.4 Output signals
The two main output signals from the software model are the results of the battery sensor mode computation block and the SOC calculation block respectively. Except for the SOC value the SOC calculation block also calculates some additional output signals related to SOC. The output signals from the software model are displayed in table 5.3.
Table 5.3 Output signals from the software model.
Signal Bus Destination Description Unit
Mode LIN Battery sensor Battery sensor mode SOC CAN CEM Calculated SOC %Pos CAN CEM Sum of positive currents AhNeg CAN CEM Sum of negative currents AhSum Pos/Neg CAN CEM Sum of all currents AhNeg accessory mode CAN CEM Sum of negative currents Ah during accessory modePos accessory mode CAN CEM Sum of positive currents Ah during accessory mode
The Mode signal is the output from the battery sensor mode computation block and regulates in which mode the battery sensor should operate. The signal also determines the execution frequency for the SOC calculation block. Allowed signal values are 1, 2 or 3 where 1 represent stand-by mode, 2 represent engine-off mode and 3 represent engine-on mode.
The SOC signal is the output from the SOC calculation block. It is the available capacity expressed as a percentage of its rated capacity and the main output signal.
The Pos signal is the summation of all integrated currents into the battery, i.e. charging current, independent of PM. The Neg signal is the summation of all integrated currents from the battery, i.e. discharging current, independent of PM. The Sum Pos/Neg signal is the charge balance and consists of the summation of all integrated charging/discharging currents to the battery.
The Neg accessory mode signal is the summation of all currents from the battery while PM is in accessory mode. Accessory mode indicates that the vehicles convenience equipment may be in use, with the battery as sole power source since the engine is off. The Pos accessory mode signal is the summation of all currents into the battery while PM is in accessory mode. Currents into the battery can only occur if it is charged with an external charger, since the engine is turned off in accessory mode.
SOFTWARE IMPLEMENTATION
25


JONSSON │SUNDSTRÖM
6
RESULTS
In this chapter the results from tests and evaluations of the software models are presented. The results of battery sensor mode computation and state of charge calculation are displayed graphically. The battery sensor mode is evaluated in relation to the power mode parameter and the accuracy of the state of charge calculation is compared to a reference model.
6.1 Battery sensor mode evaluation
To evaluate the functionality of the battery sensor mode computation block, the output signal Mode is plotted in relation to the power mode parameter PM. The result is visualised in figure 6.1.
0
1
2
3
4
5
6
7
8
9
10
0 600 1200 1800 2400 3000 3600 4200 4800 5400 6000 6600 7200 7800
Time (s)
Valu
e
Power mode
Battery sensor mode
Figure 6.1 The battery sensor mode in relation to power mode.
27

JONSSON │SUNDSTRÖM
Initially, during key out and PM equals 0, Mode accurately holds the value 1 representing the stand-by mode. After 60 seconds, the key is inserted, approved and directly turned to accessory mode. PM takes the value 4 and Mode correctly takes the value 2, representing engine-off mode and an operation frequency of 1 Hz. The key is kept in accessory mode for 60 seconds.
As the key is turned into next position, ignition on, PM takes the value 6 and Mode takes the value 3, representing an operation frequency of 200 Hz. At this state the battery sensor is prepared for the high peaks of current during crank. The ignition-on mode is kept for 60 seconds before the engine is actually cranked. PM takes the value 9 during the short period of crank. Over the following hour, while the engine is running, PM takes and holds the value 7 and Mode accurately remains holding the value 3.
When the engine is turned off, PM takes the value 5 and Mode correctly takes the value 2, representing the slower operating frequency of 1 Hz. Simultaneously the present Clock value is saved from CEM in order to keep track of when the engine was turned off. PM is then kept in accessory mode, value 4, for 60 seconds before the key is taken out, which in turn results in a value of 1 and finally 0. At the same time Mode correctly remains in value 2 for 30 minutes to cover the eventual load of the engine cooling fan. After 30 minutes Mode takes and holds the value 1, representing stand-by mode. This assumes that the condition Ibat < 70 mA is fulfilled, otherwise Mode would continue to hold the value 2, operating at 1 Hz and measuring the current.
6.2 State of charge accuracy
The calculated SOC from the development platform is compared with a reference simulation model, which is based on the porosity method. The reference model consists of a lead-acid battery simulation software named ISET-LAB [16]. ISET-LAB truthfully simulates the dynamic behaviour of lead-acid batteries by modelling all relevant physical and electrochemical processes inside the electrodes of a single battery cell [22].
All input data to the calculated SOC and the simulated reference model are recorded data from real car tests, though with different purposes. The tests where conducted during extreme environmental conditions. The warm condition test had an ambient temperature of 40 °C and the cold condition test had an ambient temperature of -15 °C. Regardless of environmental conditions the car battery was fully charged and then discharged under controlled conditions to obtain an initial SOC value of 75 % before the test. The data recorded from the tests does not include stand-by-mode data prior to the test. Therefore an accurate stand-by voltage can not be retrieved, to calculate an initial SOC value from the recorded test data. Instead the known initial SOC value of 75 % is used as a start value, when calculating SOC and for the reference simulation. The true SOC value of the battery at the end of each cycle was not measured in the tests. Thus an evaluation of the calculated SOC compared to the true battery SOC can not be done. A comparison of the calculated SOC value and the simulated reference model is presented in figure 6.2 and figure 6.3.
RESULTS
28

JONSSON │SUNDSTRÖM
The cold condition test cycle was conducted for one hour, with the engine running the whole cycle.
The previously stated initial SOC value of 75 % is verified for both curves in the graph. The final SOC value for the calculated SOC is 76.01 % and the corresponding value for the simulated porosity model is 75.96 %. This result in an accuracy within 0.05 percentage units for the SOC calculating model compared to the simulated reference model.
The warm condition test cycle was conducted for two hours. During the first hour the car was driven a designed course and then it was left with the engine off for one hour.
74
76
78
80
82
84
86
88
90
0 600 1200 1800 2400 3000 3600
Time (s)
SOC
(%)
Reference SOC basedon porosity
SOC
Figure 6.2 The SOC calculation compared to a reference model in cold conditions (ambient temperature approximately -15 °C).
RESULTS
29

JONSSON │SUNDSTRÖM
The initial SOC value for the calculated SOC is 74.77 % and the initial value for the simulated porosity model is 74.83 %. During the first hour, when the engine is running, both curves are almost identical with an increasing SOC value. The peak SOC value, just prior to engine off, for the calculated SOC value is 88.56 % and for the simulated porosity model it is 88.63 %. Both the initial value as well as the peak value for the two methods is within 0.07 percentage units. At the end of the cycle the calculated SOC value is 87.65 %, which is within 0.4 percentage units of the simulated porosity SOC value of 87.97 %.
Figure 6.2 and figure 6.3 shows that the SOC calculating model is very accurate during engine on, compared to the simulated value. The main error in the warm condition test appears after the engine is turned off, and increases with time. This accentuates the importance of a correct initial SOC value after the vehicle has been in stand-by mode. The initial SOC value is calculated by using the voltage method, which is dependant of both voltage and temperature. The offset error due to inaccuracy of measurement in the battery sensor is shown in figure 6.4 and figure 6.5. Maximum offset error is +/- 3.5 percentage units.
RESULTS
74
76
78
80
82
84
86
88
90
0 600 1200 1800 2400 3000 3600 4200 4800 5400 6000 6600 7200 7800
Time (s)
SOC
(%)
Reference SOC based onporosity
SOC
Figure 6.3 The SOC calculation compared to a reference model in warm conditions (ambient temperature approximately 40 °C).
30

JONSSON │SUNDSTRÖM
RESULTS
70
72
74
76
78
80
82
84
86
88
90
92
0 500 1000 1500 2000 2500 3000 3500 4000
Time (s)
SOC
(%)
Offset Error Range
SOC
70
72
74
76
78
80
82
84
86
88
90
92
0 1000 2000 3000 4000 5000 6000 7000 8000
Time (s)
SOC
(%)
Offset Error Range
SOC
Figure 6.4 The SOC offset error range in cold conditions.
Figure 6.5 The SOC offset error range in warm conditions.
31


JONSSON │SUNDSTRÖM
7
DOCUMENTATION
In this chapter the development platform documentation process is described. An introduction to why to document a product or procedure is made. Further the purpose and limitations for the platform documentation are stated and the process methodology is presented. The process is described from feasibility study, through draft one, user studies and revision, to a final draft.
7.1 Introduction
The aim during any technical development has to be to design products and systems in accordance with the user’s conditions. But at the same time, the user may need support to understand, for example, the mechanism of a complex technical system. If this support is not available it can result in products being installed and used ineffective or incorrectly. This, in its turn, can bring about loss in functionality; unnecessary product wear; an increased number of incidents and in worst cases cause accidents damaging the product or its operator. A technical product therefore not only consists of the product itself. It also includes information and documentation about its management, e.g. assembly, installation, functions, use and maintenance.
To work properly though, the technical documentation has to be designed with focus on the group of users it is targeting. The information must be based on its users, taking both substance and shape into consideration. The documentation shall provide the user with the information needed depending on the situation, and in a shape that makes the information accessible and comprehensible. The information has to be designed to attract the user to adapt it, and it also has to provide the settings and support required for learning and managing the product.
To fulfil this objective a great insight in the problem and an understanding for the user’s situation, limitations and conditions is necessary. Especially knowledge in how users perceive, comprehend and assimilate information is of importance [23].
7.1.1 Purpose and limitations
The purpose is, as stated in chapter one, to document the development platform for easy use, and in such a way that it can be an alternative for other applications at Volvo Cars. More
33

JONSSON │SUNDSTRÖM
specific the purpose will be to create a manual describing the procedure on how to generate C code from Simulink using Real-time workshop, and how to compile and load that C code, via XCC and BDM, on to the development board.
The documentation will be based on usability, i.e. how the target group of users shall utilize the platform. How the system works is less important than how to work the system to the advantage of the user [24], i.e. there will be no information about the underlying technology (though most parts of that technology are already explained in this report).
The manual will not describe how to create models in Simulink. The reason is that there already exists a vast amount of documentation on this extensive subject, both in paper form and on the Internet. However there may be references to these sources in the manual. Neither will the manual describe other possibilities and alternatives the software (Simulink, RTW, XCC and BDM) may possess, but will focus exclusively on the stated procedure to get the functionality of a completed model in Simulink correctly loaded on to the development board.
7.2 Method
The documentation process start with a feasibility study which mainly sum up the knowledge obtained by the authors’ of this report during the work with the hardware and the software tools. The target group is defined in an audience analysis. The first version of the manual is largely based on the authors’ observations and learning’s taking into consideration the preferences of the target group. The first version is evaluated in the first user study and the analysis of the result constitutes the base for the revision and the second version of the manual. This in its turn is evaluated in the second user study and the result is compared with the first user study to determine the effectiveness of the manual.
7.2.1 Feasibility study
The purpose with the feasibility study is to organize the information and to sum up the knowledge’s in generating, compiling and loading code obtained by the authors during the work with the hardware, the software and the different tools involved in the process.
The communication medium selected for the manual is printed documentation. The advantages with print are that it is relatively inexpensive; easy to duplicate; portable and compact. It is also practical and easy to handle during vehicle field tests. Alternative mediums like online documentation or video do not fulfil these demands. The instructions are written in English since Volvo Cars is an international corporation within the Ford group and employing many different nationalities. The format of the manual is set to G5, because it is a practical and easy to handle size, appropriate for e.g. a glove compartment or computer case.
DOCUMENTATION
34

JONSSON │SUNDSTRÖM
When performing an audience analysis to determine the target group of users the manual will be facing, it results in the following profile: users are of both genders, but an overwhelming majority are men, and approximately between 25 to 65 years old with an average around 35. They are high educated, working mainly as engineers and they already possess good computer skills. The authors’ knowledge’s with the intended users in mind makes the foundation for the first version of the manual.
7.2.2 User studies
The purpose with the user studies is to determine advantages and disadvantages of the manual based on four subjective and four objective measures. The subjective measures are designed to answer questions targeting problems in the instruction, this as a direct help when revising the manual. The objective measures are designed to be immediately measurable for easy comparison between the user studies and the effectiveness of the different versions of the manual respectively.
Subjective measures:
● If text and picture portray what to be done, both on their own and together.
● If the layout, i.e. typeface, size and style of text and pictures etc. are to satisfaction. ● If the language, i.e. choice of words, terminology etc. is understandable.
● The overall impression of the manuals ability to help perform the instruction.
Objective measures:
● Total time for the test person to performing the instruction from start to end without pauses.
● The number of times the test person have to stop and go back in the instruction.
● The number of times the test person performs a wrong instruction. ● The number of times the test person asks for help.
Two empirical studies are performed, user study 1 and user study 2. The first study is to evaluate the first draft of the manual, serving as a foundation for the revised version. The second study is to evaluate the revised manual, comparing the effectiveness of the two versions. Both user studies are implemented in exactly the same way to guarantee a correct comparison between the effectiveness of the different versions of the manual.
The studies are performed at Volvo Cars in a separate room with one test subject at the time. A test leader is present during the entire study, observing the test subject. There are three test subjects per study. The reason for this small quantity is the relatively limited target group and the narrow group of people at the Department of Power Supply Systems that will be using
DOCUMENTATION
35

JONSSON │SUNDSTRÖM
the development platform initially. It shall be pointed out that this means that the results can not be regarded as statistically reliable, thought it will give an indication about the trend. The test subjects are timed during their performance and asked to think out loud and continuously state which part of the instruction they are currently performing. When the test subjects consider themselves ready with the instruction, they are interviewed and have to answer a short questionnaire. The reason is to determine the subjective measures and the test subjects’ opinion of the instruction.
The interview consists of twelve questions (see appendix B.1) constructed to bring forward what the test subjects consider as positive and negative with the instruction. The interview is the main instrument to establish the subjective measures. In some cases there may be reason to ask resulting questions to secure what the test subject actually means.
The questionnaire (see appendix B.2) is designed as seven statements which the test persons have to grade on a scale of five. The scale span from one (1) which represent “do not concur at all”, to five (5) which represent “concur entirely”. All statements are formulated in a positive tone towards the instruction. Low grades thereby indicate that the test subject considers the instruction as poor, and a high grades that the test subject considers the instruction as good. The statements are constructed based on the observations made in the feasibility study and intended to provide easily comparable grades on specific parts on the instruction.
7.3 Result of user study 1
The first user study consists of three test subjects, all matching the audience analyse profile. The subjects are all men, and all of them are working as engineers at the Department of Power Supply Systems at Volvo Cars. The age of the subjects span from 28 to 34 years old, see table 7.1.
Table 7.1 Gender and age distribution and occupation of the test subject of user study 1.
Subject Gender Age Occupation
Test subject 1 Male 29 EngineerTest subject 2 Male 28 EngineerTest subject 3 Male 34 Engineer
The test subjects are asked to follow the instructions of the first version of the manual. The result of the user study is based on analysis of the questionnaire, the interview and the observations made of the test subjects during performance.
DOCUMENTATION
36

JONSSON │SUNDSTRÖM
In an analysis of the results of the questionnaire the test subjects’ main criticism of the manual is the quality of the pictures. They are not clear and understandable enough. Also the part of the manual that instructs on how to generate C code from Simulink receives poor grades. The result of the answers of the questionnaire, which also reflects the subjective measures, is presented in figure 7.1.
The result of the interviews confirms the result of the questionnaire. The main objection to the manual is the size of the pictures. All test subjects consider the pictures to be to small and hard to understand. Some pictures are also regarded as unnecessary. The solutions proposed are simply less but larger pictures and maybe to connect the text instructions to the corresponding pictures with lines. Except for the pictures the manual receives fairly good opinions. The text is easy to understand and the amount of information per point is regarded as sufficient. The overall impression of the manuals ability to help perform the procedure seems to be good. Some opinions are raised about more information about the purpose of the manual.
Observations of the test subjects during the user study results in more information about the manuals effectiveness. The observations reveal that all the test subject have problems locating the C files after the generation. Apparently the manual does not point out clearly where the files end up after the procedure. The result is that the test subjects have to ask for help. Another mistake in the manual is that the instruction on how to start the software is missing. To the authors’ this procedure is obvious because it has been done so many times, but for the test subjects this causes problems and raises questions. A final observation from user study 1 is that the test subjects on two occasions in the manual automatically (and correctly) select Save or Yes without waiting for these instructions, which make the instructions unnecessary.
Figure 7.1 The result of the seven statements of the questionnaire (se appendix B.2) in user study 1. The grade 1 represents “Do not concur at all” and the grade 5 represents “concur entirely”.
0
1
2
3
4
5
1 2 3 4 5 6 7
Statement
Gra
de
Test subject 1
Test subject 2
Test subject 3
DOCUMENTATION
37

JONSSON │SUNDSTRÖM
The objective measures are observed and recorded during the user study. The measures are; total time of performance, number of times the subjects stops, number of times the subject do wrong, and number of times the subjects asks for help. The results are collected in table 7.2.
Table 7.2 Observations of the objective measures in user study 1.
Subject Total time Nr of stop Nr of wrong Nr of help
Test subject 1 15:42 min 1 - 4Test subject 2 19:59 min - 1 3 Test subject 3 18:29 min 1 1 3
Average 18:03 min 0.66 0.66 3.33
The help required were almost exclusively related to the problems already stated. Overall the result of user study 1 is that the pictures are too small and unclear. The location of generated files is not sufficiently explained. Some of the instructions are unnecessary, while others instead are totally missing. Also the purpose of the manual should be stated more clearly.
7.4 Revision of manual
With the results, observations and opinions received from user study 1 as a starting point the manual is revised. Focus is on the instructions and parts that were criticised. Format and outline are not altered. The main revision is made on the pictures. They are scaled up for a more details and a clearer view. Some unnecessary pictures, viewing the same information as others, are deleted. Lines connecting the text instructions with the corresponding action in the pictures are introduced, and implemented in the manual in accordance to [25]. This is to make both the text instructions and particularly their connection to the pictures easier to comprehend.
The instructions concerning file locations and settings for working directories are revised. This to help the users find specified files easier. Individual instructions of the type Save or Yes are deleted. These were instructions that the experienced computer users in user study 1 considered unnecessary and performed without help from the manual. The missing instructions on how to start the software are implemented instead. As a result of the users’ opinions, the purpose with the manual is described in a short introduction. Also the limitations and the intended outcome of the manual are presented. Further the software and hardware requirements are stated in the introduction.
The result of the revision is a final draft of the manual (see appendix B.3).
DOCUMENTATION
38

JONSSON │SUNDSTRÖM
7.5 Result of user study 2
As the first study, the second user study consists of three test subjects, all matching the audience analyse profile. Two men and one woman are participating, all of them are working as engineers at the Department of Power Supply Systems. The age of the subjects span from 35 to 38 years old, see table 7.3.
Table 7.3 Gender and age distribution and occupation of the test subject of user study 2.
Subject number Gender Age Occupation
Test subject 4 Male 38 EngineerTest subject 5 Male 38 EngineerTest subject 6 Female 35 Engineer
The test subjects are asked to follow the instructions of the revised version of the manual. As with the first user study, the result of user study 2 is based on analysis of the questionnaire, the interview and the observations made of the test subjects during performance. However, this time the result is not primarily intended for revision of the manual. Instead the result is used for comparison with the result of user study 1 in order to find out if the effectiveness of the manual has increased as intended.
The questionnaire answers reflect an improved satisfaction with the final version of the manual. The grades are high on all statements, also on those who received less good grades in user study 1. The result of the answers of the questionnaire is presented in figure 7.2.
0
1
2
3
4
5
1 2 3 4 5 6 7
Statement
Gra
de
Test subject 1
Test subject 2
Test subject 3
Figure 7.2 The result of the seven statements of the questionnaire (see appendix B.2) in user study 2.
DOCUMENTATION
39

JONSSON │SUNDSTRÖM
The interview answers and the user observations also verify a higher degree of user satisfaction. Both the interview and the observations reveal basically the same information. There still exists some uncertainty about file and folder locations, but not enough to affect the general ability to perform the instructions. It causes one of the test subjects to stop and go back in the instruction once for confirmation. Except for this the manual obtains only positive reviews in the interviews. The overall opinion is that it is an easy to follow manual, which accurately helps perform the procedure it is describing. It is also stated that users who want to know more about background or technology have to find this information elsewhere. This information is intentionally left out of the manual, focusing entirely on the procedure for correct implementation. And the observations of the objective measures in user study 2 (see figure 7.4) reveals that the number of incorrect actions has decreased compared with user study 1.
Table 7.4 Observations of the objective measures in user study 2.
Subject number Total time Nr of stop Nr of wrong Nr of help
Test subject 4 20:15 min - - -Test subject 5 12:51 min - - - Test subject 6 16:30 min 1 - -
Average 16:32 min 0.33 - -
7.6 Evaluation
When comparing the results of the questionnaire answers, which reflect the subjective measures, the final draft receives higher grades. The final version receives an average grade of 4.7 in user study 2, to be compared with an average grade of 3.7 for the first draft of the manual evaluated in user study 1. As the questionnaire is designed, a higher grade indicates that the user considers the manual as more effective. Hence, the trend, when comparing the final draft of the manual with the first, is a higher user satisfaction with the final version.
When comparing the results of the objective measures, the trend from the subjective measures is verified. The average time for performance is slightly faster, about 1.5 minutes, when using the final version of the manual compared with the first draft. But, much more important, there are no wrong actions performed and there is no need for outside help. When using the first draft of the manual the test subjects needed outside help more than three times in average. The corrections of these problems in the final version have significantly increased the effectiveness and usability of the manual.
DOCUMENTATION
40

JONSSON │SUNDSTRÖM
8
DISCUSSION
In this chapter the outcome of this master thesis work is discussed. Conclusions drawn from evaluation and test results are presented. Further recommendations for future work are made.
8.1 Conclusions
The conclusions are presented with this master thesis’ purpose in mind, as it is stated in the introduction. The conditions for implementing the development platform, the reliability of the SOC calculation model and the usability of the platform documentation are discussed.
8.1.1 Development platform
The battery sensors operating data and measuring data show that it is well suited as a data provider for the SOC calculation model. The development boards CAN and LIN interface makes it very well adapted for integration with the power supply system in a car. With a power supply range of 12-48 V the board is powered directly from the vehicle. The development board’s processor is relatively powerful with a programmable memory of 256 kB and a clock frequency of 8 MHz. As shown in chapter five the development board can be programmed with a Simulink model. However, the downloaded software can not function on the board as it is, since there is no interface between the Simulink model and the development board. The XCC software used, for compiling C code to executable code, is a beta version and has some minor faults regarding reliability and functionality. The BDM software, used to download the executable code on to the debug adapter, work without problem.
8.1.2 SOC calculation model
The results from chapter six show that the created SOC calculating model is acceptable for determining battery SOC. The data used for the SOC calculation and for the simulated reference SOC where from authentic tests, recorded from test vehicles. However, none of the tests were conducted with the purpose of recording data for the Simulink model. This resulted in insufficient data for a total evaluation of the model. Desirable tests would include;
41

JONSSON │SUNDSTRÖM
stand-by voltage to determine an initial value for SOC, test cycles where the SOC level raises towards 100 % and a longer stand-by cycle to examine the functionality of the different modes for the battery sensor. After completed test the battery needs to be disconnected from the vehicle so that the true battery SOC value can be determined, e.g. by using the specific gravity measurements method, and compared to the calculated SOC.
8.1.3 Documentation
The result from the documentation chapter indicates that the development platform is documented effectively and with high usability. The manual contains no technical information or background, but it fulfils the purpose for which it has been developed. It describes how the target group of users shall utilize the platform. This information is not department specific, and therefore, from the documentation point of view, the development platform can be an alternative for other departments at Volvo Cars. But this depends much more on the development of a fully operational version of the platform.
8.2 Future work
To implement the development platform in practice future work has to be done. The software model also needs revision to cover all possible situations.
8.2.1 Development platform
A requirement for a fully operational development platform is the implementation of a communication interface between the platform and the Simulink model, handling the input and output signal. Proposed solutions for this problem is either the implementation of an underlying operating system on the platform, or the development of signal handling blocks directly in Simulink. Using an OS on the development board allows for uncomplicated Simulink models but restrain the flexibility of the model. Implementing CAN/LIN drives in Simulink allows for flexibility and autonomy but entails complex modelling.
8.2.2 SOC calculation model
The SOC model is just a first draft and need more adjustments and further functions to manage all possible situations. No consideration to ageing factors, such as SOH, has been taken to in the model. All tests where conducted on new cars with new and healthy batteries, thus SOH was no factor when calculating SOC. In order to determine SOC, as the battery ages and its capacity degenerates, an implementation of SOH into the SOC calculating model is needed.
DISCUSSION
42

JONSSON │SUNDSTRÖM
REFERENCES
[1] Volvo Car Corporation. 2006. Accessed 2 Jun. 2006. <http://www.volvocars.com>
[2] Meissner, E. and Richter, G. ”Battery Monitoring and Electrical Energy Management Precondition for future vehicle electric power systems” Journal of Power Sources 116 (2003) 79-98.
[3] Karden, E., Shinn, P., Bostock, P., Cunningham, J., Schoultz, E. and Kok, D. ”Requirements for future automotive batteries - a snapshot” Journal of Power Sources 144 (2005) 505-512.
[4] Meissner, E. and Richter, G. ”The challenge to the automotive battery industry: the battery has to become an increasingly integrated component within the vehicle electric power system” Journal of Power Sources 144 (2005) 438-460.
[5] Hella KGaA Hueck & Co. 2006 Accessed 1 Jun. 2006. <http://www.hella.com>
[6] Kellaway, M.J. ”The automotive battery of the future - the role of electronics” Journal of Power Sources 144 (2005) 467-472.
[7] Hellsing, J. and Larsson, T. Department of Power Supply Systems, Volvo Cars. Personal interviews. 2006.
[8] Lindsay, T. Alternator Secrets. Bradley: Lindsay Publications 1986.
[9] Varta Automotive. 2006. Accessed 11 May. 2006. <http://www.varta-automotive.com>
[10] Linden, D., ed. Handbook of Batteries. 2nd ed. New York: McGraw-Hill, Inc. 1995.
43

JONSSON │SUNDSTRÖM
[11] Controller Area Network (CAN) - CAN in Automation (CiA). 25 May 2006. Accessed 1 Jun. 2006 <http://www.can-cia.org>
[12] Robert Bosch GmbH - Automotive Semiconductors and Sensors. 2006. Accessed 29 May 2006 <http://www.can.bosch.com>
[13] LIN Consortium. 2006. Accessed 15 May 2006. <http://www.lin-subbus.org>
[14] Electrical Energy Management. System Requirement Description. Document no: 31812100, Ford Motor Company.
[15] Battery Technology Encyclopaedia and Tutorial. 2005. Accessed 20 Jun. 2006. <http://www.mpoweruk.com>
[16] Nicklasson, A. Department of Analysis and Verification, Volvo Cars. Personal interview. 2006.
[17] Berndt, D. Maintenance-Free Batteries. 2nd ed. Somerset: Research Studies Press 1997.
[18] Intelligent Battery Sensor. Sample Description. 2004.
[19] GAST Project. 18 Feb. 2005 Accessed 27 Feb. 2006. <http://www.chl.chalmers.se/gast>
[20] The MathWorks - MATLAB and Simulink for Technical Computing. 2006. Accessed 20 Mar. 2006 <http://www.mathworks.com>
[21] Göteborgs Mikrovaror. 2006. Accessed 20 Mar. 2006. <http://www.gbgmv.se>
[22] Institut für Solare Energieversorgungstechnik. 2006. Accessed 22 Aug. 2006. <www.iset.uni-kassel.de>
[23] Barnum, C.M. and Carliner, S., eds. Techniques for Technical Communicators. Needham Heights: Allyn and Bacon 1993.
[24] Weiss, E.H. How to Write Usable User Documentation. 2nd ed. Phoenix: The Oryx Press 1991.
[25] Matthews, C. A Guide to Presenting Technical Information - Effective Graphic Communication. Suffolk: Professional Engineering Publishing Limited. 2000.
REFERENCES
44

JONSSON │SUNDSTRÖM
APPENDIX A
SIMULINK MODEL
45


JONSSON │SUNDSTRÖM
7Mode
6Neg accessory mode
5Pos accessory mode
4Sum Pos/Neg
3Neg
2Pos
1SOC
Tbat
Ubat
Ibat
PM
Clock
Mode
SOC
Pos
Neg
Sum Pos/Neg
Pos accessory mode
Neg accessory mode
SOC Calculation
Ibat
PM
Clock
Mode
Battery sensor modecomputation
5Clock
4PM
3Ibat
2Ubat
1Tbat
Appendix A.1 The Simulink main model with input and output signals.
APPENDIX A.1 – SIMULINK MAIN MODEL
47

JONSSON │SUNDSTRÖM
1M
ode
PM
Clo
ckTim
edi
ffere
nce
Tim
edi
ffere
nce
<=1
PM
key
out
AN
D
Con
ditio
nfo
rst
d-by
3
Bat
tery
sens
orm
ode
3
2
Bat
tery
sens
orm
ode
2
1
Bat
tery
sens
orm
ode
1
|u|
Abs
>=6
>=2
>=1
>=0.
07
>=18
00
30m
in3
Clo
ck2 PM 1 Ibat
Appendix A.2 The battery sensor mode computation block.
APPENDIX A.2 – SENSOR MODE COMPUTATION BLOCK
48
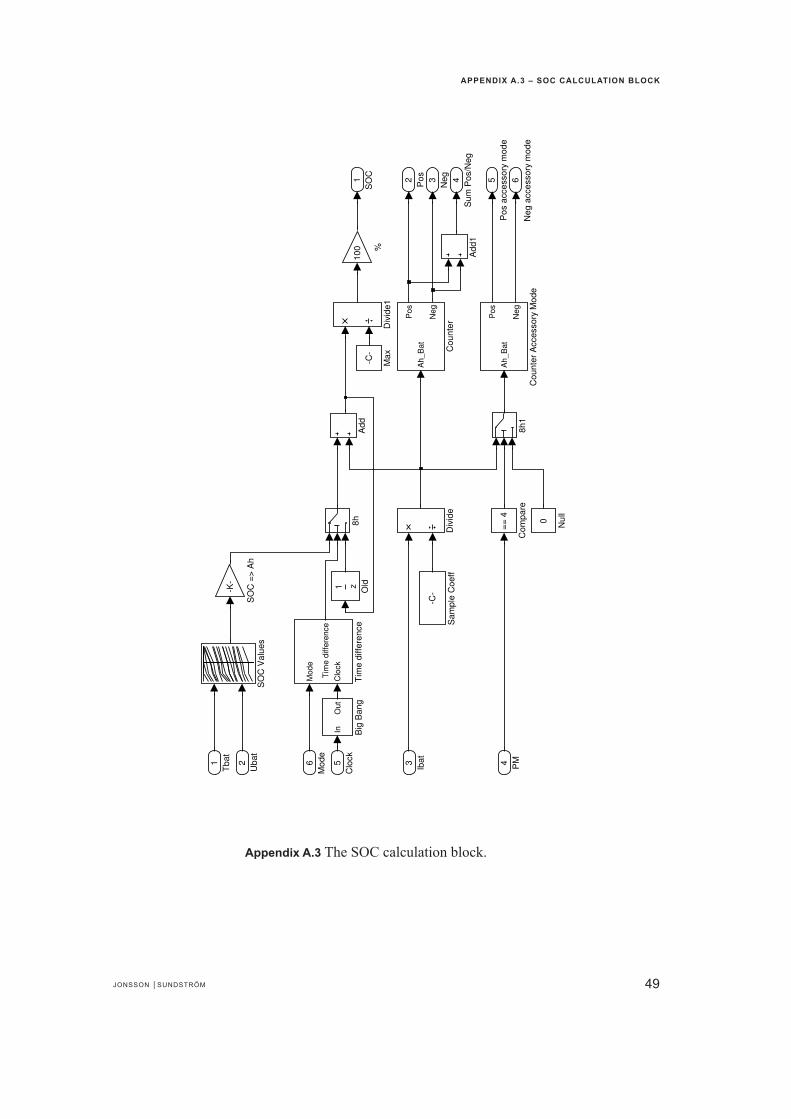
JONSSON │SUNDSTRÖM
APPENDIX A.3 – SOC CALCULATION BLOCK
6Neg
accessorymod
e
5Pos
accessorymod
e
4Sum
Pos/Neg
3Neg2 Pos1
SOC
Mode
Clock
Timediffe
rence
Timediffe
rence
-C-
Sam
pleCoe
ff
SOCValue
s
-K-
SOC=>
Ah
z1 Old
0 Null
-C-
Max
Divide1
Divide
Ah_Bat
Pos
Neg
Cou
nter
AccessoryMod
e
Ah_Bat
Pos
Neg
Cou
nter
==4
Com
pare
InOut
BigBan
g
Add
1
Add 8h1
8h10
0 %
6Mod
e
5Clock 4 PM3 Ibat2
Uba
t
1Tba
t
Appendix A.3 The SOC calculation block.
49


JONSSON │SUNDSTRÖM
APPENDIX B
MANUAL
51


JONSSON │SUNDSTRÖM
1. Did the text convey what to be done?
2. Did it feel easy to perform the instruction?
3. Were there any words or terms that were hard to understand?
4. Was there anything in the pictures that were indistinctive or confusing?
5. Did text and picture cooperate and convey the same message?
6. Were there at any point any conflict between text and picture?
7. Did you at any point feel that there was information missing from either text or picture?
8. Should more pictures make the instruction easier to execute?
9. Were the instruction divided into points in a natural way?
10. Did the points come in a natural order?
11. Did any point in the instruction feel too long?
12. Is there anything you feel could be improved in the instruction?
Appendix B.1 The interview questions.
APPENDIX B.1 – INTERVIEW QUESTIONS
53

JONSSON │SUNDSTRÖM
APPENDIX B.2 – QUESTIONNAIRE
1. The amount of information per individual point is good!
1 2 3 4 5
2. The language is easy to understand!
1 2 3 4 5
3. The text size is good!
1 2 3 4 5
4. The pictures are clear and easy to understand!
1 2 3 4 5
5. It is easily understandable from the instruction how to generate C code from Simulink!
1 2 3 4 5
6. It is easily understandable from the instruction how to compile the code in XCC!
1 2 3 4 5
7. It is easily understandable from the instruction how to load the code, via BDM, on to the development board!
1 2 3 4 5
Appendix B.2 The questionnaire. The scale span from one (1) which represent “do not concur at all”, to five (5) which represent “concur entirely”.
54

APPENDIX B.3 – MANUAL
Development PlatformUser’s Guide
► How to generate C code, from a Simulink model, targeting the Development Board HCS12
► How to compile the C code, in XCC, to a executable file intended for the Development Board HCS12
► How to load the executable file, via BDM, on to the Development Board HCS12
Final Version2006

This guide describes the procedure on how to get the functionality of a Simulink model correctly implemented on the HCS12 processor on the development board. The result of the procedure will be a programmed and ready to use development board.
The procedure can schematically be described as:Simulink model Conversion to C code Compilation of the C code to an executable file Loading of executable file on to the board.
The guide will only describe the stated procedure. Focus will be on usability, detailed information about the software or hardware will not be included. Users are referred to Mathworks, www.mathworks.com, for more information about the MATLAB product family, or to the GAST project, www.chl.chalmers.se/gast, for more information about the rest of the software and the hardware.
Software requirements:MATLAB with software packages Simulink and Real-Time Workshop, for modelling and C code generation.XCC, for C compilation.BDM, user interface to the Debug Adapter for code downloading.
Hardware requirement:The Development Board HCS12.The Debug Adapter.A 12 V power source.
APPENDIX B.3 – MANUAL

A condition for this guide is the MATLAB software with packages Simulink and Real-Time Workshop,
Make sure to set desired working directory in MATLAB, this is where the result of the code generation will end up.
Open the Simulink model.
Select Simulation Configuration Parameters to open the Configuration Parameter dialog box.
► NOTE
► NOTE
1
2
2
How to generate C code, from a Simulink model,targeting the Development Board HCS12
APPENDIX B.3 – MANUAL

Select the Solver pane.
Set Type to Fixed-step.
Set solver to Discrete (no continuous states).
Select the Real-Time Workshop pane.
Click Browse to open the System target file browser.
3
4
5
6
7
In the Configuration Parameter dialog box:
3 4 5
APPENDIX B.3 – MANUAL

Select the system target file: ert.tlc. Make sure its description is RTW Embedded Coder (auto configures for optimized floating-point code).
Click Apply and then OK.
8
9
In the System target file browser:
6 7
8
9
APPENDIX B.3 – MANUAL
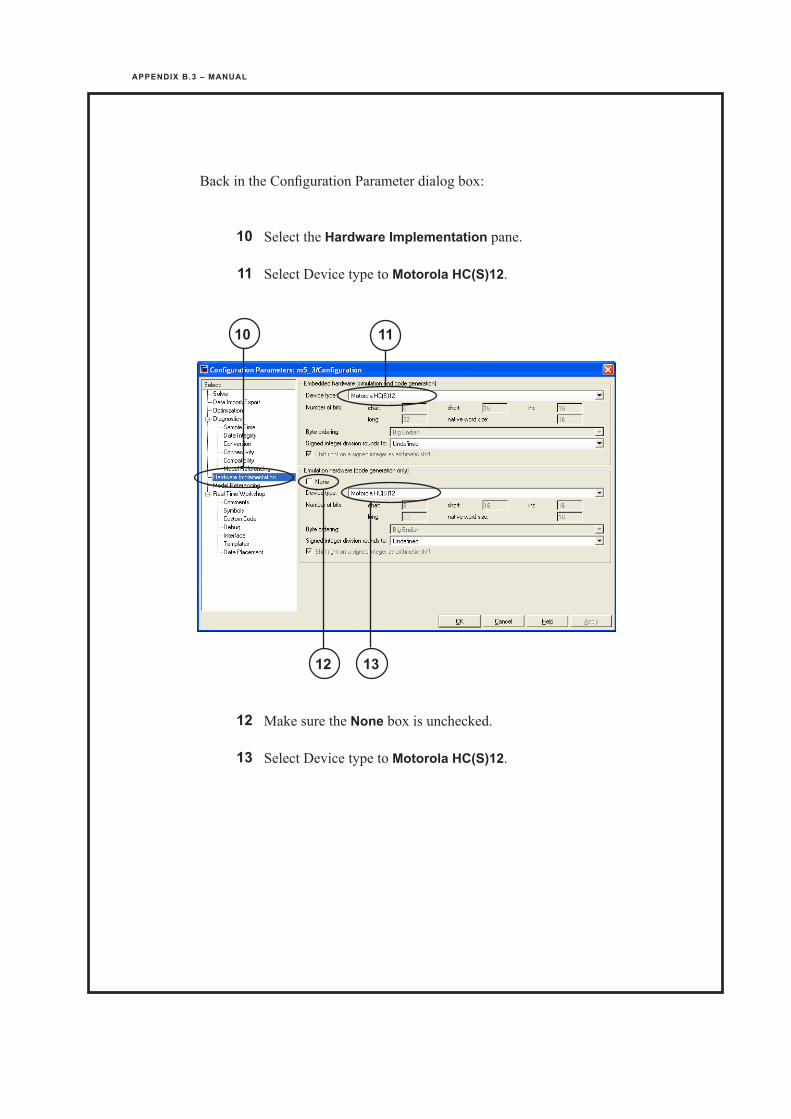
Select the Hardware Implementation pane.
Select Device type to Motorola HC(S)12.
Make sure the None box is unchecked.
Select Device type to Motorola HC(S)12.
10
11
12
13
Back in the Configuration Parameter dialog box:
10 11
12 13
APPENDIX B.3 – MANUAL

Select the Real-Time Workshop pane.
Make sure the Generate code only box is checked.
Click Apply.
Click Generate code to start generate code.
On successful completion of the C code generation process a confirmation message will be displayed in the MATLAB command window. If generation failure occurs an error message will be displayed. In this case, correct the reported problems, and repeat the steps 2-17.
The generated C and header files is saved in the MATLAB working directory in a ModelName_ert_rtw folder.
14
15
16
17
► NOTE
► NOTE
14 15
16 17
APPENDIX B.3 – MANUAL

A condition for this guide is the XCC compilation software and a successful completion of the C code generation process from Simulink.
Open the XCC software.
Select File New Workspace to create a new workspace.
How to compile the C code, in XCC, to a executable file intended for the Development Board HCS12
► NOTE
1
2
2
APPENDIX B.3 – MANUAL

Select your working directory as the Save in directory for the workspace.
Set a File name.
Click Save.
Select Project Insert New Project into Workspace to insert a new project.
3
4
5
6
In the Create Workspace dialog box:
Back in XCC:
3 4 5
6
APPENDIX B.3 – MANUAL

Set a File name.
Click Save to create a new project.
Make sure project type is Executable.
Click Done.
7
8
9
10
In the Create Project dialog box:
7 8
In the New Project Definition dialog box:
9 10
APPENDIX B.3 – MANUAL

Select Project Configuration as Final.
Make sure the Use standard startup box is checked.
Click OK.
Select Build Build Configuration Final.
11
12
13
14
In the Project settings dialog box:
11 12 13
Back in XCC:
14
APPENDIX B.3 – MANUAL

Make sure the standard startup file _startup.s12 is included in the project.
Select Project Insert Files into Project to add the generated C code to the project.
15
16
16
15
APPENDIX B.3 – MANUAL

Select the generated C (.c) and header (.h) files from theModelName_ert_rtw folder in your working directory.
Click Open to add the files.
Select Build Build All to start the compilation.
17
18
19
17 18
In the Add Files to Project dialog box:
Back in XCC:
19
APPENDIX B.3 – MANUAL

The result of the compilation is stored in the working directory in the \ProjectName\final folder.
The executable file intended for HCS12 is the ProjectName_final.s19 file.
If compilation failure occurs an error message will be displayed in the XCC window. In this case, correct the reported problems, and repeat the steps 11-17.
20
21
► NOTE
21
APPENDIX B.3 – MANUAL
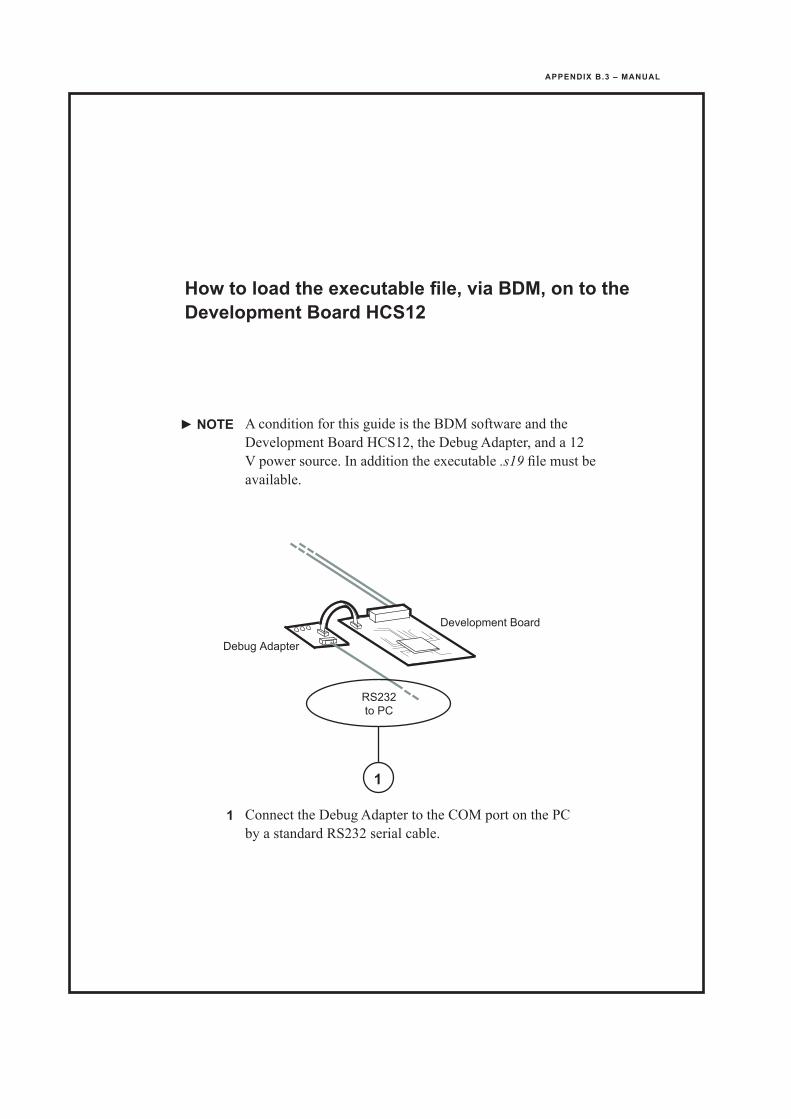
How to load the executable file, via BDM, on to the Development Board HCS12
► NOTE
1
A condition for this guide is the BDM software and the Development Board HCS12, the Debug Adapter, and a 12 V power source. In addition the executable .s19 file must be available.
Connect the Debug Adapter to the COM port on the PC by a standard RS232 serial cable.
Development Board
Debug Adapter
RS232to PC
1
APPENDIX B.3 – MANUAL

Power up the Development Board by connecting the Power Supply Wires to a 12 V power source.
Make sure the power is on by controlling that the light-emitting diode labelled L1 on the Debug Adapter is on.
2
3
Development Board
Debug Adapter
Power Supply Wires to 12 V
2
Development Board
Debug Adapter
3
APPENDIX B.3 – MANUAL

Open the BDM software
Select COM port.
Select Target Osc to 8 MHz.
Click Connect to connect the Debug Adapter.
Make sure BDM displays Connected to POD at COM.
4
5
6
7
8
5 6
7
8
APPENDIX B.3 – MANUAL

Click Reset Target.
Click Erase, to clear the FLASH memory.Answer Yes in the popup window.
Click Unsecure to clear the security bits.Answer Yes in the popup window.
Click Program to program the Development Board HCS12.
Select the ProjectName_final.s19 file to be loaded from the \ProjectName\final folder
Click Open.
9
10
11
12
13
14
10 11
12
9
In the Load File to FLASH dialog box:
APPENDIX B.3 – MANUAL

Make sure BDM displays FLASH programmed and verified.
The HCS12 development board is now programmed.
Click Disconnect to disconnect the Debug Adapter.
15
16
17
13 14
15
Back in BDM:
APPENDIX B.3 – MANUAL

Volvo Car CorporationDept. 94250, Power Supply Systems
SE-405 31 Göteborg, Sweden
APPENDIX B.3 – MANUAL