pre-sink shaft safety analysis using wireline geophysics shaft safety analysis using wireline...
TRANSCRIPT

IntroductionDuring the preliminary design phases andfeasibility study of a proposed vertical shaft,very little detailed information is available onthe rock mass characteristics, in-situ stress,rock strengths, and hydrological characteristicsfor the evaluation of the project. A pre-sinkdiamond drill-hole is normally drilled on theproposed site and is steered with the use ofgyro surveys and wedges to remain within thebarrel of the shaft. i.e. not to deviate morethan 5 m in any direction from the centralposition.
Geotechnical logging of the core can nowtake place and parameters such as rockstrengths, fracture orientations and dip, in-situmagnitude and orientation of the principalhorizontal stress field, and positions of waterinflow can be determined with the use ofwireline geophysics.
Rock mass classification schemes havebeen developing for over 130 years since Ritter(1879) attempted to formalize an empiricalapproach to tunnel design and supportrequirements. Numerous multi-parameterclassification systems (Wickham et al., 1972;Bieniawski, 1973, 1976, 1989; Laubsher,1977; Barton et al., 1974, 1976, 2002;McCracken and Stacey, 1989) have beendeveloped since then. Although most of thesystems were developed for the design and
support of horizontal tunnels and excavations,McCracken and Stacey (1989) adaptedBarton’s Q-factor to the stability of raise-boring. Peck and Lee (2008) have alsoadapted the Bieniawski (1989) and McCrackenand Stacey systems to assess the stability ofraise-bored shafts.
The choice of the rock mass classificationsystem used is very often client-dependent.However the ‘stick plot’ technique used hereemploys modified versions of Barton, as wellas McCracken and Stacey, which have beenenhanced with the use of wireline techniquesand adjusted to various raise-bore diameters.
The purpose of the stick plot is to combineall geotechnical parameters applicable to thestability of a proposed shaft into an easilyreadable colour-coded format where cross-correlations can readily be made on a day-to-day basis during the shaft-sinking process. Adetailed spreadsheet of all parameters is alsoprovided for the use of the rock engineers.
The purpose of this paper is to introducethe stick plot method to the mining and shaft-sinking community as a viable alternative tothe usually more esoteric methods of reporting,thus making the information readily accessibleto all involved.
The deviated stick plotThe basis of the stick plot technique (Figure 1)is the use of Barton’s geotechnical parametersthat have been adapted to a vertical tunnelusing data derived from geophysical wirelinelogging. Each individual structure (jointing,fractures, bedding, breakout etc.) is identifiedin the core, and geologically and geotechnicallydescribed with exact depth, inclination, andazimuth. This geophysical data is used to
Pre-sink shaft safety analysis usingwireline geophysicsby N. Andersen*
SynopsisDuring the preliminary design phases and feasibility study of a proposedvertical shaft, a vertical diamond drill-hole is normally drilled on the site.This paper outlines how rock mass characteristics, in-situ rock stress, rockstrength, hydrological characteristics, and structural parameters can bedetermined using wireline logging of this borehole. In addition, a rockmass classification scheme is developed, based on published work, and inparticular the Q-factor is adapted to assess the stability of raise-boredshafts. The ‘stick plot’ is introduced, which combines all geotechnicalparameters applicable to the stability of a vertical shaft into a colour-coded format where cross-correlations can readily be made on a day-to-day basis during the shaft-sinking process.
Keywordsshaft-sinking, raise-boring, geophysical logging, geotechnical, Q-factor,stability.
* GeoScientific and Exploration Services, Irene.© The Southern African Institute of Mining and
Metallurgy, 2015. ISSN 2225-6253. Paper receivedMay 2013 and revised paper received Jan. 2015
435The Journal of The Southern African Institute of Mining and Metallurgy VOLUME 115 MAY 2015 ▲
Pre-sink shaft safety analysis using wireline geophysics
modify Barton’s, parameters such as joint set number ‘Jn’,joint water reduction factor ‘Jw’, and stress reduction factor‘SRF’ for conditions in a vertical tunnel.
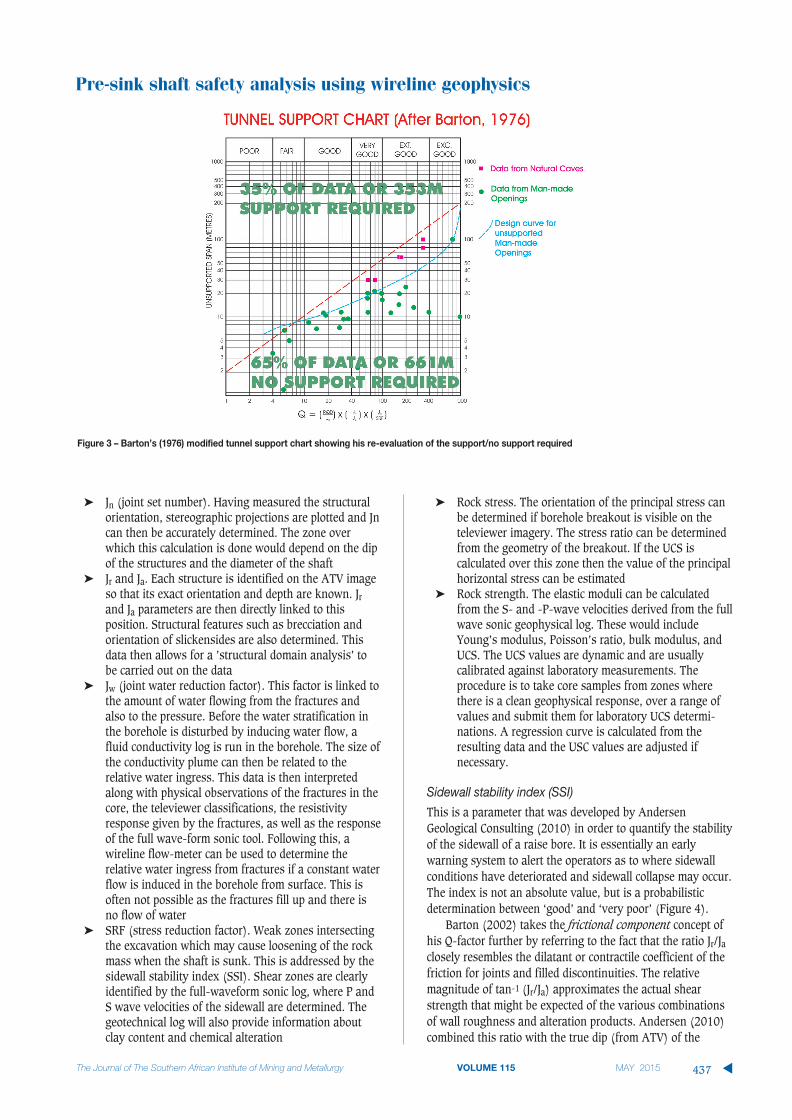
Both Bieniawski’s and McCracken and Stacey’sparameters are also adjusted using the more precisefracture/joint spacings and orientations derived from thegeophysical data. The stick plot poster itself shows only themodified Barton (2002) data with an additional ‘sidewallstability index’. Barton’s (1974, 1976) Q-factor values forsupport/no support are plotted on the modified Barton barchart to determine what length of the shaft would requiresupport (Figures 2 and 3). A detailed spreadsheet is alsosupplied for the use of the rock engineers, showing allcalculated parameters.
The parameters shown on the poster are for the day–to-day use of the shaft-sinkers, and include the following:
➤ Colour-coded modified Barton Q-factor normalized toshaft diameter
➤ Colour-coded sidewall stability index developed byAndersen Geological Consulting
➤ Stick plots showing dips of all structures subdivided intosets with the borehole deviation. There can be two or threesets, depending on the dominant structural sets
➤ Stereograms showing the orientation of the structural setsover 100 m intervals down the shaft. These diagramsshow the orientation of sidewall bolting to achieveoptimum anchoring
➤ Calculated UCS plotted in a barchart against the lithologicallog of the borehole
➤ Barton’s (1974, 1976) tunnel support charts showing thesupport/no support required using different Q-factor values(Figures 2 and 3).
Details of modified parameters➤ RQD. Having accurately determined the positions of all the
structures from the acoustic televiewer (ATV), geotechnicalunits are determined (where all structural spacings aresimilar) and the RQD is determined over these units, ratherthan at fixed intervals. The reason for this is that the RQDzone forms the basis of all of the derived parameters
▲
436 MAY 2015 VOLUME 115 The Journal of The Southern African Institute of Mining and Metallurgy
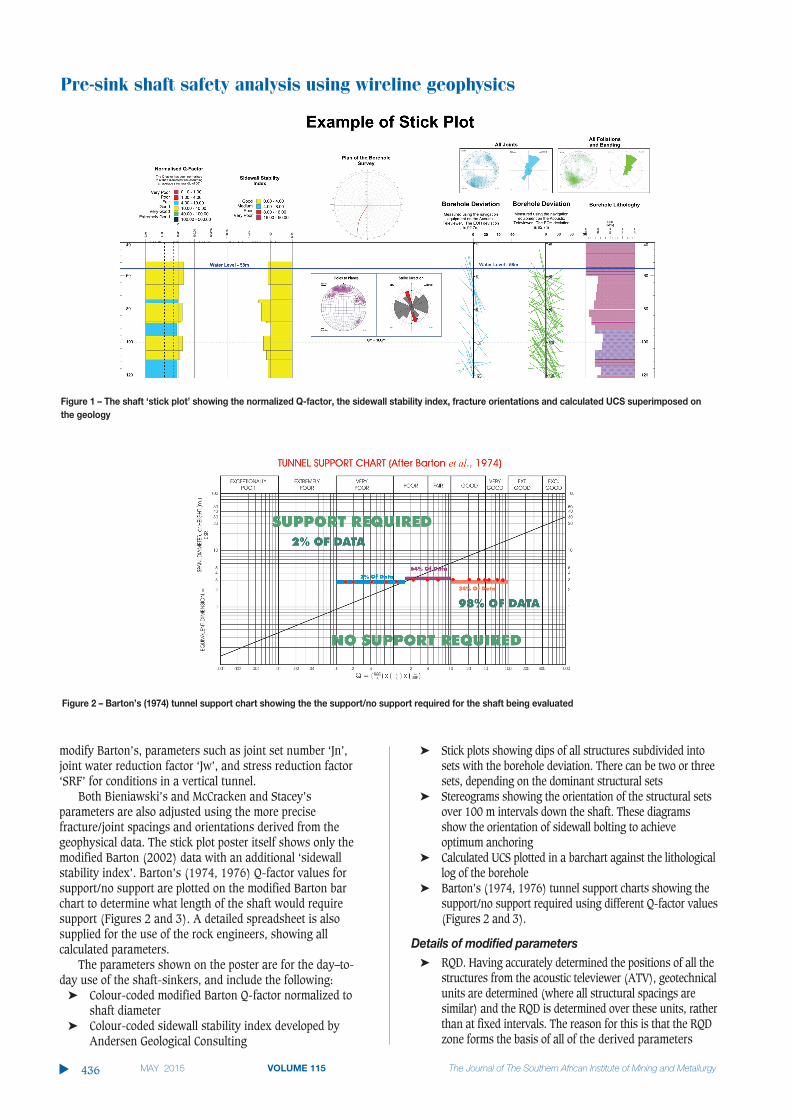
Figure 1 – The shaft ‘stick plot’ showing the normalized Q-factor, the sidewall stability index, fracture orientations and calculated UCS superimposed onthe geology
Figure 2 – Barton’s (1974) tunnel support chart showing the the support/no support required for the shaft being evaluated
➤ Jn (joint set number). Having measured the structuralorientation, stereographic projections are plotted and Jncan then be accurately determined. The zone overwhich this calculation is done would depend on the dipof the structures and the diameter of the shaft
➤ Jr and Ja. Each structure is identified on the ATV imageso that its exact orientation and depth are known. Jrand Ja parameters are then directly linked to thisposition. Structural features such as brecciation andorientation of slickensides are also determined. Thisdata then allows for a ’structural domain analysis’ tobe carried out on the data
➤ Jw (joint water reduction factor). This factor is linked tothe amount of water flowing from the fractures andalso to the pressure. Before the water stratification inthe borehole is disturbed by inducing water flow, afluid conductivity log is run in the borehole. The size ofthe conductivity plume can then be related to therelative water ingress. This data is then interpretedalong with physical observations of the fractures in thecore, the televiewer classifications, the resistivityresponse given by the fractures, as well as the responseof the full wave-form sonic tool. Following this, awireline flow-meter can be used to determine therelative water ingress from fractures if a constant waterflow is induced in the borehole from surface. This isoften not possible as the fractures fill up and there isno flow of water
➤ SRF (stress reduction factor). Weak zones intersectingthe excavation which may cause loosening of the rockmass when the shaft is sunk. This is addressed by thesidewall stability index (SSI). Shear zones are clearlyidentified by the full-waveform sonic log, where P andS wave velocities of the sidewall are determined. Thegeotechnical log will also provide information aboutclay content and chemical alteration
➤ Rock stress. The orientation of the principal stress canbe determined if borehole breakout is visible on theteleviewer imagery. The stress ratio can be determinedfrom the geometry of the breakout. If the UCS iscalculated over this zone then the value of the principalhorizontal stress can be estimated
➤ Rock strength. The elastic moduli can be calculatedfrom the S- and -P-wave velocities derived from the fullwave sonic geophysical log. These would includeYoung’s modulus, Poisson’s ratio, bulk modulus, andUCS. The UCS values are dynamic and are usuallycalibrated against laboratory measurements. Theprocedure is to take core samples from zones wherethere is a clean geophysical response, over a range ofvalues and submit them for laboratory UCS determi-nations. A regression curve is calculated from theresulting data and the USC values are adjusted ifnecessary.
Sidewall stability index (SSI)
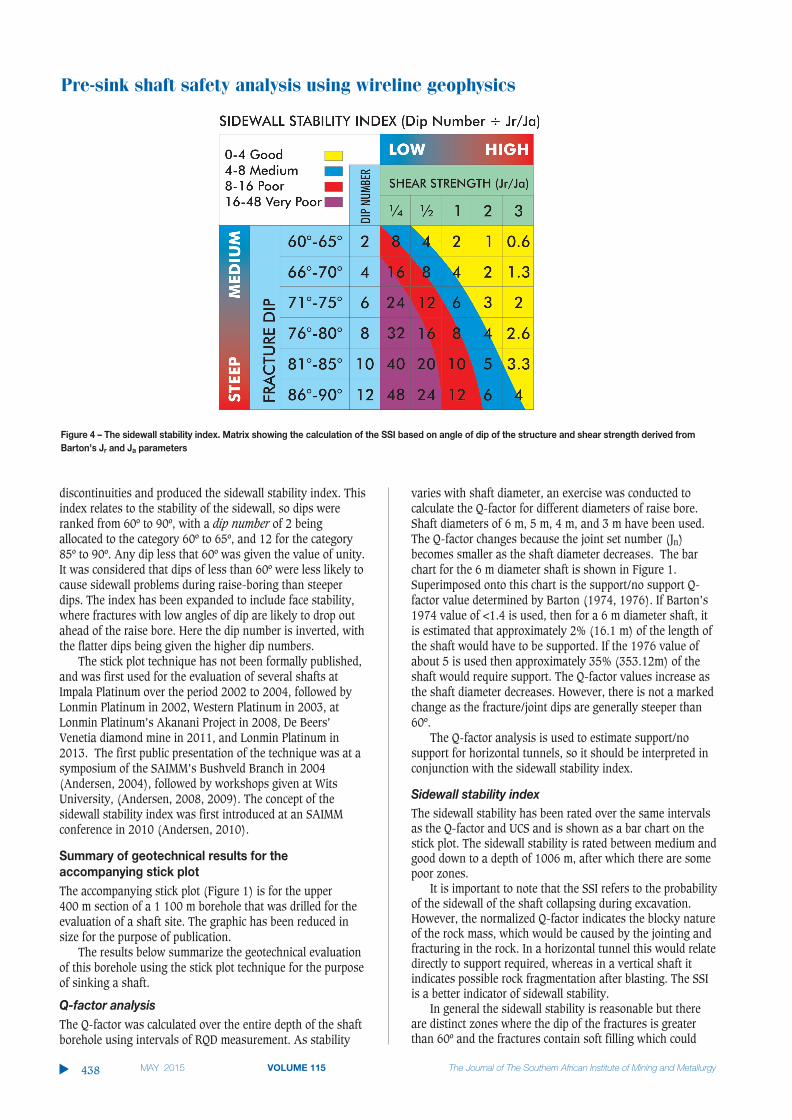
This is a parameter that was developed by AndersenGeological Consulting (2010) in order to quantify the stabilityof the sidewall of a raise bore. It is essentially an earlywarning system to alert the operators as to where sidewallconditions have deteriorated and sidewall collapse may occur.The index is not an absolute value, but is a probabilisticdetermination between ‘good’ and ‘very poor’ (Figure 4).
Barton (2002) takes the frictional component concept ofhis Q-factor further by referring to the fact that the ratio Jr/Jaclosely resembles the dilatant or contractile coefficient of thefriction for joints and filled discontinuities. The relativemagnitude of tan-1 (Jr/Ja) approximates the actual shearstrength that might be expected of the various combinationsof wall roughness and alteration products. Andersen (2010)combined this ratio with the true dip (from ATV) of the
Pre-sink shaft safety analysis using wireline geophysics
437The Journal of The Southern African Institute of Mining and Metallurgy VOLUME 115 MAY 2015 ▲
Figure 3 – Barton’s (1976) modified tunnel support chart showing his re-evaluation of the support/no support required
Pre-sink shaft safety analysis using wireline geophysics
discontinuities and produced the sidewall stability index. Thisindex relates to the stability of the sidewall, so dips wereranked from 60º to 90º, with a dip number of 2 beingallocated to the category 60º to 65º, and 12 for the category85º to 90º. Any dip less that 60º was given the value of unity.It was considered that dips of less than 60º were less likely tocause sidewall problems during raise-boring than steeperdips. The index has been expanded to include face stability,where fractures with low angles of dip are likely to drop outahead of the raise bore. Here the dip number is inverted, withthe flatter dips being given the higher dip numbers.
The stick plot technique has not been formally published,and was first used for the evaluation of several shafts atImpala Platinum over the period 2002 to 2004, followed byLonmin Platinum in 2002, Western Platinum in 2003, atLonmin Platinum’s Akanani Project in 2008, De Beers’Venetia diamond mine in 2011, and Lonmin Platinum in2013. The first public presentation of the technique was at asymposium of the SAIMM’s Bushveld Branch in 2004(Andersen, 2004), followed by workshops given at WitsUniversity, (Andersen, 2008, 2009). The concept of thesidewall stability index was first introduced at an SAIMMconference in 2010 (Andersen, 2010).
Summary of geotechnical results for theaccompanying stick plotThe accompanying stick plot (Figure 1) is for the upper 400 m section of a 1 100 m borehole that was drilled for theevaluation of a shaft site. The graphic has been reduced insize for the purpose of publication.
The results below summarize the geotechnical evaluationof this borehole using the stick plot technique for the purposeof sinking a shaft.
Q-factor analysisThe Q-factor was calculated over the entire depth of the shaftborehole using intervals of RQD measurement. As stability
varies with shaft diameter, an exercise was conducted tocalculate the Q-factor for different diameters of raise bore.Shaft diameters of 6 m, 5 m, 4 m, and 3 m have been used.The Q-factor changes because the joint set number (Jn)becomes smaller as the shaft diameter decreases. The barchart for the 6 m diameter shaft is shown in Figure 1.Superimposed onto this chart is the support/no support Q-factor value determined by Barton (1974, 1976). If Barton’s1974 value of <1.4 is used, then for a 6 m diameter shaft, itis estimated that approximately 2% (16.1 m) of the length ofthe shaft would have to be supported. If the 1976 value ofabout 5 is used then approximately 35% (353.12m) of theshaft would require support. The Q-factor values increase asthe shaft diameter decreases. However, there is not a markedchange as the fracture/joint dips are generally steeper than60º.
The Q-factor analysis is used to estimate support/nosupport for horizontal tunnels, so it should be interpreted inconjunction with the sidewall stability index.
Sidewall stability indexThe sidewall stability has been rated over the same intervalsas the Q-factor and UCS and is shown as a bar chart on thestick plot. The sidewall stability is rated between medium andgood down to a depth of 1006 m, after which there are somepoor zones.
It is important to note that the SSI refers to the probabilityof the sidewall of the shaft collapsing during excavation.However, the normalized Q-factor indicates the blocky natureof the rock mass, which would be caused by the jointing andfracturing in the rock. In a horizontal tunnel this would relatedirectly to support required, whereas in a vertical shaft itindicates possible rock fragmentation after blasting. The SSIis a better indicator of sidewall stability.
In general the sidewall stability is reasonable but thereare distinct zones where the dip of the fractures is greaterthan 60º and the fractures contain soft filling which could
▲
438 MAY 2015 VOLUME 115 The Journal of The Southern African Institute of Mining and Metallurgy
Figure 4 – The sidewall stability index. Matrix showing the calculation of the SSI based on angle of dip of the structure and shear strength derived fromBarton’s Jr and Ja parameters

result in sidewall collapse. These zones are classified as pooron the SSI.
Below 860 m the jointing intensity increases and the Q-factor shows zones that are rated between fair and poor withsome intervening sections being good. There is one very poorzone where there is a possibility of water inflow.
Overall trend of the structuresThe banding and foliation are the most prominent structurespresent in the borehole. These have a mean strike direction ofnorthwest to southeast, and dip dominantly to the southwestwith a small component dipping to the northeast.
The jointing has been separately classified and is alsoseen to follow the dominant foliation direction, although thedips are steeper with an average of about 75º. A shallowerdipping joint set is also present with a northwest to southeaststrike and a dip to the southeast.
It was possible to classify dip, oblique, and strike slipfaults. The orientations of the strike and oblique slip faultsare sympathetic to the jointing. These faults dip at more than70º. The dip slip faults form a conjugate set strikingnorthwest-southeast and dipping at about 45º to both thenortheast and southwest.
Sidewall boltingA series of stereograms has been calculated over 100 mintervals down the length of the shaft. These show the meandip and strike of the structures over each section. Thepurpose of these is to indicate the optimum direction forrockbolting, which is indicated by an arrow.
Groundwater intersectionsThe shaft will ‘make water’ from numerous joints fromdepths greater than 66 m, which is the current static waterlevel. These are shown in column 6 as blue intervals. Thedriller’s log did not indicate any water intersections.
Rock strength analysisThe rock strength values, including UCS, Young’s modulus,and Poisson’s ratio, were calculated using the P- and S-wavevelocities as determined from the full-waveform sonicmeasurements. The UCS values were overlaid onto thegeological log on the stick plot and the other values areavailable as text files.
ConclusionBarton’s Q-factor system (Barton et al., 1974) was initiallydeveloped to assess the design and support of horizontaltunnels and excavations. This system has been adapted foruse in a vertical shaft, with structural information beingderived from an acoustic televiewer (ATV) geophysicalwireline log and Barton’s geotechnical parameters describeddirectly from the borehole core at the depths indicated by theATV log. A colour-coded bar chart is then constructeddepicting Barton’s classification of rock mass quality betweenvery poor and extremely good, based on RQD domains.
As the stability of the sidewall is very important in shaftsinking, a sidewall stability index (SSI) is introduced. Thisindex is based on the dip of the structures (determined fromthe ATV) and the shear strength of the structure (Jr/Ja)determined from the geotechnical logging. Again, a colour-
coded bar chart is derived, ranking the sidewall stabilitybetween good and very poor.
Zones of possible water inflow into the shaft excavationare indicated based on wireline fluid conductivity, differentialtemperature, and impeller measurements.
Stereographic projections are constructed based ofstructural measurements made by the ATV. Dominant jointsets are identified that could cause structural failure if theirorientation is not taken into consideration when excavatingshaft stations or developing shaft bottom orepass raises.These joint sets are shown as graphical projections.
Rock strength parameters are calculated from the wirelinevelocity and density measurements. The orientation of theprincipal horizontal stress is determined from the orientationof borehole breakout observed on the ATV image.
McCracken and Stacey’s (1989) maximum unsupportedspan, based on the geotechnical parameters, is also calculatedbut is not shown on the stick plot.
The ‘stick plot’ is designed as an easy-to-read graphic forthe daily use of shaft sinkers to indicate rock conditions inadvance of the sinking. A detailed report discussing the rockengineering parameters is also provided for the rockengineers.
ReferencesANDERSEN, N.J.B. 2004. Structural and rock strength analysis of pre-sink shaft
boreholes using wireline geophysics. Symposium on the Bushveld IgneousComplex, Rustenburg. Bushveld Branch of the Geological Society of SouthAfrica.
ANDERSEN, N.J.B. 2008, 2009. Lectures to postgraduate mining engineeringstudents, University of the Witwatersrand.
ANDERSON, N.J.B. 2010. Pre-sink shaft safety analysis using wirelinegeophysics. South African National Committee on Tunnelling. SouthernAfrican Institute of Mining and Metallurgy, Johannesburg.
BARTON, N., LIEN, R., and LUNDE, J. 1974. Engineering classification of rockmasses for the design of tunnel support. Rock Mechanics, vol. 6. pp.189–236.
BARTON, N. 1976. Recent experiences with the Q-system of tunnel supportdesign. Proceedings of the Symposium on Exploration for Rock Engineers,Johannesburg, November 1976.
BARTON, N. 2002. Some new Q-value correlations to assist in site characteristicsand tunnel design. International Journal of Rock Mechanics and MiningSciences, vol. 39. pp. 185–216.
BIENIAWSKI, Z.T. 1973. Engineering classification of jointed rock masses.Transactions of the South African Institute of Civil Engineers, vol. 15. pp.335–344.
BIENIAWSKI, Z.T. 1976. Rock mass classification in rock engineering.Exploration for Rock Engineering. Bieniawski, Z.T. (ed.). Balkema, CapeTown. pp. 97–106.
BIENIAWSKI, Z.T. 1989. Engineering Rock Mass Classification. Wiley, New York.
LAUBSCHER, D.H. 1977. Geomechanics classification of jointed rock masses –mining applications. Transactions of the Institution of Mining andMetallurgy Section A: Mining Industry, vol. 93. pp. A70–A82.
MCCRACKEN, A. and STACEY, T.R. 1989. Geotechnical risk assessment for large-diameter raise-bored shafts. Transactions of the Institution of Mining andMetallurgy Section A: Mining Industry, vol. 98. pp. 309–316.
PECK, W.A. and LEE, M.F. 2008. Raise bored shafts in Australian Mines. 13thAustralian Tunnelling Conference, Melbourne, Vic., 4– May 2008.
RITTER, W., 1879. Die Statik der Tunnelgewölbe. Springer, Berlin.
WICKHAM, G.E., TIEDEMANN, H.R., and SKINNER, E.H. 1972. Support determinationsbased on geologic predictions. Proceedings of the North American RapidExcavation Tunneling Conference, Chicago. Lane, K.S. and Garfield, L.A.(eds). Society of Mining Engineers of AIME, Littleton, CO. pp. 43–64. ◆
Pre-sink shaft safety analysis using wireline geophysics
The Journal of The Southern African Institute of Mining and Metallurgy VOLUME 115 MAY 2015 439 ▲