pre-ipo market, underwritting procedure, and ipo performance annual... · introduction of pre-ipo...
TRANSCRIPT

1
Pre-IPO Market, Underwritting Procedure, and IPO Performance
Hsuan-Chi Chena, Sue-Jane Chiangb*, Pei-Gi Shub
a Anderson School of Management, University of New Mexico, Albuquerque, NM 87131, USA
b Department of Business Administration, Fu-Jen Catholic University, 242 HsinChuang, Taiwan
* Corresponding author
Draft: January 15, 2018
Abstract
Using a unique data of mandatory pre-IPO market trading in Taiwan, we examine
the joint effects of pre-IPO market trading and underwriting procedures on the
short-term and long-term IPO performance. The empirical results of 476 IPOs in the
sample period 2003-2012 suggest that for the fixed price public offers, on average,
the offer price is set close to the pre-IPO market price, which is subject to insider
manipulation and significantly higher than the middle point of the price range set by
the bookbuilding offers. The higher (lower) offer price is followed by lower (higher)
initial return and poorer (better) long-run performance. The self-dealing hypothesis
relevant to issuers, investors, and underwriters can help explain the empirical
findings.
Keywords: Pre-IPO market, Bookbuilding, Fixed price offer

2
1. Introduction
The high average initial return or IPO underpricing, the percentage change from
the offer price to the first-day closing price, has been widely documented in the IPO
literature. Intuitively, the IPO underpricing anomaly could be attributed to the
underestimation of the offer price, the overestimation of the initial closing price in the
aftermarket, or both. Several theories have been proposed to shed light on relatively
low offer prices, including winner’s curse (Rock,1986), signaling theory (Allen and
Faulhaber, 1989), information asymmetry (Ritter, 1984; Ritter and Welch, 2002), and
agency problems (e.g., Ljungqvist, 2007; Ritter, 2011).1 In general, agency problems
of underwriters or the conflict of interests are important in explaining IPO
underpricing (e.g., Chang et al., 2016). As for the overestimation of the initial closing
prices in the IPO aftermarket, investor overvaluation, overoptimistm, or overreaction
may be the main factors. If the high initial returns are primarily attributed to the
relatively low offer prices, the fair initial closing prices in the aftermarket are less
likely to lead to poor post-IPO long-run performance. In contrast, if the high initial
returns are mainly attributed to the overestimation of initial closing prices, the higher
initial returns would be associated with long-run underperformance due to market
correction.
No matter which scenario would prevail, undervaluation of offer price or
overvaluation of the initial closing price, the crucial nexus that results in the
abnormal initial return relies on the malfunction of price discovery associated with
the IPO market. How to enhance price discovery for IPO shares has been explored
by academics and practitioners. The common practices of obtaining pricing-relevant
information directly from potential investors so as to enhance price discovery
include bookbuilding (e.g., Benveniste and Spindt, 1989; Spatt and Srivastava, 1991;
Sherman, 2005), auction (e.g., Biais and Faugeron-Crouzet, 2002; Derrien and
Womack, 2003), and pre-IPO trading (e.g., Derrien and Kecskes, 2007; Chang et al.,
2016).2 However, it is not clear which one would prevail when they are juxtaposed,
and whether they are substitutes or complementary in terms of price discovery.
Benveniste and Spindt (1989) and Spatt and Srivastava (1991) argue that
through the discretion in share allocation underwriters can collect true market
1 Still, there are other plausible explanations, including the ease of marketing and institutional
investors obtaining kickback from share placement and trading commission (See Loughran and Ritter,
2002). 2 The use of IPO auction is not popular around the world. For our investigated case of Taiwan, there
were 53 IPOs adopting auction prior to the introduction of compulsory pre-IPO market trading. There
were only two IPO auctions after the introduction of compulsory pre-IPO market trading during our
sample period. We do not include these two IPO firms in our sample.

- 3 -
information from sophisticated investors to set offer prices that are close to the
market prices and then reduce IPO underpricing. Sherman (2005) indicates that
bookbuilding allows underwriters to manage investor access to IPO shares,
facilitating them to reduce risk for both issuers and investors and to control spending
on information acquisition, thereby limiting either IPO underpricing or aftermarket
volatility. From the perspective of reducing information asymmetry, bookbuilding
should be preferred to fixed price offers. However, self-interested underwriters are
strongly motivated to price the offering downwards so that they can allocate
underpriced shares to their favored clients in exchange for side payments
(Ljungqvist, 2007; Loughran and Ritter, 2002; Reuter, 2006; Ritter, 2011;
Nimalendran, Ritter and Zhang, 2007; Liu and Ritter, 2010 and 2011; Goldstein,
Irvine and Puckett 2011). If this is the case, traditional bookbuilding IPOs tend to
exhibit lower offer prices and therefore higher initial returns than those associated
with other offering methods.
In addition to underwriting procedures, the existence of pre-IPO market is
supposed to facilitate price discovery for IPO shares. However, the empirical
findings are mixed. Derrien and Kecskes (2007) posit that the pre-IPO market that
provides a two-stage offering may help reduce the valuation uncertainty for IPO
firms and lead to relatively low initial returns. In contrast, Cornelli, Goldreich, and
Ljungqvist (2006) and Dorn (2009) indicate that individual investors who are likely
to be noise traders tend to trade in the pre-IPO market. The prices of IPO shares are
affected by investor sentiment that results in long-run underperformance and volatile
short-run initial returns.
If pre-IPO market trading is helpful to facilitate price discovery, the initial
returns would be significantly reduced following its introduction, and the reduction
in initial returns should be equally applicable to both fixed price offers and
bookbuilding offers. By contrast, if underwriting methods rather than the
introduction of pre-IPO market matter, then only a certain kind of underwriting
procedure has an effect on the reduction of underpricing.
Because the bookbuilding and fixed price offers are both available for
underwriting IPO shares and pre-IPO market trading is mandatory for firms seeking
IPOs in Taiwan for some periods of time, as a natural experiment, we use the IPO
sample of Taiwan for the period 2003-2012 to examine whether pre-IPO market
trading or underwriting procedures would prevail in affecting initial returns. The
empirical results for 476 IPOs show that the average initial return of IPO firms with
bookbuilding is significantly higher than that of firms adopting fixed price offers.
We further examine the long-run wealth relatives for both groups of firms and find
- 4 -
that firms adopting bookbuilding offers exhibit stronger long-run performance than
firms adopting fixed price offers. The results are consistent with the idea that the
high initial returns of bookbuilt IPOs are primarily attributed to the relatively low
offer prices rather than the overestimation of initial closing prices.
We find that in some cases the pre-IPO market prices are even higher than the
initial aftermarket prices.3 This observation motivates us to propose the self-dealing
hypothesis to explain the difference in offer prices and therefore initial returns
between fixed price offers and bookbuilding offers in the context of mandatory
pre-IPO market trading. In fixed-price offers self-dealing insiders would boost the
pre-IPO prices to benefit their wealth given that the thin-trading pre-IPO market
may faciliatet them to manipulate the pre-IPO market prices. The offer prices set
with reference to the pre-IPO market prices tend to be acceptable to uninformed
individual investors who are the major subscribers to IPO shares in fixed price offers.
By contrast, in bookbuilding offers, there are at least two motives for underwriters to
set relatively low offer prices compared to the aftermarket prices. On the one hand,
underwriters underprice IPO shares to induce truthful information revelation from
institutional investors. On the other hand, self-interested underwriters have strong
incentives to set the offer prices downwards so that they can allocate underpriced
shares to their favored clients in exchange for side payments (Loughran and Ritter,
2002; Reuter, 2006; Nimalendran, Ritter and Zhang, 2007; Liu and Ritter, 2010 and
2011; Goldstein, Irvine and Puckett 2011). Because the underwriters of
bookbuilding offers in Taiwan have larger bargaining power in setting the offer
prices, they tend to set offer prices close to the middle of prelimnary offer price
range. Moreover, institutional investors participating in the bookbuilding offers are
rational and less gullible by the pre-IPO market prices that are subject to insider
manipulation. Our empirical results support the self-dealing hypothesis by showing
that the offer prices of fixed-price offers set with reference to the pre-IPO market
prices are significantly higher than the offer prices of bookbuilding offers set close
to the middle of preliminary offer price range.
In addition, the theory of information cascade suggests that investors who
observe the investment choice made by previous investors can update their beliefs
about the value of IPO shares (Welch, 1992). The theory implies that individual
investors may update their beliefs based on pre-IPO market prices so that pre-IPO
market prices are positively related to aftermarket prices. If offer prices are adjusted
3 Prior studies also find that the pre-IPO market prices are higher than initial aftermarket prices (for
example, see Derrien and Kecskes (2007), Cornelli, Goldreich, and Ljungqvist (2006), Aussenegg,
Pichler, and Stomper (2006), and Dorn (2009).

- 5 -
upwards under the circumstance of artificially boosting pre-marker prices, the
short-run initial returns may be lower. However, stock performance may be poor if the
initial overvaluation is corrected in the long run. In contrast, if institutional investors
and underwriters of bookbuilding offers do not rely on pre-IPO market prices very
much and set the offer prices based on their own information and evaluation,
information cascade arising from pre-IPO market trades leads to short-run
overreaction at most in the aftermarket. Since the offer prices of bookbuilding offers
only partly reflect the level of pre-IPO market prices, the short-run initial returns
would be higher than those of fixed-price offers. Therefore, the long-run stock
performance of bookbuilding offers is expected to be better than that of fixed price
offers if the initial overreaction is corrected in the long run. In sum, our arguments
predict that the relatively lower (higher) offer prices are associated with higher (lower)
initial return and better (worse) long-run performance.
Both the introduction of pre-IPO market trading in 2003 and the introduction
of bookbuilding procedure in 2004 aim at enhancing price discovery for IPO firms.4
The natural setting of the Taiwan stock market with a sequential adoption of the
mandatory pre-IPO market trading and then bookbuilding offer allows us to
investigate which mechanism is effective in addressing IPO anomalies. Moreover,
when long-run performance is of interest, which one would prevail in mitigating the
alleged long-run underperformance of IPO firms? Our finding suggests that
underwriting procedure rather than pre-IPO market trading matters for both price
discovery and long-run post-IPO performance. According to the self-dealing
hypothesis, the higher the initial return is, the stronger the long-run performance.
Our findings have several policy implications. First, no matter what
underlying theories applied to explain abnormal initial returns, the most critical
point is the biased setting of offer price.5 How to reduce the information asymmetry
or agency problem between issuing firms and outsider investors and enhance price
discovery remains the most crucial issue for regulatory entities. Our findings from
the natural experiment of the IPO market in Taiwan suggest that bookbuilding rather
4 The Emerging Stock Market was initially instituted in 2002. IPO firms had the option of choosing
pre-IPO market trading at that time. Since January 1, 2003, all IPO firms had been required to have at
least 3-month pre-IPO market trading before the application of IPO. In January 2005, the duration of
mandatory pre-IPO trading was revised to 6 months. Furthermore, though bookbuilding offer was
initially allowed in 1995, it did not gain popularity because it is restricted to newly issued shares only.
At that time, old shares owned by pre-IPO shareholders are put for public subscription. Bookbuilding
offer has not been widely adopted by IPO firms until 2004 when the regulation stipulated that only
newly issued shares are eligible for public subscription. 5 Previous studies illustrate numerous possible explanations including information asymmetry (e.g.,
Ritter, 1984; Ritter and Welch, 2002), winner’s curse (e.g., Rock, 1986), signaling, timing (e.g.,
Allen and Faulhaber, 1989), overvaluation, over-optimistic, or over-reaction.

- 6 -
than pre-IPO market matters in ameliorating biased offer price and therefore
enhancing price discovery. Second, our sample allows us to compare bookbuilding
offers with fixed-price public offers given the mandatory pre-IPO market trading.
Bookbuilding is believed to be an ideal underwriting procedure in terms of price
discovery (Benveniste and Spindt, 1989; Sherman, 2000). Sherman (2005) also
illustrates the popularity of bookbuilding. It happens to the Taiwan IPO market that
bookbuilding had soon become the main stream in 2005 since its initial induction in
2004.6 In general, as compared to fixed-price public offer, bookbuilding is a better
underwriting procedure through which underwriters could collect information from
informed investors before setting the offer price.7 Our finding indicates that even
with the existence of pre-IPO market, the issues such as information asymmetry,
winner’s curse, and signaling that confronts the underwriters of fixed price offers
were not effectively tackled. Rather, the noise that exists in the pre-IPO market and
biases the setting of offer price for a fixed-price public offer remains salient in
affecting the aftermarket prices. For fixed-price public offers, setting offer prices
lower due to the concerns with information asymmetry, winner’s curse, and
signaling coupling with higher aftermarket prices arising from individual investors’
overoptimism or overreaction leads to higher initial returns (e.g. Benveniste and
Spindt, 1989; Spatt and Srivastava, 1991; Loughran, Ritter and Rydqvist, 1994). Our
finding renders little lenity to the proclaimed value of pre-IPO market trading.
Prior studies so far do not converge regarding the value of pre-IPO market
trading. Derrien and Kecskes (2007) indicate that the two-stage offering strategy
prevailing in the U.K. market is less costly than an IPO because trading reduces the
valuation uncertainty of these firms before they issue equity. They find that firms
with two-stage offering are associated with 10% to 30% lower in initial returns than
for comparable IPOs. By contrast, Goldreich and Ljungqvist (2006) and Dorn (2009)
indicate that retail buyers consistently overpay in the when-issued market relative to
the immediate aftermarket, and that was mainly due to investor sentiment. Sentiment
serves as a driver to affect when-issue prices and poor aftermarket returns. Cornelli,
Goldreich, and Ljungqvist (2006) use the midpoint of the filing price range as a
proxy of the fundamental value and the difference between fundamental value and
6 The underwriting system launched in 2004 indicates that bookbuilding IPOs need to have 50% of
issued shares put for open subscription. However, the underwriting system of having half
bookbuilding and half fixed-price offer indeed prolonged the overall underwriting schedule and
therefore was censured for inefficiency. In 2005 the underwriting system was reformed to be more
flexible that underwriters have the discretion of setting the proportion put for bookbuilding offer and
the proportion for fixed price offer which is subject to the ceiling of 20%. 7 Prior studies indicate that for tackling the problem of winner’s curse fixed-price offers need to have
higher price discount (e.g., Benveniste and Wilhelm, 1990, Spatt and Srivastava, 1991, Benveniste
and Busaba, 1997 and Biais and Faugeron-Crouzet, 2002)

- 7 -
grey market price as a proxy of investor sentiment. They find that in high sentiment
(indicating overoptimism) the grey market prices are a very good predictor of
first-day aftermarket prices, while they are not in low sentiment. Moreover, long-run
price reversal only exists in high sentiment. Our finding lends support to the limited
value of pre-IPO market trading that is unable to enhance price discovery. Rather,
the pre-IPO prices are subject to the adverse impact of individual investor sentiment
and/or manipulation.
In addition to the above studies, Chang et al. (2016) is probably the closest one
to ours. They examine 218 bookbuilding IPOs in Taiwan from the period 2005-2011
and find that the existence of the pre-IPO market facilitates price discovery in the
sense that the pre-IPO market price is predictive of the initial aftermarket price.
However, it remains a puzzling phenomenon that the average (median) initial return
of 55.3% (36.7%) seems to be inconsistent with the alleged benefit of pre-IPO
market. Nevertheless, they cite the argument put forth by Ritter (2011) that
information asymmetry comprises only a small portion of initial return. Rather, the
agency problem that is derived from underwriters’ rent-seeking behavior is the main
driver for a high average initial return. The major difference between our study and
Chang et al. (2016) is that we trace the sample back to 2003 and include both
bookbuilding and fixed-price public offers. The extension of sample period allows
us to make a comparison between the bookbuilding offers and fixed-price offers.
Therefore, we can test the self-dealing hypothesis by simultaneously including both
underwriting procedures and pre-IPO market.
The unique feature of our study is in sharp contrast with prior studies that use
bookbuilding IPOs only (e.g., Cornelli, Goldreich, and Ljungqvist, 2006; Aussenegg,
Pichler, and Stomper, 2006; Dorn, 2009). Our study potentially makes the following
incremental contributions to the IPO literature. First, we find that underwriting
procedures but not pre-IPO market trading prevails in affecting initial returns and
long-run performance. Second, we propose the self-dealing hypothesis that helps
explain the difference in setting offer prices between fixed-price public offers and
bookbuilding offers. Third, even though our finding of the positive relation between
pre-IPO market prices and aftermarket prices is consistent with the theory of
information cascade (e.g. Derrien and Kecskes, 2007; Goldreich and Ljungqvist, 2006;
Dorn, 2009; Chang et al., 2016), we are not as optimistic as prior studies that support
the efficient pre-IPO market trading. For example, Derrien and Kecskes (2007),
Goldreich and Ljungqvist (2006) and Dorn (2009) indicate that pre-IPO market prices
are a very good predictor of first-day aftermarket price. Chang et al. (2016) argue that
pre-IPO market prices are very informative about post-market prices. We find that
pre-IPO market trading is subject to insider manipulation and noisy trading (e.g.

- 8 -
Cornelli, Goldreich, and Ljungqvist, 2006; Dorn, 2009) and the positive relation
between pre-IPO market prices and aftermarket prices may be attributed to
information cascade. Finally, we connect the underwriting mechanism, initial return,
and long-run performance and find that underwriting mechanism is a major
determinant if offer prices fully (partially) reflect the levels of pre-IPO market prices,
then the initial return is relatively low (high) and long-run performance is relatively
weak (strong). Specifically, for fixed-price public offers, pre-IPO market trading
facilitates to keep both the offer price and aftermarket price relatively high, followed
by relatively lower average initial return of 8.95% and worse long-run stock
performance. In contrast, for bookbuilding offers, the offer prices are set relatively
low, which is then followed by relatively higher average initial return of 44.92% and
better long-run stock performance.
The rest of this paper proceeds as follows. Section 2 describes Taiwan’s IPO
Market. Section 3 reviews the relevant literature and develop hypotheses
accordingly. Section 4 discusses the data, variables, and empirical models. Section 5
presents the empirical results. Section 6 concludes the study.
2. IPO Market in Taiwan
As compared to IPO markets in other countries, the IPO market in Taiwan is
associated with two special attributes. First, since 2003 all IPO firms in Taiwan have
been required to have at least three-month pre-IPO market trading before listing.
Unlike other IPO markets where pre-IPO market trading is optional, the mandatory
pre-IPO market trading in Taiwan is exceptional and provides a clean IPO sample
without selection bias to examine the effectiveness of pre-IPO market trading.
Second, there are alternative underwriting procedures including bookbuilding,
fixed-price public offers, and auction to be freely chosen by issuing firms. This
feature allows us to compare the effectiveness between underwriting procedures.
2.1 Pre-IPO market
The main purpose of the pre-IPO market in Taiwan (the Emerging Stock Market,
ESM) instituted in 2002 was to enhance information transparency and visibility for
both firms preparing for getting listed following their IPOs and firms delisted from
major secondary markets. At that time, firms preparing for their IPOs had the option
to decide whether their shares are traded in the pre-IPO market before getting listed
formally. Starting January 1, 2003, all IPO firms were required to have at least
3-month pre-IPO market trading before getting listed. Since 2005, it was mandatory
for at least 6-month pre-IPO market trading before get listed on either the Taiwan

- 9 -
Stock Exchange (TWSE) or Gre-Tai Securities Market (GTSM), the two major
stock markets in Taiwan.
Compared to firms listed on TWSE and GTSM, firms that trade in the pre-IPO
market are subject to less rigorous requirements: they need to disclose financials
(audited annual/semi-annual financial statement) and important corporate events.
Moreover, they need to have written recommendations by two or more securities
firms, with one of which being the lead underwriter in the latter IPOs.
The trading in ESM is facilitated by market makers who come from the
recommending securities firms and offer bid and ask quotes during normal trading
hours through the Emerging Stock Computerized Price Negotiation and Click
System (the Click System). This is different from the order-driven system applied in
TWSE and GTSM markets. The ESM is a dealer market in which the recommending
securities firms act as market makers to assume the responsibility for continuous
trading. They quote bid and ask prices through the click system with the bid-ask
spread not exceeding 7% of the ask price. The market makers have the obligation to
trade at the quoted price when the order is smaller than 2,000 shares. For large order
that exceeds 10,000 shares, the trade is conducted through direct negotiation by
letter, telephone, or face-to-face talk. This is in sharp contrast with TWSE and
GTSM markets where all trades are through fully automated electronic trading
systems and only limit orders are accepted. Moreover, unlike the price limit applied
in TWSE and GTSM, there is no price limit in the ESM.8
Though both individual and institutional investors can trade on the ESM,
institutional investors are less likely to invest in ESM stocks because of high risks
associated with these stocks.9 Therefore, ESM trading is mainly comprised of retail
investors who tend to be noise traders. Moreover, insiders such as directors,
supervisors, and shareholders with more than 10% ownership are restricted from
selling after the firm has applied for an IPO. To sum up, several attributes associated
with the ESM in Taiwan including the quote system, no price limit, the main
composition of individual investors, and high liquidity risk give rise to price
manipulation in the ESM.10
The ESM in Taiwan is similar to U.K.’s Alternative Investment Market (AIM) in
which firms preparing for listing have the option to trade before getting listed.
8 Since June 1, 2015, the price limit has been 10% instead of 7% that had been applied in TSWE and
GESM for a long period of time. 9 Since 2011 mutual funds have been allowed to invest in the ESM. 10 The prices are easily manipulated because of low daily trading volume and no price limit.
Moreover, the high prices that are likely subject to insider manipulation are very attractive to
individual investors who tend to herd in trading stocks.

- 10 -
Nevertheless, there are several differences between the ESM in Taiwan and the AIM
in the U.K. First, pre-trading is mandatory for Taiwan’s IPO firms while optional for
U.K. IPO firms. Derrien and Kesckes (2007) find that there were only 11% of IPO
firms for the period 1995-2004 choosing the AIM for pre-market trading. Moreover,
there is no minimum duration for pre-IPO market trading for U.K. IPO firms. But
Taiwan’s IPO firms are required to be traded in the ESM for at least 6 months before
getting listed. Another similar type of pre-IPO market is found in the when-issued
markets prevailing in the European countries. Again, these pre-IPO markets are not
mandatory for European IPO firms and most of them are not unified and vary widely
from country to country (Cornelli, Goldreich and Ljungqvist, 2006). The pre-IPO
market trading in the European countries lasts only for a week or so before an IPO
firm gets listed.
In a nutshell, there are three distinctive features associated with Taiwan’s ESM
in our sampling period: (1) it is mandatory for firms seeking IPOs; (2) the duration
of pre-IPO trading is at least 3 (or 6) months; (3) the coexistence of pre-IPO market
trading and alternative underwriting procedures: bookbuilding and fixed-price public
offer. These distinctive features allow us to conduct a thorough investigation into the
impact of pre-IPO market on subsequent IPO stock performance. Specifically,
mandatory pre-IPO trading is free from the concern of selection bias. The long
duration of pre-IPO trading allows us to get a clear picture of how pre-IPO trading
affects subsequent prices in the offering and its aftermarket. The coexistence of
pre-IPO trading and alternative underwriting procedures gives us an opportunity to
examine whether pre-IPO market or underwriting procedures matter for the
enhancement of price discovery.
2.2 IPO underwriting methods
Fixed-price public offer was the only underwriting procedure in early days. To
enhance the marketability of newly issued shares, both the bookbuilding and auction
methods were inducted in 1995. Nevertheless, most bookbuilding IPOs in Taiwan
adopt hybrid bookbuilding in which half of the newly issued shared are reserved for
the tranche of fixed-price public offer.11 However, the bookbuilding method at its
first induction in Taiwan could be only applied to the issuance of primary shares. This
is in sharp contrast with the preference of issuing firms for using secondary shares in
IPOs. One reason for such a preference is that issuing primary shares in an IPO may
lead to greater regulatory scrutiny and a lengthy review process. To avoid
11 Since 2005 the underwriters of IPO firms adopting either auction or bookbuilding have had the
option of using pure auction/bookbuilding without reserving shares for the tranche of fixed-price
public offer.

- 11 -
administration procedures, issuing firms prefer selling secondary shares to investors.
For the period 1995-2003, IPO firms in Taiwan just used either pure fixed-price
public offer or hybrid auction (Chen and Wu, 2015). The use of secondary shares in
bookbuilding was allowed in 2004 so that hybrid bookbuilding was effectively
available for IPO firms since then. In 2005 the regulation was revised and stipulated
that only secondary shares are used in IPOs. From then on, bookbuilding became the
major underwriting procedure in Taiwan. In our sample period, there were pure fixed
price public offer, pure bookbuilding offer, and hybrid bookbuilding. Auction was
almost not used.
In fixed price public offers, individual investors are potential subscribers who
submit indication of buying shares up to three round lots (1,000 shares per round lot).
Institutional investors do not show any interest in participating in fixed price public
offers because of the constraint on order size. IPO lottery is used to determine share
allocation in the case of oversubscription. The offer price is negotiated and set by both
underwriters and IPO firms.
In bookbuilding offers, underwriters set a preliminary offer price range in the first
place. Investors are then invited to bid for the shares within the price range given. The
offer price is set based on the demand for and supply of the IPO shares. To avoid
ownership concentration, each investor is restricted from subscribing more than 3% of
the shares offered. Although individual investors are not excluded from bookbuilding
offers, the major participants are institutional investors.
Before 2005 the hybrid bookbuilding was performed by soliciting indication of
interests of investors at possible price levels first. The offer price was set after
bookbuilding; the same offer price was used in the tranche of fixed price public offer.
The investors in the tranche of public offer have the information of not only the
preliminary offer price range but the specific offer price when they subscribe to the
reserved shares. In 2005, to shorten the whole procedure, the hybrid bookbuilding was
carried out by synchronizing the bookbuilding and public offer tranches. That is, the
investors in the public offer tranche only know of the preliminary offer price range
but not the specific offer price.12 Figure 1 presents the detailed timeline. Moreover, to
prevent the possibility that underwriters purposely lower the offer price to benefit
bookbuilding investors, the rule in 2011 stipulated that both the lower bound of the
preliminary offer price range and the offer price could not be less than 70% of the
average of pre-IPO trading prices in the last ten days. For pure fixed price public
offers, there is no specific regulation for setting the offer price to be related to pre-IPO
12 In the fixed price public offer tranche, investors without any knowledge of the specific offer price
must deposit the dollar amount computed at the upper limit price in the preliminary offer price range.
- 12 -
trading prices.
3. Literature Review and Hypothesis Development
Pre-IPO or when-issued markets allow investors to trade for the shares of the
firms that are about to go public. However, whether a pre-IPO market facilitates price
discovery for IPO shares remains a puzzling issue. Unlike Taiwan where 3 (6)-month
pre-IPO market trading has been mandatory for firms seeking IPOs since 2003, the
U.K. gave firms an option to have their shares traded on the Alternative Stock Market
before getting listed (Derrien and Kecskés, 2007). Derrien and Kecskés (2007)
document that only 66 IPO firms chose to have an introduction on AIM before their
listing. These two-stage IPO firms have the average initial return of 11.9%, which is
significantly lower than 24.7% for the remaining 786 direct IPO firms. They argue
that the two-stage offering reduces valuation uncertainty and enhances price discovery
for the IPO firms, in turn, leads to a reduction of the initial returns.
In Europe, the pre-IPO markets are over-the-counter and vary widely from
country to country (Cornelli, Goldreich and Ljungqvist, 2006). The trading is
typically organized by independent brokers and dominated by retail investors
(Cornelli, Goldreich and Ljungqvist, 2006; Dorn, 2009). Moreover, the duration of
pre-IPO market trading typically lasts for only a week or so before the first IPO
trading day. Cornelli, Goldreich, and Ljungqvist (2006) indicate that investor
sentiment affects the price discovery function of pre-IPO market: in high-sentiment
market13 the pre-IPO prices are not only higher than offer price but also the initial
price (e.g. Dorn, 2009). Whether the high pre-IPO prices affect the offer price setting
depends on the relative bargaining power between issuing firms and associated
underwriters. The offer price tends to be set higher when issuing firms have higher
bargaining power, and that results in lower initial return. By contrast, the offer price
tend be set close to the middle point of the price range from bookbuilding procedure
when underwriters have higher bargaining power, and that results in higher initial
return. Moreover, when offer prices being set higher due to raising pre-IPO prices in
high sentiment market, the over-boosted price would be followed by long-run reversal
and therefore long-run underperformance. Dorn (2009) explores the German’s
when-issued market and find that 91 IPO firms choosing when-issued market trading
13 Cornelli, Goldreich, and Ljungqvist (2006) take the midpoint of the filing range as a proxy for the
underwriter’s ex ante prior of the fundamental value, and they define high sentiment is that pre-IPO
price is higher than midpoint of the filing range

- 13 -
before IPO are associated with the average initial return of 50%, which is lower than
the average initial return of 54% for the rest 36 IPO firms choosing direct IPO.
Since the when-issued market is mainly comprised of individual investors, high
investment sentiment would boost pre-IPO price as well as the initial price. The
overshooting in prices would be followed by long-run underperformance.
Chang et al. (2016) use 218 Taiwanese IPOs in the sample period 2005-2011 and
find that the pre-IPO market facilitates price discovery in the sense that the pre-IPO
price is predictive to the initial price. However, the average initial return of 55%
seems to be incongruent with the alleged merit associated with pre-IPO market. They
refer the argument put forth by Ritter (2011) that information asymmetry only
comprises a small portion of initial return. Rather, the agency problem manifested in
underwriters’ rent-seeking behavior is the main driver of initial return. Moreover,
Chang et al. (2016) find that both initial return and price error are significantly
positive, implying that the pre-IPO price is not only higher than offer price but also
initial price.14
We briefly summarize the similarities and differences from the above studies
regarding the pre-IPO market price, offer price and initial price. The similarities
include (S1) the pre-IPO price is higher than both the offer price and initial
aftermarket price, suggesting that overvaluation may exist in the pre-IPO market; (S2)
the initial price would gradually converge to the pre-IPO price. The differences
include (D1) the initial return would be lower (higher) when the offer price is (not) set
in accordance with the boosted pre-IPO price; (D2) whether the exitance of pre-IPO
market could facilitate price discovery for IPO shares remain a debatable issue.
In this study we propose the self-dealing hypothesis to analyze the relationship
among the pre-IPO market price, offer price, and initial aftermarket price. Moreover,
we argue that the relation among these prices in bookbuilding offers is different from
that in fixed price public offers. Those hypotheses are developed as follows.
3.1 Pre-IPO trading price and initial aftermarket price
There are three parties involved in an IPO process: the issuer, investors, and the
associated underwriter. The issuer would like to set a higher offer price for raising
more proceeds from the IPO and to have a higher initial market price that reflects the
wealth of shareholders. Based on the self-dealing motive, the issuer is likely to boost
the pre-IPO price at a higher level so that both the offer price and initial aftermarket
14 Price error is the ratio of the pre-IPO price on ESM over the closing price on the first trading day
on TWSE or GTSM. The statistics in Table 3 of Chang et al. (2016) indicate that the price errors on
one day and four days prior to IPO are significantly positive.

- 14 -
price could be higher than otherwise when the pre-IPO market price is used as a
benchmark. The boost of pre-IPO prices in Taiwan could be attainable based on three
facts. First, pre-IPO market trading is mainly comprised of individual investors who
tend to be noisy traders (Chiang, Qian, and Sherman, 2010). Second, trading in the
pre-IPO market is relatively inactive except for the first trading day.15 Third, there is
no price limit in pre-IPO trading in Taiwan’s EMS. The three facts together make the
EMS vulnerable to insider manipulation.
In addition, the theory of information cascade suggests that investors who
observe the investment choice made by previous investors can update their beliefs
about the value of IPO shares (Welch, 1992). If pre-IPO market trading prices are
boosted, these prices may become reference prices or signals to retail investors.
Therefore, pre-IPO market prices tend to be positively related to aftermarket prices
and lead to overreaction in the aftermarket. If offer prices are adjusted upwards under
the circumstance of artificially boosting pre-marker prices, the short-run initial returns
may be lower. Combining the issuer’s self-dealing motive and the theory of
information cascade, we develop the following testable hypothesis.
Hypothesis 1: The pre-IPO price is higher than both the offer price and the initial
aftermarket prices. The initial aftermarket prices would gradually
converge to the pre-IPO market price.
3.2 Pre-IPO trading price and offer price
From the perspective of an associated underwriter, setting the offer price is a
complex task. The underwriter tends to provide a preliminary offer price range based
on the issuing firm’s fundamentals. Moreover, the pre-IPO market prices give the
underwriter alternative information in setting the offer price. If underwriting fee that
is in proportion to the offering proceeds is of concern, the underwriter would prefer
setting a higher offer price. Alternatively, the underwriter may prefer setting a lower
offer price to minimize underwriting risks. Whether the offer price is set with
reference to the preliminary offer price range or the pre-IPO price depends on the
issuer’s attributes and the relative bargaining power between the underwriter and
issuer.
15 According to Chang et al. (2016), the ESM trading in the first 6 months is inactive. The average
daily dollar volume fluctuates around NT$ 4.1 million and the average daily turnover is around
0.07%, an annualized rate of about 17%. The median values are even lower.

- 15 -
Both informed and uninformed investors would prefer a lower offer price for
their best interests. However, because the pre-IPO market is associated with a
short-sales constraint and a restriction on share subscription, the pre-IPO market in
fixed price public offers is typically comprised of uninformed individual investors.
For these uninformed individual investors, pre-IPO market prices provide the major
information for them to judge whether the offer price and the initial aftermarket price
are reasonable. Therefore, the offer price could be set with reference to the boosted
pre-IPO market price. In a nutshell, for a fixed price public offer, setting the offer
price at a higher level is for the best interests of the issuing firm and underwriter, and
is also acceptable to uninformed individual investors. Because the offer price as well
as the initial aftermarket price are set higher when the pre-IPO market price is used as
a benchmark, we posit that the initial return calculated from the offer price to the
initial aftermarket price would be lower.
In a bookbuilding offer, the major participants are institutional investors. To deal
with these informed institutional investors, the lead underwriter tends to set a lower
offer price to benefit good-relation clients in exchange for side payments (Ljungqvist,
2007; Loughran and Ritter, 2002; Reuter, 2006; Ritter, 2011; Nimalendran, Ritter and
Zhang, 2007; Liu and Ritter, 2010 and 2011; Goldstein, Irvine and Puckett 2011). The
offer price is set in general with reference to the middle of offer price range while not
in tandem with pre-IPO market prices.16 Setting the offer price at a lower level would
be associated with a higher initial return.
Moreover, the relative bargaining power of underwriters also affects the setting
of offer price.17 In the IPO literature, Logue (1973) posits that relative bargaining
power between issuers and underwriters influences the magnitude of underpricing.
The underwriter’s bargaining power depends on his/her contribution to the
underwriting process and the client’s dependence on the resources contributed by the
underwriter. By contrast, the issuer’s bargaining power depends on the value of the
assets, rent generating capacity of the equity for sale, and financial independence
(Marshall, 2004). Prior studies have shed light on the measurementsof relative
bargaining power between issuers and underwriters.18
16 Cornelli, Goldreich, and Ljungqvist (2006) indicate that the midpoint of the filing price range is a
proxy of the issuer’s fundamental value assumed by the associated underwriter. 17 Many threads of literature such as international joint ventures, strategic alliances, and cooperative
agreements indicate that the relative bargaining power of the parties will have influences on the
control over decision making and allocation of equity or proceeds (Coff, 1999; Harrigan & Newman,
1990; Inkpen & Beamish, 1997; Khanna, Gulati, & Nohria, 1998; Lecraw, 1984; Yan & Gray, 1994). 18 Logue (1973) proposes a dichotomous variable based on whether the underwriter is on a list of
prestigious underwriters produced by Hayes (1971). For issuer bargaining power, he proposes that the
issue size could serve as a proxy. Carter and Manaster (1990) use the proxy of the ranking position of
an underwriter’s name within tombstone ads (Hayes, 1971).

- 16 -
In general, the underwriters of bookbuilding offers have relatively larger
bargaining power against the issuers than those of fixed price public offers do. This is
because bookbuilding offers require higher placement skills and capability to maintain
good relations with important clients than fixed price public offers do.19 This larger
bargaining power would motivate the underwriters to set lower and rational offer
prices. There are two major pieces of information for them to set offer prices: the
pre-IPO market prices and the indication of interests from bookbuilding. Because of
investment sentiment and/or insider manipulation, the pre-IPO market prices tend to
be boosted to a higher level than the indication of prices collected from
bookbuilding.20 We therefore posit that the offer price of a bookbuilding offer is set
close to the prices collected from bookbuilding, while the offer price of a fixed price
public offer is set close to the pre-IPO market prices.
Furthermore, investment sentiment would prevail in both the pre-IPO market
trading and the initial aftermarket trading. Because the offer prices of bookbuilding
offers are set with reference to bookbuilding procedure and are much lower than the
offer prices of fixed price public offers set with reference to pre-IPO market prices,
the short-run initial returns of bookbuilding offers would be higher than those of fixed
price public offers. Moreover, the initial aftermarket trading is also subject to investor
sentiment which results in initial overreaction (Cornelli, Goldreich, and Ljungqvist,
2006). This initial overreaction will be corrected in the long run. We posit that the
initial overreaction is higher for fixed price public offers than for bookbuilding offers.
Therefore, the long-run stock performance of bookbuilding offers would be better
than that of fixed price public offers if the initial overreaction is corrected in the long
run. To sum up, we develop the following testable hypotheses.
Hypothesis 2.1: The offer prices of fixed price public offers are set close to pre-IPO
market prices, which are much higher than the offer prices of
bookbuilding offers.
Hypothesis 2.2: The initial returns of fixed price public offers are lower than those of
bookbuilding offers.
19 Fagre and Wells (1982) indicate that bookbuilding underwriters can access to public equity
markets through their sales force and social and business networks. Moreover, their local knowledge
of large institutional investors allows them to precisely apprehend demand through the bookbuilding
process (Hoberg, 2007). Furthermore, the skill of using market knowledge during pricing
negotiations can be a resource that adds to bargaining power and advantage (Coff, 1999; Inkpen &
Beamish, 1997; Lecraw, 1984; Schelling, 1956). 20 Using pre-IPO market prices as a proxy of small investors’ valuation or sentiment, Cornelli,
Goldreich, and Ljungqvist (2006) find that high pre-IPO market prices are a very good predictor of
first-day aftermarket prices, while low grey market prices are not. Moreover, long-run price reversal
only follows high grey market prices.

- 17 -
Hypothesis 2.3: The long-run stock performance of fixed price public offers are worse
than that of bookbuilding offers.
4. Data, Variables, and Models
Our sample consists of 476 IPO firms in the period of 2003-2012. The data for
ESM, TWSE, and GTSM including prices, trading volume, and the number of
shares outstanding are collected from the Taiwan Economic Journal (TEJ), a data
vendor in Taiwan. Moreover, other data items such as firm age, assets, directors’
shareholdings, duration, leverage, and EPS are also collected from TEJ. IPO
characteristics such as offer prices, the number of shares issued, underwriters, and
auditing firms are collected from the IPO prospectus. All sample firms have been
subject to a regulation of ESM trading for at least 3 months since 2003 and 6 months
since 2005.
Table 1 reports the annual sample distribution and the average initial returns for
fixed price public offers and bookbuilding offers, respectively. The results show that
the number of firms choosing the fixed price public offer is significantly reduced
from 80 in 2003 to 1 in 2006. Starting from 2007, there was no IPO firm choosing
the fixed price public offer. In contrast, bookbuilding has been graduately accepted
by IPO firms as the only underwriting procedure.
We note that most bookbuilding IPOs in our sample are hybrid bookbuilding
offerings with two tranches.21 The process of bookbuilding tranche usually lasts for
four business days, and the process of fixed price offering tranche often starts one
day later than the bookbuilding tranche but ends at the same time. The
announcement of bookbuilding is accompanied with a suggested price range. The
final offer price is determined one day after the end of the bookbuilding process. We
find that the average initial return of fixed price public offers (8.9%) is much lower
than that of bookbuilding offers (44.9%).
<<Insert Table 1 Here>>
21 Among the 322 IPOs associated with bookbuilding, 313 IPOs are hybrid bookbuilding offerings
and 9 IPOs are pure bookbuilding ones.

- 18 -
We provide the description of each variable in Appendix A. Table 2 reports the
summary statistics for variables. The initial return which is the percentage change
from the offer price to the initial closing price is 33.3% on average. The average
market-adjusted initial return is 42.0%. We also use the price-multiple approach in
Purnanandam and Swaminathan (2004) to estimate the fundamental offer price that
are derived from the price multiples of matching firms which are listing firms, close
in asset size, and in the same industry as the IPO firm. Specifically, the fundamental
offer price (OPR) is obtained from the following condition
. (1)
We then calculate the underpricing of the offer price (Undermatch) with respect to
the fundamental offer price as
. (2)
The average underpricing of offer price with respect to the fundamental offer price
is -16.9%, suggesting that the original offer price is not underpriced on average.
That is, the typical original offer price is set much higher than the estimated
fundamental offer price.
The setting of offer price at a relatively low level would result in a price
increase when shares are initially traded in the aftermarket (Aggarwal and Rivoli
(1990), Ljungqqist et al. (2006), Baker and Wurgler (2006), Dorn (2009) and Clarke
et al. (2016)). Therefore, we also calculate the overreaction of the initial price with
respect to the matching firm (Overmatch). Again, we use the price multiple approach
in Purnanandam and Swaminathan (2004) and estimate the fundamental initial price
with respect to the matching firm. The overreaction of the initial price is calculated
as
. (3)
The average overreaction of the initial price with respect to the matching firm is
50.6%. The results from the overestimation of offer price and the overreaction of the
initial price suggest that both the pre-IPO market and the post-issuance market in
Taiwan may be affected by high investor sentiment that boosts the level of offer
price as well as the initial closing price.

- 19 -
For measuring long-run stock performance, we follow Ritter (1991) and
calculate the wealth relative from 1 year through 5 years following the IPO as
.5,2,1,
1
1
*12
1
,
*12
1
,
n
R
R
WRn
t
tm
n
t
ti
n
(4)
, where Ri, t is the post-IPO monthly return, and Rm, t is the corresponding market
return. When the wealth relative is greater than 1, it suggests that the IPO firm
outperforms the market. We find that the average (median) WR1 through WR5 are
1.21 (1.04), 1.23 (0.95), 1.31 (0.94), 1.23 (0.83), and 1.19 (0.84), respectively.
For the pre-IPO market trading, we report the trading volume on the trading day
immediately prior to the IPO listing day (Vol-1), the trading volume on the day of
IPO lottery (Vollot), the average daily trading volume five days prior to the IPO
listing day (Vol-1to-5), the average daily trading volume ten days prior to the IPO
listing day (Vol-1 to -10), and the average daily trading volume two months prior to
IPO (Avg_Vol). The means in terms of thousand shares (one round lot) are 310.8,
179.1, 327.5, 1,361.9, and 146.9, respectively.
For the relevant prices of IPOs, we report the offer price (OP), the initial closing
price (IP), the fundamental offer price (OPR), the pre-IPO market price on the
trading day immediately prior to the IPO listing day (P-1), the pre-IPO market price
on the IPO lottery day (Plot), the pre-IPO market price two months prior to the IPO
listing day (AvgP), and the middle price of the price range for bookbuilding offers
(MidP). Their means are NT$46.2, NT$62.9, NT$28.6, NT$66.1, NT$65.0,
NT$63.3, and NT$50.0, respectively. The result indicates that the pre-IPO market
prices are higher when compared with the fundamental offer price estimated from
the matching firms and when compared with the middle price of the price range
from bookbuilding offers. We note that the average pre-IPO market prices such as
P-1, Plot, and AvgP are not only higher than the average offer price but also higher
than the average initial closing price, indicating that the pre-IPO market prices may
be overestimated.
We also measure the overvaluation of the pre-IPO market price on the IPO
lottery day when gauged with respect to the offer price(OVPlot-OP), the initial offer
price(OVPlot-IP), and the matching firms as the benchmark(OVPlot-match), respectively.
The average overvaluation gauged with respect to offer price, the initial offer price,
and the matching firms are 36.38% and 3.30%, 53.54%, and 43.62% respectively.
Finally, we use the offer price and the initial closing price as the benchmark to

- 20 -
measure the underpricing and overreaction of the middle price of the price range
from bookbuilding offers and find the average underpricing(UnderMidP) and
overreaction (OverMidP) are 1.24% and 43.62%.
As for the other characteristics of IPO firms, the average DGTSM of 0.75 indicates
that around three quarters of IPO firms are listed on the Gre-Tai Stock Market
because the thresholds for listing are lower for GTSM than for TWSE. Moreover,
75.8% of the IPO firms are from the electronics industry. It is consistent with the
fact that the electronics industry was the major driver for the economic development
in Taiwan over the sample period. When considering the reputation effect of auditing
firms and underwriters, we find that 81% of the IPO firms would choose to have
their financial reports audited by the big-4 auditing firms, and 85% of them would
choose reputable underwriters. The results are consistent with the prior studies on
the reputation effects of auditing firms and underwriters (see, for example, Carter
and Manaster (1990), DeAngelo (1981), and Megginson and Weiss (1991)).
Furthermore, we define the lottery odds (or the subscription success rate) as the
ratio of the number of shares offered to the public to the number of shares
subscribed by investors (Lottery). In general, a hot IPO is associated with a larger
number of subscription orders and therefore with the lower lottery odds. The average
lottery odds are 17%. The average age of the IPO firms when going public (Age) is
around 14 years. We also collect the data of duration (Duration) which is the number
of calendar days from the announcement of the IPO procedure to the initial listing
day. The average duration is 20 days. For insider ownership, we calculate the total
shareholdings owned by the directors and supervisors one year prior to the IPO
(Dir_Share). The average shareholdings owned by these insiders are 34.2%. Also,
the average debt-to-equity ratio is 35.8%, and the average earnings per share is
NT$3.74.
<<Insert Table 2 Here>>
5. Empirical Results
In Table 3 we conduct the tests in differences between the fixed price public
offers and bookbuilding offers. Panel A reports that the mean and median initial
returns (44.9% and 27.7%) and market-adjusted initial returns (49.3% and 29.0%)
for bookbuilding offers are significantly positive and larger than those of fixed price
offers. Moreover, for bookbuilding offers the mean and median underpricing gauged
with respect to their matching firms (-9.4% and -31.9%) are significantly higher than

- 21 -
those of fixed price offers. Since the underpricing is negative, the results suggest
that the offer prices are relatively overestimated, and such overvaluation is higher
for fixed price offers than for bookbuilding offers. For the overreaction of initial
aftermarket prices, we find that bookbuilding offers are associated with larger
overreaction of initial closing prices (55.0%) than fixed price offers are (41.5%).
We further examine the subsequent long-run stock performance based on the
wealth relative developed by Ritter (1991) and find that bookbuilding offers are
associated with higher wealth relative measures than fixed price offers particularly
for the first three years. The overall picture in Panel A indicates that compared to
fixed price offers, bookbuilding offers tend to set lower offer prices, which are
followed by larger price increases when IPO shares are initially traded in the
aftermarket and by higher wealth relative measures in subsequent three years. We
note that our samples for both bookbuilding and fixed price offers are selected from
the period when all IPO firms were required to be traded in the pre-IPO market
before their official listing. If pre-IPO market trading is an effective mechanism to
mitigate information asymmetry, we do not expect to find a significant difference in
the underpricing of offer price, in the overreaction of initial closing price, and in the
wealth relative measures between bookbuilding and fixed price offers. For a
robustness check, in Panel B we alternatively measure the overvaluation of the
pre-IPO market price on the IPO lottery day guaged with respect to offer price, the
initial offer price, and the matching firms. Compared to fixed price offers,
bookbuilding offers are still associated with lower offer prices and larger
overvaluation of initial closing prices.
In Panel C we examine the underwriting and firm characteristics between the
fixed price and bookbuilding offers. The IPO firms using the fixed price public offer
are more likely to be listing on the GTSM than those using the bookbuilding offer.
Since the listing requirements in terms of profitability and firm size are higher for
listing on the TWSE than for the GTSM, the result suggests that smaller and less
profitable firms are more likely to be listing on the GTSM than on the TWSE. The
firms using the bookbuilding offer are more likely to be associated with big-4
auditing firms than those choosing the fixed price offer. In contrast, the firms using
the fixed price offer tend to be associated with larger underwriters than those using
the bookbuilding offer. Moreover, we find that the odds of IPO lottery are higher for
the firms using the fixed price offer than for the bookbuilding IPO firms. Two
factors may explain the pattern. First, the firms using the fixed price offer are less
favorable to investors than the bookbuilding IPO firms. Second, since a certain
portion of the newly issued shares are distributed to the bookbulding investors for

- 22 -
the hybrid bookbuilding offers prevailing in Taiwan, the remaining portion left for
the public offer tranche would reduce the odds of IPO lottery with other conditions
being the same.
Moreover, we find the average duration for completing an IPO is shorter for the
bookbuilding offers (15.5 days) than for the fixed price offers (29.9 days). The
average offer price for bookbuilding offers (NT$49.9) is significantly higher than
that for fixed price offers (NT$38.6). Although the bookbuilding offers have a
higher average offer price than the fixed price offers, the bookbuilding offers tend to
be underpriced (with respect to their benchmark values) to a greater extent than the
fixed price offers do. The evidence can be seen in Panel B where all underpricing
measures with different benchmarks are higher for bookbuilding offers than for
fixed price offers. The average firm size in terms of total assets and earnings per
shares are both higher for bookbuilding offers than for fixed price offers.
Finally, in Panel D we report the test in differences of pre-IPO trading volume
between bookbuilding offers and fixed price offers. The results indicate that
bookbuilding offers are associated with higher trading volume than fixed price
offers are either on a specific day (the last pre-IPO trading day and the IPO lottery
day) or for a specific period of time (the last five pre-IPO trading days, the last ten
pre-IPO trading days, and the two months immediately prior to the IPO trading day).
<<Insert Table 3 Here>>
Table 4 reports the regression results. In Panel A we examine the effects of
underwriting procedure on the short-term performance measures including the initial
return, market-adjusted initial return, underpricing of offer price with respect to the
matching firm, and overreaction of initial closing price with respect to the matching
firm. The most critical variable of interest is the dummy variable of bookbuilding
offer (Dbookbuilding), which is set equal to one for bookbuilding offers, and zero
otherwise. We find that the regression coefficient is significantly positive for the
regression of initial return and for the regression of underpricing. That is, the
bookbuilding IPO firms are associated with higher initial returns and are
underpriced to a greater extent than the fixed price offering firms.
For the other control variables, we find that the firms seeking to be listing on the
GTSM tend to be underpriced. IPOs associated with higher odds of lottery tend to
have lower initial returns and smaller overreaction of initial closing price, suggesting
that these IPOs are relatively cold issues. Moreover, old, large, or long-duration
IPOs are less favored by the market and therefore are associated with lower initial
returns and lower overreaction of the initial closing price. Furthermore, we find that

- 23 -
IPO firms with higher earnings per share are associated with lower underpricing and
higher overreaction, suggesting that investors do factor the IPO firm’s fundamentals
into pricing.
In Panel B we examine the effects of the pre-IPO trading volume (Vollot) and
price-to-book ratio (Plot/B) on the short-term performance measures. We use the
pre-IPO trading volume on the IPO lottery day as the proxy of pre-IPO market
trading volume. In addition, for normalization across all IPO firms, we use the
price-to-book ratio, Plot/B, on the IPO lottery day as the proxy of pre-IPO market
valuation. This ratio can also be viewed as a measure of “overvaluation” to some
extent in the pre-IPO market trading.
The regression results show that both the pre-IPO trading volume and pre-IPO
market valuation are significantly and positively related to the initial return,
market-adjusted initial return, and overreaction of initial closing price. However,
pre-IPO market valuation is significantly and negatively related to the underpricing
of offer price with respect to its matching firm. After taking the pre-IPO trading
volume and pre-IPO market valuation into account in the regression models, we still
find that bookbuilding IPO firms tend to be underpriced more than the fixed price
offering firms.
We also use other proxies such as Vol-1, Vol-1to-5, Vol-1to-10, and Avg_Vol for
pre-IPO market trading volume and find that the results remain qualitatively similar.
We do not report these results for brevity.
Overall, we find that bookbuilding IPO firms tend to be underpriced more than
the fixed price offering firms. Both active pre-IPO trading and pre-IPO market
valuation are positively related to the overreaction of initial closing price, which
leads to significantly higher initial returns and market-adjusted initial returns.
Moreover, such pre-IPO market valuation helps reduce the underpricing of offer
price.
<<Insert Table 4 Here>>
In Table 5 we investigate the effects of underwriting procedure, pre-IPO market
underpricing, and pre-IPO market overvaluation on the long-run performance which
is measured by the post-IPO wealth relatives as used in Ritter (1991). In Panel A we
examine the impact of underwriting procedure on the long-run performance of IPO
firms. The dummy variable of bookbuilding offer (Dbookbuilding) is positively related
to WR1, WR2, and WR5, suggesting that IPO firms using bookbuilding offers exhibit
better long-run performance as compared to those using the fixed price offer. The

- 24 -
results are consistent with those of univariate analysis as reported in Panel A of
Table 3.
In Panel B of Table 5 we further include pre-IPO market overvaluations with
respect offer price (OVPlot-OP), the matched firms (OVPlot-match), and the initial
closing price (OVPlot-IP) in the regression models and examine how they are related
to the long-run performance measures. Pre-IPO market overvaluations are measured
by the difference between the pre-IPO market price on the IPO lottery day and the
offer price, the rational offer price with respect to the matching firm (OPR) and
initial closing price normalized by the offer price. The results indicate that pre-IPO
market overvaluation with respect to offer price is positive related to the first year
performance (WR1). In contrast, pre-IPO market overvaluations with respect to the
matched firm’s price and the initial closing price are negatively related to some or
all of the long-run performance measures (WR4 and WR5, WR1~WR5). That is,
relatively high pre-IPO market prices due to investor sentiment or possible insider
manipulation in the pre-IPO market are associated with poor long-run performance.
That is, if the offer price is set higher due to investor sentiment or possible insider
manipulation in the pre-IPO market that results in high pre-IPO market prices, the
boosted offer price (or lower pre-IPO market underpricing) would have a
detrimental effect on long-run performance of IPO firms. Alternatively, if the offer
price is set lower, the post-IPO market prices would rebound to higher levels,
leading to better long-run performance.
<<Insert Table 5 Here>>
In Panels A and B of Table 6, we investigate how pre-IPO market trading and
pre-IPO market valuation affect the short-term performance measures and the
long-term performance of fixed price offers, respectively. For short-term
performance in Panel A, only pre-IPO market trading is positively related to the
overreaction of initial closing price, leading to significantly higher initial returns and
market-adjusted initial returns. Pre-IPO market trading also helps reduce the
underpricing of offer price. However, pre-IPO market valuation is not significantly
related to the short-term performance measures of fixed price offers.
In Panels B of Table 6, we investigate how pre-IPO market overvaluations affect
the long-term performance of fixed price offers. The result indicates that pre-IPO
market overvaluation with respect to the matched firms’ price is negatively related
to the long-term performance measures (WR3, WR4, and WR5), and the pre-IPO
market overvaluation respect to the initial closing price is negatively related to the

- 25 -
long-term performance measures (WR1~WR5), too. In contrast, the pre-IPO market
overvaluation with respect to the offer price has no significant impact on the
long-term performance measures. That is, for fixed price offers, if the pre-IPO
market prices are relatively higher, with respect to matched firms’ price and initial
closing price, due to investment sentiment or possible insider manipulation that
would have a detrimental effect on long-run performance.
We elaborate more on these findings. First, we further extend the sample period
back to 1996 when pre-IPO market trading had not been adopted yet (unreported).
We compare the initial returns before and after the introduction of mandatory
pre-IPO market trading and find that the mean (median) initial return is 27.4%
(14.7%) before the introduction of pre-IPO market trading. The mean (median)
return significantly increases to 33.3% (18.9%) after the introduction of mandatory
pre-IPO market trading. However, the increases in initial returns are mainly
attributed to bookbuilding offers. For fixed price offers, the introduction of
mandatory pre-IPO market trading results in a significant reduction of the mean
(median) initial return from 27% (15%) before the introduction to 9% (6%) after the
introduction. On the one hand, the results from fixed price offers are generally
consistent with those in Derrien and Kecskes (2007) that pre-IPO market trading
facilitates price discovery. Therefore, pre-IPO market prices serve as good
predictors for initial after-market prices. On the other hand, the results are likely due
to noisy traders who actively participate in both the pre-IPO market and the IPO
after-market. The high investor sentiment boosts both the pre-IPO market prices and
the initial after-market prices in a similar manner. This explanation is close to those
offered in Cornelli, Goldreich, and Ljungqvist (2006) and Dorn (2009). At first
glance, pre-IPO market trading enhances price discovery because of the finding of
the reduction of average initial return. However, together with the evidence of
long-run WRs, the results suggest that the reduction of initial returns arises from the
setting of higher offer prices. If both the pre-IPO market prices and the initial
after-market prices are boosted by high investor sentiment, the long-run stock
performance tend to be poor, which is consistent with our findings.
<<Insert Table 6 Here>>
In Panels A and B of Table 7, we investigate how pre-IPO market trading and
pre-IPO market valuation affect the short-term performance measures and the
long-term performance of bookbuilding offers, respectively. For short-term
performance in Panel A, both pre-IPO market trading and pre-IPO market valuation
are positively related to the overreaction of initial closing price, leading to
significantly higher initial returns and market-adjusted initial returns. In addition,

- 26 -
pre-IPO market valuation for bookbuilding offers helps reduce the underpricing of
offer price. The results are consistent with those reported in Panel B of Table 4.
In Panels B of Table 7, we investigate how pre-IPO market overvaluations affect
the long-term performance of bookbuilding offers. The pre-IPO market
overvaluation with respect to the offer price has positively related to the long-term
performance measures (WR1 and WR3), while the pre-IPO market overvaluation
with respect to the initial closing price affect the long-term performance. The result
indicates that pre-IPO market overvaluation is only negatively related to the
third-year performance (WR3). That is, for bookbuilding offers, if the offer prices
are set relatively lower, the after-market prices would rebound to higher levels,
leading to higher initial returns and better long-run performance.
We also find that the introduction of mandatory pre-IPO market trading mainly
involves in individual noisy traders. It is possible that the involvement of noisy
traders would be more for fixed price offers than for bookbuilding offers. During the
process of a bookbuilding offer, sophisticated investors including institutional
investors are invited to indicate their willingness of buying IPO shares, and these
sophisticated investors may also involve in trading in the after-market. However,
this is not the case for fixed price offers because institutional investors do not
participate in IPO lottery due to a small number of shares (usually 1,000 shares)
which each participating investor can purchase. Therefore, high investor sentiment
prevails in both the pre-IPO and post-IPO markets due to the involvement of
individual noisy traders.
<<Insert Table 7 Here>>
The results show that for both types of offers the pre-IPO market trading volume
is positively related to initial returns, the market-adjusted initial returns, and the
overreaction of initial closing prices. This is somewhat inconsistent with Derrien and
Kecskes (2007) who argue that a pre-IPO market provides two-stage offering and
therefore reduces valuation uncertainty associated with IPO firms. If their argument
is valid in our setting, we would expect to find a negative relation between the
pre-IPO market trading volume and the initial returns. In contrast, Dorn (2009)
indicates that the retail purchases in the when-issued market can serve as a proxy of
retail sentiment. They find that IPOs aggressively bought by individual investors in
the when-issued market exhibit high first-day returns. Individual investors who
actively trade in the pre-IPO market as well as in the aftermarket result in higher
initial returns and overreaction of the initial closing price. Therefore, our findings of

- 27 -
the positive relation between the pre-IPO market trading volume and initial returns
are consistent with those in Dorn (2009).
One major feature to contrast our findings with those of prior studies is that the
pre-IPO market trading is mandatory for all IPO firms in Taiwan. Such a regulatory
requirement helps eliminate the bias of sample selection. It is surprising to find that
the compulsory pre-IPO market trading mainly attracts noisy traders. As a
consequence, such active noisy trading tends to boost the initial closing prices and
initial returns to higher levels. The most critical difference between the fixed price
offers (Panel A) and bookbuilding offers (Panel B) is the impact of pre-IPO market
trading on the underpricing. In Panel A of Table 6, we find that the coefficient on
pre-IPO market trading volume is significantly negative. But the coefficient is
insignificant for the bookbuilding offers in Panel A of Table 7. The result suggests
that the setting of offer price is positively affected by the pre-IPO market trading
volume for fixed price offers. Furthermore, it is worth noting that pre-IPO market
valuation is not significantly related to the short-term performance measures of fixed
price offers. In contrast, the valuation multiple in the pre-IPO market is negatively
related to underpricing for bookbuilding offers.
6. Conclusion
In this study we explore the joint effect of pre-IPO market trading and
underwriting procedures on short-term and long-term performance of IPO firms in
Taiwan where pre-IPO market trading is mandatory for all IPO firms. Though our
finding of the predictive power of pre-IPO market price on the initial market price
seems to echo the previous findings in Cornelli, Goldreich, and Ljungqvist (2006),
Derrien and Kecskes (2007), Dorn (2009), and Chang et al., (2016), we believe that
the predictive power is mainly due to the fact that individual investors who prevail
in both the pre-IPO market and after-market prompt the issuers’ manipulation and
information cascade that affects both pre-IPO market prices and initial after-market
prices. We further examine the role of underwriting procedure and find that
bookbuilding offer is preferred to fixed price offer especially for the setting of offer
price. The offer price for bookbuilding is set close to the middle point of the filing
price range. In contrast, the offer price for fixed price offer is set in response to
pre-IPO market prices. This results in higher initial return and higher initial prices
with respect to benchmarks for bookbuilding offers than for fixed price offers.
Moreover, since the initial after-market prices for bookbuilding were jointly affected
by sophisticated and noisy investors, the initial returns are positively related to

- 28 -
long-run stock performance. By contrast, the initial aftermarket prices for fixed price
offers were mainly affected by individual investors, it is negatively correlated with
long-run stock performance.
Because of the finding of the predictive power of pre-IPO market price on the
initial aftermarket price, some prior studies support the use of pre-IPO market
trading and indicate that it mitigates information asymmetry and therefore facilitates
price discovery. Our findings indicate that the pre-IPO market trading may be
subject to insiders’ manipulation and noisy traders’ information cascade so that both
pre-IPO market prices and initial aftermarket prices are boosted in the same
direction. We are therefore with reservation to the price discovery function
associated with the pre-IPO market.
The important issue for enhancing the pre-IPO market price discovery is to
involve informed traders’ in. There are several obstacles to keep informed traders
away from the pre-IPO market. First of all the scant trading volume associated with
the pre-IPO market is a disincentive for block informed traders. Therefore the only
block investors left are insiders who aim to manipulate the pre-IPO market prices for
their own benefit (e.g. Chiang, Hirshleifer, Qian, and Sherman, 2011). This could be
a typical case for many pre-IPO markets and not necessarily a special case that we
illustrate here. Furthermore, the auction market in Taiwan has been on the wane
mainly because of the scant trading volume. Is there any way out of the disincentive
involving in informed block investors? We posit a possible way out is to require that
the offer price set by underwriters of bookbuilding offers should be in a certain
relation to or not deviate too much from the pre-IPO market prices. Inasmuch,
underwriters have an incentive to participate in the pre-IPO market trading. The
pre-IPO market prices therefore incorporate the trading from the informed insiders
who aim to manipulate higher pre-IPO market prices for their own benefit and the
trading of informed underwriters who aim to lower pre-IPO market prices for
controlling underwriting risks and placing low-price shares to their loyal clients.

- 29 -
References
Aggarwal, R., and Rivoli, P. 1990. Fads in the initial public offering market.
Financial Management 19(4), 45-57.
Aussenegg, W., Pichler, P., and Stomper, A. 2006. IPO pricing with bookbuilding
and a when-issued market. Journal of Financial and Quantitative Analysis 41(4),
829-862.
Baker, M. and Wurgler, J. 2006. Investor sentiment and the cross-section of stock
returns. Journal of Finance 61, 1645-1680.
Benveniste, L., and Busaba, W. 1997. Bookbuilding vs. fixed price: an analysis of
competing strategies for marketing IPOs. Journal of Financial and Quantitative
Analysis 32, 383-403.
Benveniste, L., and Spindt, P.1989. How investment bankers determine the offer
price and allocation of new issues. Journal of Financial Economics 24(2), 343-361.
Benveniste, L, and Wilhelm, W. 1990. A comparative analysis of IPO proceeds
under alternative regulatory regimes. Journal of Financial Economics 28, 173-207.
Biais, B., and Faugeron-Crouzet, A.M. 2002. IPO auctions: English, Dutch, …
French and internet. Journal of Financial Intermediation 11, 9-36.
Brav, A., and Gompers, P. A. 2003. The role of lockups in initial public offerings,
Review of Financial Studies 16(1), 1-29.
Busaba, W. Y., and Chang, C. 2010. Bookbuilding vs. fixed price revisited: the
effect of aftermarket trading. Journal of Corporate Finance 16, 370-381.
Carter, R. B. and Dark, F. H., 1992. An empirical examination of investment
banking reputation measures, Financial Review 27(3), 355-374.
Carter, R. and Manaster, S., 1990. Initial public offerings and underwriter reputation.
Journal of Finance 5, 1045-1067.
Certo, S.T., Covin, J.G., Daily, C.M., and Dalton, D.R., 2001. Wealth and the effects
of founder management among IPO-stage new ventures. Strategic Management
Journal 22(6-7), 641–658.
Chang, C., Chiang, Y.M., Qian, Y., and Ritter, J.R. 2017. Pre-market trading and
IPO pricing. Review of Financial Studies 30(3), 835-865.

- 30 -
Chen, H. and Wu, S. 2015. Who makes the choice on IPO underwriting methods?
Issuers versus underwriters. Financial Management 44, 753-783.
Chiang, Y. M., Qian, Y., and Sherman, A. E. 2010. Endogenous entry and partial
adjustment in IPO auctions: Are institutional investors better informed? Review of
Financial Studies 23, 1200-1230.
Clarke, J., Khurshed, A., Pande, A., and Singh, A.K. 2016. Sentiment traders & IPO
initial returns: The Indian evidence. Journal of Corporate Finance 37, 24-37.
Coff, R.W., 1999. When competitive advantage doesn't lead to performance: The
resource-based view and stakeholder bargaining power. Organization Science 10(2),
119 - 133
Colaco, H.M.J., Cesari, A.D., and Hegde, S.P., 2014. Retail investor attention and
IPO valuation. 2013 EFMA.
Cornelli, F., Goldreich, D., and Ljungqvist, A., 2006. Investor sentiment and pre-IPO
markets. Journal of Finance 61, 1187-1216.
Daily, C., Dalton, D., and Cannella Jr., A., 2003. Corporate governance: Decades of
dialogue & data. Academy of Management Review 28(3), 371-382.
Derrien F., and Kecskés, A., 2007. The initial public offerings of listed firms. Journal
of Finance 62, 447-479.
Dorn, D., 2009, Does sentiment drive the retail demand for IPOs? Journal of
Financial and Quantitative Analysis 44, 85-108.
Fagre, N., and Wells Jr., L. T., 1982. Bargaining power of multinationals and host
governments. Journal of International Business Studies 13(2), 9-23.
Harrigan, K.R., and Newman, W.H., 1990. Bases of interorganization co-operation:
propensity, power, persistence. Journal of Management Studies 27(4), 417–434.
Hayes, S. L., 1971. Investment banking: Power structure in Flux. Harvard Business
Review 49, 136-152.
Higgins, M.C., Gulati, R., 2003. Getting off to a good start: the effects of upper
echelon affiliations on underwriter prestige. Organization Science 14, 244–263.
Hoberg, G., 2007. The underwriter persistence phenomenon. Journal of Finance 62(3),
1169-1206.

- 31 -
Hsu, H.C., Reed, A.V., and Rocholl, J., 2010. The New Game in Town: Competitive
Effects of IPOs. Journal of Finance 65(2), 495-528.
Inkpen, A.C., and Paul W. Beamish, P.W., 1997. Knowledge, bargaining power, and
the instability of international joint ventures. The Academy of Management Review
22(1), 177-202.
Khanna, T., Gulati, R., and Nohria, N., 1998. The Dynamics of learning alliances:
competition, cooperation, and relative scope. Strategic Management Journal 19(3),
193-210.
Lecraw, D.J., 1984. Bargaining power, ownership, and profitability of transnational
corporations in developing countries. Journal of International Business Studies
15(1), 27-43.
Ljungqvist, A., 2007. IPO underpricing. B.E. Eckbo (ed.), Handbook of Corporate
Finance, North-Holland.
Ljungqvist, A., Nanda, V. and Singh, R., 2006. Hot markets, investor sentiment, and
IPO pricing. Journal of Business 79(4), 1667-1701.
Logue, D. E., 1973. On the pricing of unseasoned equity issues: 1965-1969. Journal
of Financial and Quantitative Analysis 8, 91-103.
Loughran, T., and Ritter, J. R., 2002. Why don’t issuers get upset about leaving
money on the table in IPOs? Review of Financial Studies 15(2), 413-443.
Loughran, T., Ritter, J.R., and Rydqvist, K.1994. Initial public offerings:
international insights. Pacific-Basin Finance Journal 2(2-3), 165-199.
Lowry, M., and Schwert, G.W., 2004. Is the IPO pricing process efficient? Journal
of Financial Economics 71 (1), 3-26.
Marshall, B.B., 2004. The effect of firm financial characteristics and the availability
of alternative finance on IPO underpricing. Journal of Economics and Finance 28
(1), 88-103.
Otchere, I., Owusu-Antwi, G., and Mohsni, S. 2013. Why are stock exchange IPOs
so underpriced and yet outperform in the long run? Journal of International
Financial Markets Institutions and Money 27, 76-98.
Paleari, S., Signori, A., and Vismara, S. 2014. How Do Underwriters Select Peers
When Valuing IPOs? Financial Management 43(4), 731-755.

- 32 -
Purnanandam, A., and Swaminathan, B. 2004. Are IPOs really underpriced? Review
of Financial Studies 17, 811-845.
Ritter, J. R., 2011. Equilibrium in the initial public offerings market. Annual Review
of Financial Economics 3, 347-374.
Schelling, T. C., 1956. An essay on bargaining. American Economic Review 46(3),
281–306.
Sherman, A. E. 2005. Global trends in IPO methods: book-building versus auctions
with endogenous entry. Journal of Financial Economics 78(3), 3–29.
Spatt, C., and Srivastava, S. 1991. Replay communication, participation restrictions
and efficiency in initial public offerings. Review of Financial Studies 4(4), 709-726.
Stuart, T.E., Hoang, H., Hybels, R.C., 1999. Interorganizational endorsements and
the performance of entrepreneurial ventures. Administrative Science Quarterly 44,
315-349.
Su, C., and Bangassa, K. 2011. The impact of underwriter reputation on initial
returns and long-run performance of Chinese IPOs. Journal of International
Financial Markets Institutions and Money 21, 760-791.
Yan. A., and Gray, B., 1994. Bargaining power, management control, and
performance in united states-china joint ventures: A comparative case study. The
Academy of Management Journal 37(6), 1478-1517.

33
The scheme prior to 2005: bookbuilding first, followed by fixed price offer
T0 T1 T2 T3 T4 T5 T6 T7 T8
Bookbuilding
announcement
The end of
bookbuilding procedure
Announce the
offer price
Mail the notification of
bookbuilding subscription
Payment for bookbuilding
subscription IPO
Announce price
range File to SEC
Fixed price announcement
The end of fixed price
procedure
Fixed price
lottery
Payment for fixed
price subscription
The scheme after 2005: Synchronize bookbuilding and fixed price procedures
T0 T1 T2 T3 T4 T5
Bookbulding announcement
The end of bookbuilding
procedure Announce the offer price
IPO
Price range for bookbuilding
Payment for bookbuilding
subscription
Fixed price announcement Fixed price subscription The end of fixed price
procedure
Payment for fixed price
subscription Fixed price lottery
Figure 1 the process of hybrid BB of Taiwan

34
Table 1: Sample Distribution
The sample consisting of 476 IPO firms in the Taiwan Stock Market in the period of 2003-2012 was
collected from the Taiwan Economic Journal (TEJ), a data company in Taiwan. All sample firms were
subject to the mandatory Emerging Stock Market (ESM) trading for at least 3 months since 2003 and 6
months since 2005. This table reports the annual sample distribution and the average initial returns for
fixed price public offers and bookbuilding offers, respectively.
Fixed price offers Bookbuilding offers Total
Year No. Initial Return (%) No. Initial Return (%) No. Initial Return (%)
2003 80 4.43 80 4.43
2004 63 12.83 19 0.33 82 9.94
2005 10 16.69 36 32.54 46 29.09
2006 1 47.93 34 63.64 35 63.19
2007 50 65.92 50 65.92
2008 33 28.92 33 28.92
2009 33 96.58 33 96.58
2010 39 46.46 39 46.46
2011 58 18.38 58 18.38
2012 20 40.36 20 40.36
Total 154 8.95 322 44.92 476 33.28

35
Table 2: Summary Statistics
This table reports the summary statistics of variables. All variables are defined in Appendix A.
No. Mean Median Min. Max. S.D.
A. Short-term initial returns and long-run performance measures
IR (%) 476 33.28 18.91 -32.59 726.09 58.96
AR (%) 476 41.86 19.80 -88.34 141240 118.87
Undermatch (%) 476 -16.93 -36.42 -92.15 572.89 71.34
Overmatch (%) 476 50.61 58.07 -548.76 482.59 85.13
WR1 476 1.214 1.036 0.213 5.381 0.741
WR2 475 1.233 0.947 0.093 10.305 1.153
WR3 449 1.313 0.940 0.020 30.951 1.861
WR4 336 1.228 0.832 0.027 21.876 1.759
WR5 305 1.192 0.843 0.007 15.253 1.414
B. Pre-IPO Trading
Vol-1 465 310.8 109.0 0.0 8527.0 639.2
Vollot 465 179.1 54.0 0.0 3392.0 357.7
Vol-1 to -5 465 327.5 91.2 0.0 43461.6 2054.4
Vol -1 to -10 465 1361.9 82.4 0.0 536167.0 24858.3
Avg_Vol 464 146.9 54.5 0.0 4629.5 348.9
Avg_Ret (%) 459 0.500 0.336 -4.587 12.814 1.317
C. Prices of IPO
OP 476 46.2 32.5 10.0 500.0 45.7
IP 476 62.9 39.0 9.0 871.0 77.8
OPR 476 28.6 21.5 1.55 241.6 25.6
P-1 465 66.1 41.2 10.0 835.0 78.8
Plot 465 65.0 41.0 9.9 830.0 76.7
AvgP 464 63.3 40.1 10.4 731.0 72.2
MidP 322 50.0 33.0 10.3 490.0 51.4
D. Overvaluation, underpricing and overreaction of Pre-IPO market
OVPlot-OP (%) 465 36.38 25.76 -22.65 443.48 42.61
OVPlot-IP (%) 465 3.30 6.90 -282.61 77.59 29.59
OVPlot-match (%) 465 53.54 64.13 -531.89 360.41 78.59
Undermid-OP 322 1.24 0.00 -10.53 75.00 7.45
OverMidP (%) 322 43.62 26.67 -42.31 726.09 68.43
Plot /E 452 29.71 16.98 2.67 1588.3 85.59
Plot /B 464 3.68 2.65 0.59 41.46 3.62
E. Underwritting and firm’s characteristics
DGTSM 476 0.752 1.000 0.000 1.000 0.432
Delectronic 476 0.758 1.000 0.000 1.000 0.429
Dbig-4 476 0.805 1.000 0.000 1.000 0.397
Dunderwriter 476 0.851 1.000 0.000 1.000 0.357
OQ 476 15.457 15.320 13.891 19.114 0.741
Lottery (%) 467 17.039 2.960 0.040 100.000 31.135

36
Age 476 14.131 11.877 0.611 60.444 9.103
Size 476 18.711 18.509 16.536 24.164 0.986
Duration 476 20.160 15.000 0.000 44.000 8.648
Dir_Share (%) 476 34.242 29.755 5.290 100.000 17.477
Lev (%) 476 35.830 34.890 1.680 79.980 15.043
EPS (NT$) 476 3.744 3.000 -10.200 24.400 3.497
Vol 476 4036.3 2192.5 50 110863 7848.7

37
Table 3: Test in Differences
This table reports test in differences in means and medians of variables between fixed-price offers and
bookbuilding offers. All variables are defined in Appendix A. ** and * denote the significance level of
5% and 10%, respectively.
Fixed price offers Bookbuilding Test
No. Mean Median No. Mean Median t z
A. Short-term initial return and long-run performance measures
IR (%) 154 8.95 5.61 322 44.92 27.72 -8.73** -8.52**
AR (%) 154 26.63 6.53 322 49.28 29.00 -1.95* -7.48**
Undermatch (%) 154 -32.60 -43.41 322 -9.43 -31.93 -3.93** -3.07**
Overmatch (%) 154 41.51 52.63 322 54.97 62.36 -1.98** -2.78**
WR1 154 0.950 0.832 322 1.3341 1.125 -6.20** -7.28**
WR2 154 0.957 0.740 321 1.366 1.057 -3.91** -5.86**
WR3 154 1.304 0.816 295 1.317 1.007 -0.07 -3.03**
WR4 154 1.262 0.774 182 1.199 0.906 0.32 -1.33
WR5 154 1.141 0.730 151 1.243 0.916 -0.63 -1.99**
B. Underpricing and overvaluation of Pre-IPO market
OVPlot-OP (%) 151 15.23 14.58 314 46.55 34.82 -10.54** -9.74**
OVPlot-IP (%) 151 6.39 6.67 314 1.81 7.44 1.87* -0.40
OVPlot-match (%) 151 47.60 56.84 314 56.40 70.18 -1.37 -2.73**
Plot /E 147 21.19 16.97 305 33.81 16.99 -2.077** -0.115
Plot /B 151 2.877 2.520 313 4.074 2.740 -4.460** -1.833*
C. Underwriting and firm’s characteristics
DGTSM 154 0.86 1.00 322 0.70 1.00 4.08** -3.67**
Electronics 154 0.75 1.00 322 0.76 1.00 -0.41 -0.41
Dbig-4 154 0.69 1.00 322 0.86 1.00 -4.08** -4.42**
Dunderwriter 154 1.00 1.00 322 0.78 1.00 9.53** -6.31**
OQ 154 15.10 14.90 322 15.63 15.51 -7.62** -8.50**
Lottery (%) 154 32.23 6.83 313 9.56 2.56 6.52** 7.60**
Duration 154 29.92 29.00 322 15.49 13.00 30.60** 16.13**
OP 154 38.61 31.50 322 49.85 33.00 -3.10** -1.29
Age 154 14.35 12.57 322 14.03 11.70 0.36 -0.90
Size 154 18.36 18.20 322 18.88 18.68 -5.47** -6.52**
Dir_share (%) 154 35.43 31.84 322 33.67 28.29 1.11 -2.54**
Lev 154 36.50 34.45 322 35.51 34.91 0.67 -0.03
EPS 154 3.12 2.60 322 4.04 3.09 -3.06** -2.59**
Vol 154 3787.3 1552.5 322 4155.4 2503.5 -0.48 -4.94**
D. Pre-IPO trading
Vol-1 151 128.5 18.0 314 398.5 172.5 -4.94** -10.85**
Vollot 151 39.7 4.0 314 246.1 119.5 -7.88** -13.21**
Vol-1to -5 151 96.0 18.2 314 438.8 158.2 -2.39** -11.78**
Vol-1to-10 151 88.8 16.7 314 1974 138.4 -0.77 -11.93**
Avg_Vol 151 41.9 10.9 313 197.6 88.8 -5.92** -12.54**
Avg_Ret 146 0.924 0.646 313 0.302 0.174 3.89** 5.11**

38
Table 4: The Impact of Underwriting Procedure and Pre-IPO Trading Volume
on Short-term Performance
This table reports the regression of IPO short-term performance on underwriting procedure (Panel A)
and the regression of short-term performance on pre-IPO market trading (Panel B), where short-term
performance is alternatively measured by initial return (IR), market-adjusted initial return (AR),
underpricing of offer price with respect to the matching firm (Undermatch), and overreaction of initial
closing price with respect to the matching firm (Overmatch). All variables are defined in Appendix A.
In each regression, the regression coefficient and t-statistics are reported accordingly. ** and * denote
the significance level of 5% and 10%, respectively.
A. The impact of underwriting procedure
IR AR Undermatch Overmatch
B t B t B t B t VIF
Constant 1.878 2.73** 1.649 1.12 -3.077 -3.61** 5.116 5.11**
Dbookbuilding 0.075 1.70* 0.110 1.16 0.131 2.39** -0.062 -0.96 2.668
DGTSM 0.004 0.05 0.033 0.20 0.169 1.80* -0.169 -1.53 1.695
Electronics -0.064 -1.00 0.026 0.19 0.047 0.59 -0.098 -1.05 1.175
Dbig-4 0.026 0.39 -0.020 -0.14 -0.095 -1.16 0.130 1.36 1.070
Dunderwriter 0.081 1.05 0.171 1.03 -0.050 -0.52 0.153 1.36 1.191
Lottery -0.003 -3.55** -0.006 -3.29** 0.000 0.12 -0.003 -2.52** 1.257
Age -0.006 -2.16** 0.011 1.68* 0.001 0.17 -0.007 -1.72* 1.163
Size -0.078 -2.11** -0.091 -1.15 0.145 3.18* -0.231 -4.30** 2.162
Duration -0.014 -2.79** 0.002 0.18 0.003 0.42 -0.018 -2.53** 2.872
Dir_share 0.002 1.37 0.004 1.14 -0.002 -0.97 0.004 1.97** 1.150
Lev 0.002 1.11 -0.002 -0.62 -0.000 -0.09 0.002 0.75 1.277
EPS -0.008 -1.06 -0.020 -1.21 -0.042 -4.33** 0.034 3.00** 1.071
N 467 467 467 467
Adj. R2 0.133 0.025 0.065 0.094
F 6.976** 1.998** 3.708** 5.049**
B. The impact of pre-IPO trading volume and Plot/B
IR AR Undermatch Overmatch
B t B t B T B t VIF
Constant 2.527 3.55** 3.387 2.07** -2.375 -2.48** 4.932 4.78**
Dbookbuilding 0.038 0.44 -0.014 -0.07 0.269 2.31** -0.241 -1.92* 3.056
Vollot 0.112 6.66** 0.214 5.52** -0.023 -1.00 0.129 5.27** 2.331
Plot/B 0.045 6.01** 0.049 2.81** -0.047 -4.61** 0.091 8.31** 1.358
DGTSM 0.063 0.89 0.107 0.65 0.122 1.27 -0.063 -0.61 1.669
Electronics -0.058 -0.99 0.009 0.07 0.037 0.47 -0.084 -0.98 1.181
Dbig-4 -0.045 -0.74 -0.112 -0.80 -0.047 -0.58 0.019 0.21 1.086
Dunderwriter 0.096 1.36 0.210 1.29 -0.058 -0.61 0.177 1.72* 1.204
Lottery (%) -0.002 -2.65** -0.005 -2.43** 0.000 -0.32 -0.002 -1.54 1.286
Age -0.003 -1.07 0.015 2.34** -0.002 -0.60 -0.001 -0.31 1.180

39
Size -0.148 -3.76** -0.247 -2.73** 0.131 2.48** -0.278 -4.88** 2.466
Duration -0.003 -0.51 0.020 1.75* -0.002 -0.30 -0.003 -0.40 3.349
Dir_share (%) 0.000 0.30 0.003 0.82 -0.001 -0.53 0.002 0.98 1.121
Lev 0.003 1.62 0.000 -0.09 0.000 -0.03 0.003 1.02 1.263
EPS -0.021 -2.71** -0.031 -1.72* -0.025 -2.34** 0.004 0.34 1.274
N 455 455 455 455
Adj. R2 0.27 0.102 0.104 0.258
F 13.011** 4.674** 4.771** 12.296**

40
Table 5: The Impact of Underwriting Procedure, Pre-IPO market Underpricing,
and Pre-IPO market Overvaluation on Long-run Performance
This table reports the regression of IPO long-run performance (wealth relative measures defined in
reference to Ritter (1991)) on underwriting procedure (Panel A) and the regression of long-run
performance on pre-IPO market overvaluations guagued with repect to offer price (OVPlot-OP), the
matched firms (OVPlot-match), and the initial closing price (OVPlot-IP) (Panel B). All variables are
defined in Appendix A. In each regression, the regression coefficient and t-statistics are reported
accordingly. ** and * denote the significance level of 5% and 10%, respectively.
A. The Impact of underwriting procedure
WR1 WR2 WR3 WR4 WR5
B t B t B t B t B t VIF
Constant 0.393 0.60 0.687 0.78 2.759 2.61** 3.029 2.23** 2.866 1.84*
Dbookbuilding 0.137 3.23** 0.212 3.73** 0.021 0.31 -0.03
6
-0.48 0.426 2.58** 2.77
6 DGTSM 0.048 0.66 -0.02
4
-0.25
1
-0.14
6
-1.280 -0.22
6
-1.44 -0.23
5
-1.29 1.66
4 Electronics -0.06
8
-1.12
6
-0.07
4
-0.91
4
-0.12
4
-1.301 -0.33
0
-2.51*
*
-0.52
1
-3.47** 1.17
2 Dbig-4 0.028 0.45 0.107 1.28 0.226 2.35** 0.210 1.70* 0.174 1.24 1.07
3 Dunderwriter 0.028 0.39 0.081 0.83 0.073 0.60 0.245 0.89 0.219 0.52 1.19
4 Lottery (%) -0.00
0
-0.16
3
-0.00
1
-0.55
8
-0.00
1
-1.067 -0.00
3
-1.71* -0.00
2
-1.32 1.25
6 Age 0.002 0.80 0.006 1.521 0.001 0.30 0.012 1.85 0.017 2.34** 1.15
9 Size -0.02
8
-0.80
4
-0.07
2
-1.54
2
-0.14
2
-2.53*
*
-0.14
6
-2.02*
*
-0.18
6
-2.29** 2.08
2 Duration -0.00
7
-1.37
8
-0.00
1
-0.11
8
-0.01
7
-2.32*
*
-0.02
2
-2.46*
*
0.004 0.35 3.01
9 Dir_share
(%)) (%)
-0.00
0
-0.13
4
0.002 1.10 0.004 1.73* 0.006 2.05** 0.008 2.10** 1.11
8 Lev -0.00
1
-0.64
3
-0.00
2
-0.92
6
0.000 0.12 -0.00
6
-1.48 -0.00
4
-0.91 1.25
0 EPS -0.00
6
-0.85
4
-0.00
5
-0.45
6
-0.01
3
-1.10 -0.01
1
-0.68 -0.01
0
-0.56 1.09
0 N 467 466 440 327 296
Adj. R2 0.087 0.072 0.060 0.094 0.096
F 4.714** 4.023** 3.345** 3.822** 3.675**
B. The impact of pre-IPO market underpricing and pre-IPO market overvaluation
WR1 WR2 WR3 WR4 WR5
B t B t B t B t B t VIF
Constant -0.091 -0.13 0.781 0.82 2.910 2.60** 3.300 2.31** 3.780 2.32**
Dbookbuilding 0.264 3.05** 0.432 3.67** 0.027 0.20 -0.134 -0.87 0.344 2.01** 2.960
OVPlot-OP 0.209 2.91** 0.106 1.08 0.156 1.36 0.188 1.24 0.184 1.04 1.681
OVPlot-match 0.035 0.98 -0.006 -0.13 -0.093 -1.60 -0.198 -2.43** -0.349 -3.00** 1.341
OVPlot-IP -0.221 -2.62** -0.293 -2.55** -0.318 -2.38** -0.490 -2.76** -0.419 -2.03** 1.114
DGTSM 0.044 0.61 -0.045 -0.45 -0.172 -1.48 -0.241 -1.51 -0.265 -1.43 1.670
Electronics -0.047 -0.78 -0.063 -0.78 -0.124 -1.29 -0.350 -2.62** -0.555 -3.64** 1.177
Dbig-4 0.014 0.22 0.099 1.18 0.228 2.35** 0.229 1.85* 0.234 1.66* 1.084
Dunderwriter -0.004 -0.05 0.052 0.54 0.047 0.39 0.253 0.93 0.374 0.89 1.204
Lottery (%) 0.001 0.65 0.000 -0.26 -0.001 -0.91 -0.003 -1.67* -0.003 -1.54 1.337
Age 0.003 1.21 0.007 1.77* 0.002 0.46 0.013 1.96* 0.015 2.05** 1.150

41
Size -0.002 -0.05 -0.068 -1.35 -0.150 -2.53** -0.162 -2.16** -0.229 -2.72** 2.115
Duration -0.002 -0.32 0.003 0.43 -0.015 -1.85* -0.022 -2.25** -0.002 -0.17 3.335
Dir_share (%) -0.001 -0.91 0.001 0.59 0.004 1.61 0.008 2.37** 0.010 2.52** 1.086
Lev -0.002 -0.98 -0.003 -1.23 0.000 -0.15 -0.006 -1.69* -0.005 -1.11 1.241
EPS -0.006 -0.85 -0.002 -0.17 -0.006 -0.50 0.004 0.23 0.007 0.39 1.118
N 456 455 431 319 289
Adj. R2 0.133 0.088 0.073 0.129 0.142
F 5.644** 3.938** 3.264** 4.143** 4.171**

42
Table 6: The Impact of Pre-IPO market Trading, Underpricing and
Overvaluation on Short-term and Long-term Performance:Fixed price offers
This table reports the regressions for fixed-price offers. Panel A reports the regressions of short-term
performance measures on pre-IPO market trading volume and price-to-book ratio. Panel B reports the
regressions of long-run performance measures on pre-IPO market underpricing and overvaluation.
All variables are defined in Appendix A. In each regression, the regression coefficient and t-statistics
are reported accordingly. ** and * denote the significance level of 5% and 10%, respectively.
A. The impact of pre-IPO trading volume and Plot/B on short-term performance
IR AR Undermatch Overmatch
B t B t B T B t VIF
Constant 0.681 1.36 0.933 0.26 -4.094 -3.67** 4.974 4.39**
Vollot 0.037 3.44** 0.213 2.70** -0.077 -3.16** 0.109 4.40** 1.399
Plot/B -0.001 -0.07 0.050 0.45 -0.015 -0.44 0.028 0.80 2.116
DGTSM -0.028 -0.47 0.179 0.42 0.070 0.53 -0.124 -0.93 1.629
Electronics -0.014 -0.36 0.100 0.36 0.164 1.93* -0.138 -1.60 1.115
Dbig-4 0.006 0.17 -0.067 -0.26 -0.105 -1.32 0.138 1.72* 1.109
Lottery (%) -0.002 -4.73** -0.003 -1.07 -0.001 -0.94 -0.001 -0.99 1.154
Age 0.000 0.00 0.055 3.47** 0.010 2.00** -0.009 -1.92* 1.232
Size -0.044 -1.66* -0.129 -0.67 0.211 3.58** -0.270 -4.52** 2.218
Duration 0.007 1.84* 0.015 0.51 0.002 0.23 0.005 0.57 1.074
Dir_share (%) 0.001 1.05 0.007 0.84 -0.002 -0.75 0.004 1.34 1.136
Lev 0.000 -0.30 -0.005 -0.60 0.002 0.61 -0.001 -0.49 1.449
EPS -0.005 -0.61 -0.061 -1.01 -0.061 -3.27** 0.052 2.77** 2.000
N 151 151 151 151
Adj. R2 0.186 0.103 0.226 0.296
F 3.848** 2.431** 4.648** 6.253**
B. The impact of pre-IPO market underpricing and overvaluation on long-term performance
WR1 WR2 WR3 WR4 WR5
B t B t B t B t B t VIF
Constant 2.617 2.10** 3.625 1.99** 5.497 2.46** 6.672 2.84** 6.040 2.25**
OVPlot-OP 0.431 1.28 0.192 0.39 0.888 1.47 0.752 1.18 0.877 1.21 1.509
OVPlot-match -0.119 -1.24 -0.075 -0.54 -0.410 -2.40** -0.630 -3.49** -0.555 -2.69** 1.636
OVPlot-IP -0.724 -3.21** -1.022 -3.11** -1.477 -3.65** -1.136 -2.67** -1.050 -2.16** 1.454
DGTSM -0.077 -0.52 -0.276 -1.29 -0.268 -1.01 -0.531 -1.91* -0.405 -1.27 1.568
Electronics -0.138 -1.39 -0.041 -0.28 -0.175 -0.98 -0.350 -1.87* -0.667 -3.12** 1.153
Dbig-4 0.055 0.60 0.211 1.59 0.427 2.61** 0.424 2.46** 0.388 1.97* 1.138
Lottery (%) 0.000 0.38 -0.001 -0.49 -0.002 -0.67 -0.002 -0.94 -0.001 -0.51 1.678
Age 0.008 1.38 0.014 1.76* 0.001 0.06 0.006 0.59 0.011 0.92 1.247
Size -0.116 -1.83* -0.189 -2.05** -0.279 -2.46** -0.297 -2.50** -0.280 -2.05** 2.488
Duration -0.026 -2.53** -0.030 -2.01** -0.036 -1.96* -0.047 -2.42** -0.035 -1.59 1.137
Dir_share (%) 0.003 1.00 0.005 1.08 0.012 2.29** 0.011 1.97* 0.010 1.48 1.080
Lev 0.001 0.41 0.005 1.15 0.004 0.64 -0.000 -0.01 -0.002 -0.34 1.470
EPS -0.003 -0.17 0.022 0.86 0.045 1.44 0.053 1.62 0.045 1.20 1.407
N 151 151 151 151 151
Adj. R2 0.98 0.082 0.15 0.174 0.14
F 20247** 2.033** 3.041** 3.431** 2.653**

43
Table 7: The Impact of Pre-IPO market Trading, Underpricing and
Overvaluation on Short-term and Long-term Performance:Bookbuilding offers
This table reports the regressions for bookbuilding offers. Panel A reports the regressions of
short-term performance measures on pre-IPO market trading volume and price-to-book ratio. Panel B
reports the regressions of long-run performance measures on pre-IPO market underpricing and
overvaluation. All variables are defined in Appendix A. In each regression, the regression coefficient
and t-statistics are reported accordingly. ** and * denote the significance level of 5% and 10%,
respectively.
A. The impact of pre-IPO trading volume and Plot/B on short-term performance
IR AR Undermatch Overmatch
B t B t B T B t VIF
Constant 3.260 3.14** 4.840 2.78** -1.324 -0.98 4.473 3.07**
Vollot 0.154 6.09** 0.196 4.61** 0.005 0.15 0.143 4.02** 1.491
Plot/B 0.045 4.91** 0.043 2.83** -0.051 -4.33** 0.094 7.33** 1.334
DGTSM 0.080 0.81 -0.009 -0.06 0.106 0.84 -0.014 -0.10 1.732
Electronics -0.081 -0.91 0.000 0.00 -0.055 -0.47 -0.027 -0.22 1.297
Dbig-4 -0.098 -0.99 -0.094 -0.56 0.043 0.34 -0.139 -0.99 1.070
Dunderwriter 0.124 1.46 0.166 1.17 -0.043 -0.39 0.196 1.64 1.133
Lottery (%) -0.003 -1.98** -0.007 -2.23** 0.001 0.49 -0.005 -1.90* 1.299
Age -0.004 -0.90 0.001 0.09 -0.006 -1.19 0.002 0.34 1.200
Size -0.195 -3.40** -0.306 -3.17** 0.087 1.16 -0.272 -3.37** 2.413
Duration -0.001 -0.10 0.025 2.05** -0.003 -0.29 -0.001 -0.14 1.470
Dir_share (%) 0.000 0.12 0.001 0.19 -0.001 -0.33 0.002 0.61 1.145
Lev 0.004 1.67* 0.001 0.36 -0.001 -0.44 0.005 1.40 1.217
EPS -0.023 -2.27** -0.027 -1.56 -0.016 -1.22 -0.007 -0.47 1.235
N 304 304 304 304
Adj. R2 0.229 0.11 0.065 0.258
F 7.923** 3.867** 2.630** 9.091**
B. The impact of pre-IPO market underpricing and overvaluation on long-term performance
WR1 WR2 WR3 WR4 WR5
B t B t B t B t B t VIF
Constant -0.584 -0.67 0.875 0.76 2.608 2.05** 2.755 1.50 4.797 2.34**
OVPlot-OP 0.239 3.15** 0.163 1.62 0.190 1.71* 0.131 0.81 0.195 1.03 1.606
OVPlot-match 0.062 1.62 0.010 0.20 -0.038 -0.67 -0.062 -0.70 -0.220 -1.61 1.362
OVPlot-IP -0.126 -1.37 -0.159 -1.30 -0.118 -0.88 -0.375 -1.93* -0.265 -1.20 1.165
DGTSM 0.055 0.66 -0.018 -0.16 -0.146 -1.18 -0.119 -0.62 -0.250 -1.12 1.731
Electronics -0.018 -0.24 -0.070 -0.70 -0.121 -1.07 -0.347 -1.76* -0.295 -1.28 1.275
Dbig-4 0.051 0.60 0.066 0.58 0.127 1.04 0.020 0.11 -0.096 -0.44 1.069
Dunderwriter -0.040 -0.55 0.032 0.33 0.036 0.32 0.261 0.99 0.202 0.52 1.128
Lottery (%) 0.001 0.63 0.002 0.99 0.002 1.08 -0.002 -0.66 -0.003 -1.17 1.339
Age 0.001 0.17 0.003 0.62 -0.001 -0.23 0.014 1.62 0.018 1.86* 1.170
Size 0.035 0.77 -0.045 -0.75 -0.121 -1.79* -0.127 -1.30 -0.27 -2.50** 2.089
Duration 0.006 0.91 0.008 1.06 -0.015 -1.75* -0.018 -1.55 0.011 0.88 1.430

44
Dir_share (%) -0.003 -1.74* -0.000 -0.17 0.000 0.13 0.005 1.19 0.010 2.17** 1.102
Lev -0.002 -1.05 -0.005 -1.71* -0.000 -0.13 -0.010 -2.10** -0.004 -0.73 1.204
EPS -0.008 -0.93 -0.010 -0.85 -0.021 -1.63 -0.015 -0.81 -0.010 -0.50 1.086
N 305 304 280 168 138
Adj. R2 0.064 0.014 0.035 0.109 0.103
F 2.481** 1.299 1.718* 2.453** 2.163**
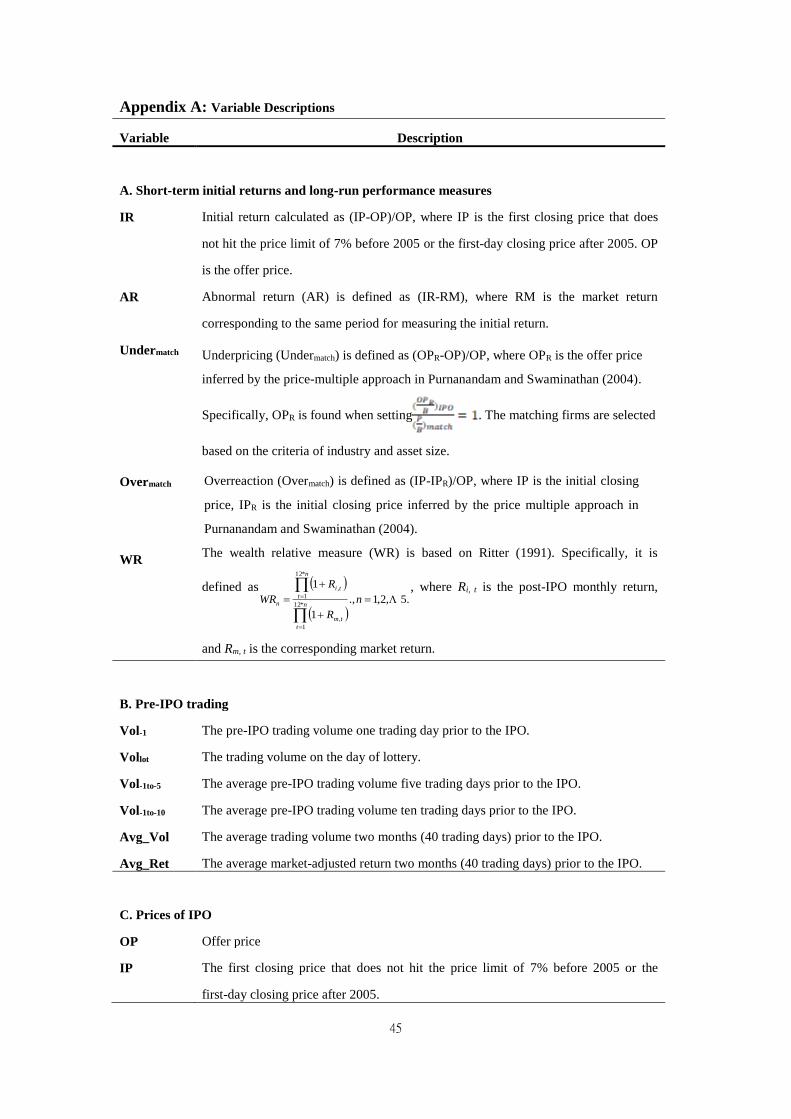
45
Appendix A: Variable Descriptions
Variable Description
A. Short-term initial returns and long-run performance measures
IR Initial return calculated as (IP-OP)/OP, where IP is the first closing price that does
not hit the price limit of 7% before 2005 or the first-day closing price after 2005. OP
is the offer price.
AR Abnormal return (AR) is defined as (IR-RM), where RM is the market return
corresponding to the same period for measuring the initial return.
Undermatch Underpricing (Undermatch) is defined as (OPR-OP)/OP, where OPR is the offer price
inferred by the price-multiple approach in Purnanandam and Swaminathan (2004).
Specifically, OPR is found when setting . The matching firms are selected
based on the criteria of industry and asset size.
Overmatch Overreaction (Overmatch) is defined as (IP-IPR)/OP, where IP is the initial closing
price, IPR is the initial closing price inferred by the price multiple approach in
Purnanandam and Swaminathan (2004).
WR The wealth relative measure (WR) is based on Ritter (1991). Specifically, it is
defined as
.5,2,1.,
1
1
*12
1
,
*12
1
,
n
R
R
WRn
t
tm
n
t
ti
n
, where Ri, t is the post-IPO monthly return,
and Rm, t is the corresponding market return.
B. Pre-IPO trading
Vol-1 The pre-IPO trading volume one trading day prior to the IPO.
Vollot The trading volume on the day of lottery.
Vol-1to-5 The average pre-IPO trading volume five trading days prior to the IPO.
Vol-1to-10 The average pre-IPO trading volume ten trading days prior to the IPO.
Avg_Vol The average trading volume two months (40 trading days) prior to the IPO.
Avg_Ret The average market-adjusted return two months (40 trading days) prior to the IPO.
C. Prices of IPO
OP Offer price
IP The first closing price that does not hit the price limit of 7% before 2005 or the
first-day closing price after 2005.

46
IPR, OPR IPR (OPR) is the initial (offer) price inferred by the price multiple approach in
Purnanandam and Swaminathan (2004). Specifically, IPR (OPR) is found when
setting . The matching firms are selected based on the criteria of
industry and asset size.
P-1 P-1 is the last pre-IPO closing price or the market price one day prior to the IPO.
Plot Plot is the pre-IPO market closing price on the IPO lottery day.
AvgP The average closing price in the pre-IPO market over the two months (40 trading
days) prior to the IPO.
MidP The middle price of the price range for bookbuilding offers.
D. Overvaluation, underpricing and overreaction of Pre-IPO market
OVPlot-OP Underpricing compared to the pre-IPO market closing price on the IPO lottery day,
measured by (Plot-OP)/OP
OVPlot-IP Overpricing of the pre-IPO market price, (Plot – IP)/OP), being defined as the
difference between pre-IPO market price and the initial closing price divided by the
offer price.
OVPlot-match Overpricing of the pre-IPO market price, ( (Plot – OPR)/OP), being defined as
difference between the pre-IPO market closing price on the IPO lottery day (Plot) and
intrinsic offer price (OPR) divided by the offer price (OP), where the intrinsic offer
price is estimated by the price multiple approach in in Purnanandam and
Swaminathan (2004).
UnderAvgP Underpricing with respect to the average price during the two-month period of
pre-IPO trading, measured by (AvgP- OP)/OP
OverAvgP Overraction with respect to the average price during the two-month period of
pre-IPO trading, measured by (IP - AvgP)/OP
Undermid-OP Underpricing with respect to the middle price of bookbuilding, measured by (MidP –
OP)/OP
OverMidP Overreaction with respect to the middle price of bookbuilding, measured by (IP –
MidP)/OP
Plot /E The pre-IPO market closing price on the IPO lottery day divided by the earnings per
share in the lastest 4 months;
Plot /B The pre-IPO market closing price on the IPO lottery day divided by the book value.

47
E. Underwritting and firm’s characteristics
DGTSM A dummy variable set equal to one when the IPO is traded in GTSM, and zero when
it is traded in TWSE.
Delectronic A dummy variable set equal to one when the IPO firm is in the electronics industry,
and zero otherwise.
Dbig-4 A dummy variable set equal to one when the associated auditing firm is one of the
big-4 auditing firms in Taiwan (KPMG, Deloitte, Diwan, and PwC), and zero
otherwise.
Dunderwriter A dummy variable set equal to one when the lead underwriter’s market share,
measured by the sum of the underwriting proceeds two years prior to the IPO year,
exceeds the median, and zero otherwise.
OQ The natural logarithm of the number of shares underwritten
Lottery The number of shares put for IPO lottery divided by the number of subscribed shares
(%), capped at 100%.
Age The number of years since firm’s inception.
Size The natural logarithm of firm’s assets one year prior to the IPO.
Duration The number of days from IPO announcement to listing.
Dir_Share Directors’ shareholding measured by the total shareholding of directors and
supervisors one year prior to the IPO.
Lev Leverage measured by the debt-equity ratio in the year of IPO.
EPS The earnings per share in the year of IPO.
Dbookbuilding A dummy variable set equal to one for bookbuilding offers, and zero otherwise.
Vol The trading volume on the first trading day in terms of one thousand shares (one
round lot).