pre-feasibility study biomass power plant fort bragg, mendocino
TRANSCRIPT

Pre-feasibility Study Biomass Power Plant
Fort Bragg, Mendocino County, California
North Coast Resource Conservation & Development Council2448 Guerneville Road, Suite 100
Santa Rosa, California 95403707 569 9710 707 569 9746 fax
August 29, 2007

ACKNOWLEDGEMENTS
Funding provided by the USDA-Natural Resources Conservation Service
“All programs and assistance of the RC&D Council are available without regard to race, color, nation-al origin, gender, religion, age, disability, political beliefs, sexual orientation, and marital or family status. Persons with disabilities who require alternative means for communication of program infor-mation (Braille, large print, au¬diotape, etc.) should contact the USDA’s TARGET Center at (202) 720-2600 (voice and TDD). To file a com¬plaint of discrimination, write USDA Director, Office of Civil Rights, Room 326W, Whitten Building, 14th and Independence Avenue SW, Washington, DC 20250-9410, or call (202) 720-5964 (voice and TDD). USDA is an equal opportunity provider and employer.”
Research and principal authorship of this report provided by Phillip Giles, Natural Resources Conservation Ser-vices Coordinator for the North Coast Resource Conservation & Development Council, a 501(c)(3) Non-Profi t Organization
Desktop publishing courtesy NRCS
Images courtesy of Timberjack, Lonnie Ingram, Susan Warner
Graphics courtesy of Northern California Power Agency (NCPA), TSS Consultants, California Energy Commis-sion, McNeil Technologies, Inc., Timberjack, National Renewable Energy Laboratory

DISCLAIMERS
This report was prepared with the best information available regarding the current trends in biomass power gen-eration and information applicable to Mendocino, California. Neither the North Coast Resource Conserva¬tion and Development Council nor any other party make any warranty, express or implied, or assumes any legal liability or responsibility for the accuracy, completeness or usefulness of any information, apparatus, product, or process disclosed, or represents that its use would not infringe on privately owned rights. Reference herein to any specific product, process, or service by trade name, trademark, manufacturer or otherwise does not neces¬sarily constitute or imply its endorsement, recommendation or favoring by the North Coast Resource Conservation and Development Council. The views and opinions of the authors expressed herein do not neces-sarily state or reflect those of the North Coast Resource Conservation and Development Council.

Acknowledgements Mr. Jere Melo, City of Fort Bragg, CaliforniaMr. Craig Blencowe, Mendocino Resource Conservation DistrictGeorgia-Pacifi c CorporationMendocino County GovernmentMr. Gerald Willis, USDA-NRCS

Table of Contents
I Executive Summary 1II Introduction 1
III Background 2IV Location 3V Biomass Fuel Characteristics 3
VI Fuel availability 3VII Potential additional fuels 4
VIII Fuel Costs 5IX Cost of Electricty from Biomass 6X Value of Biomass Power 10
Economic Impacts 10Environmental Impacts 10Watershed Impacts 10Air Quality Impacts 10
XI External assistance, supports and subsidies 11XII Utility Green Pricing Programs 13
XIII Emerging biomass technologies 13XIV Conclusions 15XV Recommendations 15
List of TablesTable 1 Annual Woody Biomass Fuel Potentially Available 4Table 2 Potential Mendocino County forest derived biomass 4Table 3 Collection/Processing/Transport Costs and Market Values 5Table 4 Renewable Energy Grants and Loan Guarantees 12Table 5 Renewable Electricity Production Tax Credit 12Table 6 Pyrolysis Oil cost vs. other fuels 14
List of FiguresFigure 1 California Average Electric Rates 2Figure 2 Cost of biomass electricity as a function of biomass fuel cost. 5Figure 3 Estimated overall statewide biomass resource cost curve. 6Figure 4 Biomass bundling 7Figure 5 Commercial biomass power plant 7Figure 6 10MW Steam Turbine Generation Costs vs. Biomass Cost 8Figure 7 15MW Steam Turbine Generation Costs vs. Biomass Cost 8Figure 8 10MW Internal Combustion Engine Generation Costs vs. Biomass Cost 9Figure 9 15MW Internal Combustion Engine Generation Costs vs. Biomass Cost 9
Figure 10 Biomass to Energy Pathways 13Figure 11 Increased fuels due to Sudden Oak Death mortality. 12Figure 12 Wood chip useful as fuel and feedstock for other conversion technologies. 14Figure 13 Forest Residue Bundles 15

I. Executive Summary
Forest biomass represents a huge potential resource for energy production. Signifi cant amounts of current-ly un-merchantable biomass are available from forest resource management and wood products manufactur-ing in the region. Biomass energy producing facilities could provide a potential economic use for this mate-rial at a time when need exists for economic stimulus in rural communities and for reduced fuels loading in the forest. Information about the amount of biomass feedstock available and the cost of feedstock deliv-ered to the plant site is needed to encourage public understanding of the opportunity and private sector investment in biomass energy. This review surveys and compiles current studies regarding biomass-based electric production and specifi cally applies existing knowledge to a potential facility in Fort Bragg, Cali-fornia, where the City Council has expressed interest in the economic development potential of a possible biomass power installation.
This review will present information on biomass fuel characteristics, fuel costs, energy value, potential impacts, and possible incentives. Potential biomass fuels in the area vary in quality, particular moisture content which affects the energy produced per ton of dry weight. The available amounts of biomass are estimated to be able to fuel a 4.5 MW to 9.5 MW facil-ity, with possibilities for an even higher production facility if fuel supply is larger.
Increasing the extraction of fuels to reduce fi re fuel loading, enhance growth of commercial wood prod-ucts through enhanced thinning, and similar activities are some methods for increasing the availability of biomass for fuel.
Costs of electricity generated from biomass are dis-cussed, as well as issues that affect the value of bio-mass power. This paper touches on emerging biomass technologies. Finally, this report recommends:
• Developing additional clarity on the volume and delivery cost of available biomass near Fort Bragg.
• Conducting community education on the nature and role of biomass facilities.
• Encouraging subsidies to support biomass generation in rural lands.
1
II. Introduction
Biomass power generation is a proven, mature tech-nology and is the single largest source of non-hydro renewable electricity.1 About 9,733 megawatts (MW) capacity was installed in the United States in 2002. Biomass installations range from very small units of 5-10 kW capacity to large facilities 50 MW and larger in size. Commercial scale power is considered 10MW and larger.
The larger the plant, the greater the supply needed for available biomass. A typical 15 MW power plant would consume 8,000 bone dry tons (BDT) per year per MW, or 120,000 BDT total. It should be noted that by power plant standards a 15 MW facility is at the smallest possible end of the commercial spectrum. Ex-isting studies conservatively estimate that from a low of 36,600 BDT to a high of 76,720 BDT biomass fuel annually, is readily available in the immediate Fort Bragg region. This is enough fuel for a facility of from 4.5 MW to 9.5 MW respectively. The State of Cali-fornia Energy Commission estimates indicate around 286,912 BDT, or enough to fuel a 35 MW power plant, are potentially available in the Fort Bragg area. A dependable and readily available fuel supply of at least 120,000 BDT annually will be needed to attract capital investment in a commercial scale facility.
Biomass fuel from our forested areas comes from residues of non-commercial wood. Residues can be gathered during milling, logging, thinning, and other forest management activities. With a biomass plant, effi cient generation of forest residues is helpful for providing sustainable fuel supplies. For example, forest thinning in some countries, notably Finland, is more intense than thinning practices in the United States. In Finland, the trees are widely-spaced, yet the forests carry more usable wood per acre than here. The usable wood is concentrated in larger, higher quality trees since the Finnish countryside is regularly thinned--removing brush and weeds, culling weak trees, and making room for others to grow. If forest thinnings and residues were dedicated to power pro-duction, perhaps along the lines of Finnish experience, it is reasonable to conclude that a biomass facility of 10 MW to 15 MW could be sustained under favorable economic and social conditions.
Biomass electric production is an established tech-

nology with capital costs and production costs well understood. The levelized cost of electricity (COE) from a new biomass power plant generating only elec-tricity for sale lies in the range of $0.06 to 0.08/kWh. Installed capital costs range from $1500 to $3000/kWe. This estimate excludes return on equity (profi t), and assumes a relatively optimistic base fuel cost of $20/dry ton.
At the 15 MW scale, Steam Turbine Generation and Gasifi er with Internal Combustion Engine Generation both require biomass cost to drop to zero in order to get near the 6 cents/kWh range. By contrast, Califor-nia average wholesale price in 2006 was $47.55 per megawatt-hour, or 4.7 cents/kWh.2 (LA Times, 2007). Most biomass power generators in California are now operating under fi xed price contracts for $0.0537/kWh.3
In a 1999 study (Morris, 1999), a conservative analy-sis found the value of the environmental services associated with biomass energy production in the United States to be 11.4 cents/kWh. This value does not include the desirable benefi ts of rural employment, rural economic development, and energy diversity and security provided by biomass energy production. One could expect 5 to 6 direct jobs created per 1MW. Hence a 15 MW facility would create from 75 to 90 jobs. The combined economic and environmental ben-efi ts to a rural community certainly appear substantial.
Ownership and public subsidies matter. Public owner-ship of a utility reduces the need for profi t greater than breakeven costs. It is interesting to note that produc-tion costs, without profi t, are quite near power sales prices. Subsidies either to reduce capital cost, reduce biomass fuel cost or a “green power” surcharge will substantially tip the scales in favor of sustainable bio-mass generation facility located in Fort Bragg.
III. Background
Biomass power generation experienced dramatic growth in the U.S. after the Public Utilities Regula-tory Policy Act (PURPA) of 1978. PURPA guaranteed small electricity producers, of less than 80 MW, that utilities would purchase their surplus electricity at prices equal to the utilities’ avoided-cost of producing electricity. Prior to PURPA, electric generating plants could only be owned and operated by utilities.
Regulatory changes, low utility buyback rates, and industry restructuring coupled with business uncer-tainties, have reversed the early industry growth and a number of biomass power facilities have been closed in recent years. Under current low avoided-costs, few renewable energy sources are able to compete with new natural gas turbines. The nearly two decade period from 1980 to 1999 saw the number of operating biomass facilities in California decline by 28 plants. Fourteen plants were idled while another fourteen were dismantled. More recently, three additional plants were closed: two for fi nancial reasons and one because of fuel supply problems.4 From a high of 62 plants, only 26 plants currently operate in California.
2
Courtesy Northern California Power Agency (NCPA)
Figure 1 - California Average Electric Rates

IV. Location
Immediately to the east of Fort Bragg lies a parcel owned by Georgia-Pacifi c Corporation now used as a storage area for waste bark. This approximately 200 acre parcel has a gently rolling topography, and has been previously disturbed by excavation and burial of waste bark. The property lies within a few thousand feet of major electric transmission lines and has pri-vate road access. Second growth forest shields the site from noise transmission and direct view from major roads. More direct road access from the site to State Highway 20 might be created from Summers Road located to the South and West of the parcel. Initial esti-mates suggest construction costs for such a road exten-sion would be in the neighborhood of $2,000,000.
The parcel’s seclusion, existing private roads, ready access to electric transmission lines and history of industrial disturbance, all weigh positively in favor of the site’s potential development as a biomass power facility and/or associated industrial area. Co-location of additional industrial ventures that would generate either fuel supply or use excess heat would also add to the synergy of the location. For example, a mill or a waste transfer station could generate additional fuels. A lumber kiln or waste digester could utilize excess heat generated by biomass power generation.
V. Biomass Fuel Characteristics
A variety of conversion processes are used to con-vert biomass to either thermal energy, liquid, solid or gaseous fuels. These processes include thermal con-version via combustion or pyrolysis, chemical conver-sion, microbial conversion or fermentation, and physi-cal conversion to pellets or cubes, i.e. densifi ed fuels.
Electrical energy and heat generation is most com-monly accomplished through direct combustion of biomass in a boiler. In the combustion process, energy content, moisture content and chemical composition are the most important biomass characteristics affect-ing combustion processes.
The biomass gasifi cation process releases a gas that may be further combusted to generate electricity. In this process, biomass particle size, energy content, moisture content and volatiles are the predominate characteristics affecting the gasifi cation process.
Biomass fuel physical characteristics--such as particle size, density and moisture content--add important considerations for transportation and material han-dling. Nearly all biomass energy conversion processes will require some form of physical manipulation of the fuel. Commonly this includes sorting, storing, sizing, screening and moving the material from one location to another. Low bulk density materials occupy more space, hence costing more to deliver per unit of weight and increase feedstock costs.
Moisture content radically affects the quality of bio-mass fuel for combustion and gasifi cation processes. Materials with lower moisture content cost less to transport and can reduce the size of handling, pro-cessing and energy conversion equipment needed for biomass power because a smaller overall volume of feedstock is required.
In the following illustration we use the wet basis method to determine moisture content. By way of example, a two-pound piece of wood contains of one pound of wood biomass and one pound of water. Us-ing the wet basis method, the moisture content would be expressed as 50% that is, water is 50% of the total weight. The moisture content of freshly harvested for-est and crop residue typically varies from 40% to 60% by weight, and can be higher if exposed to precipita-tion.
The higher heating value (HHV) is the amount of us-able thermal energy that can be obtained from given volume of fuel while the lower heating value (LHV), by contrast, is equivalent to the HHV of the fuel minus the heat required to vaporize the liquid water of the fuel. When considered on a bone dry basis, “most biomass has about the same energy content (HHV) of 8,000 to 8,500 British thermal units per pound (Btu/lb).5
VI. Fuel availability
In 2006 TSS Consultants identifi ed between 91,500 and 191,800 bone dry tons of woody biomass poten-tially available in Mendocino County. This volume is enough biomass fuel to generate 10 MW to 24 MW electric power. Timber harvest and forest product residuals represented roughly 87 percent of the total
3
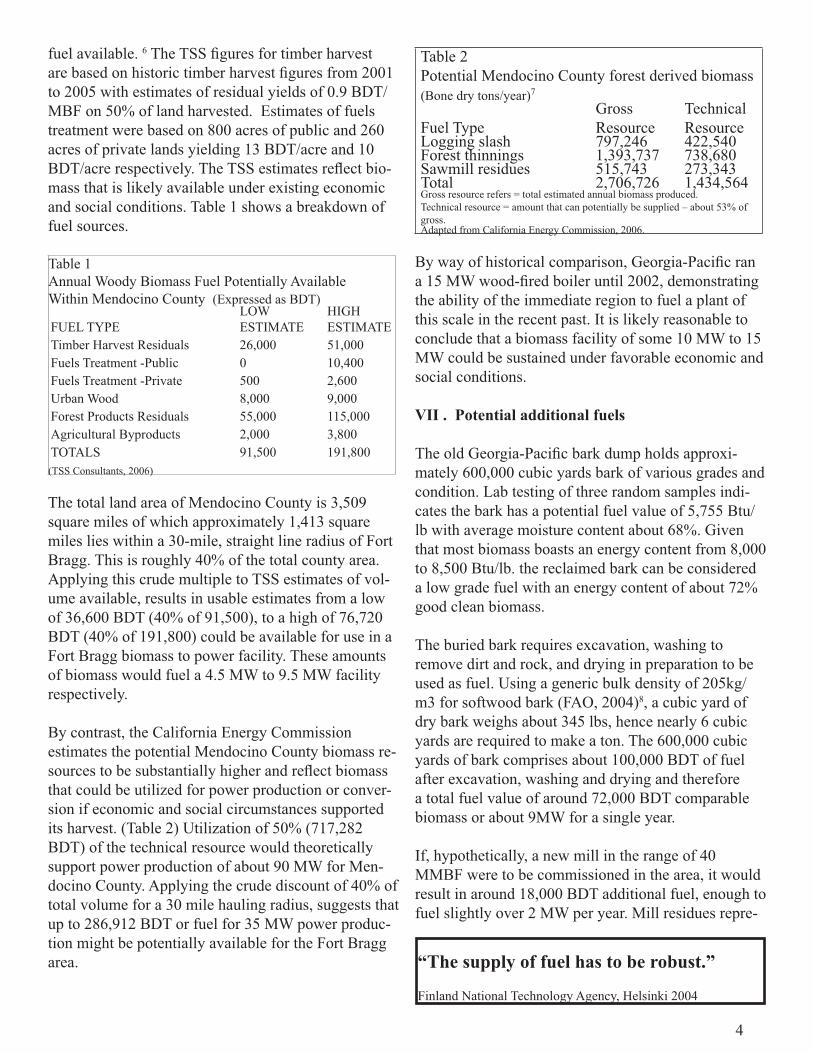
fuel available. 6 The TSS fi gures for timber harvest are based on historic timber harvest fi gures from 2001 to 2005 with estimates of residual yields of 0.9 BDT/MBF on 50% of land harvested. Estimates of fuels treatment were based on 800 acres of public and 260 acres of private lands yielding 13 BDT/acre and 10 BDT/acre respectively. The TSS estimates refl ect bio-mass that is likely available under existing economic and social conditions. Table 1 shows a breakdown of fuel sources.
Table 1Annual Woody Biomass Fuel Potentially AvailableWithin Mendocino County (Expressed as BDT)
FUEL TYPELOW ESTIMATE
HIGH ESTIMATE
Timber Harvest Residuals 26,000 51,000Fuels Treatment -Public 0 10,400Fuels Treatment -Private 500 2,600Urban Wood 8,000 9,000Forest Products Residuals 55,000 115,000Agricultural Byproducts 2,000 3,800TOTALS 91,500 191,800(TSS Consultants, 2006)
The total land area of Mendocino County is 3,509 square miles of which approximately 1,413 square miles lies within a 30-mile, straight line radius of Fort Bragg. This is roughly 40% of the total county area. Applying this crude multiple to TSS estimates of vol-ume available, results in usable estimates from a low of 36,600 BDT (40% of 91,500), to a high of 76,720 BDT (40% of 191,800) could be available for use in a Fort Bragg biomass to power facility. These amounts of biomass would fuel a 4.5 MW to 9.5 MW facility respectively.
By contrast, the California Energy Commission estimates the potential Mendocino County biomass re-sources to be substantially higher and refl ect biomass that could be utilized for power production or conver-sion if economic and social circumstances supported its harvest. (Table 2) Utilization of 50% (717,282 BDT) of the technical resource would theoretically support power production of about 90 MW for Men-docino County. Applying the crude discount of 40% of total volume for a 30 mile hauling radius, suggests that up to 286,912 BDT or fuel for 35 MW power produc-tion might be potentially available for the Fort Bragg area.
Table 2 Potential Mendocino County forest derived biomass (Bone dry tons/year)7
Fuel TypeGrossResource
Technical Resource
Logging slash 797,246 422,540Forest thinnings 1,393,737 738,680Sawmill residues 515,743 273,343Total 2,706,726 1,434,564Gross resource refers = total estimated annual biomass produced.Technical resource = amount that can potentially be supplied – about 53% of gross.Adapted from California Energy Commission, 2006.
By way of historical comparison, Georgia-Pacifi c ran a 15 MW wood-fi red boiler until 2002, demonstrating the ability of the immediate region to fuel a plant of this scale in the recent past. It is likely reasonable to conclude that a biomass facility of some 10 MW to 15 MW could be sustained under favorable economic and social conditions.
VII . Potential additional fuels
The old Georgia-Pacifi c bark dump holds approxi-mately 600,000 cubic yards bark of various grades and condition. Lab testing of three random samples indi-cates the bark has a potential fuel value of 5,755 Btu/lb with average moisture content about 68%. Given that most biomass boasts an energy content from 8,000 to 8,500 Btu/lb. the reclaimed bark can be considered a low grade fuel with an energy content of about 72% good clean biomass.
The buried bark requires excavation, washing to remove dirt and rock, and drying in preparation to be used as fuel. Using a generic bulk density of 205kg/m3 for softwood bark (FAO, 2004)8, a cubic yard of dry bark weighs about 345 lbs, hence nearly 6 cubic yards are required to make a ton. The 600,000 cubic yards of bark comprises about 100,000 BDT of fuel after excavation, washing and drying and therefore a total fuel value of around 72,000 BDT comparable biomass or about 9MW for a single year.
If, hypothetically, a new mill in the range of 40 MMBF were to be commissioned in the area, it would result in around 18,000 BDT additional fuel, enough to fuel slightly over 2 MW per year. Mill residues repre-
“The supply of fuel has to be robust.”
Finland National Technology Agency, Helsinki 2004
4
sent the least cost fuels for power production and one of the best options for decreasing overall fuel costs for a power plant. Historically, mills and small scale heat and power generation were commonly bound together – timber milling creating cheap fuels while simultane-ously requiring power and heat. The interrelationship today remains mutually supportive.
Additional fuels could also be had from more vigor-ous fuels reduction programs. TSS estimates a high of 13,000 BDT across Mendocino County – slightly more than 6% of the total high estimate of 191,800 BDT. This is based on 800 acres fuel reduction on public lands and 260 acres of private lands.
If subsidies for fuels reduction could be made avail-able, then the total contribution could increase. For ex-ample, in a tripling of acres of fuel reduction to 2,400 acres public and 780 acres private lands, a high range of 39,000 BDT, equivalent to about 5MW, might be obtained. However, this contribution of fuels for total biomass power fuel would likely be dependent upon a continuing public subsidy.
VIII. Fuel Costs
The cost of fuel is one of the primary constraints fac-ing biomass energy production. Each fuel type has an associated collection cost range. For any single facility fuel costs might range from zero to $60/BDT or even higher depending on the specifi c fuel resource. Higher fuel costs translate directly to more expensive electric-ity.
Fuel availability must also be ensured in all conditions regardless of season, weather, equipment failure, labor disputes or depression of forest products markets. In the case of forest fuels, providing a continual stream of fuel can be a diffi cult task, since the fuel is collect-ed from a number of harvesting operations, fuel stores tend to be small, and working conditions are unfavor-able during the wet seasons of the year.
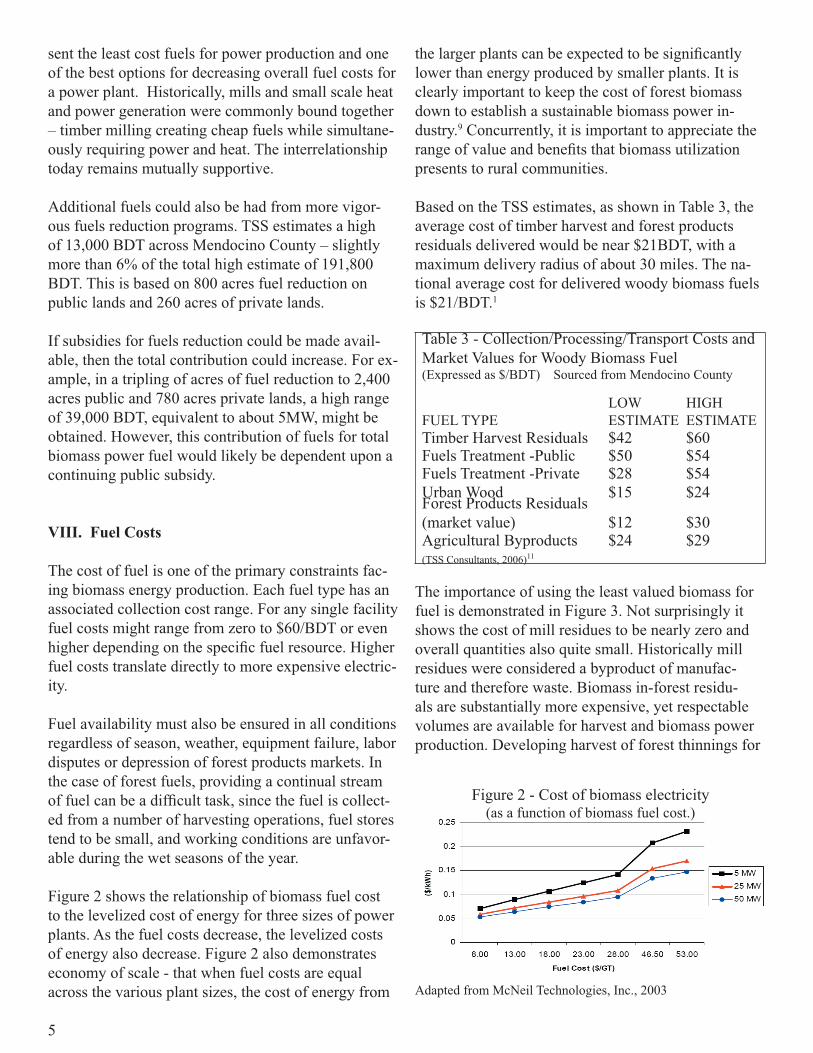
Figure 2 shows the relationship of biomass fuel cost to the levelized cost of energy for three sizes of power plants. As the fuel costs decrease, the levelized costs of energy also decrease. Figure 2 also demonstrates economy of scale - that when fuel costs are equal across the various plant sizes, the cost of energy from
the larger plants can be expected to be signifi cantly lower than energy produced by smaller plants. It is clearly important to keep the cost of forest biomass down to establish a sustainable biomass power in-dustry.9 Concurrently, it is important to appreciate the range of value and benefi ts that biomass utilization presents to rural communities.
Based on the TSS estimates, as shown in Table 3, the average cost of timber harvest and forest products residuals delivered would be near $21BDT, with a maximum delivery radius of about 30 miles. The na-tional average cost for delivered woody biomass fuels is $21/BDT.1
Table 3 - Collection/Processing/Transport Costs and Market Values for Woody Biomass Fuel (Expressed as $/BDT) Sourced from Mendocino County
FUEL TYPE LOWESTIMATE
HIGHESTIMATE
Timber Harvest Residuals $42 $60 Fuels Treatment -Public $50 $54 Fuels Treatment -Private $28 $54 Urban Wood $15 $24 Forest Products Residuals (market value) $12 $30 Agricultural Byproducts $24 $29 (TSS Consultants, 2006)11
The importance of using the least valued biomass for fuel is demonstrated in Figure 3. Not surprisingly it shows the cost of mill residues to be nearly zero and overall quantities also quite small. Historically mill residues were considered a byproduct of manufac-ture and therefore waste. Biomass in-forest residu-als are substantially more expensive, yet respectable volumes are available for harvest and biomass power production. Developing harvest of forest thinnings for
5
Figure 2 - Cost of biomass electricity(as a function of biomass fuel cost.)
Adapted from McNeil Technologies, Inc., 2003

biomass is critical for the sustainability of a biomass power industry. Currently the U.S. lags in this arena while several European countries have invested heav-ily in developing new technologies for biomass fuel extraction. For example in Finland, the forest sector has worked diligently to “appreciate forest fuels as a natural and relevant product of sustainable forestry.” Renewable energy has increasing status, and the pro-duction and use of forest chips are today acceptable and valued activities. Moreover one advantage of for-est chips is the favorable input/output ratio of energy is 1/3012. Thus, the entire energy content of fuel, rather than a fraction thereof, can be used for replacing fossil fuels.
In 1999, the Finland National Technology Agency “Tekes” Wood Energy Program investigated the devel-opment of large-scale procurement systems for forest chips. New advanced technology was developed and transferred into the private sector. In addition to utiliz-ing new transportation technique such as bundling, three new areas of forest fuel emerged resulting in substantial fuel quantity increases.
• Residue log technology – boasting fl exible logistics, reliability and cleanliness, the residue log system was preferred by forest owners, contractors and supervi-sors. However, at the moment this technology is only feasible in large-scale operations. The capacity of the 24 balers operating in Finland in early 2004 is suf-fi cient for processing a half of the logging residue recovery.
• Stationary crushers - made it possible to broaden the raw material base and receive solid biomass fuels
in almost any form, i.e. residue, logs, loose residues, un-delimbed tree-sections, stump and root wood, and recycled wood.
• Stump and root wood while not considered to be a realistic option for fuel production when fi rst consid-ered, stump and root wood rapidly became a preferred fuel at plants using a stationary crusher.13
In association with the Tekes program chip production technology and organizations developed rapidly. Dur-ing the fi ve-year period of the Tekes program, the use of forest chips quadrupled.
IX - Cost of Electricity from Biomass
The cost of generating electricity from biomass is well established by years of experience and numerous stud-ies. Economies of scale strongly suggest that commer-cial power production starts at 10 MW. Labor costs differ only nominally between a 10 MW and 15 MW plant. If fuel supplies are available, a 15 MW plant or larger is preferred.
Motivated by the catastrophic forest fi res during the summer of 2002 that hit the western United States as well as the increased frequency and severity of fi res over the past decade, the United States Department of Agriculture (USDA), the United States Department of Energy (DOE), and the National Renewable Energy Laboratory (NREL) commissioned the Antares Group, Inc., to perform an assessment of the use of forest thinnings to produce electric power. While there are many site-specifi c factors involved in developing a bio-power project, the 2003 study was intended to be the fi rst part of a feasibility study for a biomass power facility. Technologies evaluated include solid and gaseous co-fi ring, combined heat and power, steam and gas turbine cycles, reciprocating engines, and feed water re-powering.
The two primary biomass energy conversion technolo-gies are direct combustion and gasifi cation. For a Fort Bragg based bio-power project, steam turbines and reciprocating engines are the most appropriate power generation technologies. Graphical relationships be-tween capital costs, generation costs and biomass are reproduced in Figures 6 – 9.
6
Figure 3 - Estimated overall statewide biomass resource cost curve (excludes storage and on-site processing and handling costs)
Adapted from California Energy Commission, 2005, Biomass Resources in California, pg 44

Figure 4 - Biomass bundling
Bundling is a solution for boosting the large-scale use of forest biomass widely used in Finland. Courtesy Timberjack
Installed capital costs for commercial biomass installations range from 1.5 million to 3 million per megawatt.
Figure 5 – Commercial biomass power plant
Okeelanta biomass power plant near South Bay, Florida. Photo / Lonnie Ingram
The 2003 Antares study concluded:14
•Steam Turbine Distributed Generation appeared un-economical for the plant sizes and systems analyzed; the smallest commercial plant currently in operation is 18.5 MW.
•The lowest cost of electricity (COE) generated by the 10 MW and 15 MW steam plants are 7.4 and 6.1 cents/kWh, respectively.
·•The 15 MW Internal Combustion Engine—100% syngas scenario with low capital and zero feedstock, achieved a positive net present value (NPV) of $13.7 million for electricity sales at 7.0 cents/kWh. The Antares studies economic analysis demonstrates that bio-power has a diffi cult time competing on cost alone and like many other renewable energy sources, it would benefi t from some external assistance, support or subsidy.
Figures 6 to 9 graphically demonstrate the relation-ships between capital cost, fuel cost and cost of elec-tricity for the most appropriate technologies applicable for the lower end of commercial power production: steam turbine and biomass gasifi er using internal com-bustion engines as the prime mover. These are useful for quickly evaluating alternative scenarios involving biomass cost and production scale.
The 2003 Antares analysis is supported by data from the 2006, California Energy Commissions, “Biomass Resources Assessment in California” which reports;
“The cost of generating electricity from biomass depends on capital, fuel, and non-fuel operat-ing and maintenance expenses. Levelized cost of electricity (COE) from a new biomass power plant generating only electricity for sale lies in the range of $0.06 to 0.08/kWh for installed capital costs of $1500 to 3000/kWe . This es-timate excludes return on equity (profi t), and assumes a relatively optimistic base fuel cost of $20/dry ton. The estimate also assumes 20% net effi ciency, 5% interest on debt, 85% capacity fac-tor, no capacity payments, 20 year economic life, straight line depreciation and 2.1% annual escala-tion in operating and maintenance costs but no escalation in fuel cost. Addition of 15% return on equity at an equity ratio of 25% adds $0.015/kWh to the COE. The COE exclusive of fuel cost over the same capital cost range varies from about $0.040 to 0.055/kWh. Sensitivity of COE at this effi ciency is approximately $0.001/kWh for each $1/BDT change in fuel cost. Average biomass fuel cost for the solid-fuel direct combustion sec-tor has ranged between $22/BDT and $40/BDT since 1986, the latter suffi cient to increase COE to $0.10/kWh.”19
At the 15MW level, both the Steam Turbine Genera-tion and Internal Combustion Engine Generation
7

Figure 6 - 10MW Steam Turbine Generation Costs vs. Biomass Cost15
Figure 7 - 15MW Steam Turbine Generation Costs vs. Biomass Cost16
8

Figure 8 - 10MW Internal Combustion Engine Generation Costs vs. Biomass Cost17
Figure 9 - 15MW Internal Combustion Engine Generation Costs vs. Biomass Cost18
9

require biomass cost to drop to zero in order to get near the 6 cents/kWh range. In contrast, California average wholesale price in 2006 was $47.55 per megawatt-hour, or 4.7 cents/kWh20 (LA Times, 2007). Most biomass power generators in the state are mostly now operating under fi xed price contracts for $0.0537/kWh.21
The cost of power generation from biomass remains high for two reasons: First, biomass is a low-density fuel, so fuel production, handling, and transportation are more expensive than for fossil fuels; and second, biomass power generating facilities tend to be small because of the dispersed nature of the resource, hence it is most diffi cult to capture the economies of scale typical of fossil fuel-fi red generating facilities. The inherent characteristics of biomass leave power gen-eration at a distinct disadvantage in a market recogniz-ing economic cost alone. And yet economic cost alone does not fully refl ect several advantages that biomass power can provide.
X - Value of Biomass Power
Economic Impacts
Biomass utilization benefi ts include the creation and retention of local jobs in rural economies. Direct employment for biomass power systems is estimated at between fi ve and six full time jobs created for each MW of installed production capacity. Depending upon power plant scale, this employment fi gure includes 15 to 20 or more personnel at the power plant and the bal-ance of jobs in fuel processing and delivery.22 Morris, 1999, calculated for the State of California “total em-ployment equal to 4.9 fulltime jobs per each megawatt of net plant generating capacity.” 23 Using the Morris ratio a 15MW plant should provide employment for about 73 people.
McNeil et. al., estimating fuel procurement employ-
10
“At the 15MW level, both the Steam Turbine Generation and Internal Combustion Engine Generation re-quire biomass cost to drop to zero in order to get near the 6 cents/kWh range.”
ment, assumed that a six-person crew could produce approximately six full chip vans per day including felling, skidding, chipping and three daily round trips per driver. Assuming a chip van will hold 23 GT of biomass, a 5-MW power plant that consumes 80,000 GT/year of fuel would need two crews operating to provide its fuel. Hence, 12 people would be employed in the fuel procurement sector of a 5-MW plant. Using the same assumptions, a 15-MW plant that consumes 240,000 GT/year would require 5 crews, for 36 em-ployees in fuel procurement alone.24
Environmental Impacts
Environmental benefi ts resulting from biomass power production are clearly valuable to society, yet precise-ly how valuable remains a complex question. Smoke emissions from open burning of biomass residues pro-duces massive pollutants containing particulate matter and greenhouse gasses. Biomass entombed at landfi lls speeds the depletion of landfi ll capacity andgenerates higher greenhouse gas emissions compared to controlled combustion in power plants. Failure to thin and remove excess biomass from overgrown forests depresses forest health, forest productivity, degrades watershed functioning while increasing fuel loads and risks of catastrophic wildfi res.
In a conservative analysis by the National Energy Laboratory in 1999, the total value of the environmen-tal services associated with biomass energy produc-tion in the United States is 11.4 cents/kW. This fi gure includes none of the benefi ts accrued to a rural com-munity such as employment, economic development, energy diversity and security. 25
Watershed Impacts
Watershed health is directly linked to forest health and appropriate forest management. Reducing risk of catastrophic wildfi re not only protects lives and prop-erty but prevents or reduces discharges of debris and sedimentation into water bodies. Wildfi re decreases the soil’s ability to absorb and hold water and exposes mineral soils which too often contributes to the po-tential for mass soil wasting and mudslides following wildfi res.
Thick and excessively dense forest stands compete for sun, water and soil nutrients restricting water yield

11
from forests to riparian areas and reservoirs. Under these conditions forest productivity and diversity in fl ora and fauna are limited. “Forest and fuels manage-ment in strategic areas can help reverse these negative impacts.” 26
Appropriate use of forest management tools including thinning, pruning, prescribed burning as well as taking no action in currently healthy stands helps prevent catastrophic wildfi res and helps create and maintain resilient watersheds, which in turn support communi-ties, wildlife and recreational opportunities and en-hance overall forest aesthetics. Synergistically, these environmental effects create socioeconomic issues for communities, ranging from water availability, to sustained timber production, through non timber forest products creation and recreational opportunities.
Other water quality impacts from a biomass plant are expected to be mitigated by permits from the regional water quality control board.
Air Quality Impacts
Biomass power plants fall under the authority of Cali-fornia Public Utilities Commission and Mendocino Air Quality Management District. Under Rule 1-220(c), New Source Review Standards, Power Plant Review Procedures. A facility will need to utilize Best Avail-able Control Technology (BACT) to control NOx, SOx, and particulate matter emissions. As a rule, the larger the facility the more cost effective pollution treatment becomes.
It is sometimes useful to compare potential biomass emissions with coal emissions because both are solid fuels using similar conversion technologies to produce power. Burning biomass to generate power typically produces less SO2 emissions than coal because bio-mass sulfur content is typically lower than coal. Typi-cal biomass contains only 2% to 6% of sulfur found in coal. The biomass sulfur content translates to emis-sions of about 0.12 to 0.50 lb SO2/MMBtu.
NOx emissions will usually be lower for biomass than for coal, due to lower fuel nitrogen (N), however this may be insignifi cant given the small difference in NOx emissions and similar compliance costs.
While biomass power production is frequently touted as carbon neutral since the CO2 released by combus-tion was removed from the atmosphere in the recent past via photosynthesis, other carbon fl ows are very much involved, including CO2 emissions associated with fossil fuels used in harvesting, processing and transport. In practice, although it is certain the net amounts of CO2 emitted from a biomass power plant is less than a fossil power plant, it must be recognized that the total picture is a bit more complicated.
Morris et. al., 1999, found the total value of the en-vironmental services associated with biomass energy production in the United States is 11.4 cents/kW. Of this value nearly 7.4 cents/kW, appears to be reduction of greenhouse gas emissions. 27
In summary, improvements in air quality can be an-ticipated through effi cient combustion, reduced green-house gas contributions as compared to some fossil fuels and the potential avoidance of forest fi re activity and out of control smoke pollution.
XI - External assistance, supports and subsidies
External assistance in the form of public subsidies and other supports can assist in reducing the capital re-quired and the overall risk of developing a new facil-ity. Renewable energy grants and loan guarantees are broadly available to local governments and coopera-tives.
Major Federal biomass power incentives have been legislated in recent years. Incentives are offered in the form of direct grants, loans or tax credits. A sizable portion of direct grants have been for research to fi nd strategies around road blocks for the development of liquid fuels. A “Comprehensive Guide to Federal Biofuel Incentives” has been prepared by the Offi ce of Senator Maria Cantwell. This guide covers the wide range of various bioenergy and biofuel programs and incentives available. This useful guide can be down-loaded at: http://cantwell.senate.gov/services/Biofuels/Comprehensive_Guide_to_Federal%20Biofuel_Incentives.pdf
Tables #4 and #5 summarize key points of various pro-grams and credits.

12
Table 4 - Renewable Energy Grants and Loan Guarantees (adapted from Cantwell, 2006)
Rural and RemoteCommunityElectrifi cation Grants
DOE inconsultation withUSDA & DOI
Increase energy effi ciency, site orupgrade transmission & distribu-tion lines, or modernize electric generation facilities
Local government entity, utility or irrigation district,cooperative or nonprofi t in a rural area
FY2006 through FY2012Funds not appropriated in FY2006
Biomass CommercialUse Grant Program
USDA or DOI Use of biomass to produce electric energy, sensible heat or transporta-tion fuels; Grants are authorized for up to $20 per green ton of biomass.
Any individual or entity in a preferred community*
FY2006 through FY2016Funds not appropriated in FY2006
Improved BiomassUse Grant Program
USDA or DOI Offset the costs of R&D projects to improve the use of and/or add value to biomass; Grants may not exceed $500,000
Any individual or entity in a preferred community*
FY2006 through FY2016Funds not appropriated in FY2006
* Preferred communities include local government and municipalities near Federal land whose population is less than 50,000 and Indian tribes.
Table 5 - Renewable Electricity Production Tax Credit (adapted from Cantwell, 2006)
Qualifying Resource Service Date Amount of Credit* Credit PeriodClosed-loop Biomass(Organic material from plants planted solely to produce elec-tricity)
December 31, 1992 to January 1, 2008
1.5 cents per kWh 10 years after service date
Closed-loop Biomass modifi ed to co-fi rewith coal and/or biomass
In service beforeJanuary 1, 2008
1.5 cents per kWh times the ratio of the closed-loop biomass thermal content to that for all other fuels in the facility
10 years after the placed in service date butbeginning no earlier than October 22, 2004
Open-loop Biomass (Cellulosic waste material, agricultural livestock waste or non-hazard-ous lignin waste material)
Before January 1,2008
0.75 cents per kWh 10 years for service dates after August 8, 2005; if before, 5 years beginning on January 1, 2005
Open-loop Biomass using agricultural livestock waste nutrients
October 22, 2004 toJanuary 1, 2008(capacity of at least150kW)
0.75 cents per kWh 10 years for service dates after August 8, 2005; 5 years if service date is after August 8, 2005; Credit period begins on January 1, 2005 if ser-vice date is before January 1, 2005
Poultry Waste December 31, 2003 to January 8, 2008
0.75 cents per kWh1.5 cents per kWh if placed in servi-ce after January 1, 2005
10 years for service dates from October 22, 2004 to January 1, 2005 or after August 8, 2005; 5 years for service dates from January 1, 2005 to August 8, 2005
Municipal Solid Waste (includes landfi ll gas and trash combustion facilities and new units placed on existing facilities)
October 22, 2004 toJanuary 1, 2008
0.75 cents per kWh 10 years if service date is after August 8, 2005; 5 years if service date is earlier; Credit period begins on January 1, 2005 for units placed in service prior to January 1, 2005
* The infl ation adjustment factor for the year 2005 is: 1.2528; making the credit for electricity sold in 2005 1.9 cents for wind energy, closed-loop biomass, geothermal and solar, 0.9 cents for open- loop biomass, small irrigation power, municipal solid waste and hydroelectric power, and $5.481 per ton for refi ned coal.
Figure 10 - Increased fuels due to Sudden Oak Death mortality.

13
Cellulosic EthanolFuel ethanol can be made from biomass by break-ing down the naturally occurring polymer known as cellulose. All cellulosic biomass, such as agricultural forestry residues, industrial waste, trees, and grasses, can be broken down into component sugars and then fermented to make ethanol. Corn-derived ethanol has a net energy balance of 20,000 to 25,000 Btu per gallon. By contrast cellulosic ethanol has a net energy bal-ance of more than 60,000 Btu per gallon, a startling increase in yield and system effi ciency.
Testifying to the U.S. Senate Committee on Energy and Natural Resources in 2006, Dr. Michael Pacheco, Director of the National Bioenergy Center, indicated; “Our goal is to reduce the cost of producing cellu-losic ethanol from $2.25 a gallon in 2005, to $1.07 in 2012. To get there we are working to greatly increase production effi ciencies, and boost the average yield from 65 gallons per ton as it is today, to 90 gallons per ton in 2012.”28 Hence, one ton of biomass can now be converted to about 65 gallons of ethanol with a value of around $130. If increases in effi ciency are obtained and utilized the yield could rise to 90 gallons of ethanol per biomass ton, while the value would fall to about $90.
Pyrolysis OilPyrolysis Oil is a dark-brown liquid made from plant material by heating biomass particles in the absence of oxygen. Biomass is vaporized and condensed into a liquid called pyrolysis oil or bio-oil. This liquid product can be readily stored and transported. With it origins in biomass, pyrolysis oil is a renewable liquid fuel. Pyrolysis oil has undergone testing in engines, turbines and boilers, and has also been upgraded to high quality hydrocarbon fuel. The oil can also be used as feedstock for reprocessing into other chemi-cals and compounds.
Fast pyrolysis has now achieved a commercial success for production of chemicals and is now being actively developed for producing liquid fuels. Two Canadian fi rms, DynaMotive Energy Systems and Ensyn Tech-nologies currently operate commercial plants.
A 2006 European market study for bio-oil found pyrolysis oil currently competitive with oil and gas in many European markets, while char, another by-
XII - Utility Green Pricing Programs
A growing number of utilities offer green pricing programs. Currently Alabama, Florida, Iowa, North Carolina, have utilities that offer green pricing utiliz-ing biomass power resources. Two California utilities offer “green power” options based on wind, landfi ll gas and hydro. These are: 1) Los Angeles Depart-ment of Water and Power’s Green Power for a Green LA program, based on wind and landfi ll gas with a premium of 3.0 cents/kWh and 2) Sacramento Mu-nicipal Utility District’s Greenergy program based on wind, landfi ll gas, hydro, with a premium of 1.0 cents/kWh. If a “green pricing” program included a biomass option in the range of 2.0 cents/kWh, it would add around $2,000,000 yearly in revenue adding handsomely to the profi tability of a Fort Bragg based power enterprise.
XIII - Emerging biomass technologies
A discussion of biomass to energy conversion needs to include an overview of emerging and potentially competitive conversion technologies that may soon compete directly with the well established direct combustion technology. The National Renewable Energy Lab (NREL) describes conversion pathways of fermentation, hydrolysis, pyrolysis and gasifi cation. These pathways are graphically represented in fi gure 10 below.
Figure 11 – Biomass to Energy Pathways
Courtesy U.S. Department of Energy, http://www1.eere.energy.gov/biomass/

14
product of the pyrolysis process, can compete with all fossil fuels.
Table 6 - Pyrolysis Oil cost vs. other fuels(adapted from Bradley, 2006)29
Euros/GJDelivered Costs:Pyrolysis Oil- small tankers 6.42 - 10.46Pyrolysis Oil- large tankers 4.82 - 7.75Char 1.51 - 2.57Wood pellets Canada 6.5Prices:Heavy Fuel Oil 5.53 - 9.08Natural Gas 6.01 - 11.50Coal 1.52Pellets 6.8-7.4
Bradley reports that “it is anticipated that supply of Pyrolysis Oil will grow slowly for 1-2 years, reaching 240,000 tonnes by 2008, as investors vie for op-portunities to build, biomass supply is arranged, and markets and prices become more transparent. Then, Pyrolysis Oil supply is projected to increase rapidly, reaching 5 million tonnes by 2012.”30
Fast pyrolysis of woody biomass typically results in yields of 70% pyrolysis oil, 14% char and 13% non-combustible gasses by weight. One ton of wood can be converted to 1400 lbs. of bio-oil or about 140 gallons containing 10.8 gigajoule (GJ) energy. Based on the values in Table #6, energy values only, bio-oil from one ton of wood should be valued at about $61.00.
Charcoal and Direct Carbon Fuel CellsA fuel cell can be thought of as a battery to which fuel can be added. A carbon fuel cell directly converts the chemical energy of carbon to electricity with a high degree of effi ciency and without creating many of the by products caused by conventional combustion. Because carbon fuel cells have potential to convert the chemical energy of carbon into electric power with ef-fi ciencies approaching 100% there has been continual investigation into them since the reaction was fi rst described in 1896.
Lawrence Livermore National Laboratory, SRI Inter-national along with numerous other institutions and research fi rms have designs and working models of carbon fuel cells based on different approaches to the chemical reaction. A broad range of fuels have been tested including coal, coke, plastic, mixed waste and biomass. Researchers at Hawaii Natural Energy Insti-tute have fabricated a moderate-temperature, aqueous-
alkaline direct carbon fuel cell that uses charcoal as its fuel.
To fuel a charcoal burning carbon fuel cell Dr. Antal and his team at Hawaii Natural Energy Institute devel-oped a rapid carbonization process that rapidly turns biomass into charcoal. The process is known as Flash Carbonization and reaches conversion levels of 30%-40% by weight often in less than 1 hour.
In the not too distant future, direct carbon fuel cell technology could offer clean and effi cient conversion of biomass to electricity via charcoal. For example, one bone dry ton of wood (18GJ) converted to 800 lbs charcoal (10.80 GJ) converted to electricity at 90% effi ciency = 2,700 kWh. By contrast, steam-driven turbine-generators with a conversion effi ciency of 30 percent would deliver 1,500 kWh.
Figure 12 - Wood chip useful as fuel and feedstock for other conversion technologies.

15
Figure 13 – Forest residue bundles
French forest residue bundles containing about 1MW energy each. Courtesy Timberjack, 2005
IX. Conclusions
•Conversion technology is mature and well estab-lished with numerous biomass power facilities in place. Economics drive system scale up in size and devalue biomass prices.
•The available forest biomass resource within hauling distance of Fort Bragg is likely suffi cient to support a modest biomass power plant of 10 MW to 15 MW given favorable economic and social conditions. Long term prices and volumes available need to be clarifi ed by biomass suppliers.
•Desirable benefi ts such as rural employment, rural economic development, and energy diversity and secu-rity are provided by local biomass energy production. One could expect 5 to 6 direct jobs created per 1MW. For a 15 MW facility, from 75 to 90 jobs could be cre-ated - a substantial boost to the local economy.
•The net environmental impacts appear positive with the total value of the environmental services associ-ated with biomass energy production estimated at 11.4 cents/kW. Impacts to watersheds are secured though application of established resource management meth-ods and tools. Air quality benefi ts from effi cient com-bustion and pollution controls. Longer term air quality is protected from reduced smoke through uncontrolled forest fi res.
•Costs of capital, fuel ($30BDT) and operations sug-gest a fi nal cost of electricity around 10.0 cents/kWh, a fi gure that could be lowered by subsidies on either capital or fuel.
X. Recommendations
•Strategize and develop forest fuel harvest capacityIt is advantageous to be clear on how much biomass can be delivered at what price.
•Community EducationFamiliarity encourages acceptance. Large noisy in-dustrial installations are intimidating to many. Socio-political and community acceptance are recognized as being important for success of bioenergy projects. The strength of public opinion opposed to the use of resi-dues from native forest logging operations for energy should not be discounted. While lack of agreement on exactly what is to be considered waste is to be expect-ed, opposition may well diminish where slash destined for open incineration is being discussed.
•Champion SubsidiesMultiple federal programs have been authorized to encourage the use of biomass fuels and growth of a biomass industry; however several have remained unfunded. Contacting legislators to encourage full appropriations for these programs could provide the resources needed to encourage development of com-mercial biomass power production in Fort Bragg. Three examples follow:
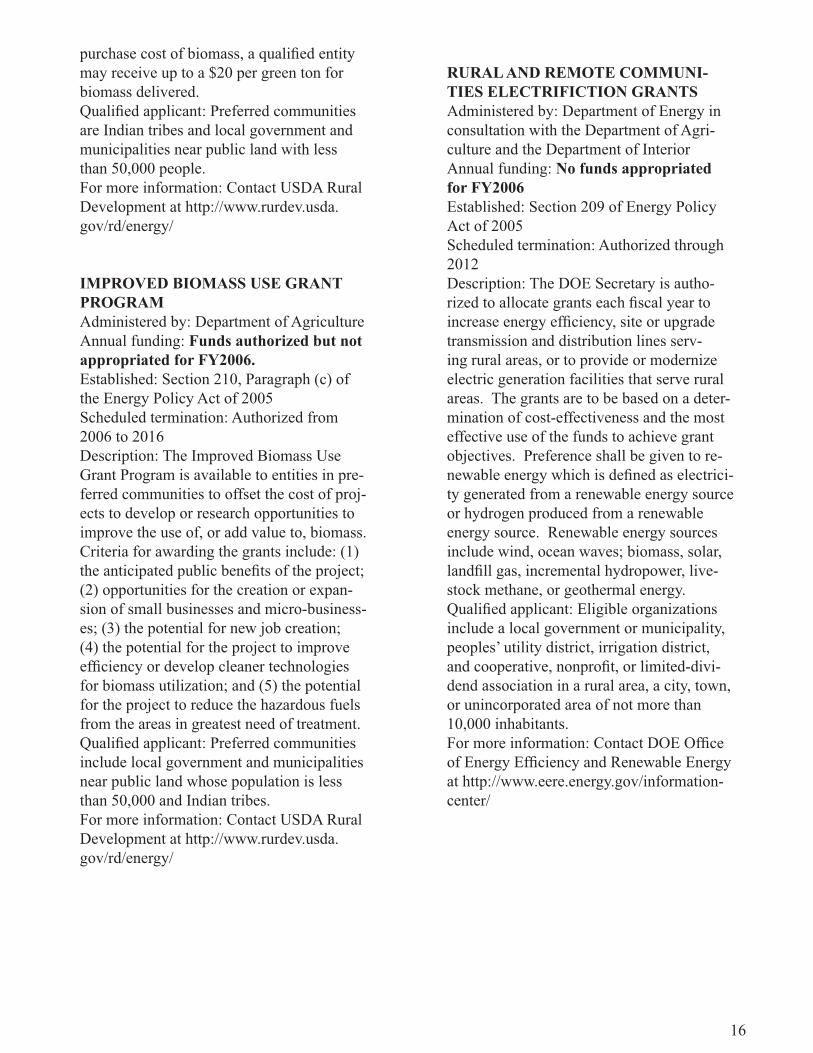
BIOMASS COMMERCIAL USE GRANT PROGRAM Administered by: Department of AgricultureAnnual funding: Funds authorized but not appropriated for FY2006Established: Section 210, Paragraph (b) of the Energy Policy Act of 2005Scheduled termination: Authorized from 2006 to 2016 Description: Authorizes placement of grants to improve the commercial value of for-est biomass for electric energy, useful heat, transportation fuels, and other commercial purposes. Biomass commercial use grants may be made to any person in a preferred community that owns or operates a facil-ity that uses biomass as a raw material to produce electric energy, sensible heat, or transportation fuels. To help offset the
16
purchase cost of biomass, a qualifi ed entity may receive up to a $20 per green ton for biomass delivered. Qualifi ed applicant: Preferred communities are Indian tribes and local government and municipalities near public land with less than 50,000 people.For more information: Contact USDA Rural Development at http://www.rurdev.usda.gov/rd/energy/
IMPROVED BIOMASS USE GRANT PROGRAMAdministered by: Department of Agriculture Annual funding: Funds authorized but not appropriated for FY2006. Established: Section 210, Paragraph (c) of the Energy Policy Act of 2005Scheduled termination: Authorized from 2006 to 2016 Description: The Improved Biomass Use Grant Program is available to entities in pre-ferred communities to offset the cost of proj-ects to develop or research opportunities to improve the use of, or add value to, biomass. Criteria for awarding the grants include: (1) the anticipated public benefi ts of the project; (2) opportunities for the creation or expan-sion of small businesses and micro-business-es; (3) the potential for new job creation; (4) the potential for the project to improve effi ciency or develop cleaner technologies for biomass utilization; and (5) the potential for the project to reduce the hazardous fuels from the areas in greatest need of treatment. Qualifi ed applicant: Preferred communities include local government and municipalities near public land whose population is less than 50,000 and Indian tribes. For more information: Contact USDA Rural Development at http://www.rurdev.usda.gov/rd/energy/
RURAL AND REMOTE COMMUNI-TIES ELECTRIFICTION GRANTSAdministered by: Department of Energy in consultation with the Department of Agri-culture and the Department of Interior Annual funding: No funds appropriated for FY2006 Established: Section 209 of Energy Policy Act of 2005Scheduled termination: Authorized through 2012 Description: The DOE Secretary is autho-rized to allocate grants each fi scal year to increase energy effi ciency, site or upgrade transmission and distribution lines serv-ing rural areas, or to provide or modernize electric generation facilities that serve rural areas. The grants are to be based on a deter-mination of cost-effectiveness and the most effective use of the funds to achieve grant objectives. Preference shall be given to re-newable energy which is defi ned as electrici-ty generated from a renewable energy source or hydrogen produced from a renewable energy source. Renewable energy sources include wind, ocean waves; biomass, solar, landfi ll gas, incremental hydropower, live-stock methane, or geothermal energy. Qualifi ed applicant: Eligible organizations include a local government or municipality, peoples’ utility district, irrigation district, and cooperative, nonprofi t, or limited-divi-dend association in a rural area, a city, town, or unincorporated area of not more than 10,000 inhabitants. For more information: Contact DOE Offi ce of Energy Effi ciency and Renewable Energy at http://www.eere.energy.gov/information-center/
17
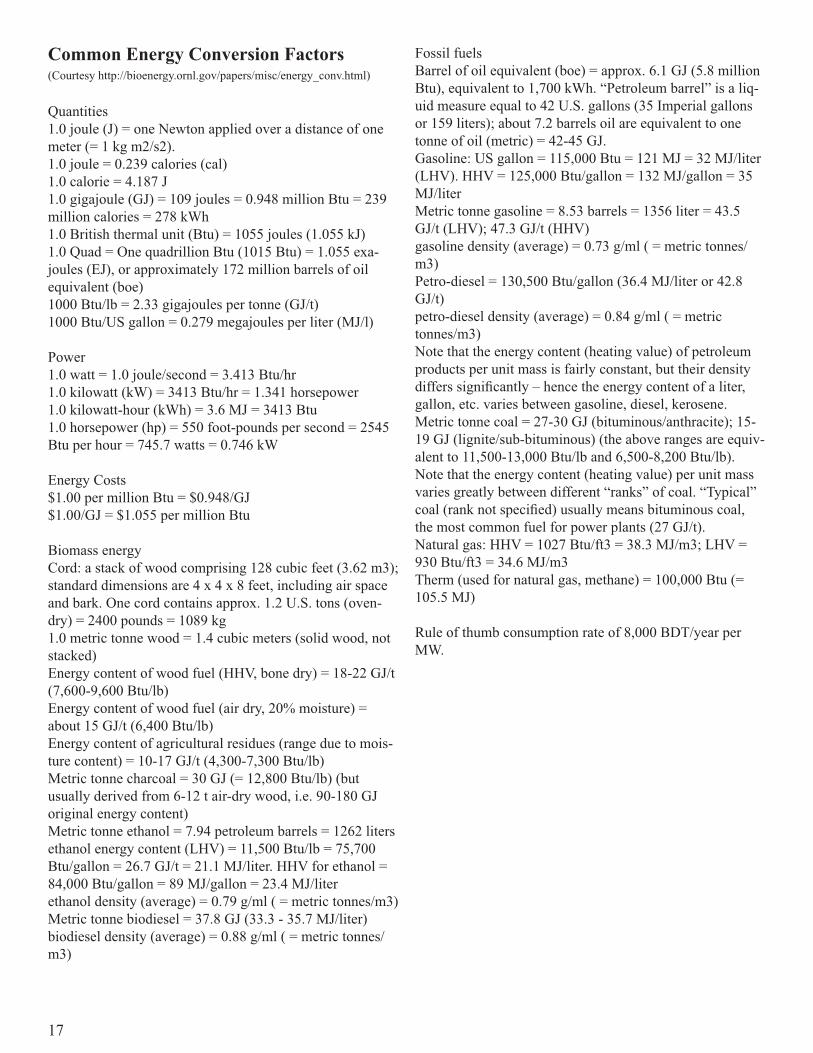
Common Energy Conversion Factors(Courtesy http://bioenergy.ornl.gov/papers/misc/energy_conv.html)
Quantities 1.0 joule (J) = one Newton applied over a distance of one meter (= 1 kg m2/s2). 1.0 joule = 0.239 calories (cal) 1.0 calorie = 4.187 J 1.0 gigajoule (GJ) = 109 joules = 0.948 million Btu = 239 million calories = 278 kWh 1.0 British thermal unit (Btu) = 1055 joules (1.055 kJ) 1.0 Quad = One quadrillion Btu (1015 Btu) = 1.055 exa-joules (EJ), or approximately 172 million barrels of oil equivalent (boe) 1000 Btu/lb = 2.33 gigajoules per tonne (GJ/t) 1000 Btu/US gallon = 0.279 megajoules per liter (MJ/l)
Power 1.0 watt = 1.0 joule/second = 3.413 Btu/hr 1.0 kilowatt (kW) = 3413 Btu/hr = 1.341 horsepower 1.0 kilowatt-hour (kWh) = 3.6 MJ = 3413 Btu 1.0 horsepower (hp) = 550 foot-pounds per second = 2545 Btu per hour = 745.7 watts = 0.746 kW
Energy Costs $1.00 per million Btu = $0.948/GJ $1.00/GJ = $1.055 per million Btu
Biomass energy Cord: a stack of wood comprising 128 cubic feet (3.62 m3); standard dimensions are 4 x 4 x 8 feet, including air space and bark. One cord contains approx. 1.2 U.S. tons (oven-dry) = 2400 pounds = 1089 kg 1.0 metric tonne wood = 1.4 cubic meters (solid wood, not stacked) Energy content of wood fuel (HHV, bone dry) = 18-22 GJ/t (7,600-9,600 Btu/lb) Energy content of wood fuel (air dry, 20% moisture) = about 15 GJ/t (6,400 Btu/lb) Energy content of agricultural residues (range due to mois-ture content) = 10-17 GJ/t (4,300-7,300 Btu/lb) Metric tonne charcoal = 30 GJ (= 12,800 Btu/lb) (but usually derived from 6-12 t air-dry wood, i.e. 90-180 GJ original energy content) Metric tonne ethanol = 7.94 petroleum barrels = 1262 liters ethanol energy content (LHV) = 11,500 Btu/lb = 75,700 Btu/gallon = 26.7 GJ/t = 21.1 MJ/liter. HHV for ethanol = 84,000 Btu/gallon = 89 MJ/gallon = 23.4 MJ/liter ethanol density (average) = 0.79 g/ml ( = metric tonnes/m3) Metric tonne biodiesel = 37.8 GJ (33.3 - 35.7 MJ/liter) biodiesel density (average) = 0.88 g/ml ( = metric tonnes/m3)
Fossil fuels Barrel of oil equivalent (boe) = approx. 6.1 GJ (5.8 million Btu), equivalent to 1,700 kWh. “Petroleum barrel” is a liq-uid measure equal to 42 U.S. gallons (35 Imperial gallons or 159 liters); about 7.2 barrels oil are equivalent to one tonne of oil (metric) = 42-45 GJ. Gasoline: US gallon = 115,000 Btu = 121 MJ = 32 MJ/liter (LHV). HHV = 125,000 Btu/gallon = 132 MJ/gallon = 35 MJ/liter Metric tonne gasoline = 8.53 barrels = 1356 liter = 43.5 GJ/t (LHV); 47.3 GJ/t (HHV) gasoline density (average) = 0.73 g/ml ( = metric tonnes/m3) Petro-diesel = 130,500 Btu/gallon (36.4 MJ/liter or 42.8 GJ/t) petro-diesel density (average) = 0.84 g/ml ( = metric tonnes/m3) Note that the energy content (heating value) of petroleum products per unit mass is fairly constant, but their density differs signifi cantly – hence the energy content of a liter, gallon, etc. varies between gasoline, diesel, kerosene. Metric tonne coal = 27-30 GJ (bituminous/anthracite); 15-19 GJ (lignite/sub-bituminous) (the above ranges are equiv-alent to 11,500-13,000 Btu/lb and 6,500-8,200 Btu/lb). Note that the energy content (heating value) per unit mass varies greatly between different “ranks” of coal. “Typical” coal (rank not specifi ed) usually means bituminous coal, the most common fuel for power plants (27 GJ/t). Natural gas: HHV = 1027 Btu/ft3 = 38.3 MJ/m3; LHV = 930 Btu/ft3 = 34.6 MJ/m3 Therm (used for natural gas, methane) = 100,000 Btu (= 105.5 MJ)
Rule of thumb consumption rate of 8,000 BDT/year per MW.

References
1 Energy Information Administration, 2003, http://www.eia.doe.gov/cneaf/solar.renewables/page/rea_data/table5.html
2 Reuters, 2007, in LA Times, “Wholesale power prices in state fell 18% in 2006” April 21, 2007, http://www.latimes.com/busi-ness/local/power/la-fi -energy21apr21,1,2312465.story?coll=la-headlines-business-power&ctrack=2&cset=true
3 California Energy Commission, 2006, Biomass Resources Assessment in California, pg. 33, http://www.energy.ca.gov/2005publications/CEC-500-2005-066/CEC-500-2005-066-D.PDF
4 California Integrated Waste Management Board, Biomass to Energy, http://www.ciwmb.ca.gov/Organics/Conversion/BioEn-ergy/
5 M. Reed, L. Wright, R. Overend and C. Wiles, CRC Handbook of Mechanical Engineering (Frank Kreith, Ed.,CRC Press, Inc., 1998), Section 7 – Energy Resources, p. 26., referenced in Mc-Neil Technologies, Inc., 2003, Biomass Resource Assessment and Utilization Options for Three Counties in Eastern Oregon pg. 63
6 TSS Consultants, 2006, Preliminary Biomass Fuel Availability and Feasibility Review for Siting Biomass Power Facilities in Mendocino County, California., pg. 4
7 California Energy Commission, 2006, Biomass Resources Assessment in California, pg. 10, http://www.energy.ca.gov/2005publications/CEC-500-2005-066/CEC-500-2005-066-D.PDF#search=%27California%20Biomass%20Collaborative%27
8 Food and Agriculture Organization of the United Nations, 2004, Unifi ed Bioenergy Terminology, pg. 25
9 McNeil Technologies, Inc., 2003, Biomass Resource Assess-ment and UtilizationOptions for Three Counties in Eastern Oregon, pg. 92
10 Mr. Gerald Willis, USDA-NRCS, personal communication, May 2007.
11 TSS Consultants, 2006, Preliminary Biomass Fuel Availability and Feasibility Review for Siting Biomass Power Facilities in Mendocino County, California., pg. 5
12 TEKES, 2004, Developing technology for large-scale produc-tion of forest chips, pg. 4 http://www.tekes.fi /julkaisut/Wood_Energy.pdf
13 TEKES, 2004, Developing technology for large-scale produc-tion of forest chips, pg. 81 http://www.tekes.fi /julkaisut/Wood_Energy.pdf
14 Antares Group, 2003, Assessment of Power Production at Rural Utilities Using Forest Thinnings andCommercially Available Biomass Power Technologies, United States Department of Agriculture, United States Department of
Energy, and National Renewable Energy Laboratory, pg. ES 6 & 7
15 Ibid, pg. C816 Ibid, pg. C917 Ibid, pg. G1318 Ibid, pg. G14
19 California Energy Commission, 2006, Biomass Resources As-sessment in California, pg. 31
20 Reuters, 2007, in LA Times, “Wholesale power prices in state fell 18% in 2006” April 21, 2007, http://www.latimes.com/busi-ness/local/power/la-fi -energy21apr21,1,2312465.story?coll=la-headlines-business-power&ctrack=2&cset=true
21 California Energy Commission, 2006, Biomass Resources As-sessment in California, pg. 33
22 McNeil Technologies, Inc., 2003, Biomass Resource As-sessment and Utilization Options for Three Counties in Eastern Oregon, pg. 79
23 Morris, G., 1999, The Value of the Benefi ts of U.S. Biomass Power, National Renewable Energy Laboratory, pg. 12
24 Ibid, pg. 8025 Ibid, pg. iv
26 McNeil Technologies, Inc., 2003, Biomass Resource As-sessment and Utilization Options for Three Counties in Eastern Oregon, pg. 74
27 Morris, G., 1999, The Value of the Benefi ts of U.S. Biomass Power, National Renewable Energy Laboratory, pg. iv
28 Pacheco, Michael, 2006, Testimony for the U.S. Senate Com-mittee on Energy and Natural Resources, National Renewable Energy Laboratoryhttp://energy.senate.gov/public/index.cfm?FuseAction=Hearings.Testimony&Hearing_ID=1565&Witness_ID=4427
29 Bradley, D., 2006, European Market Study for BioOil (Pyroly-sis Oil), Climate Change Solutions, pg. 4 www.climatechangeso-lutions.net
30 Ibid, pg. 5
18