pre-feasibility studies of priority subprojects and...
TRANSCRIPT

GOVERNMENT OF SOCIALIST DEMOCRATIC REPUBLIC OF SRI LANKA
Ministry of Local Government and Provincial Councils
TA 7659 SRI: Local Government Enhancement Sector Project(Pura Neguma)
Pre-Feasibility Studies of Priority Subprojects and Reform PlanPradeshiya Sabha Seethawaka
Province WP
GOSL List Reference No 8B
Submitted toASIAN DEVELOPMENT BANK
Submitted By:GreenTech Consultants Pvt Ltd
Colombo, Sri Lanka

ABBREVIATIONS
ADB : Asian Development Bank
ACLG : Assistant Commissioner of Local Government
CEA : Central Environment Authority
CEB : Ceylon Electricity Board
CLG : Commissioner of Local Government
CWSSP : Community Water Supply and Sanitation Project
DCS : Department of Census and Statistics
DPR : Detailed Project Report
DSC : Design Supervision Consultant
EIA : Environmental Impact Assessment
EMP : Environmental Management Plan
FOP : Financial Operating Plan
GN : Grama Niladhari
GoSL : Government of Sri Lanka
HH : House Hold
IEC : Information Education and Communication
IEE : Initial Environmental Examination
IR : Involuntary Resettlement
LA : Local Authorities
LGESP : Local Government Enhancement Sector Project.
LPCD Liters per capita per day
LRC Land Reform Commission
M : Million
MLD : Million Litre per Day
MLG&PC : Ministry of Local Government and Provincial Councils
NWSDB National Water Supply and Drainage Board
NSWMSC National Solid Waste Management Support Centre
O&M : Operation and Maintenance
PAP : Project Affected Persons
PC : Provincial Council
PD : Project Director
PFR Pre-Feasibility Report
PMU : Project Management Unit
PS : Pradeshiya Sabha
PVC Poly Vinyl Chloride
RAP : Resettlement Action Plans
RF : Resettlement Framework
RP : Resettlement Plan
SLR : Sri Lankan Rupee
SPCU : Sub Project Coordination Unit
SWM Solid Waste Management

TABLE OF CONTENTS
1. Introduction and Background ......................................................................................... 12. Situation Analysis........................................................................................................... 2
2.1. Services.................................................................................................................. 22.2. Staffing ................................................................................................................... 52.3. Financial Performance ............................................................................................ 5
2.3.1. Recurrent Income ............................................................................................ 52.3.2. Recurrent Expenditure ..................................................................................... 52.3.3. Status .............................................................................................................. 52.3.4. Capital Account:............................................................................................... 52.3.5. Overall Status: ................................................................................................. 6
3. Gap Analysis.................................................................................................................. 63.1. Water supply and sanitation.................................................................................... 73.2. Sewerage and drains .............................................................................................. 73.1. Roads and Bridges ................................................................................................. 73.2. Solid Waste Management ....................................................................................... 73.3. Other Facilities........................................................................................................ 7
4. Long term and short term Infrastructure needs based on gap analysis .......................... 85. Infrastructure Priorities under the Project ....................................................................... 8
5.1. Priorities.................................................................................................................. 85.1.1. Roads and Drainage Network .......................................................................... 85.1.2. Solid Waste Management ................................................................................ 9
6. Prioritization after the Government’s Guidance on Developing a Township under theProject .................................................................................................................................. 97. Pre-feasibility of Subprojects: Hanwella Small Town Development .............................. 10
7.1. PFR of Office Building Construction Subproject .................................................... 107.1.1. Background and Problem to be Addressed.................................................... 107.1.2. Existing Situation ........................................................................................... 117.1.3. Proposed Improvement.................................................................................. 117.1.4. Location ......................................................................................................... 127.1.5. Layout of the Proposed Building .................................................................... 127.1.6. Estimated Cost of the Construction................................................................ 137.1.7. Project Operating Cost Estimates .................................................................. 14
8. Financial Assessment .................................................................................................. 148.1. Assumptions ......................................................................................................... 148.2. Financial Operating Plan....................................................................................... 15
9. Reform Plan................................................................................................................. 17Annex 1............................................................................................................................... 22Involuntary Resettlement Checklist for the Identified Subprojects ....................................... 22Annex 2............................................................................................................................... 23Summary of Consultations and Participation....................................................................... 23Annex 2.1............................................................................................................................ 25Attendance Sheet of the Stakeholder Meeting .................................................................... 25Annex 2.2............................................................................................................................ 26Presentation for the stakeholders and Key informants ........................................................ 26Annex 2.3............................................................................................................................ 28Summary of the Key Informants discussion ........................................................................ 28Annex 2.4............................................................................................................................ 29Leaflet on Subproject Selection (English Version)............................................................... 29Annex 2.5............................................................................................................................ 30Photographs of the consultation and participation ............................................................... 30

1
1. Introduction and Background
This is an additional town and only one round of consultation was held to cover both Stage Iand Stage II. The draft outline of the reform plan was discussed along with the sub projectselection, as they were identified by the Ministerial committee.
This assessment follows the criteria and processes as set out in the loan agreement withGoSL, a solid waste management plan prepared for the town as a pre requisite and thelatest priorities post Ministerial consultations. The Annex 2 presents some of the initialdevelopment priorities of the local authority.
The LA will resolve through a Council Resolution which would include a) Agreement onpriorities; b) Commitment to the Reform; c) Acceptance to the financial forecast and O&Mcommitments and d) Request for technical assistance for Design and Supervision; Thereport is based on assessment of existing situation, needs, financial capacities andimplementable priorities.
Table 1: Basic FactsA. General
Name of Pradeshiya Sabha Seethawaka PS
Year of Formation 1987
Province WP
District Colombo
Area Sq. km 208.3 Sq.km
Elevation above MSL m 13
No of GN Divisions 90
Nearest Town Colombo
Distance to Main Town km 38
Distance to Colombo km 38
B. Demography
Population
Male 65,951
Female 63,630
Total 129,581
Sex Ratio Female/ 1000 Male 964
Total Households 39,115
Land Use and economy of the PS Detail not given
Table 2 presents land use pattern in the PS. Agricultural employment in the PS is 10,227 ofwhich more than half the agricultural work is in paddy cultivation. Vegetable cultivation is notwidespread and some engaged in this activity and most others in agricultural employmentare involved in cultivation of fruit crops, rubber, and coconut and tea plantations.
Paddy is cultivated in both seasons with a total output of 6,500 metric tons. Total output ofvegetables, Tea Rubber and coconut and almost the entire output is meant for markets inmore urban areas in the country.

2
Table 2: Land Use Pattern
Type of Use Extent (acres) Share (%)
Paddy 847 6.25
Other crops 42 0.32
Abandoned paddy --
Tea 206 1.52
Rubber 9,104 67.09
Coconut 1,068 7.87
Marshy lands -
Forest reserves 379 2.79
Home gardens 1,498 11.04
Water sheds 204 1.51
Cash crops 217 1.59
Total 13,568 100Source: Seethawaka PS Survey
Total paid employment in the PS is about 49,542 or about 85% of the labour force.Agricultural employment is the main occupation among the employed accounting for 16.6%of the employed labour. About 16.37% of are employed in the public sector, 29.84% in theprivate sector and another 16.33% is self-employed. Unemployed labour force is about19.51%. Nearly 35% of the families in the PS are Samurdhi recipients1. The high rate ofSamurdhi recipients is, however, an indication of the poverty level of the PS
2. Situation Analysis
2.1. Services
A. Water Supply: According to information available with the PS, households obtaindrinking water from different sources. The following table depicts the number of householdsserved by deferent sources.
Source Number of Households
Piped borne Water Supply 21,618
Dug Wells 18,628
Tube Wells 1,491
Common Wells 7,296
Streams and Rivers 180
Other Sources 1,062
B. Sanitation: According to PS data, 39,115 households have their own toilet facilities,which account for almost 100% of total households in the PS. The PS has also built 10Public toilets.
C. Roads: Overall length is 662 km and most of the roads are in very poor condition andneed rehabilitation. Within the PS area, there are motor able roads of about 701 km. Out ofthis total extent, ‘B’ grade roads account for104 kilometres and the balance 60 km are ‘C’grade roads. There is a network 498 km of class E roads.
1Family classification method has been adopted in selection and it is participatory approval with a
range of criteria which explains the poverty as such as housing and ownership

3
D. Solid Waste Management: The PS provides comprehensive solid waste collection(SWM) service to the entire community.
Collection: At present, the PS has out sourced to a private firm called Super Clean to carryout solid waste collection of street refuse and house refuse in Seethawaka town on a dailybasis,The PS for the deposit of refuse by the public provides roadside bins.
Area Number ofHouseholds
Collectionpoints
Frequency ofcollection
Padukka - - 5
Kosgama - - 5
Hanwella - - 5
Waste collection Program
The LA collects garbage in Hanwella, Upper Hanwella North, Pahath gamaUpper hanwellaNorth, Kahahena Galagedara North Galagedara NorthPadukka,Lower Padukka, UpperKosgama South,Lower Kosgama North, Salawa areas. Every day they collect from 7.30 amto 4.00pm, five trips in average per day. They collect in all six days other than Sundays.
Quantity of the solid waste per day/per week collected
Gross amount of SW collected From the three towns
Amount that has to be collected (tons/day) 8 tons
Amount that is being collected (tons/day) 8 tons
Major waste generation pointsNo Source of waste collection From the three towns Amount
tonnes/day1 Weekly Pola 3 tons
2 Hotels and shopping complex 2 tons
3 Households 2 tons
4 Other places 1 tonsNote: Market waste, commercial waste and industrial waste
Transfer: is carried out using a tractor-trailer that belongs to the PS. Daily collection is about8 tons and more than 50% of the street refuse consists of vegetable waste.
Equipment No Transport capacity (kg) No of trips per day
Special Dump trucks
Four wheel tractor with trailer 02 750 5
Two wheel tractor with trailer
Hand carts 05 10 5
Others
Method of disposal
The current practice of disposing refuse is to dump them on the three dumping sitesbelonging to the Provincial Council and the PS. The PS has so far not obtained approvalfrom the Central Environment Authority for disposal.

4
Brief description of final disposal site:
i. Location : Karadiyana,/ Kosgama Katiyanawatteii. Ownership : Provincial Council / PSiii. Situation (surroundings) : Non-Residentialiv. Approvals from CEA : Kosgama CEA approval obtained.
Structure of Waste management; head of unit, number of PHIs and Supervisors
A Technical Officer and a Public Health inspector are mobilized in order to control andadminister the solid waste collection and management aspects.
Labour force
Approved number of labourers 31
No of labourers working at present 28
Operational cost of SWM
Type of costAverage annual Cost
(SLRs)Waste collection 6,000,000
Salaries and payments 21,097,181
Equipment/maintenance 1,283,000
Budget allocation on SWM 20%
Summary and current status
i. Currently the LA does not receive any financial assistance for the implementation ofa SWM project.
ii. The service levels are not up to the desired levels, and most households cannot usespace in their premises for disposal or composting. This warrants a centralizeddisposal facility.
Problems Suggested solutionsTo transport solid waste there is not enoughvehicles.
To purchase 3 compactors and 3tractors.
Shortage of labour To recruit adequate labourThere is no place to dispose solid waste in thePS area. Requested a land from Land reformcommission through CEA but No response.
Requested a land through CEA from theland reform commission.
D. Medical Services: The health and medical facilities in the PS are also limited withonly 05 Ayurvedic clinics have been conducted. 16 mother and child care Health centres inthe PS. In addition, one district hospital and 2 government dispensaries and 03 privateHospitals are located in the PS. There is no base hospital in the PS.
E. Education: There are two national schools in the PS with a staff of 210 and astudent population of nearly 5,377. In addition, there are 47 other schools up to GCEOrdinary Level and the number of students attending these accounts for about 16015students and h a staff of about 823 teachers. There are also two vocational centres and 72Preschools in the PS.

5
F. Office Facilities: The PS is housed in an incomplete complex without any modernfacilities or adequate office space for the staff. Its vehicle fleet includes one pickup truck, twotractors, two water bowsers and two tractor-trailers. Office equipment available at the PSincludes 2 computer units, one photocopying machine, a fax machine and one telephone.
2.2. Staffing
Permanent staff of PS consists of one secretary, 24 management assistants, one computeroperator, four ayurvedha doctors, four librarians, one programme assistant, one worksuperintendent, three technical officers, one revenue inspector officers, three Ayurvedadispensers. three revenue, officer, six preschool teachers, three library assistants, fourlibrary labourers, for KKSs, one messenger, three office labourers, eight drivers, sixwatchers, one administration officer, two electrical labour assistants, one dispenser, oneayurvedic orderly, four ayurvedha labour, one road supervisor, one crematoriumadministrator, three industrial supervisor, three health supervisors, 35 road labourer, 31health labour, one crematorium operator and one crematorium operator assistant.
2.3. Financial Performance
2.3.1. Recurrent Income
The total revenue for the PS in 2011 was SLRs. 100.0 Million. Around 38% of income is inthe form of grants.
Own Sources: Seethawaka PS income is made up from mainly three sources, which areassessment tax, rents, and warrant charges. As shown in Table 2, the combined income ofthe three sources was about 40% in 2011 and these together account for nearly 66% of itsown revenue, i.e., without government grants.
Grants and Transfers: Grants from the Central government have also been rising and in2011, the PS received SLRs 38.1 million compared with SLRs 19.9 million in 2007. Theshare of grants in total revenue has increased from 35% in 2007 to 38% in 2011.
2.3.2. Recurrent Expenditure
Annual recurrent expenditure in 2011 was SLRs 80.5 Million. This is an increase from SLRs46.3 million in 2007. This increase has been largely contributed by the increase in theexpenditure on wages and salaries and expenditure for transport. In 2007, wages andsalaries accounted for SLRs. 31.5 million, and in 2011, this amount increased to SLRs 45.9million. In 2011, the PS spent SLRs 45 million on salaries while it only received SLRs 38.1million as government grants. The difference, amounting to about SLRs 7.8 million, camefrom its own revenue.
2.3.3. Status
The final accounts of Seethawakka PS for 2011 presents an operating surplus amounting toSLRs. 19.5 million in the recurrent budget.
2.3.4. Capital Account:
The amount received by the PS as capital grants varied from SLRs 13 million in 2011 toSLRs 42.8 million in 2008. The PS has also undertaken a number of capital developmentprojects utilizing these grants and at the same time it has managed to maintain an overallbudget surplus in 2011.

6
2.3.5. Overall Status:
The overall surplus in 2011 was SLRs. 8.6 million. During 2008 to 2010, the LA experiencedoverall deficit whilst showing operating deficit of 1.2 million in 2009. This is due to theintensive capital expenditure.
Table 3: Details of Annual Accounts of Seethawaka PS- 2007 to 2011.2007 2008 2009 2010 2011
Recurrent Revenue
Acreage & Tax 2,107,936.85 7,177,995.92 5,779,705.77 10,565,268.75 11,832,536.87
Rents 9,045,359.68 9,764,922.30 9,660,602.75 10,944,965.05 15,205,349.20
Licenses 1,231,098.28 1,348,759.34 1,446,160.17 1,425,504.49 1,379,214.04
Fees From Services 2,395,408.75 3,434,553.00 3,414,806.18 4,128,058.61 5,210,317.47
Warrant Cost 9,843,552.69 9,726,056.60 9,688,767.18 10,412,262.63 13,802,256.34
Other Income 12,978,936.72 9,937,598.95 10,901,729.10 11,980,352.38 14,492,474.53
Other Aids 19,904,833.19 22,030,459.19 29,873,050.73 33,146,857.47 38,139,339.01
Total 57,507,126.16 63,420,345.30 70,764,821.88 82,603,269.38 100,061,487.46
Recurrent Expenditure
Salaries and Wages 31,530,895.50 34,618,383.17 39,086,988.86 40,381,539.40 45,914,828.04
Traveling 274,697.93 477,711.86 681,475.36 540,637.66 502,952.20
Supplies 6,002,856.12 8,933,428.11 9,226,782.46 7,333,567.76 8,228,631.45
Repairs & Maintenance 2,535,941.13 3,847,746.91 4,829,696.10 8,132,035.28 6,165,029.62
Transport 4,817,510.52 11,632,178.58 15,756,035.17 13,724,357.01 15,034,736.05
Bonus and Welfare 395,742.79 415,694.99 780,733.52 1,866,150.27 2,189,208.99
Aids and Contribution 513,559.79 1,467,861.70 1,506,310.79 625,641.23 1,860,071.71
Pensions 281,455.84 204,769.55 139,882.86 315,157.06 639,258.63
Total 46,352,659.62 61,597,774.87 72,007,905.12 72,919,085.67 80,534,716.69
St/ Deficit 11,154,466.54 1,822,570.43 (1,243,083.24) 9,684,183.71 19,526,770.77
Capital Income
Capital Grants/ Income 23,500,942.80 42,795,341.70 38,763,469.47 32,634,072.64 13,783,780.21
Capital Assets Sales
Total 23,500,942.80 42,795,341.70 38,763,469.47 32,634,072.64 13,783,780.21
Capital Expenditure
Expenditure For Machinery 22,508,489.44 715,994.00 90,911,430.03 52,702,931.45 24,686,897.86
Land & Land Improvement 49,650,730.61 698,741.24
Net St/ Deficit 12,146,919.90 (5,748,812.48) (53,391,043.80) (11,083,416.34) 8,623,653.12
Source: Seethawakka PS, Annual Accounts
3. Gap Analysis
The Gap analysis is based on available existing situation related information and the long listof priorities.

7
3.1. Water supply and sanitation
Table 4: indicating the population projections and the cost of production
Year
Projection ofPopulation in
PS H/H
TotalDemand
MLD Cost/MLD( M)
TotalCost
SLRs.(Million)
2011 39115 23.47 33.33 782.30
2016 41110 24.67 33.33 822.21
Assumptions1. Water demand 400 litres per HH (80 liters per head* 5 members)2. Safety Factor 1.52
3. Cost of production SLRs. 20,000 per HH
There is not much shortage of safe drinking water for the majority of the households due tolack of safe piped borne water supply schemes. As the water is the lifeline of the communityin the PS, Hence, the PS has not identified any water supply projects as their priorities,
3.2. Sewerage and drains
Drains are only available at some roads,. There are no drains in the other areas of the roadnetwork in the PS. It is not possible to provide road drains in each road because nature ofthe terrain. Assuming the PS can construct drains for 5km of roads per year, the mediumterm need for drainage is estimates at SLRs 21 million3.
There is no request for rehabilitation or construction of new road drains in the PS
3.1. Roads and Bridges
PS has an internal road network of 662 Km. While PS does not have a capacity to upgrademuch roads within the next five years due to lack of machinery with the PS. They may beable asphalt about 5 km per year. The estimated cost for 5km roads per year and for nextfive years is SLRs 250 million4. No roads have been selected for rehabilitation as a priority.
3.2. Solid Waste Management
Primary Collection:
i. It is estimated that, household solid waste management requires the purchase ofcollecting bins at a cost of SLRs. 1000000.00
The LA in consultation with the public identified the Construction of storage compostingfacility at a cost of SLRs 8.0 million as a priority.
3.3. Other Facilities
Currently other infrastructure facilities such as Weekly Pola, Ayurvedic clinic centres,maternity centres and economic centres are inadequate. However, these are identified as
2Design Manual on Small Community Water Supplies- Prepared under the WHO/UNDP Project on
institutional Support to the NWSDB – Jan 19823
The cost of earth drains on either side per kilometre road length SLRs 0.84 million.4
Cost per Km of Asphalt will be SLRs 10 Million per Km

8
low priority needs. However, the LA will be able to invest around 50 million within the next 5years with the assistance of the GoSL or Provincial Council.
4. Long term and short term Infrastructure needs based on gap analysis
Sector 5 year plan (2016) Long term (2026)Population (households) 41,110 45,411
Costs SLRs in MillionSWM 20Water Supply & Sanitation 822 1,617Roads & Drains 250 491Others (pola etc) 50Total 1,142 2,108
5. Infrastructure Priorities under the Project
With the improvement in the road network in the district, there has been an increase ineconomic growth in this PS. Therefore, the PS accords priority to provide basic infrastructurefacilities to support the economic growth and improve living conditions. Accordingly, The PShas identified several infrastructure gaps and needs, through two stages of consultations.Based on the outcomes of the consultations, the LA has identified and short-listed a list ofsubprojects to be carried out under the LGESP.
Environmental Infrastructure Water Supply
o No issues identified in accessing drinking water to the public of the LA area Solid Waste management
o Need to construct composting facility
Growth Infrastructure Construction of Bus stand.
Economic Infrastructure Construction of weekly fair at Kosgama.
Social Infrastructure and others Construction of PS office building which include a Library at Hanwella, Playground at Padukka.
5.1. Priorities
Out of the identified prioritized; the two priorities within the Hanwella town were identified fordevelopment.
Construction of PS office building which include a Library at Hanwella, Construction of Bus stand.
5.1.1. Roads and Drainage Network
Even though the roads are in bad condition, the PS will meet the expenses of rehabilitatingthese roads through other funds such as Gamaneguma and Maganeguma.
9
5.1.2. Solid Waste Management
Table 5: Solid waste Managementa Collection
i Sorting at (household level/separate bin/sort after collection) N.Aii Method of collection (Tipper, tractor, two wheel tractor, carts) TractorTransport plan with mapiii Frequency of collection (daily, once in two days, weekly) Dailyiv Coverage area (sq km) and GND division 90 GN divisions
v Expected collection8 metric tons, perday
Requirement for this process and costActivity Cost (SLRs)Supply of collection bins 1,000,000Procurement of tipper – 3Cubic meters capacity 5,000,000Construction of a sorting centre about 20m X10m 2,000,000Total 8,000,000
b Proposed treatmenta If composting
i Extent of proposed land (attach copy of survey plan) 1 acreii Land ownership (attach a copy of deed) PSiii Location of the site (show on a map) Kosgama
ivCurrent usage of the land (standing structures, livelihoodes)
Composting
v Any approval required Yesb Any proposal for landfills? Yes
i Extent of proposed landii Land ownership (attached a copy of deed) Provincial counciliii Location of the site (show on a map) Karadiyayanav Any approval required No
c Any other treatment/method of disposal proposed? -c Any capacity building/training required Yes
a Components of training
Awarenessprogrammes to becarried out to thecommunityregarding sortingout beforedisposing.
b Estimated cost SLRs 50,000Source: PS Survey
6. Prioritization after the Government’s Guidance on Developing a Township underthe Project
As this is a later addition to the list provided by the GoSL, through a Ministerial levelconsultation focused on a few town development activities for possible inclusion under theproject. As a result, Hanwella Town within the PS was selected for development under theLGESP and the following subprojects were proposed
The overall budget under LGESP per town is SLR 50 million. From this perspective, thefollowing projects were identified. The selection was based on:

10
a. Eligibility of the sub sector under the sub project selection criteria as agreed to withADB
b. Compliance to safeguard- projects should have minimal land acquisition as the costwill have to be borne by the LA and should have no adverse environmental impactand
c. Financial sustainability in terms of O&M.
As a policy the project does not encourage activities that are commercial in nature such asshopping areas/ complexes.
Sub Project DecisionsBasis forrecommendation
OriginalCost
AllocatedCost
Remarks
Construction of thesecond phase ofthe PS officebuilding whichinclude a Library atHanwella
RecommendedExpansion due toneeds for library
60 50Mobilizebalancefunds
Construction of abus stand
NotRecommended
Funding issue 80
Development ofWeekly Fair atKosgama
NotRecommended
No Alternate sitefor pola duringconstruction
80
Play Ground atPadukka
NotRecommended
Not in line withthe eligiblesubprojectsagreed uponbetween thegovernment andADB
This report presents the PFR for post ministerial projects and includes progress onconsultation.
7. Pre-feasibility of Subprojects: Hanwella Small Town Development
Hanwella Town was selected for the township development under the LGESP. This is theprimary tow of the LA area. All the governments, commercial centers, social, health andother infrastructures are concentrated in this town.
7.1. PFR of Office Building Construction Subproject
7.1.1. Background and Problem to be Addressed
Rationale: Seethawaka PS is located in the Western Province of Sri Lanka with a meanannual rainfall of 3000mm. In 1952 it was a village development society. In 1987 it wasformed as Pradeshiya Sabha. Seethawaka area is having a historic value because it was anancient Kingdom. It is surrounded with beautiful hills protected forest reserves waterfalls andrivers.

11
The PS has constructed its office building using a loan from LLDF. Due to fundinglimitations, the LA could not construct a part of the planned building to accommodate thelibrary.
7.1.2. Existing Situation
The library functions in a small space in the first floor of a two storeyed old building. Thislibrary is extremely busy as the student population use this library for their reading andreference activities extremely. The activities of this library are hindered due to the lack ofspace. There are more than 11,000 books available in this library. More than 900 activemembers visit this library to lend books frequently. Daily, more than 40 students visit thislibrary for reading.
Figure 1: Existing library Figure 2: Existing library
7.1.3. Proposed Improvement
It was proposed to construct the second phase of the office building to accommodate thelibrary. The second face includes, (i) demolition of the existing library building in the first floorand irrigation department office in the ground floor. (ii) Construction of the library section intwo storeys (part of the ground floor will be given to the Dept. of irrigation to continue itsfunctions)
A. Attributes of the Proposed Building
Proposed SiteOwnership of the Land PS (in the premises of existing office building)Number of storeys threeTotal floor area 12,000 sq.ftComponentsBasement Vehicle parkGround Floor Library
o Children Sectiono Librarian roomo Toilet
For Dept. of Irrigation (for rent) 1,500 sq.fto Toilet
First Floor Libraryo Reference Sectiono Reading sectiono Lending sectiono Assistant Librarian roomo Binding section

12
o StoreMeeting hall (2,500 sq.ft)Toilet
Water supply and electricity Already available
7.1.4. Location
7.1.5. Layout of the Proposed Building
Figure 3: Master layout of the office complex
13
Figure 4: Ground Floor
Figure 5: First Floor
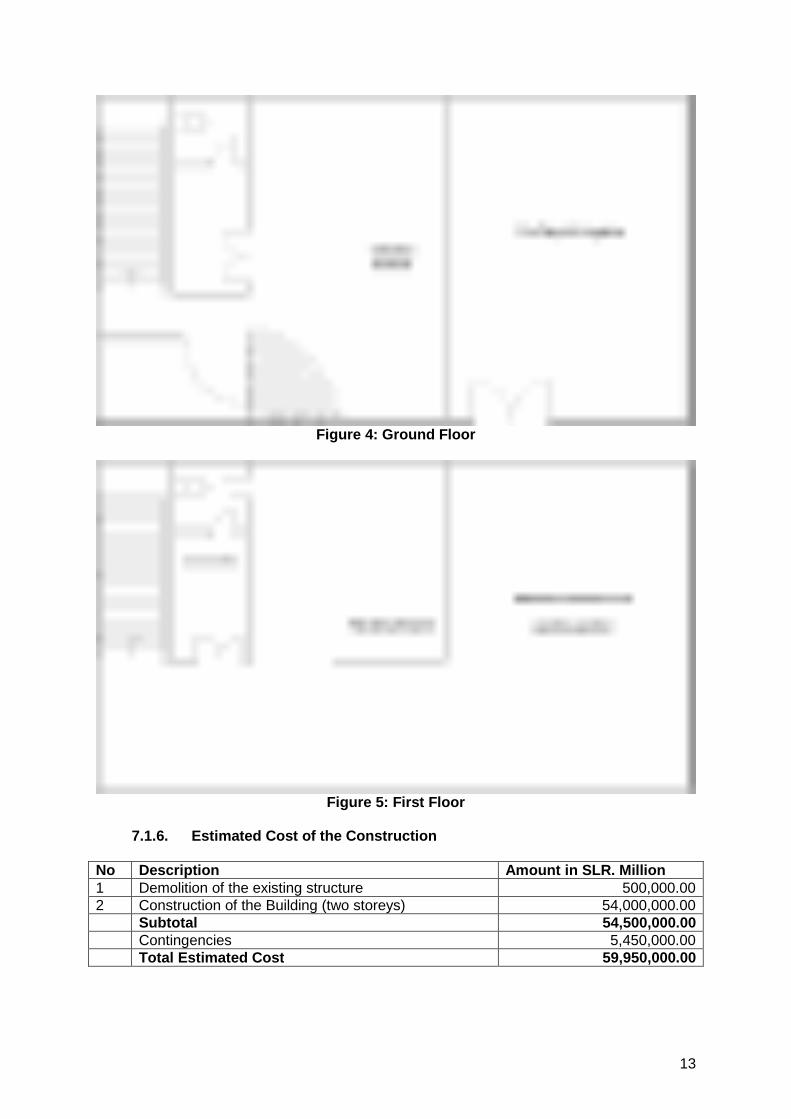
7.1.6. Estimated Cost of the Construction
No Description Amount in SLR. Million1 Demolition of the existing structure 500,000.002 Construction of the Building (two storeys) 54,000,000.00
Subtotal 54,500,000.00Contingencies 5,450,000.00Total Estimated Cost 59,950,000.00

14
7.1.7. Project Operating Cost Estimates
The Seethawaka PS will be responsible for the O&M of the facility to be built under theproject. LA will budget 3% of the capital cost annually for the O&M cost.
8. Financial Assessment
8.1. Assumptions
HEAD TREND % ASSUMPTIONS
EXPENDITURE & INCOME
Own Revenue 14% 10% Increase per annum from 2010
Revenue Grant 68% 75% of personal Expenditure
Personnel Expenditure 12% 10% Increase per annum from 2010
Other Expenditure 27% 10% Increase per annum from 2010
O & M Expenditure 30% 10% Increase per annum from 2010
Inflation Rate 7%
Interest Rate 5%
Percentage increase assumed at revision of taxes (at 5 year interval) 5%
O&M Cost of the Projects3% of the capitalcost
The Financial Plan has not incorporated increases due to the proposed re-engineeringcommitments to be a part of it, but expects to work towards proposals within the existinglegislative frameworks.

15
8.2. Financial Operating Plan
2007 2008 2009 2010 2011 2012 2013 2014 2015 2016Own Source 37,602,293 41,389,886 40,891,771 49,456,412 61,922,148 68,114,363 78,672,090 86,539,299 95,193,228 104,712,551Revenue Grants 19,904,833 22,030,459 29,873,051 33,146,857 38,139,339 42,162,714 46,378,985 51,016,884 56,118,572 61,730,429TOTAL REVENUE (A) 57,507,126 63,420,345 70,764,822 82,603,269 100,061,487 110,277,077 125,051,075 137,556,182 151,311,800 166,442,980
RECURRENT EXPENDITURE
Personnel Expenditure 32,996,352 37,184,421 42,195,391 43,729,126 51,106,320 56,216,952 61,838,647 68,022,511 74,824,762 82,307,239Other Expenditure 10,820,367 20,565,607 24,982,818 21,057,925 23,263,368 25,589,704 28,148,675 30,963,542 34,059,896 37,465,886Establishment 43,816,718 57,750,028 67,178,209 64,787,050 74,369,687 81,806,656 89,987,321 98,986,053 108,884,659 119,773,125Repairs & Maintenance 2,535,941 3,847,747 4,829,696 8,132,035 6,165,030 6,781,533 7,459,686 8,205,654 9,026,220 9,928,842Existing interest Payments - - - - - - -O&M of Proposed Project 1,500,000 1,605,000TOTAL EXPENDITURE (B) 46,352,660 61,597,775 72,007,905 72,919,086 80,534,717 88,588,188 97,447,007 107,191,708 119,410,879 131,306,967
OPERATING SURPLUS (A-B) 11,154,467 1,822,570 (1,243,083) 9,684,184 19,526,771 21,688,889 27,604,067 30,364,474 31,900,922 35,136,014TE / TR = (B / A) 80.6% 97.1% 101.8% 88.3% 80.5% 80.3% 77.9% 77.9% 78.9% 78.9%
CAPITAL ITEMS - - - - - - - - - -
CAPITAL REVENUE
(a) Grant 23,500,943 42,795,342 38,763,469 32,634,073 13,783,780 - -
Grants for LGEP Subprojects 12,500,000 37,500,000TOTAL 23,500,943 42,795,342 38,763,469 32,634,073 13,783,780 - 12,500,000 37,500,000 - -
CAPITAL EXPENDITURE
(a) Project Expenditure 12,500,000 37,500,000(b) Others 22,508,489 50,366,725 90,911,430 53,401,673 24,686,898 - - - -TOTAL ( D ) 22,508,489 50,366,725 90,911,430 53,401,673 24,686,898 - 12,500,000 37,500,000 - -
CAPITAL SURPLUS ( C-D ) 992,453 (7,571,383) (52,147,961) (20,767,600) (10,903,118) - - - - -Opening balance of cash ( E ) - 12,146,920 6,398,107 (46,992,936) (58,076,353) (49,452,700) (27,763,811) (159,744) 30,204,731 62,105,652NET SURPLUS F = ( ( A-B ) + ( C-D ) ) 12,146,920 (5,748,812) (53,391,044) (11,083,416) 8,623,653 21,688,889 27,604,067 30,364,474 31,900,922 35,136,014( Operating Surplus+ Capital Surplus)
CLOSING BALANCE (G) = (E+F) 12,146,920 6,398,107 (46,992,936) (58,076,353) (49,452,700) (27,763,811) (159,744) 30,204,731 62,105,652 97,241,666

16
2017 2018 2019 2020 2021 2022 2023 2024 2025 2026
Own Source 115,183,806 133,037,296 146,341,026 160,975,129 177,072,641 194,779,906 224,970,791 247,467,870 272,214,657 299,436,123Revenue Grants 67,903,472 74,693,819 82,163,201 90,379,521 99,417,473 109,359,221 120,295,143 132,324,657 145,557,123 160,112,835TOTAL REVENUE (A) 183,087,278 207,731,116 228,504,227 251,354,650 276,490,115 304,139,126 345,265,934 379,792,527 417,771,780 459,548,958
RECURRENT EXPENDITURE
Personnel Expenditure 90,537,963 99,591,759 109,550,935 120,506,028 132,556,631 145,812,294 160,393,524 176,432,876 194,076,164 213,483,780Other Expenditure 41,212,475 45,333,722 49,867,094 54,853,804 60,339,184 66,373,102 73,010,413 80,311,454 88,342,599 97,176,859Establishment 131,750,437 144,925,481 159,418,029 175,359,832 192,895,815 212,185,397 233,403,936 256,744,330 282,418,763 310,660,639Repairs & Maintenance 10,921,726 12,013,899 13,215,289 14,536,817 15,990,499 17,589,549 19,348,504 21,283,354 23,411,690 25,752,859Existing interest Payments
O&M of Proposed Project 1,717,350 1,837,565 1,966,194 2,103,828 2,251,096 2,408,672 2,577,279 2,757,689 2,950,727 3,157,278TOTAL EXPENDITURE (B) 144,389,513 158,776,944 174,599,512 192,000,477 211,137,410 232,183,618 255,329,719 280,785,373 308,781,180 339,570,776
OPERATING SURPLUS (A-B) 38,697,765 48,954,171 53,904,716 59,354,173 65,352,705 71,955,508 89,936,214 99,007,154 108,990,600 119,978,182TE / TR = (B / A) 78.9% 76.4% 76.4% 76.4% 76.4% 76.3% 74.0% 73.9% 73.9% 73.9%
CAPITAL ITEMS - - - - - - - - - -
CAPITAL REVENUE
(a) Grant - - - - - - - - - -Grants for LGEP Subprojects
TOTAL - - - - - - - - - -
CAPITAL EXPENDITURE
(a) Project Expenditure
(b) Others - - - - - - - - - -TOTAL ( D ) - - - - - - - - - -
CAPITAL SURPLUS ( C-D ) - - - - - - - - - -Opening balance of cash ( E ) 97,241,666 135,939,431 184,893,602 238,798,318 298,152,491 363,505,196 435,460,704 525,396,919 624,404,073 733,394,673NET SURPLUS F = ( ( A-B ) + ( C-D ) ) 38,697,765 48,954,171 53,904,716 59,354,173 65,352,705 71,955,508 89,936,214 99,007,154 108,990,600 119,978,182( Operating Surplus+ Capital Surplus)
CLOSING BALANCE (G) = (E+F) 135,939,431 184,893,602 238,798,318 298,152,491 363,505,196 435,460,704 525,396,919 624,404,073 733,394,673 853,372,855

17
9. Reform Plan
One of the objectives of the LGESP is to enhance the technical, managerial and financialcapacities of the Local Authorities and this Component has been designed to overcome thecapacity constraints in provision of infrastructure and managing growth and service delivery.This reform plan focuses on addressing the issues in the Seethawakka PS in achieving theabove objective.
The Reform Plan identifies the actions to be taken to improve the service delivery, financesand governance. Select indicators have been identified for the monitoring of the effectiveimplementation of the reform plan. The Reform Plan was prepared by the LA with guidancefrom the consultants and the same was approved by the Council through a Councilresolution.
The key reforms contemplated are linked to the subproject and include larger reformsespecially in improving water services and overall revenue enhancements.
i. Implementation of SWM Planii. Revenue enhancements andiii. Participate in the proposed re-engineering processes.

18
Sample Activities (Indicators) MinimumRequirements
Actions Base Line2011
Target Year Remarks
(i) Improving Service Delivery:Solid waste management1 IEC program implementation for
source segregation and promotion ofrecycling
Commitment offunding forcommencement ofactivities
Organize consultationmeetings at communitylevels.
No programs Allcommunitiesin townshipareascovered
July 2013
3 Install a waste recycling and recoveryfacility (identification of suitable site)
Initiation of solid wastemanagement/improvement
Proposed compost plant atlandfill site
Site forcompost plantidentified atKaradiyana,/KosgamaKatiyanawatte
Compostplant fullyoperational by2013
December 2013 Will address wastesegregation as part ofIEC and proposeddoor-to-doorcollectionarrangement.(See Item 6)
4 Promotion of household or communitylevel composting (tons/day of wastecomposted)
Decision will be made afterthe IEC activities.
Will report progressbased on annualreform planmonitoring.
5 Door-to-door collection in townshipareas (Percentage populationcovered)
Commence door-to-doorcollection in high densityareas.
Collection isout-sourcedto privateparty
Launch wastecollection
2013 Annual report onactivity/facilityperformance
6 Project proposal Environment Licensefrom CEA (alreadyobtained)
Design and constructionof compost facility
Operation of the facility
No compostfacility
Compostplant fullyoperational by2013 (8 tonsper week)
June 2013
December 2013
LA will seek fundfrom other resources
Water Supply and Sanitation1 Expansion/development of the water
supply system network (householdsserved)
LA does not provideWater supplyservices
2 Development of public sanitationfacilities that take account of theneeds of women, children, anddisabled
Construction of toilets inpola and town centres
Available intown centres
Functionaltoiletsconstructed
2014 LA will seek fundfrom other resources
3 Health and hygiene educationprograms in communities and/or
To coordinate IEC withDistrict Hospital
Implementedon ad-hoc
Implementedcontinuously

19
Sample Activities (Indicators) MinimumRequirements
Actions Base Line2011
Target Year Remarks
schools basisRoads and bridges1 Improvement of roads system The development plan has
included a list of roads to bedeveloped /improved.Initiate design of works andcomplete implementation
Roadinventoryprepared
List of priorityroads to berehabilitatedin next 5yearsprepared
2014 Efforts will be madeto receive fundingfrom other sources.
Local authority facilities1 Improvement of public market facilities Design and construction
of the marketimprovement
Operation of the markets Develop revenue and
O&M plan
Polas in poor
and
congested
conditions.
Improved
pola in
Kosgama
Subject to
availability of
funds
LA will seek fundfrom other resources
Social services
1 Improvement of health, library,computer services etc
Design and constructionof the buildingimprovement
Operation of the building Develop revenue and
O&M plan
First phasecompleted
Library infunctional
2014 Subproject proposed
(ii) Streamlining taxation, licensing, and approval systems and processes:Revenue management1 Development of fiscal database of
assessment, licenses and trade
establishments, and introduction of
computerized billing system
Request to PMU forsupport
Nominate a nodal officerfor this activity.
No databases
Completion ofdatabases
Oct 2011
Dec 2013
Define schedule inconsultation withPMU.
Revenue enhancement in the medium-term1 A series of measures to increase the
revenue from assessment taxPutting in placemeasures for medium-term revenueenhancement
i. Increase collection bydeploying collectors
Revenue in2011 is SLRs.11.8 million
Currentcollectionefficiency is45%
Increase theown sourcerevenue by25% in nextfive years.
Target 90%Collection
2016 Presentation ofDemand CollectionBalance Statementas part of AnnualBudgetSee commitment toimprove database.
2 Measures to increase revenue from Introduce Business Tax and Revenue from Increase by Annual Initiate actions once

20
Sample Activities (Indicators) MinimumRequirements
Actions Base Line2011
Target Year Remarks
other sources (rentals, licenses, courtfines, etc)
bring all unregisteredbusiness premises under thetax net in the area in next 5years.
business taxand tradelicense in2011 is SLRs1.4 million
10% annually amendments are inplace.See commitmentabove on improvingdatabase.
3 Annually revise the rent andachieve 30% over 5 years(particular focus on polamarkets to be improved)
Revenue fromrent in 2011 is15 million
Achieve 30%increase
2016 See commitmentabove on improvingdatabase.
4 Preparation of financial projections for
both revenue and expenditure for the
next 5 years
Demonstration that thetotal revenues willcover the totalexpenditures in themedium-term
Ensure assets aremaintained and generatesufficient revenues.
Positivesurplus in2011
Continue Annual See measures toimprove basic taxesand rents.
Process reengineering1 Review of the tax, licensing and
approval procedures and simplifyingthe procedures
Clear commitment tosimplify theprocedures
Commitment to implementthe process reengineeringmeasures- council resolutionand nomination of nodalofficer
March 2013 Council Resolutionpassed.Await guidance fromPMU on schedule ofprogramimplementation
(iii) Ensuring the effective management of infrastructure/facilities:O&M Plan1 O&M plan to effectively manage the
assets of local authority (Percentageallocated for O&M out of totalexpenditure)
O&M plan thatdemonstrates amechanism to ensureadequate budgetallocation for O&M ofinfrastructure andfacilities, includingthose proposed bythe local authority
List facility operationactions and O&M planincluding cost estimate
Annual budget allocation forO&M
No O&MPlanAd-hocbudgetallocation
3% of totalexpenditureallocated forO&M
2014 Synchronized withthe infrastructureimprovements to bemade under theproject.
Staff capacity1 Development of staff recruitment and
human resources development planRequest to CLG for newpositions
Initiate recruitment process Establishment
March2013
2014Subject to approval offinance for the project
(iv) Improving systems and managementAccounting1 Establishment of automated accounts Nominate Staff for
coordinationNotautomated
Completion June 2013 Support from Project
21
Sample Activities (Indicators) MinimumRequirements
Actions Base Line2011
Target Year Remarks
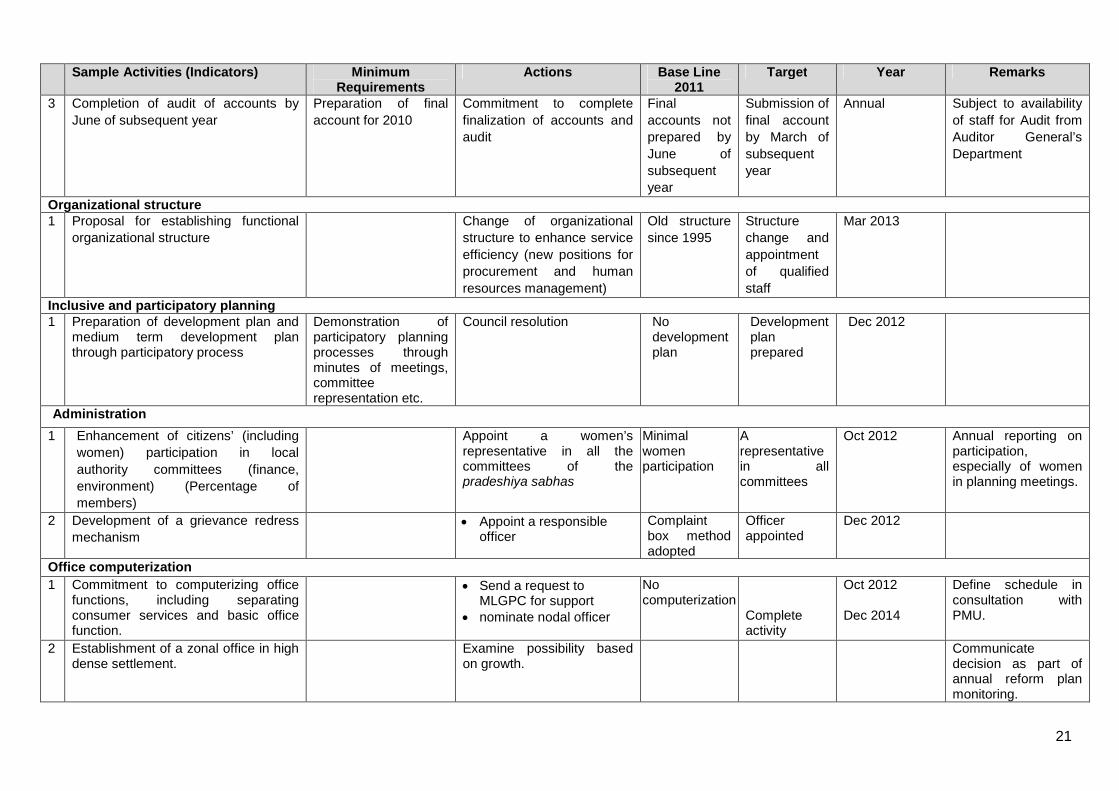
3 Completion of audit of accounts by
June of subsequent year
Preparation of final
account for 2010
Commitment to complete
finalization of accounts and
audit
Final
accounts not
prepared by
June of
subsequent
year
Submission of
final account
by March of
subsequent
year
Annual Subject to availability
of staff for Audit from
Auditor General’s
Department
Organizational structure1 Proposal for establishing functional
organizational structure
Change of organizational
structure to enhance service
efficiency (new positions for
procurement and human
resources management)
Old structure
since 1995
Structure
change and
appointment
of qualified
staff
Mar 2013
Inclusive and participatory planning1 Preparation of development plan and
medium term development planthrough participatory process
Demonstration ofparticipatory planningprocesses throughminutes of meetings,committeerepresentation etc.
Council resolution Nodevelopmentplan
Developmentplanprepared
Dec 2012
Administration
1 Enhancement of citizens’ (including
women) participation in local
authority committees (finance,
environment) (Percentage of
members)
Appoint a women’srepresentative in all thecommittees of thepradeshiya sabhas
Minimalwomenparticipation
Arepresentativein allcommittees
Oct 2012 Annual reporting onparticipation,especially of womenin planning meetings.
2 Development of a grievance redress
mechanism Appoint a responsible
officerComplaintbox methodadopted
Officerappointed
Dec 2012
Office computerization
1 Commitment to computerizing officefunctions, including separatingconsumer services and basic officefunction.
Send a request toMLGPC for support
nominate nodal officer
Nocomputerization
Completeactivity
Oct 2012
Dec 2014
Define schedule inconsultation withPMU.
2 Establishment of a zonal office in highdense settlement.
Examine possibility basedon growth.
Communicatedecision as part ofannual reform planmonitoring.

22
Annex 1
Involuntary Resettlement Checklist for the Identified Subprojects
Name of the LA Seethawakka PS
Subproject Construction of Library
Probable Involuntary Resettlement Effects Yes NoNot
KnownRemarks
Involuntary Acquisition of Land
1. Will there be land acquisition?
2. Is the site for land acquisition known?
3. Is the ownership status and current usage ofland to be acquired known?
4. Will easement be utilized within an existingRight of Way (ROW)?
5. Will there be loss of shelter and residential landdue to land acquisition?
6. Will there be loss of agricultural and otherproductive assets due to land acquisition?
7. Will there be losses of crops, trees, and fixedassets due to land acquisition?
8. Will there be loss of businesses or enterprisesdue to land acquisition?
9. Will there be loss of income sources andmeans of livelihoods due to land acquisition?
Involuntary restrictions on land use or on access to legally designated parks and protectedareas
10. Will people lose access to natural resources,communal facilities and services?
11. If land use is changed, will it have an adverseimpact on social and economic activities?
12. Will access to land and resources ownedcommunally or by the state be restricted?
Information on Displaced Persons:
Any estimate of the likely number of persons that will be displaced by the Project? [X] No [ ] Yes
If yes, approximately how many? ______________________
Are any of them poor, female-heads of households, or vulnerable to poverty risks? [X] No [ ] Yes
Are any displaced persons from indigenous or ethnic minority groups? [X] No [ ] Yes
Prepared By Eng. Weerasinghe Checked By Mr. Mukundan
Location Hanwella Date and Time 7th
May 2012
Signature

23
Annex 2
Summary of Consultations and Participation
Project Cycle Target Group Consultation ToolsConsultation And Participation
TopicsIndicators
Sources OfVerification
Responsibility
Planning Stage Beneficiaries includingwomen, youth, andmarginalized socialgroups
Focus groupdiscussions
Overview of the proposed projectand interventions – See Annex 2.2(Power point presentation)
Definition of issues and constraintsin access to services and resources
List of needs and initial prioritization Reform Plan
A series of FGD wasconducted on 7
thMay
2012 Number of meetings with
stakeholders 01 8 women of the total 16
participants.
See Annex2.1 List ofconsultationsandparticipants.
LA officials andConsultant
Electedrepresentatives /leaders of LocalAuthorities (LAs)
Council levelmeetings andpresentations
Civil SocietyOrganizations-Women’s society/youth` associations ,Others as identified
Key informantinterviews withleaders (See Annex2.3)
Local registeredNGO’s
Focus groupdiscussions
Traders association Focus groupdiscussions
Academic institutions Focus groupdiscussions
Electedrepresentatives /leaders of LocalAuthorities (LAs)
Class roomdiscussions fororientation andtraining
Orientation/training of localauthorities’ leaders in participatoryapproaches, decision making andM&E
chairman participatedseveral meetings/discussions at severallevels
CLG, PMU.Need moreorientation onM&E
Sub-projectidentificationstage
Beneficiaries includingwomen, youth, andmarginalized socialgroups such as RDS,WRDS
Focus groupdiscussions Open house
meetings
Overview of service requirements Sub-project selection criteria Reason for prioritizing the sub-
project improvements / benefits
envisaged User contribution requirements Implementation schedules and
arrangements Willingness to pay assessments Possibility of community
participation in O&M
A stakeholder meeting atthe PS office anddiscussions in randomlocations (near to theproposed sites) wereconducted.Following matters werediscussed
No open end questionswere asked. Discussionsmostly focused on theidentified subprojects.
Local Authority(assisted byPMU, SPCUDSC)
Electedrepresentatives /leaders of LAs
Key informantinterviews
Informationleaflets aboutsub-project andbenefits SeeAnnex 2.4
Open house

24
Project Cycle Target Group Consultation ToolsConsultation And Participation
TopicsIndicators
Sources OfVerification
Responsibility
meetingsPublic agreed that, thelibrary is a pressing needof the town.
Hanwella is a busy busstand, but no facilitiesavailable
Kosgama pola is one ofthe largest Polas in thedistrict, needimprovements. . .
Civil SocietyOrganizations-Women’s society/youth associations ,Others as identified
Informationleaflets aboutsub-project andbenefits
Open housemeetings
Traders association Informationleaflets aboutsub-project andbenefits
Open housemeetings
Academic institutions Informationleaflets aboutsub-project andbenefits
Open housemeetings
User Group Focus groupdiscussions
O&M issues, structure ofarrangement and agreements.
Consultations held at thesites1. The librarian
expressed thedifficulties of cateringthe demand fromlimited office facilities
LA andConsultants

25
Annex 2.1
Attendance Sheet of the Stakeholder Meeting

26
Annex 2.2
Presentation for the stakeholders and Key informants

27

28
Annex 2.3
Summary of the Key Informants discussion
The interviews with the key informants were held as combined meetings and individualinterviews.
List of InformantsName Position/Institution
Mr. Jayantha Rohan Chairman - PSMr. KAC. Chandana Padmasiri SecretaryMr. D. Gamini Welipala Vice ChairmanChristy M. Soysa Secretary – Three wheel owners societyWAAJ. Wanasundara Treasurer- Three wheel owners societyThilak Jawasantha Chairman - Three wheel owners societyMs. MVP. Indrani ResidentSeetha Padmini Wijethunga Resident
Summary of Discussions
The project was briefed to the informants and their views were sought. Common views of theinformants are listed below.
1. Informants are happy with the grant funds for the infrastructure development2. Need to develop the bus stand3. Infrastructure to develop the economic activities is a prime need of the area (facilities
such as economic center, polas etc)
The specific suggestions given by the informantsInformant SuggestionsChairman - PS LA got a loan of 50 milion and completed
the first phase of the office building. Needto complete the library section.
Librarian The current library is struggling to cater thedemand due to lack of space and facilities.
Three wheel owners society Even though the bus stand is extremelybusy, and other infrastructures around thestand are built, the bus stand is not builtyet.
Vice chairman and others Kosgama Pola needs rehabilitation

29
Annex 2.4
Leaflet on Subproject Selection (English Version)
Asian Development Bank FundedLocal Government Enhancement Sector Project
(Puraneguma)
Selection Guidelines for the subprojects
1. Eligible Sectorsa. Environmental Infrastructure – Water, Sanitation, Drains and Solid Waste
Managementb. Social Infrastructure- Community facility, Primary Health Carec. Growth Infrastructure- Roads and Bridgesd. Economic Infrastructure- Rural Markets / Pola
2. Please select sustainable subprojects
3. Subproject with less negative environmental and social impacts
4. Try to avoid subprojects which involves resettlement
5. Terms of Granta. Commitment to reform actions. Priority action should be to improve waste
management services and in streamlining taxation systems.b. Demonstrate financial capacity towards O&M of the facility/ infrastructure
createdc. Economic returns greater than 12% or returns greater than opportunity cost of
capitald. Approved project costs with resources committed for activities such as
resettlement if any.
6. Water, Sanitation, Drains and Solid Waste Managementa. LA must have a SWM action plan in order to obtain fundb. Select Water & Sanitation subprojects based on number of beneficiary,
availability of sustainable source and the capital cost – ensure the capacity ofthe LA to operate and maintain
c. Discourage building construction subprojectsd. Select roads and bridges based on the priority (usage, condition etc) –
Selected roads to be rehabilitated entirely. No pieces and small portions.e. Pola – Can select Weekly pola not commercial complex nor super marketsf. Discourage procurement of machineries (if selected, provide proper
justification)g. Ensure ownership of all the asset to be created and ownership of the
proposed lands is with the PS
30
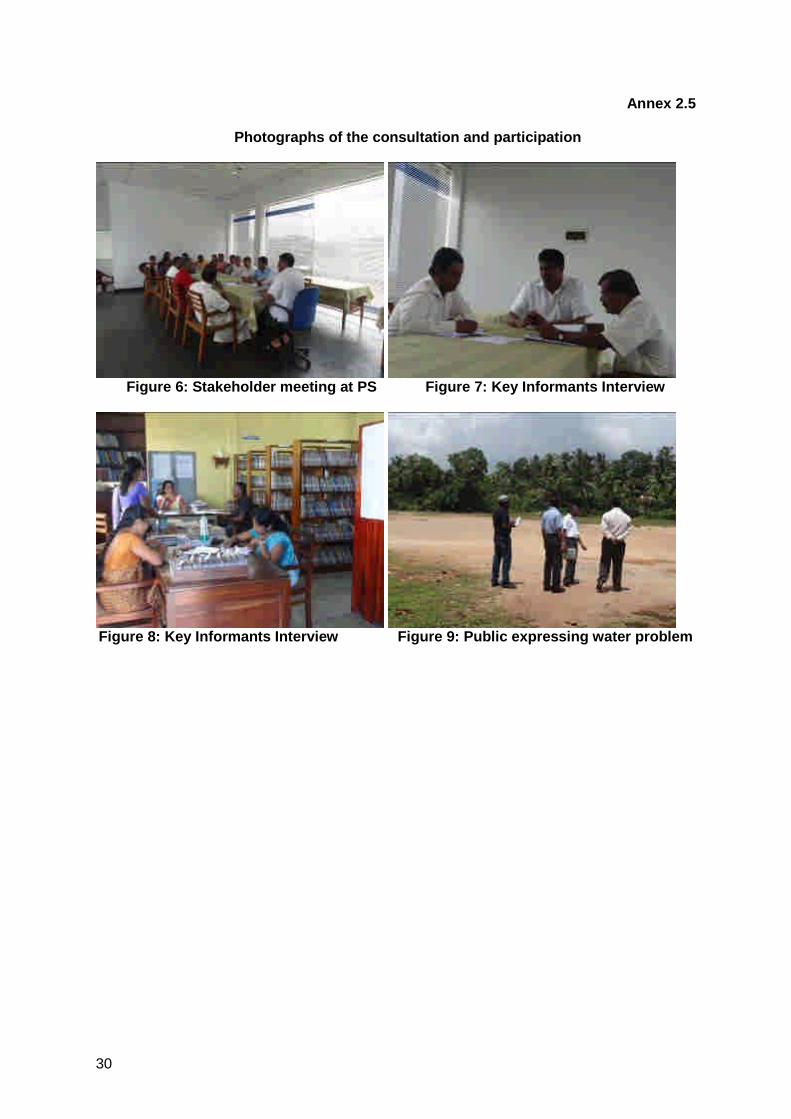
Annex 2.5
Photographs of the consultation and participation
Figure 6: Stakeholder meeting at PS Figure 7: Key Informants Interview
Figure 8: Key Informants Interview Figure 9: Public expressing water problem