pre-adoption market reaction to ifrs 9: a cross-country
TRANSCRIPT
1
Pre-adoption market reaction to IFRS 9:
A cross-country event-study
Enrico Onali a,+
, Gianluca Ginesti b
a Bangor Business School, Bangor University, Hen Goleg, College Road, Bangor LL57 2DG,
United Kingdom. b
Department of Economics, Second University of Naples, Corso Gran Priorato di Malta,
Capua (CE) 81043, Italy. +
Corresponding author: [email protected]; Tel: +44(0)1248383650.
Abstract
We are the first to examine the market reaction to 13 announcement dates related to IFRS 9 for over 5,400 European listed firms. We find an overall positive reaction to the introduction
of IFRS 9. The regulation is particularly beneficial to shareholders of firms in countries with
weaker rule of law and a smaller divergence between local GAAP and IAS 39. Bootstrap simulations rule out the possibility that sampling error or data mining are driving our findings.
Our main findings are also robust to confounding events and the extent of the media coverage
for each event. These results suggest that investors perceive the new regulation as
shareholder-wealth enhancing and support the view that stronger comparability across accounting standards of European firms is beneficial to international investors and outweighs
the costs of poorer firm-specific information.
Keywords: financial instruments; IFRS 9; event study; international financial reporting
standards
© 2015, Elsevier. Licensed under the Creative Commons Attribution-NonCommercial-NoDerivatives 4.0 Internationalhttp://creativecommons.org/licenses/by-nc-nd/4.0/

2
“The FASB and IASB have heard the urgent call for an improved, converged approach to
impairment of debt instruments. We are keenly interested in whether investors think this
revised approach provides relevant and timely information about credit losses […]".
Leslie Seidman (Chairman of FASB, 2010-2013), January 31, 2011
“IFRSs are primarily aimed at investors and creditors. And we really need to know what you—the primary users of financial statements—want.”
Ian Mackintosh (Vice-chairman of IASB), August 5, 2011
1. Introduction
What does the market think about the new potential accounting regime for
financial instruments (IFRS 9)? Do national characteristics of the country where the
firm is domiciled affect investors’ reaction? These questions are key to understanding
the potential impact of the IFRS 9 adoption in the European Union (EU) on
international investors. The replacement of IAS 39 with IFRS 9 is one of key topics in
the agenda of International Accounting Standards Board (IASB). At the G-20
summits in 2009, world leaders called for improvements of IAS 39. The role of IAS
39 for financial stability has generated a lively debate even among academics (Laux
and Leuz, 2009 and 2010; Barth and Landsman, 2010; Laux, 2012), because IAS 39 is
widely considered to be a controversial accounting standard, largely due to its
complexities (Armstrong et al., 2010; Paananen et al., 2012). Advocates of the reform
claim that IFRS 9 reduces and simplifies the many rules in IAS 39, and increases
cross-country comparability. Therefore, IFRS 9 should decrease the degree of
asymmetric information, especially for international investors, and increase the value
relevance of accounting data for investment decisions (Chen et al., 2013). Eventually,
this should lead to lower cost of capital (Armstrong et al., 2010). Simplifying IAS 39
is a key innovation: Dichev et al. (2014) find that CFOs view favorably a reduction in
the number of rules promulgated by standard setters, and support convergence
between IFRS and U.S. GAAP. However, convergence could also be costly for
investors, because of a decrease in the quality of firm-specific information (Ding et
al., 2007), and a decrease in the comparability of financial accounts before and after
the reform. Moreover, managers point out high costs of adoption and compliance for
firms, and investor confusion (Dichev et al., 2014).
A better understanding of capital market outcomes of IFRS reporting is of
fundamental importance to researchers, policy makers and regulators (Christensen et
al., 2013). Despite the interest generated among policy makers and academics, it is
unclear whether investors think that the current proposals for amendments of
accounting for financial instruments incorporated in IFRS 9 are beneficial. Changes in
accounting regulation cannot be considered independent of country-specific
institutional characteristics (Leuz, 2010). For this reason, heterogeneities in the
direction and magnitude of the reaction may exist due to a different legal framework
and degree of law enforcement (La Porta et al., 1998; La Porta et al., 2006; Armstrong
et al., 2010), and confidence in the rules of society (i.e. rule of law) across different
countries in the EU. The degree of divergence between international accounting
standards and local GAAP can also play a role, because the costs of convergence can
be higher for countries with larger divergence between local accounting standards and
international accounting standards (Ding et al., 2007).

3
Regulatory reforms can be a way to extract wealth from competitors and to
estimate the impact of new regulation it is often necessary to examine price reactions
before the law is implemented (Stigler, 1971; Schwert, 1981). Recent papers in the
accounting and finance literature have employed event study methodology to assess
investors’ perception of the effects of regulatory changes (Berkman et al., 2011;
Bowen and Khan, 2014).
Our paper is strongly related to a study by Armstrong et al. (2010), who find a
positive market reaction to mandatory IFRS adoption, especially for firms with lower
information quality and higher information asymmetry in the pre-adoption period.
Armstrong et al. (2010) also report an even stronger (and positive) reaction for banks
with poor information quality, suggesting convergence benefits arising from IAS 39.
However, Armstrong et al. (2010) consider announcements until November 2005, and
therefore neglect the impact of announcements specifically related to IFRS 9 (which
was issued in November 2009). In this paper, we aim to extend Armstrong et al.
(2010), by examining how investors react to IFRS 9. This topic is important, because
IFRS 9 is yet to be implemented, and the standard-setting process is still ongoing.1
Moreover, investors’ expectations regarding IFRS 9 can now incorporate ex-post
perceptions of the effects of the mandatory IFRS adoption, and thus our results could
differ from those in Armstrong et al. (2010).
We analyse what country characteristics explain the cross-sectional variation in
stock price reaction to the potential adoption of IFRS 9 using data for over 5,400
firms from 17 EU countries. We focus on the EU because it offers a unique setting:
Mandatory adoption of IFRS rules for consolidated accounts of EU listed firms occurs
for all countries in the same period. Our findings indicate that investors react
positively to the ongoing accounting reform, especially for firms domiciled in
countries with a weak rule of law and a small divergence between local accounting
standards and IAS 39.2 We estimate that the market reaction to an increase in the
likelihood of the replacement of IAS 39 with IFRS 9 produces a total cumulative
abnormal return of around 10%. Even after controlling for potential confounding
events and the extent of media coverage for each event, the total cumulative return is
above 4%. These findings bear important policy implications, because they constitute
a first attempt at measuring the potential benefits and costs of implementing IFRS 9.
We are aware of the controversy regarding the ability of changes in external
financial reporting quality to impose first-order effects on firm value (Zimmerman,
2013). However, it is an empirical question whether announcements regarding IFRS 9
have been perceived by international investors as value-enhancing, due to improved
transparency of financial accounts across different countries. For example, Chen et al.
(2013) provide evidence of positive externalities of IFRS adoption: Improved
disclosure quality leads to higher investment efficiency.
1 IASB divided the IFRS 9 project into three phases: 1. Classification and measurement; 2. Amortized
cost and impairment; 3. Hedge accounting. IASB has postponed the mandatory date for adoption of
IFRS 9 (which originally was set to be on 1 January 2013) to a future date. 2 Note that, unlike Ding et al. (2007), who investigate the divergence between domestic accounting
standards and international accounting standards as a whole, we focus specifically on divergence
between domestic accounting standards and IAS 39.

4
In our econometric analysis, as suggested by Zimmerman (2013), we very
carefully check that our results are not driven by endogeneity, omitted variables, or
selection bias. First, we use the population of listed firms in the 17 EU countries
under examination (the same countries investigated by Chen et al., 2013). This
reduces considerably the possibility of sample selection bias. Second, we carefully
screen the event windows for confounding events. Finally, we employ bootstrapping
to ensure that our results are not driven by sampling error or data mining.
The remainder of this paper is organized as follows. Section 2 describes the data
and methodology. Section 3 discusses the empirical results. Section 4 concludes the
paper.
2. Data and methodology
All financial data items used in this study were obtained from Thomson Reuters
Datastream and Amadeus Bureau van Dijk databases. Table 1 reports the sample
composition in terms of country of origin of the firms examined.
[TABLE 1: Sample composition by country]
To select the events, we start from 15 July 2009 (the day after a proposal by
IASB to improve financial instruments accounting – IASB, 2009), and we consider
events until 31 December 2012. We select event dates that refer exclusively to official
announcements and initiatives by IASB and European Financial Reporting Advisory
Group (EFRAG). Such announcements bear a strong influence on debates in the
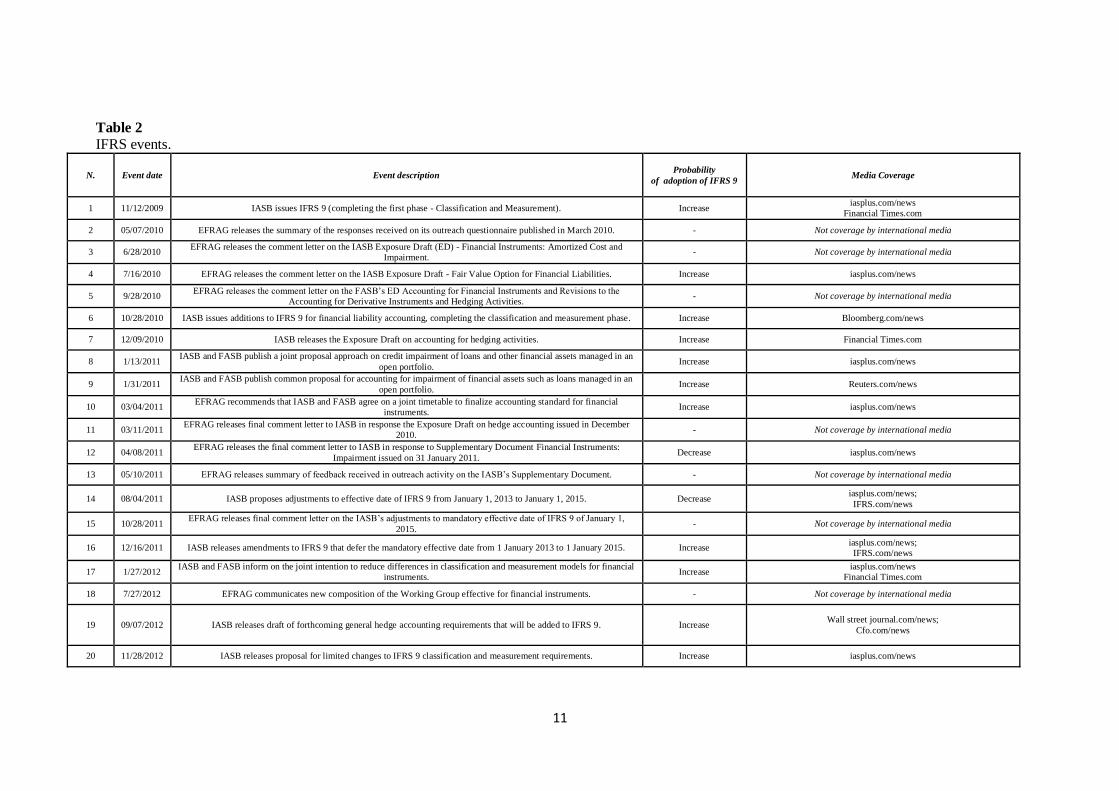
media regarding IFRS 9. We find 20 such events: The first event occurs when IASB
issues IFRS 9, on November 12, 2009 (IASPlus, 2009). The last event takes place on
November 28, 2012. Then, we further investigate the extent to which these events
convey significant information to the market, by carefully searching in major
international accounting and business media news related to each of the 20
announcements. We find substantial international media coverage in the week of the
event for 13 of the 20 events originally included in our analysis.3 Tables 2 and 3
report all 20 events (both with and without media coverage), and a description of the
variables under examination, respectively. In the subsequent econometric analysis, we
include only the 13 events with media coverage in the estimation of the market
reaction to IFRS 9. We assess 11 events as increasing the likelihood of IFRS 9
adoption according to the original schedule, and two events as decreasing it. These
two events occur on April 8, 2011, and August 4, 2011. In the first case, EFRAG
expresses concerns on the IASB-Supplementary Document Financial Instruments:
Impairment, because of the proposal to set a floor for credit losses provisions, and
calls the IASB to clarify aspects of the revised impairment model and to conduct
field-testing, prior to issuing the final standard. Subsequently, on August 4, 2011,
3 We use the following websites: Financial Times, Bloomberg, Reuters, Wall Street Journal,
Iasplus.com, IFRS.com and CFO.com. We employ a variety of keyword searches to assess the
international press coverage of 20 events selected in the first stage of the selection process. In
particular, we use the following keywords: “IFRS 9”, “Accounting for financial instruments”, “IAS
39”, “IAS 39 reform”, “IASB accounting reform”.

5
IASB indicates its intention to postpone the mandatory effective date of IFRS 9
previously set to take place on January 1, 2013.4
Therefore, both these events are associated with a decrease in the likelihood of
IFRS 9 adoption according to the original schedule.
[TABLE 2: IFRS 9 events]
[TABLE 3: Variables description]
After identifying the relevant event dates, we implement our event study.
First, we estimate the average market reaction to the regulation. Following
Armstrong et al. (2010), we calculate, for each event, the difference between the 3-
day log return of a market-value weighted portfolio comprising the 5,480 firms in our
sample and the log return of the proxy for the market portfolio (DJ STOXX Global
1800 Index Ex Europe). This proxy comprises the 1,800 world largest international
firms excluding the European firms in the index (Armstrong et al., 2010). Then, we
test whether the average 3-day market-adjusted returns (MARs) are significant.
Similar to Armstrong et al. (2010), we multiply by minus one the MAR for events
with a negative effect on the likelihood of IFRS 9 adoption.
Second, we measure the impact of three country-specific institutional factors (see
Table 3): Rule of law, Divergence, and Public enforcement. First, we rank each
country in terms of each of these institutional factors.5 Then, we construct market-
value weighted portfolios of firms located in countries in the upper and lower portion
of the distribution, and we calculate the 3-day MAR for each of these two portfolios.6
For convenience, we name the portfolio of firms in countries in the upper part of the
ranking ‘high’ portfolio, and the portfolio of firms in the lower part of the ranking,
‘low’ portfolio. To extrapolate the impact of the institutional factors on the price
reaction, we estimate the difference between the 3-day MAR for the ‘high’ and ‘low’
portfolios for each institutional factor (difference-in-MAR, henceforth DMAR).7 This
technique produces the MAR of a trading strategy where we are long on firms in high-
ranked countries and short on firms in low-ranked countries, for each institutional
4 For the 12th event in the original list of 20 events: “EFRAG does not support the proposals in relation to the “floor”, and urges the IASB to clarify the objectives of the revised impairment model and to field
test the proposals prior to finalising the standard.” (EFRAG, 4/8/2011). For the 14th event in the
original list of 20 events: “The International Accounting Standards Board (IASB) published today for
public comment an exposure draft of proposals to adjust the mandatory effective date of IFRS 9
Financial Instruments. The exposure draft proposes an effective date of 1 January 2015 (currently 1
January 2013) for IFRS 9.” (IASB, 8/4/2011). 5 For Rule of law, which is time-varying, we perform the ranking for each year. For Divergence and
Public enforcement, which are time-invariant, the ranking is the same for all periods. 6 The three variables are significantly correlated, but they are far from being the same. The pairwise
correlation coefficients are: 10.78% (Rule of law and Public enforcement), 31.91% (Rule of law and
Divergence), and 15% (Divergence and Public enforcement). 7 For example, in year 2009 the values for the variable Rule of law range from 0.3570 (Italy) to 1.9685 (Finland). The 95th percentile of the distribution of Rule of law for 2009 is 1.9521 (corresponding to
Sweden). Only firms in Finland have a larger value for Rule of law (1.9685, as said before). Therefore,
all firms in Sweden and Finland will be considered in the ‘high’ portfolio for year 2009. The
corresponding 5th percentile for 2009 is 0.3570 (Italy), and no other country has a lower value for Rule
of law in that year. Therefore, only Italian firms will be considered in the ‘low’ portfolio for 2009. For
another example of this procedure, see Berkman et al. (2011).

6
factor. In particular, we choose the 5th
and 95th
percentile of distribution as cut-off
points, and for robustness we also report the results for the 10th and 90
th percentile.
8
Comparing the MAR for firms in countries that are at the top and bottom of the
rankings ensures that the countries in the two clusters are in fact different in terms of
the institutional factor chosen. This increases the power of the test.
Finally, to give an indication of the overall impact of the reform, we also
compute the sum of the 3-day MAR for all 13 events for which there is media
coverage (3-day SMAR), and the sum of the difference-in-MARs for all 13 events (3-
day SDMAR). For the sake of brevity, we will henceforth refer to the statistics above
as MAR, DMAR, SMAR, and SDMAR, since they are all calculated using a 3-day
event window.
3. Results
In Table 4, we present the results for the MAR and SMAR for all the 5,480 firms
in our sample (second column), and the DMAR and SDMAR based on the selected
institutional factors. We also report the 1% and 5% bootstrapped critical values (for
two-tailed tests) for the SMAR and SDMAR (the results for the critical values for the
MAR and DMAR are the same, and are therefore not shown in the table). The
bootstrapped critical values are based on 1,000 replications. For each replication, we
select randomly 13 dates over the period from 15 July 2009 to 31 December 2012
(913 trading days). Panel A of Table 4 reports the results for the DMAR and SDMAR
using the 5th
and 95th percentile of the distribution of the institutional factors.
[TABLE 4: Stock market reaction to IFRS 9 adoption events]
The overall market reaction is positive and significant, suggesting that investors
perceive the new regulation as having a positive impact on shareholder wealth. The
average MAR is 0.0078, significant at the 5% level. The SMAR is 10%, or around
0.26% for each of the 39 days in the event window.9 The bootstrapped upper critical
value for the SMAR at the 5% significance level is 7.82%. Therefore, the overall
market reaction for the 13 events is statistically significant, and unlikely to be driven
by pure fluke or data mining. While a precise estimation of the economic magnitude
of shareholder wealth effects is difficult, a comparison of the estimated SMAR with
those of 1,000 randomized samples suggests that such magnitude is far from
8 For Public enforcement, using either set of cut-off points results in the same countries for the ‘high’
and ‘low’ portfolios. When we employ the 15th and 85th percentile as cut-off points, the results remain
qualitatively the same. However, we do not report the results for the sake of brevity. The results are
available upon request. 9 In particular, the overall reaction to events number 12 and 14, associated with an expected decrease in
the likelihood of the IFRS 9 adoption (see Table 2), is negative (-0.0155), while the overall reaction to
the events associated with an expected increase in the likelihood of the IFRS 9 adoption is positive
(0.0855). By multiplying by minus one the returns for events 12 and 14, we obtain: 0.0855 + 0.0155 =
0.101. For Rule of Law, the reaction to the “negative events” is positive (0.0005 for Panel A) and the
reaction to the “positive events” is negative (-0.0077 for Panel A): -0.0077 – 0.0005 = -0.0082 (because of rounding-off error, this is slightly different from the result reported in Table 4: -0.0083). For
Divergence, the reaction to the “negative events” is positive (0.0006) and the reaction to the “positive
events” is negative (-0.0048): -0.0048 – 0.0006 = -0.0054. For Public Enforcement, for which the
results are insignificant, we obtain a negative reaction to both types of events: -0.0008 for the “negative
events”, and -0.0024 for the “positive events”: -0.0024 + 0.0008 = -0.0016. The results for Panel B of
Table 4 are very similar, and are available upon request.

7
negligible: Of the 1,000 random samples of fictitious events generated through
bootstrap, only ten have a SMAR higher than 10%. Moreover, the average SMAR for
the 1,000 replications is -1.20%, the median -1.19%, and the maximum and minimum
values for SMAR are -18.88% and 12.12%, respectively. Therefore, our results are
not driven by our portfolio always outperforming the benchmark: on average, our
portfolio underperforms the benchmark.
The results for the DMAR and SDMAR show a stronger market reaction for
firms domiciled in countries with a low rule of law index (contrary to Armstrong et
al., 2010), and for firms domiciled in countries where there is weaker divergence
between local accounting standards and IAS 39. The results are significant at least at
the 5% level for both the average DMAR and the SDMAR. In particular, the SDMAR
for Rule of law is -0.0083 while the 1% lower critical value is -0.0063, and the
SDMAR for Divergence is -0.0054, while the 1% lower critical value is -0.0051. Note
that, for countries with high levels of Rule of law and Divergence, the results for both
the average MAR and the SMAR are insignificant, suggesting that the announcements
bear an impact only on firms in countries with weak Rule of law and a low
Divergence index. The variable Public enforcement does not bear any effect on the
reaction to IFRS 9 announcements. The results do not vary substantially when we
consider the 10th and 90
th percentile as cut-off points (Panel B of Table 4).
A possible limitation of an event study is that the estimation of the MAR may be
affected by confounding events. For this reason, we have chosen a short event
window, and we have focussed on events that have received attention from various
international accounting and business media. Some of the events described in Table 2
are covered only by the IASPlus website: iasplus.com. Many studies in the accounting
and finance literature identify this website as the most popular channel that
disseminates relevant information on IAS/IFRS (Lagoarde-Segot, 2009; Larson and
Street, 2011; Joos and Leung, 2013; Ramanna and Sletten, 2014). However, it is
likely that these events did not impact the market substantially, and confounding
events might have driven the price reaction. When we repeat the analysis after
excluding the five events in Table 2 covered only by the IASPlus website, we obtain a
much smaller (and more credible) result for the overall market reaction to the IFRS 9
adoption: 4.43% instead of 10.1%. The results for the DMAR and SDMAR remain
qualitatively the same, although their magnitude decreases.10
4. Conclusions
While much of the previous literature has examined the capital market effects
around the compulsory adoption of IFRS, the literature on IFRS 9 is sparse. In this
paper, we investigate the price reaction to news related to IFRS 9 adoption events.
Our findings suggest that investors reacted positively to the ongoing accounting
reform, particularly the shareholders of firms domiciled in countries with a weaker
10 We thank an anonymous referee for this suggestion. To further address this issue, we have scoured major international outlets for possible confounding events that might affect the estimation of the MAR
during the sample period using the LEXIS/NEXIS database. We have also exploited information
reported in Deloitte’s publication “Global Capital Markets Perspective for 2012”. We have identified
one important confounding event: the S&P downgrade of the U.S. sovereign credit rating, on 5 August
2011 (the day after the event number 14). Excluding this event from the analysis reduces the overall
market reaction from 10.1% to 8.16%.

8
rule of law (contrary to previous literature on IFRS adoption events) and weaker
divergence between local accounting standards and IAS 39. These results indicate that
investors are confident with the ability of IFRS 9 to address the problems inherent in
IAS 39 implementation, but cross-country differences are to be expected. Because
smaller divergence between local accounting standards and IAS 39 is associated with
poorer firm-specific information (Ding et al., 2007), our findings suggest that better
cross-country comparability outweighs the costs of poorer firm-specific information
for countries for which divergence between domestic accounting standards and IAS
39 is relatively small. Empirical studies could follow after the final implementation of
IFRS 9 to determine whether these expectations have been fulfilled, and if the market
reaction depends on specific firm characteristics in addition to country factors.
Finally, our results must be interpreted carefully, considering the limitations that
affect any event study.
Acknowledgements
We are grateful to the editors Martin Loeb and Larry Gordon and two anonymous referees for
their valuable comments and suggestions. We thank Klaus Schaeck and Giuseppe Sannino for helpful discussions. The usual disclaimer applies.
References
Armstrong, C., Barth, M., Jaqolinzer, A., Riedl, E., 2010. Market Reaction to the Adoption of IFRS in Europe. Account. Rev. 85 (1), 31-62.
Barth, M. E., Landsman, W. R., 2010. How did financial reporting contribute to the financial
crisis? European Account. Rev.19 (3), 399-423.
Berkman, H., Cole, R. A., Fu, L. J., 2011. Political Connections and Minority-Shareholder
Protection: Evidence from Securities-Market Regulation in China. J. Financ. Quantitative
Analysis 45, 1391-1417.
Bowen, R., Khan, U., 2014. Market reactions to policy deliberations on fair value accounting
and impairment rules during the financial crisis of 2008-2009. J. Account. Public Policy,
forthcoming.
Chen, C., Young, D., Zhuang, Z., 2013. Externalities of Mandatory IFRS Adoption: Evidence from Cross-Border Spillover Effects of Financial Information on Investment Efficiency.
Account. Rev. 88 (3), 881-894.
Christensen, H.B., Hail, L., Leuz, C., 2013. Mandatory IFRS Reporting and Changes in Enforcement. J. Account. Econ. 56, 147-177.
Dichev, I., Graham, J., Harvey, C., Rajgopal, S., 2014. Earnings quality: Evidence from the
field. J. Account. Econ. 56, 1-33.
Ding, Y., Hope, O., Jeanjean, T., Stolowy, H., 2007. Differences between Domestic Accounting Standards and IAS: Measurement, Determinants and Implications. J. Account.
Public Policy 26, 1-38.
Kaufmann, D., Kraay, A., Mastruzzi, M., 2011. The Worldwide Governance Indicators: Methodology and Analytical Issues. Hague J. Rule Law 3 (2), 220-246.
IASPlus (2009). IFRS 9 – Financial instruments. Available at:
http://www.iasplus.com/en/standards/ifrs/ifrs9.
International Accounting Standards Board (2009). IASB proposes improvements to financial
instruments accounting. IASB press release.
9
Joos, P. P. M., Leung, E., 2013. Investor Perceptions of Potential IFRS Adoption in the
United States. Account. Rev. 88 (2), 577-609.
Lagoarde-Segot, T., 2009. Financial reforms and time-varying microstructures in emerging
equity markets. J. Bank. Financ. 33, 1755-1769.
La Porta, R., Lopez-de-Silanes, F., Shleiffer, A., Vishny, R., 1998. Law and finance. J. Polit.
Econ. 106, 1113-1155.
La Porta, R., Lopez-de-Silanes, F., Shleifer, A., 2006. What Works in Securities Laws? J.
Financ. 61 (1), 1-32.
Larson, R.K., Street, D.L., 2011. IFRS Teaching Resources: Available and Rapidly Growing. Account. Education: an International J. 20 (4), 317-338.
Laux, C., Leuz C., 2009. The crisis of fair-value accounting: making sense of the recent
debate. Account. Organ. Soc. 34, 826-834.
Laux, C., Leuz, C., 2010. Did fair-value accounting contribute to the financial crisis? J. Econ.
Perspectives 24 (1), 93-118.
Laux, C., 2012. Financial Instruments, Financial Reporting, and Financial Stability. Account.
Bus. Res. 42 (3), 1-22.
Leuz, C., 2010. Different approaches to corporate reporting regulation: how jurisdictions
differ and why. Account. Bus. Res. 30 (3), 229-256.
Nobes, C. (Ed.), 2001. GAAP 2001 – a survey of national accounting rules benchmarked against international accounting standards. I. Forum Account. Development (IFAD).
Paananen, M., Renders, A., Shima Kim, M., 2012. The Amendment of IAS 39 Determinants
of Reclassification Behavior and Capital Market Consequences. J. Account., Auditing Finance 27(2), 208-235.
Ramanna, K., Sletten, E., 2014. Network Effects in Countries' Adoption of IFRS. The
Account. Rev., forthcoming.
Schwert, G. W., 1981. Using financial data to measure effects of regulation. J. Law Econ. 24, 121-158.
Stigler, G. J., 1971. The theory of economic regulation. Bell J. Econ. Manag. Sci. 2, 3-21.
Zimmerman, J. L., 2013. Myth: External Financial Reporting Quality Has a First-Order Effect on Firm Value. Account. Horizons 27, 887-894.

10
Table 1
Sample composition by country.
COUNTRY FIRMS
1 AUSTRIA 71
2 BELGIUM 152
3 DENMARK 138
4 FINLAND 112
5 FRANCE 811
6 GERMANY 999
7 GREECE 223
8 IRELAND 30
9 ITALY 232
10 LUXEMBOURG 11
11 NETHERLANDS 100
12 NORWAY 169
13 PORTUGAL 55
14 SPAIN 209
15 SWEDEN 445
16 SWITZERLAND 211
17 UNITED KINGDOM 1,512
TOTAL 5,480
11
Table 2
IFRS events.
N. Event date Event description Probability
of adoption of IFRS 9 Media Coverage
1 11/12/2009 IASB issues IFRS 9 (completing the first phase - Classification and Measurement). Increase iasplus.com/news
Financial Times.com
2 05/07/2010 EFRAG releases the summary of the responses received on its outreach questionnaire published in March 2010. - Not coverage by international media
3 6/28/2010 EFRAG releases the comment letter on the IASB Exposure Draft (ED) - Financial Instruments: Amortized Cost and
Impairment. - Not coverage by international media
4 7/16/2010 EFRAG releases the comment letter on the IASB Exposure Draft - Fair Value Option for Financial Liabilities. Increase iasplus.com/news
5 9/28/2010 EFRAG releases the comment letter on the FASB’s ED Accounting for Financial Instruments and Revisions to the
Accounting for Derivative Instruments and Hedging Activities. - Not coverage by international media
6 10/28/2010 IASB issues additions to IFRS 9 for financial liability accounting, completing the classification and measurement phase. Increase Bloomberg.com/news
7 12/09/2010 IASB releases the Exposure Draft on accounting for hedging activities. Increase Financial Times.com
8 1/13/2011 IASB and FASB publish a joint proposal approach on credit impairment of loans and other financial assets managed in an
open portfolio. Increase iasplus.com/news
9 1/31/2011 IASB and FASB publish common proposal for accounting for impairment of financial assets such as loans managed in an
open portfolio. Increase Reuters.com/news
10 03/04/2011 EFRAG recommends that IASB and FASB agree on a joint timetable to finalize accounting standard for financial
instruments. Increase iasplus.com/news
11 03/11/2011 EFRAG releases final comment letter to IASB in response the Exposure Draft on hedge accounting issued in December
2010. - Not coverage by international media
12 04/08/2011 EFRAG releases the final comment letter to IASB in response to Supplementary Document Financial Instruments:
Impairment issued on 31 January 2011. Decrease iasplus.com/news
13 05/10/2011 EFRAG releases summary of feedback received in outreach activity on the IASB’s Supplementary Document. - Not coverage by international media
14 08/04/2011 IASB proposes adjustments to effective date of IFRS 9 from January 1, 2013 to January 1, 2015. Decrease iasplus.com/news;
IFRS.com/news
15 10/28/2011 EFRAG releases final comment letter on the IASB’s adjustments to mandatory effective date of IFRS 9 of January 1,
2015. - Not coverage by international media
16 12/16/2011 IASB releases amendments to IFRS 9 that defer the mandatory effective date from 1 January 2013 to 1 January 2015. Increase iasplus.com/news;
IFRS.com/news
17 1/27/2012 IASB and FASB inform on the joint intention to reduce differences in classification and measurement models for financial
instruments. Increase
iasplus.com/news
Financial Times.com
18 7/27/2012 EFRAG communicates new composition of the Working Group effective for financial instruments. - Not coverage by international media
19 09/07/2012 IASB releases draft of forthcoming general hedge accounting requirements that will be added to IFRS 9. Increase Wall street journal.com/news;
Cfo.com/news
20 11/28/2012 IASB releases proposal for limited changes to IFRS 9 classification and measurement requirements. Increase iasplus.com/news

12
Table 3
Variables description. Variables Measurement Source
Rule of law This variable captures the degree to which agents trust the
rules of society, as well as quality of contract enforcement,
property rights, police, and the courts.
Kaufmann et al. (2011)
Divergence Similar to Ding et al. (2007), we obtain this variable from
the GAAP 2001 survey. This variable measures the extent
to which rules for the same item differ between domestic
accounting standards and IAS 39.
Nobes (2001)
Public enforcement The arithmetic mean of: Supervisor characteristic index,
investigative power index, orders index, and criminal
index, as defined in La Porta et al. (2006).
La Porta et al. (2006)

13
Table 4
Stock market reaction to IFRS 9 adoption events.
PANEL A
Market reaction Rule of law Divergence Public enforcement
3-day MARs A (High) B (Low) A – B (DMAR) A (High) B (Low) A – B (DMAR) A (High) B (Low) A – B (DMAR)
Cut-off points: 5th and 95th percentile
Sum of MAR 0.1010** 0.0010 0.0092*** -0.0083*** 0.0046 0.0103*** -0.0054*** 0.0153 0.0167** -0.0015
Average MAR 0.0078 0.0001 0.0007 -0.0006 0.0004 0.0008 -0.0004 0.0012 0.0013 -0.0001
Standard
Deviation MAR 0.0109 0.0008 0.0008 0.0007 0.0009 0.0008 0.0007 0.0021 0.0019 0.0011
t-stat 2.5591** 0.3396 3.1509*** -3.1062*** 1.3926 3.5503*** -2.1852** 1.9879* 2.4058** -0.3635
p-value 0.0238 0.7396 0.0077 0.0083 0.1871 0.0036 0.0478 0.0683 0.0317 0.7221
Critical values for SMAR and SDMAR: Two-tailed tests based on bootstrapping technique with 1,000 replications
Total Q(995) 0.1135 0.0058 0.0079 0.0073 0.0070 0.0085 0.0066 0.0222 0.0214 0.0090
Total Q(975) 0.0782 0.0040 0.0056 0.0053 0.0053 0.0066 0.0055 0.0169 0.0153 0.0067
Total Q(25) -0.1074 -0.0053 -0.0078 -0.0044 -0.0061 -0.0088 -0.0038 -0.0250 -0.0172 -0.0130
Total Q(5) -0.1534 -0.0086 -0.0111 -0.0063 -0.0099 -0.0119 -0.0051 -0.0350 -0.0242 -0.0168
Countries in upper and lower part of the distribution for Rule of law, Divergence, and Public enforcement
Countries in
‘high’ and ‘low’
portfolios
Finland, Sweden Greece, Italy
Sweden
Ireland, The
Netherlands,
Norway
France
Austria,
Belgium,
Germany
Notes. Table 4 reports the results for the MAR for all the 5,480 firms in our sample (second column), and the DMAR based on the institutional characteristic of the country. Sum of MAR is the sum of the MAR and DMAR for all 13 events.
Average MAR is the mean MARs for the 13 events, and Standard Deviation MAR is the standard deviation of the MARs for the 13 events. T-stat and p-value refer to the significance of the average MAR. High and Low refer to portfolios of
firms in the upper and lower part of the distribution for the variables: Rule of law, Divergence, and Public enforcement (defined in Table 3). *** Denotes significance at the 1% level, ** Denotes significance at the 5% level. For the SMAR and
SDMAR, the significance is assessed by comparing the estimated statistic with the critical value obtained through bootstrap simulations.

14
Table 4 continued
PANEL B
Rule of law Divergence Public enforcement
A (High) B (Low) A – B (DMAR) A (High) B (Low) A – B (DMAR) A (High) B (Low) A – B (DMAR)
Cut-off points: 10th and 90th percentile
Sum of MAR 0.0055** 0.0181*** -0.0126*** 0.0063 0.0200 -0.0135*** 0.0153 0.0167 -0.0015
Average MAR 0.0004 0.0014 -0.0010 0.0005 0.0015 -0.0010 0.0012 0.0013 -0.0001 Standard
Deviation MAR 0.0013 0.0018 0.0018 0.0010 0.0014 0.0011 0.0021 0.0019 0.0011
t-stat 1.1625 2.7879** -1.9766* 1.6987 3.8331 -3.3522*** 1.9879 2.4058 -0.3635
p-value 0.2659 0.0154 0.0697 0.1132 0.0021 0.0052 0.0683 0.0317 0.7221 Critical values for SDMAR: Two-tailed tests based on bootstrapping technique with 1,000 replications
Total Q(995) 0.0058 0.0111 0.0118 0.0085 0.0163 0.0140 0.0222 0.0214 0.0090
Total Q(975) 0.0040 0.0077 0.0100 0.0062 0.0116 0.0103 0.0169 0.0153 0.0067
Total Q(25) -0.0053 -0.0138 -0.0057 -0.0077 -0.0167 -0.0073 -0.0250 -0.0172 -0.0130
Total Q(5) -0.0086 -0.0181 -0.0081 -0.0120 -0.0220 -0.0109 -0.0350 -0.0242 -0.0168
Countries in upper and lower part of the distribution for Rule of law, Divergence, and Public enforcement
Countries in
‘high’ and ‘low’
portfolios
Denmark,
Finland,
Norway, Sweden
Greece, Italy,
Portugal, Spain
Denmark,
Sweden
Austria, Ireland,
Italy, The
Netherlands,
Norway
France
Austria,
Belgium,
Germany
Notes. Table 4 reports the results for the MAR for all the 5,480 firms in our sample (second column), and the DMAR based on the institutional characteristic of the country. Sum of MAR is the sum of the MAR and DMAR for all 13 events.
Average MAR is the mean MARs for the 13 events, and Standard Deviation MAR is the standard deviation of the MARs for the 13 events. T-stat and p-value refer to the significance of the average MAR. High and Low refer to portfolios of
firms in the upper and lower part of the distribution for the variables: Rule of law, Divergence, and Public enforcement (defined in Table 3). *** Denotes significance at the 1% level, ** Denotes significance at the 5% level. For the SMAR and
SDMAR, the significance is assessed by comparing the estimated statistic with the critical value obtained through bootstrap simulations.

15