pratt_michelle_energy data analyst_purdueextension
TRANSCRIPT
PURDUE EXTENSIONRE-7-W
Fueling and Feeding America Through Renewable Resources
RenewableEnergySynergies Between Cover Crops and
Corn Stover RemovalMichelle Pratt, Wallace E. Tyner, and David J. Muth Jr.
Department of Agricultural EconomicsEileen J. Kladivko
Department of AgronomyPurdue University
IntroductionIn 2007 the Energy Independence and Security Act (EISA) established that by 2022, 36 billion gallons of biofuel are to come from renewable fuel sources. More specifically, the mandate requires the production of cellulosic biofuels to increase to 16 billion gallons ethanol equivalent annually by 2022 (Energy Independence and Security Act, 2007). Cellulosic biofuels are derived from several sources, including corn residue (Zea mays L.), or corn stover.Crop residues, such as corn stover, which typically remain on the field, are responsible in numerous ways for preserving the soil (Huggins et al., 2011). Therefore, while stover is a readily available resource, sustainable rates of removal are limited due to the potential negative effects on soil quality and productivity. Research shows that cover crops have many benefits that could mitigate the potentially adverse impacts of stover removal. Furthermore, the use of cover crops may allow corn stover to be removed at higher rates, which could potentially increase farm revenues.While cover crops offer many potential benefits, incorporating them into farming systems comes at a cost. We focus on estimating the costs and benefits associated with cover crops at the interface of stover removal in the Midwest. Specifically, to what
extent would it pay for famers to establish a cover crop if it were possible to increase stover removal rates?Because of paucity of data and in some cases poor understanding of how management practices affect soils, we employ three methods to analyze the costs and benefits of cover crops coupled with corn stover removal. Each method allows us to approach our objective from a different angle. And each approach brings something to the overall picture and helps us confirm our results. It should be noted that while there are connections among the methods by way of their individual results, in and of themselves, they are separate and rely on unique data sources. The three methods are: (1) benefit-cost analysis, (2) integrated model analysis, and (3) representative farm model analysis using PC-LP. The integrated model analysis produces benefit estimates for the benefit-cost analysis, and the cost data from the benefit-cost analysis is used in the PC-LP analysis. Each of these approaches is discussed below.
Estimating Cover Crop Costs and Agronomic BenefitsWhile many cover crop varieties are available, we consider two cover crop mixes and six pure cover crops for our analysis: (1) annual ryegrass/crimson clover mix, (2) annual

2
Synergies Between Cover Crops and Corn Stover Removal • RE-7-WFueling and Feeding America Through Renewable Resources
RenewableEnergyryegrass/oilseed radish mix, (3) annual ryegrass, (4) cereal rye, (5) crimson clover, (6) hairy vetch, (7) oats, and (8) oilseed radish.We develop a method of cover crop cost estimation that breaks down costs into three components: (1) establishment, (2) termination, and (3) unexpected costs. Establishment costs are those costs that are required to aerially inter-seed the cover crop in the fall into the standing cash crop. The components of the establishment cost therefore include the recommended cover crop seeding rate, seed cost, and the cost of aerial application. Termination costs assumed in this analysis are those costs associated with chemically killing the cover crop in the spring before planting a cash crop. The components of termination costs therefore include the chemical cost, chemical application rate, and the cost of chemical application. Due to the inherent risk that planting cover crops carries to a farmer, a cost item has been included to account for an unexpected negative event, such as needing more than one pass of cover crop termination (chemical or mechanical) if it does not kill initially, untimely termination, the cover crop becoming a weed issue in the following cash crop, and/or the need to disc an area twice in the spring. The total unexpected cost will be the ratio of the number of acres affected divided by acres planted in cover crops (or the probability that the unexpected cost will be incurred) multiplied by the associated cost per acre. The total cost of a cover crop is then the summation of establishment, termination, and unexpected costs. Data for these cost estimates were compiled from a variety of sources, including the Midwest Cover Crop Council Cover Crop Decision Tool, interviews with farmers, and anecdotal evidence.We assume four categories of agronomic benefits associated with cover crops: (1) added nutrient content, (2) increased soil organic matter (SOM), (3) reduced compaction, and (4) reduced soil erosion. Added nutrient content accounts for the ability of legume cover crops to add N to the soil, as well as the ability of non-legume cover crops to scavenge N and make it available for the subsequent cash crop. Increased SOM will be the percentage increase in SOM, which is a proxy for soil health, soil carbon and nutrient content, and is thereby linked to soil productivity and crop yields. Reduced compaction accounts for the benefit of not
having to deep rip fields, as well as enhanced root growth of the following cash crop. The value for reduced erosion is the difference between soil erosion with and without a cover crop. Reduced soil erosion will be a combination of the reduced erosion due to wind and water measured in tons/acre/year. These benefit categories are then valued economically. Sources for these benefits include the Midwest Cover Crop Council Cover Crop Decision Tool, interviews with farmers, and anecdotal evidence. The amount of reduced erosion is estimated using a newly developed integrated modeling system.
Interfacing Cover Crops and Stover RemovalCover crops alone appear to offer many benefits. Additionally, provided there is an existing and viable market for corn stover, there will be an economic benefit associated with corn stover removal. This benefit is the value of stover beyond the cost of removal. We suspect that cover crops will allow for additional stover to be removed.In order to estimate the value of reduced erosion and estimate the additional amount of corn stover that can be removed with a cover crop, we utilize an integrated modeling system that combines the Revised Universal Soil Loss Equation, Version 2 (RUSLE2), the Wind Erosion Prediction System (WEPS), and the Soil Conditioning Index (SCI). The model, developed by Muth and Bryden (2011), allows for the analysis of residue removal scenarios with detailed specification to determine sustainable rates of stover removal. The results produced from this model will help quantify several benefits of cover crops in a system that includes corn stover removal.Using the integrated model explained above, we have defined the user inputs as follows. The spatial area to be analyzed is the state of Indiana. The management practices specified in this analysis include: cover crops, residue removal, crop rotations, and tillage practices. Outputs from the integrated modeling system are the soil conditioning index (SCI) and its three sub-factors, wind erosion, water erosion, and the amount of residue removed. Using various combinations of the management practices, we will be able to extract two pieces of information to be used in the benefit-cost analysis: (1) the mean avoided wind and water erosion with a cover crop and (2) the mean biomass removed for different scenarios as well as additional biomass that is available for removal with a cover crop while holding total soil erosion constant.
PURDUE EXTENSION
3
Synergies Between Cover Crops and Corn Stover Removal • RE-7-W
We combined wind erosion and water erosion together to create a variable for total soil erosion. The mean avoided soil erosion is thus calculated as the difference between the mean erosion values with and without a cover crop. Estimating the additional biomass removable with and without a cover crop involves the use of ordinary least squares (OLS) regression analysis. Holding soil erosion constant, the additional removable biomass is determined after accounting for the benefit a no-tillage regime provides.Using the previous two categories, we estimate the costs of cover crops as well as two benefits cases: agronomic and with stover removal. Using those estimates, a series of benefit costs analyses were conducted. After the cover crop costs and benefits were estimated, various scenarios are analyzed using farm level data in PC-LP. PC-LP is a linear programming model that calculates the profit-maximizing crop mix for a farm after considering various farm resources and activities. Input information for the program come from farmers participating in the Top Farmer Crop Workshop at Purdue. PC-LP is used to combine cover crops and corn stover removal. Thompson (2011) added crops with corn stover removal at 33% to the model’s framework. We expand upon this analysis by adding in costs associated with cover crop use and increasing the stover removal rate to 75% for cover crop cases. Stover harvest costs for the base case are those estimated by Thompson and Tyner (2012) and, subsequently, Fiegel, Taheripour, and Tyner (2012). Stover harvest costs associated with the cover crop cases are derived from cost estimates by Fiegel et al. (2012) to account for the increase in corn stover removal rate from 33% to 75%
ResultsCover Crop CostsCover crop costs are uncertain, so risk analysis was used to capture the inherent uncertainty in the cost values. This was done using Monte Carlo simulation with @RISK, an add-in for Microsoft Excel. A triangular distribution was tested. This distribution uses a minimum, maximum, and mode to estimate a mean value. In most cases, the mode (or most likely value) is the average. However, in the case of seeding rate, the mode is assumed to be the same as the minimum, given that lower seeding rates are sufficient for
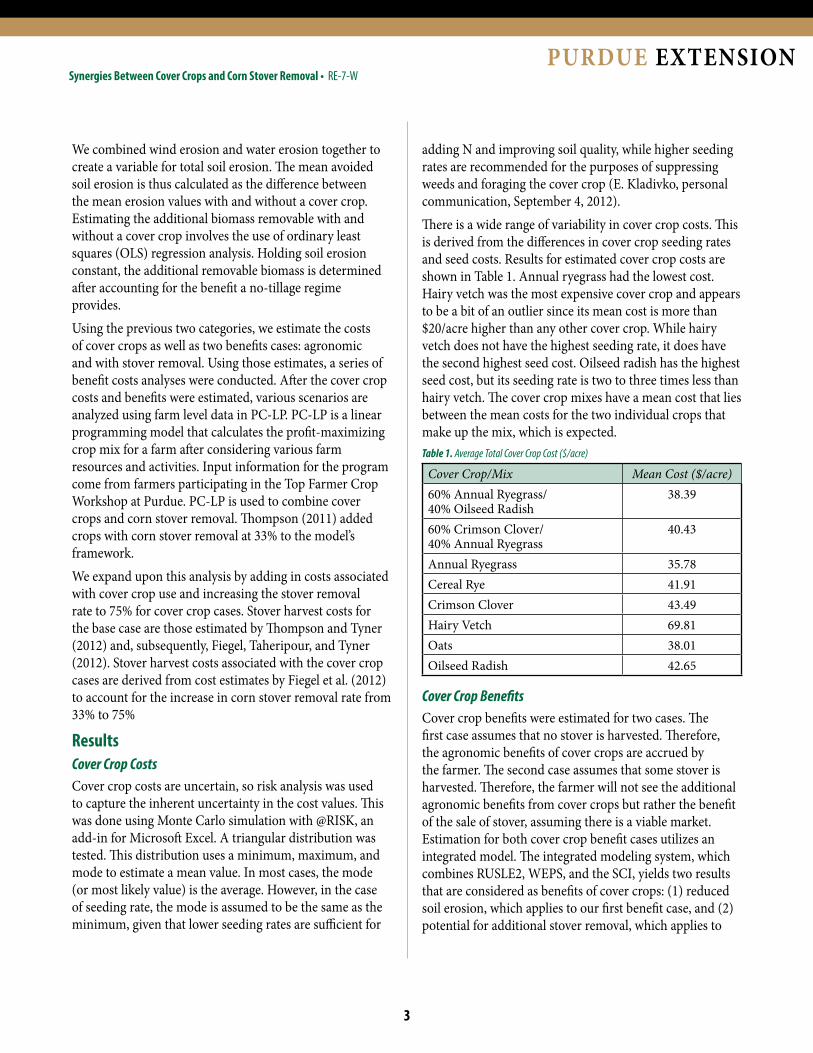
adding N and improving soil quality, while higher seeding rates are recommended for the purposes of suppressing weeds and foraging the cover crop (E. Kladivko, personal communication, September 4, 2012).There is a wide range of variability in cover crop costs. This is derived from the differences in cover crop seeding rates and seed costs. Results for estimated cover crop costs are shown in Table 1. Annual ryegrass had the lowest cost. Hairy vetch was the most expensive cover crop and appears to be a bit of an outlier since its mean cost is more than $20/acre higher than any other cover crop. While hairy vetch does not have the highest seeding rate, it does have the second highest seed cost. Oilseed radish has the highest seed cost, but its seeding rate is two to three times less than hairy vetch. The cover crop mixes have a mean cost that lies between the mean costs for the two individual crops that make up the mix, which is expected. Table 1. Average Total Cover Crop Cost ($/acre)
Cover Crop/Mix Mean Cost ($/acre)60% Annual Ryegrass/ 40% Oilseed Radish
38.39
60% Crimson Clover/ 40% Annual Ryegrass
40.43
Annual Ryegrass 35.78Cereal Rye 41.91Crimson Clover 43.49Hairy Vetch 69.81Oats 38.01Oilseed Radish 42.65
Cover Crop BenefitsCover crop benefits were estimated for two cases. The first case assumes that no stover is harvested. Therefore, the agronomic benefits of cover crops are accrued by the farmer. The second case assumes that some stover is harvested. Therefore, the farmer will not see the additional agronomic benefits from cover crops but rather the benefit of the sale of stover, assuming there is a viable market. Estimation for both cover crop benefit cases utilizes an integrated model. The integrated modeling system, which combines RUSLE2, WEPS, and the SCI, yields two results that are considered as benefits of cover crops: (1) reduced soil erosion, which applies to our first benefit case, and (2) potential for additional stover removal, which applies to
4
Synergies Between Cover Crops and Corn Stover Removal • RE-7-WFueling and Feeding America Through Renewable Resources
RenewableEnergyour second benefit case associated with cover crops. Agronomic BenefitsCover crop agronomic benefits are estimated for four benefit categories: (1) added nutrient content, (2) increase SOM, (3) reduced compaction, and (4) reduced soil erosion. Since reduced erosion can vary widely, depending on rotation and tillage, for the purposes of the benefit-cost analysis, we analyze the mean reduced soil erosion overall. Soil erosion with a cover crop was 0.32 tons/acre less than with no cover crop. The on-site value of soil erosion is $10.17/ton, which accounts for soil nutrients and contribution to yield as well as water, and the off-site value of soil erosion is $17.99/ton (U.S. Department of Agriculture, 2011).By accounting for the percentage of nitrogen in each of the fertilizers, the price of the fertilizer in dollars per ton is converted to the price of N in dollars per pound, and the mean cost is $0.52/pound (U.S. Department of Agriculture, 2012). The other benefit categories were increased organic matter, which was related to yield increase, and reduced compaction, which was estimated as the avoidance of deep ripping tillage every five years. Table 2 illustrates the breakdown of cover crop benefit categories and values for annual ryegrass and crimson clover.
Table 2. Breakdown of Benefits ($/acre)
Benefits Annual Ryegrass
Crimson Clover
Added N 0 21.28Increase SOM 34.78 44.72Reduced Compaction 6.5 6.5Reduced Erosion 3.25 3.25
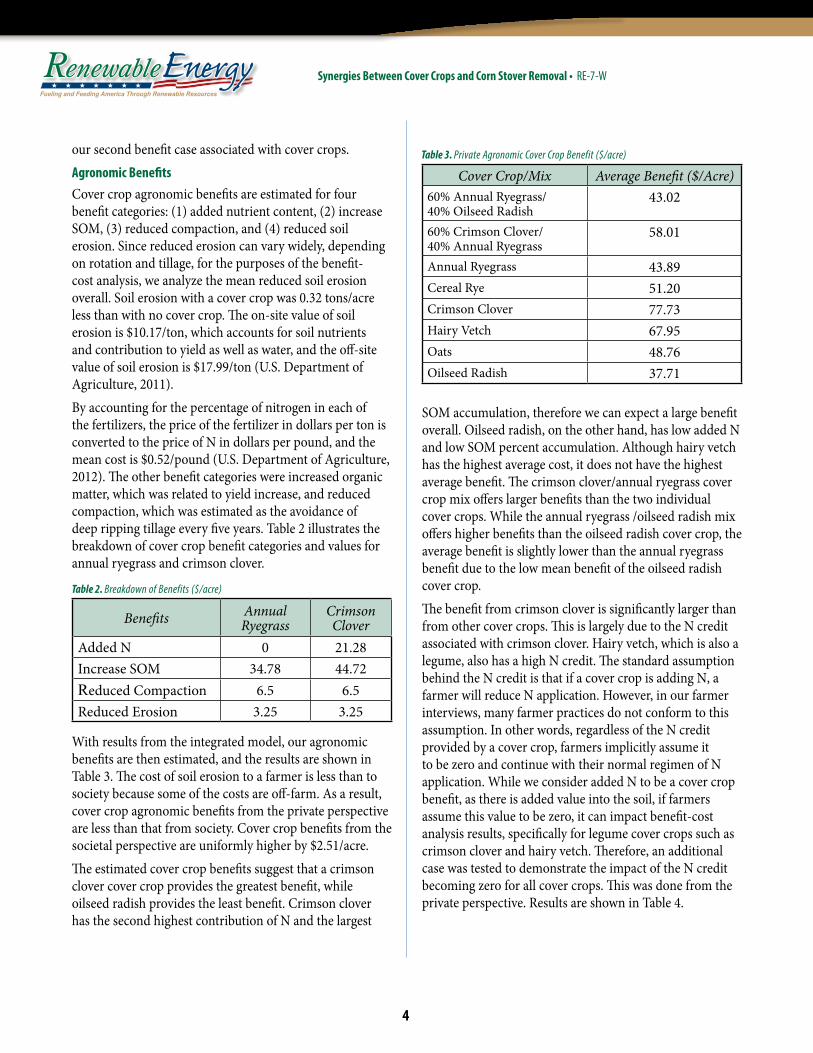
With results from the integrated model, our agronomic benefits are then estimated, and the results are shown in Table 3. The cost of soil erosion to a farmer is less than to society because some of the costs are off-farm. As a result, cover crop agronomic benefits from the private perspective are less than that from society. Cover crop benefits from the societal perspective are uniformly higher by $2.51/acre.The estimated cover crop benefits suggest that a crimson clover cover crop provides the greatest benefit, while oilseed radish provides the least benefit. Crimson clover has the second highest contribution of N and the largest
SOM accumulation, therefore we can expect a large benefit overall. Oilseed radish, on the other hand, has low added N and low SOM percent accumulation. Although hairy vetch has the highest average cost, it does not have the highest average benefit. The crimson clover/annual ryegrass cover crop mix offers larger benefits than the two individual cover crops. While the annual ryegrass /oilseed radish mix offers higher benefits than the oilseed radish cover crop, the average benefit is slightly lower than the annual ryegrass benefit due to the low mean benefit of the oilseed radish cover crop. The benefit from crimson clover is significantly larger than from other cover crops. This is largely due to the N credit associated with crimson clover. Hairy vetch, which is also a legume, also has a high N credit. The standard assumption behind the N credit is that if a cover crop is adding N, a farmer will reduce N application. However, in our farmer interviews, many farmer practices do not conform to this assumption. In other words, regardless of the N credit provided by a cover crop, farmers implicitly assume it to be zero and continue with their normal regimen of N application. While we consider added N to be a cover crop benefit, as there is added value into the soil, if farmers assume this value to be zero, it can impact benefit-cost analysis results, specifically for legume cover crops such as crimson clover and hairy vetch. Therefore, an additional case was tested to demonstrate the impact of the N credit becoming zero for all cover crops. This was done from the private perspective. Results are shown in Table 4.
Table 3. Private Agronomic Cover Crop Benefit ($/acre)
Cover Crop/Mix Average Benefit ($/Acre)60% Annual Ryegrass/ 40% Oilseed Radish
43.02
60% Crimson Clover/ 40% Annual Ryegrass
58.01
Annual Ryegrass 43.89Cereal Rye 51.20Crimson Clover 77.73Hairy Vetch 67.95Oats 48.76Oilseed Radish 37.71

PURDUE EXTENSION
5
Synergies Between Cover Crops and Corn Stover Removal • RE-7-W
As expected, removing added N reduced the total benefit of the cover crops. While only legumes can add N to the soil, the other crops originally had a value associated with the scavenged N; this is why there is a decrease in net benefit for all cover crops. However, removing the added N benefit provides more balanced results. While crimson clover still has the highest benefit, hairy vetch no longer has second highest benefit; cereal rye does. Furthermore, crimson clover now has a benefit closer to cereal rye and annual ryegrass. The most commonly used cover crops from the farmers we interviewed were annual ryegrass and cereal rye. Therefore, the benefits of cover crops perceived by farmers may be lower than those estimated in this analysis.Corn Stover Harvest BenefitsHolding soil erosion constant, we derive the following results regarding the additional stover that can be removed with a cover crop. We investigate the effect of no-till on additional removable biomass. It is understood that no-till and cover crops are both conservation practices that have positive agronomic impacts. Often farmers who use no-till are more likely to adopt cover crops. However, it is difficult to determine how much of the cover crop benefits, such as increase SOM and reduced erosion, are the result of no-till and how much should be attributed to cover crops. Based upon the results for all rotations combined, a cover crop appears to provide a 1.79 ton/acre gain over no-till alone, with a larger gain for corn-soybean than continuous corn.Since corn stover is being harvested, we assume that no additional agronomic benefits of cover crop is present;
rather, the cover crop acts as a “replacement” for the stover that is removed and allows for an increased level of sustainable stover removal. The benefit of a cover crop with stover removal is the profit that can be made from stover once stover harvest costs have been accounted for. We tested two cases of stover farm-gate prices: $60/ton and $80/ton. Assuming that a removal rate of 33% allows for about 1.5 tons/acre of stover to be sustainably removed and that an additional 1.79 tons/acre of stover can be removed with a cover crop, the total amount of stover removed is 3.29 tons/acre. Using a stover farm-gate price of $60/ton, the average value of stover harvest (mean between BC+Stover and CC+Stover) is $20.75/ton. At a stover farm-gate price of $80/ton, the average value of stover harvest is $40.75/ton. These mean values are used in the benefit-cost analysis. Accounting for the on-farm harvest costs, including nutrient replacement, the net benefit of stover removal at a stover price of $60/ton is $68.27/acre (3.29 tons x $20.75/ton), and at a stover price of $80/ton the net benefit is $134.07/acre (3.29 * $40.75).Harvest and storage costs associated with collecting the stover are also accounted for. Stover removal means that nutrients are removed from the ground. These removed nutrients are accounted for by subtracting the cost of nutrient replacement from the value of stover. Although we account for nutrient replacement, it should be noted that other agronomic costs, such as increased compaction due to harvest machinery, are not accounted for. Harvest cost is the sum of net wrap, fuel, labor, and equipment. Costs used for the base case are those previously estimated by Thompson and Tyner (2011) and Fiegel et al. (2012). To account for the increase in the stover removal rate from 33% to 75% in the PC-LP model, the base case stover harvest costs from Fiegel’s base case are adjusted accordingly. We assume that on a per ton basis storage, labor, equipment, and fuel will exhibit economies of scale. Therefore, these costs will be slightly lower than the base case. On a per acre basis, we assume that the costs will increase. We assume the per acre costs associated with storage, net wrap, and nutrients will increase linearly according to the stover removal rate increase. The remaining cost components, labor, equipment, and fuel, may experience an increase in per acre cost with increased stover removal, but it is unlikely that it will be by the same amount as the stover removal rate increase.
Table 4. Cover Crop Benefit ($/A) with On-site Value of Erosion – Zero N Credit
Cover Crop/Mix Average Benefit ($/Acre)60% Annual Ryegrass/ 40% Oilseed Radish 38.04
60% Crimson Clover/ 40% Annual Ryegrass
43.89
Annual Ryegrass 43.89Cereal Rye 51.20Crimson Clover 53.64Hairy Vetch 38.04Oats 48.76Oilseed Radish 30.24
6
Synergies Between Cover Crops and Corn Stover Removal • RE-7-WFueling and Feeding America Through Renewable Resources
RenewableEnergy
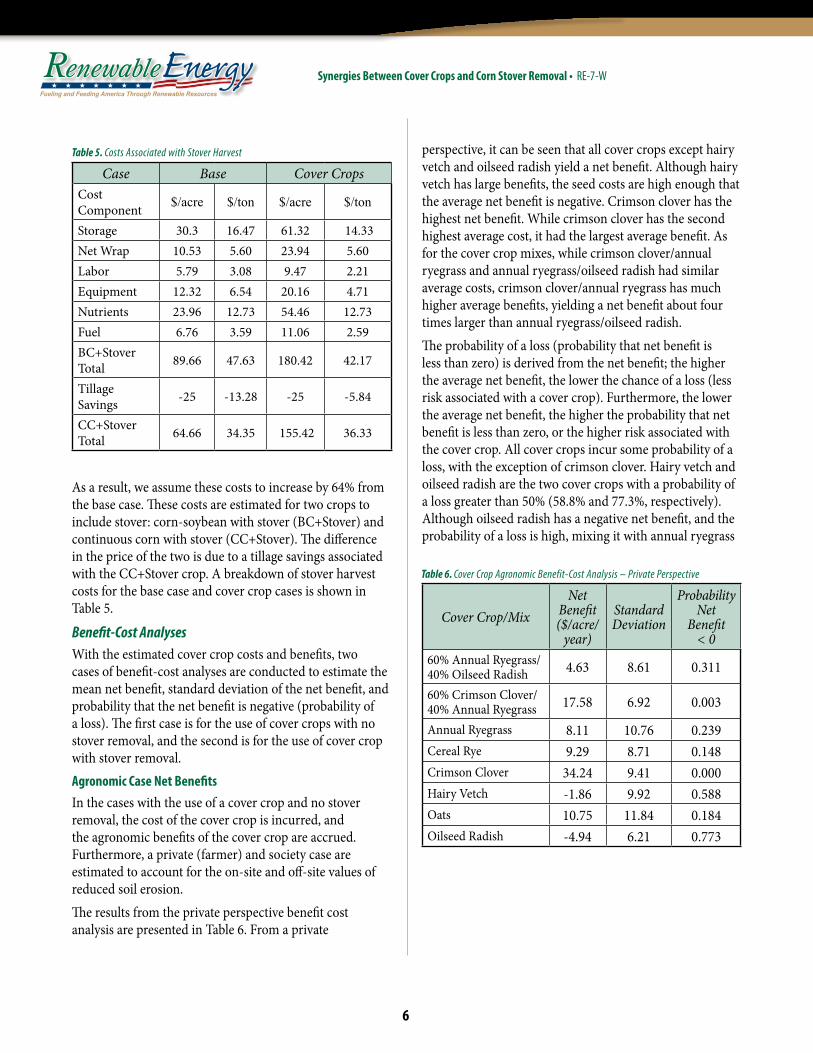
As a result, we assume these costs to increase by 64% from the base case. These costs are estimated for two crops to include stover: corn-soybean with stover (BC+Stover) and continuous corn with stover (CC+Stover). The difference in the price of the two is due to a tillage savings associated with the CC+Stover crop. A breakdown of stover harvest costs for the base case and cover crop cases is shown in Table 5.
Benefit-Cost AnalysesWith the estimated cover crop costs and benefits, two cases of benefit-cost analyses are conducted to estimate the mean net benefit, standard deviation of the net benefit, and probability that the net benefit is negative (probability of a loss). The first case is for the use of cover crops with no stover removal, and the second is for the use of cover crop with stover removal.Agronomic Case Net BenefitsIn the cases with the use of a cover crop and no stover removal, the cost of the cover crop is incurred, and the agronomic benefits of the cover crop are accrued. Furthermore, a private (farmer) and society case are estimated to account for the on-site and off-site values of reduced soil erosion. The results from the private perspective benefit cost analysis are presented in Table 6. From a private
perspective, it can be seen that all cover crops except hairy vetch and oilseed radish yield a net benefit. Although hairy vetch has large benefits, the seed costs are high enough that the average net benefit is negative. Crimson clover has the highest net benefit. While crimson clover has the second highest average cost, it had the largest average benefit. As for the cover crop mixes, while crimson clover/annual ryegrass and annual ryegrass/oilseed radish had similar average costs, crimson clover/annual ryegrass has much higher average benefits, yielding a net benefit about four times larger than annual ryegrass/oilseed radish. The probability of a loss (probability that net benefit is less than zero) is derived from the net benefit; the higher the average net benefit, the lower the chance of a loss (less risk associated with a cover crop). Furthermore, the lower the average net benefit, the higher the probability that net benefit is less than zero, or the higher risk associated with the cover crop. All cover crops incur some probability of a loss, with the exception of crimson clover. Hairy vetch and oilseed radish are the two cover crops with a probability of a loss greater than 50% (58.8% and 77.3%, respectively). Although oilseed radish has a negative net benefit, and the probability of a loss is high, mixing it with annual ryegrass
Table 5. Costs Associated with Stover Harvest
Case Base Cover CropsCost Component $/acre $/ton $/acre $/ton
Storage 30.3 16.47 61.32 14.33 Net Wrap 10.53 5.60 23.94 5.60Labor 5.79 3.08 9.47 2.21Equipment 12.32 6.54 20.16 4.71Nutrients 23.96 12.73 54.46 12.73Fuel 6.76 3.59 11.06 2.59BC+Stover Total 89.66 47.63 180.42 42.17
Tillage Savings -25 -13.28 -25 -5.84
CC+Stover Total 64.66 34.35 155.42 36.33
Table 6. Cover Crop Agronomic Benefit-Cost Analysis – Private Perspective
Cover Crop/MixNet
Benefit ($/acre/
year)
Standard Deviation
Probability Net
Benefit < 0
60% Annual Ryegrass/ 40% Oilseed Radish 4.63 8.61 0.311
60% Crimson Clover/ 40% Annual Ryegrass 17.58 6.92 0.003
Annual Ryegrass 8.11 10.76 0.239Cereal Rye 9.29 8.71 0.148Crimson Clover 34.24 9.41 0.000Hairy Vetch -1.86 9.92 0.588Oats 10.75 11.84 0.184Oilseed Radish -4.94 6.21 0.773

PURDUE EXTENSION
7
Synergies Between Cover Crops and Corn Stover Removal • RE-7-W
provides a positive net benefit and reduces the probability of a loss by about 50%. Furthermore, combining annual ryegrass with crimson clover yields the second highest average net benefit and a probability of loss very close to zero. From the social perspective, net benefit for each cover crop is uniformly higher by $2.51/acre while the standard deviations remain the same. Furthermore, the probability of a loss for each cover crop is slightly less for the societal case. Stover Removal Benefit-Cost AnalysisThe second benefit-cost analysis scenario is where a cover crop is present, and instead of accumulating additional agronomic benefits from the cover crop, benefits from stover removal, given a viable stover market, are accounted for. The stover removed for sale is the additional removable biomass holding erosion constant with a cover crop on top of a base of 1.5 tons/acre. This stover then is assigned a value. For the benefit-cost analysis, the first stover price tested is $60/ton. Results for this case are shown in Table 7. Hairy vetch is the only cover crop with a negative average net benefit. For hairy vetch there is a probability of a loss greater than 60%. The probability of a loss for all other cover crops is essentially zero, and the average net benefit is between $24 and $33/acre. The standard deviation is about $4 - $9/acre for each cover crop. Comparing this case to the cases with no stover removal and agronomic benefit, we can see that stover removal with a cover crop offers significant increased benefits. Since actual stover prices are unknown, the sensitivity of stover value is tested. The second case tests a stover value of $80/ton, a $20 increase from the previous case. Although the value of stover has increased by $20/ton, the net benefit for each cover crop increases by $65.80/acre. This is because once the harvest cost and nutrient replacement costs have been accounted for, the remaining value of the stover for $80/ton is much higher than $60/ton, yielding higher mean net benefits in the benefit-cost analysis. This could also be thought about in terms of the amount of stover being removed; $65.80/acre is simply the $20/ton increase in price multiplied by 3.29 tons/acre of stover harvested. Furthermore, the probability that the net benefit is less than zero, or that there is a loss from the use of a
cover crop, is essentially zero with a stover price of $80/ton. Alternatively, we could test the sensitivity on the amount of stover removed.The results from the previous two cases, which involved cover crops and stover removal, tell us several important things:1. From the agronomic benefit cases, for most cases cover
crops alone offers potential benefits to farmers;2. The net benefit of cover crops with stover removal is
sensitive to the value of stover (farm-gate price);3. Cover crops with stover removal appear to have the
ability to substantially increase farm profit over cover crops alone; and
4. Adding a cover crop to stover removal can, in many cases, cover the cost of the cover crop while allaying fears of increased erosion and SOM loss from corn stover removal.
These cases are fairly generalized and contain a certain amount of risk. While cover crops and increased stover removal hypothetically appear to provide benefits, it is useful to test the integration of cover crop and increased stover removal with data from existing farms that currently operate in the Midwest. This is done with the use of PC-LP.
Table 7. Cover Crop Benefit with Stover Removal at a Stover Price of $60/ton
Cover Crop/MixNet
Benefit ($/acre/
year)
Standard Deviation
Probability Net
Benefit < 0
60% Annual Ryegrass/ 40% Oilseed Radish 29.88 4.44 0.000
60% Crimson Clover/ 40% Annual Ryegrass 27.85 4.88 0.000
Annual Ryegrass 32.49 4.46 0.000Cereal Rye 26.37 5.18 0.000Crimson Clover 24.78 6.03 0.000Hairy Vetch -1.53 6.12 0.582Oats 30.27 8.96 0.002Oilseed Radish 25.62 5.54 0.000
8
Synergies Between Cover Crops and Corn Stover Removal • RE-7-WFueling and Feeding America Through Renewable Resources
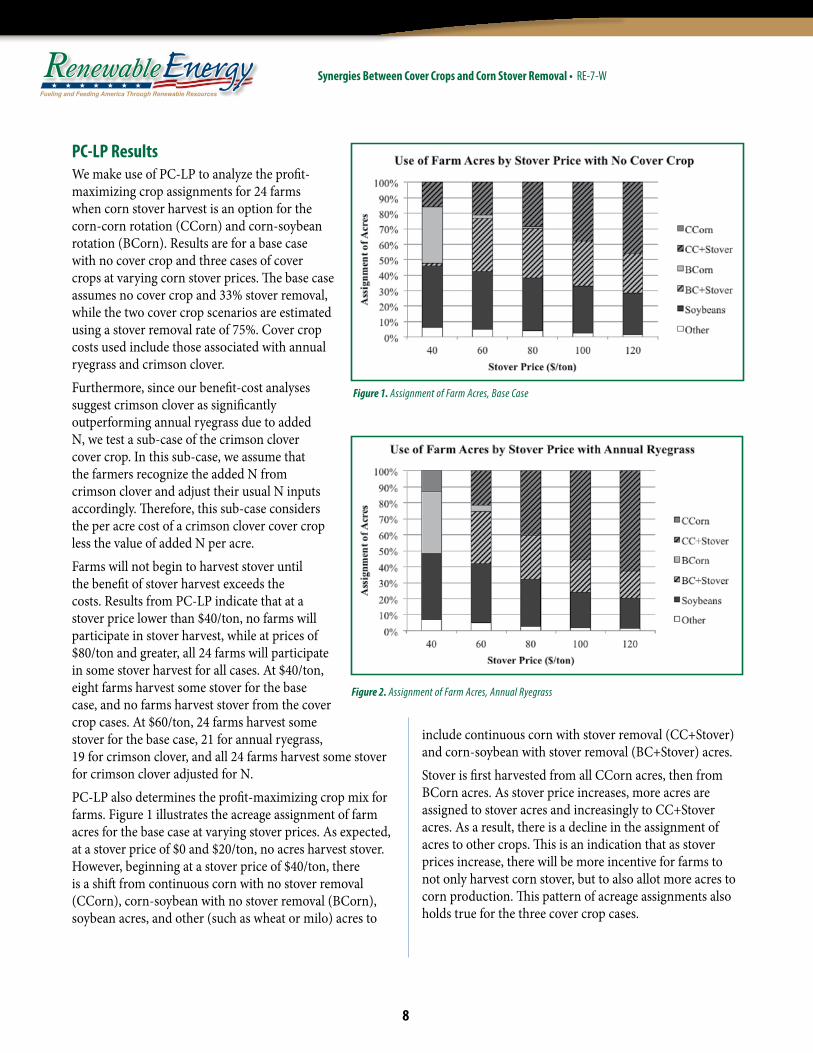
RenewableEnergyPC-LP ResultsWe make use of PC-LP to analyze the profit-maximizing crop assignments for 24 farms when corn stover harvest is an option for the corn-corn rotation (CCorn) and corn-soybean rotation (BCorn). Results are for a base case with no cover crop and three cases of cover crops at varying corn stover prices. The base case assumes no cover crop and 33% stover removal, while the two cover crop scenarios are estimated using a stover removal rate of 75%. Cover crop costs used include those associated with annual ryegrass and crimson clover. Furthermore, since our benefit-cost analyses suggest crimson clover as significantly outperforming annual ryegrass due to added N, we test a sub-case of the crimson clover cover crop. In this sub-case, we assume that the farmers recognize the added N from crimson clover and adjust their usual N inputs accordingly. Therefore, this sub-case considers the per acre cost of a crimson clover cover crop less the value of added N per acre. Farms will not begin to harvest stover until the benefit of stover harvest exceeds the costs. Results from PC-LP indicate that at a stover price lower than $40/ton, no farms will participate in stover harvest, while at prices of $80/ton and greater, all 24 farms will participate in some stover harvest for all cases. At $40/ton, eight farms harvest some stover for the base case, and no farms harvest stover from the cover crop cases. At $60/ton, 24 farms harvest some stover for the base case, 21 for annual ryegrass, 19 for crimson clover, and all 24 farms harvest some stover for crimson clover adjusted for N. PC-LP also determines the profit-maximizing crop mix for farms. Figure 1 illustrates the acreage assignment of farm acres for the base case at varying stover prices. As expected, at a stover price of $0 and $20/ton, no acres harvest stover. However, beginning at a stover price of $40/ton, there is a shift from continuous corn with no stover removal (CCorn), corn-soybean with no stover removal (BCorn), soybean acres, and other (such as wheat or milo) acres to
include continuous corn with stover removal (CC+Stover) and corn-soybean with stover removal (BC+Stover) acres. Stover is first harvested from all CCorn acres, then from BCorn acres. As stover price increases, more acres are assigned to stover acres and increasingly to CC+Stover acres. As a result, there is a decline in the assignment of acres to other crops. This is an indication that as stover prices increase, there will be more incentive for farms to not only harvest corn stover, but to also allot more acres to corn production. This pattern of acreage assignments also holds true for the three cover crop cases.
Figure 1. Assignment of Farm Acres, Base Case
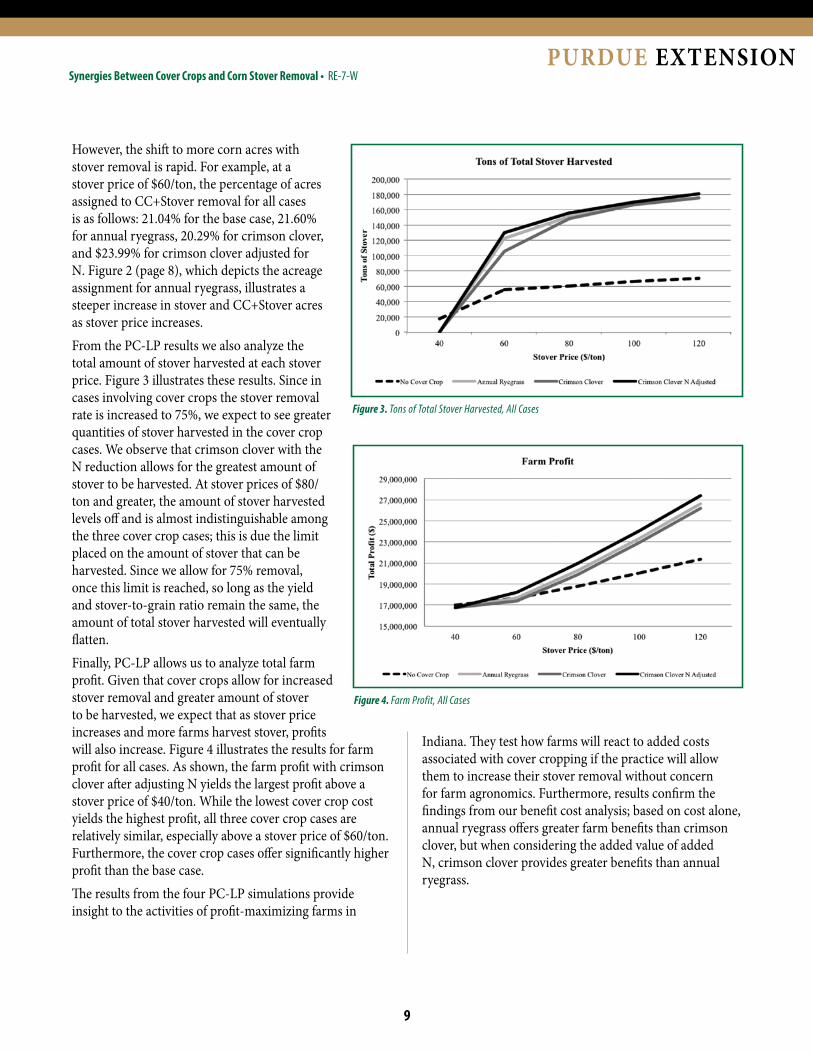
Figure 2. Assignment of Farm Acres, Annual Ryegrass
PURDUE EXTENSION
9
Synergies Between Cover Crops and Corn Stover Removal • RE-7-W
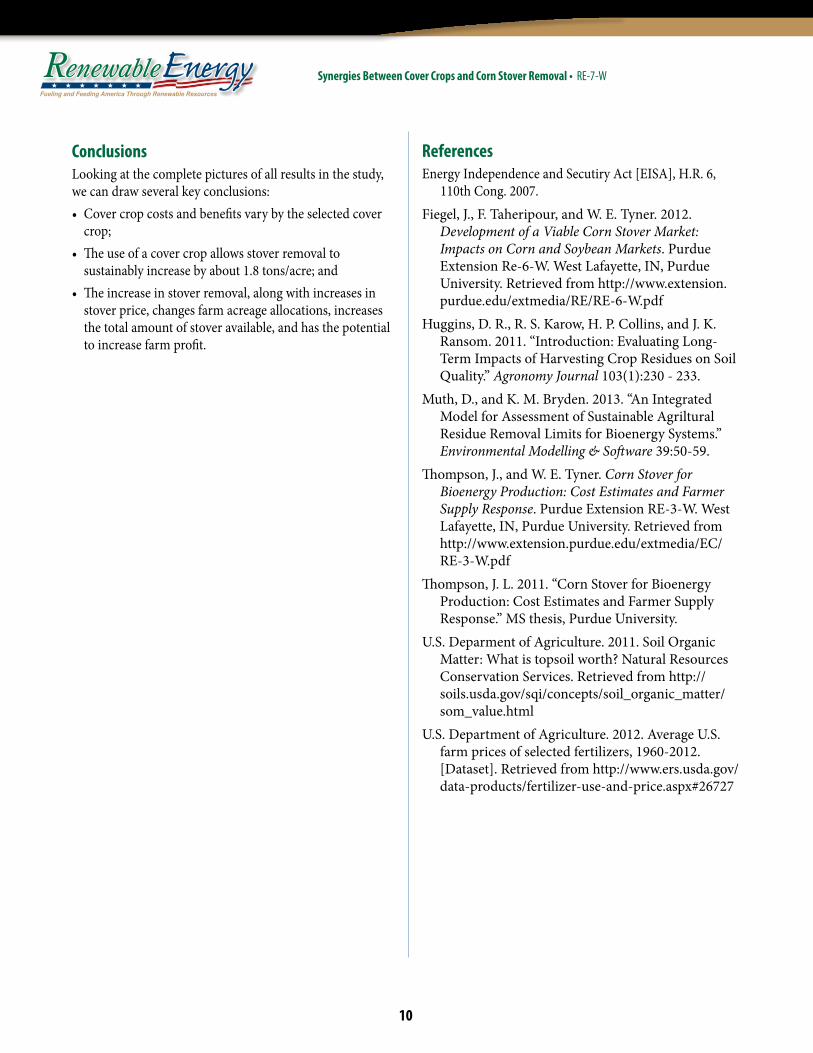
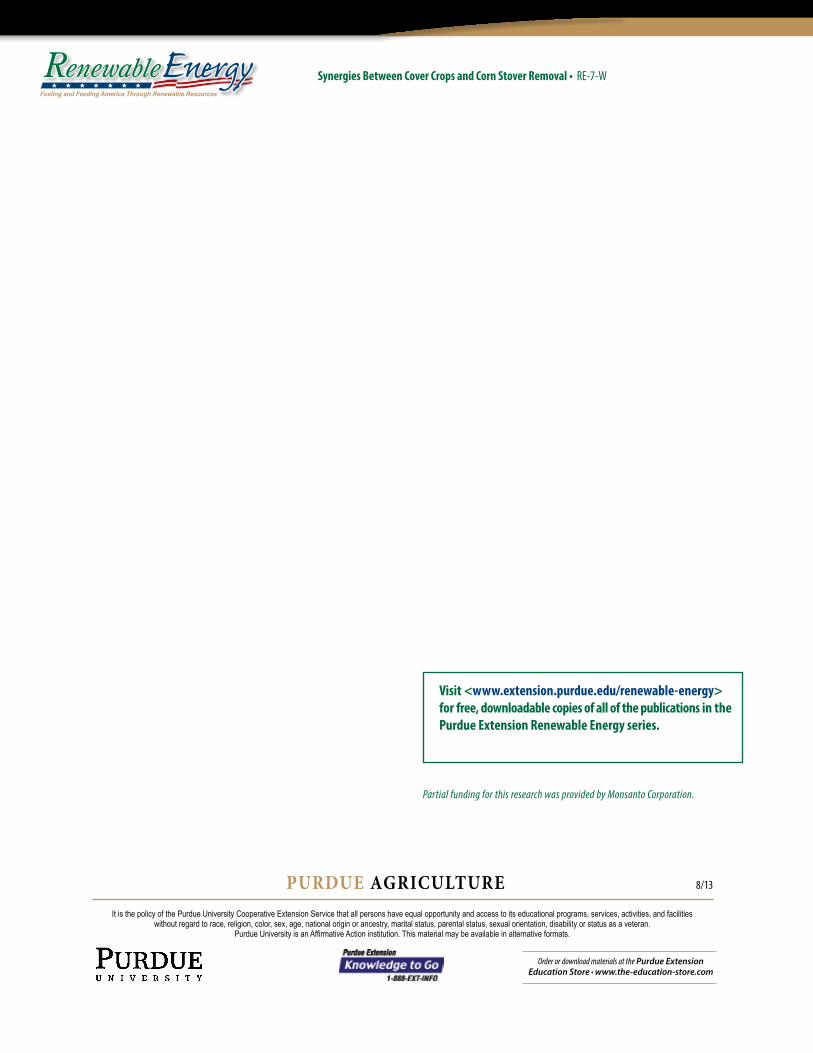
However, the shift to more corn acres with stover removal is rapid. For example, at a stover price of $60/ton, the percentage of acres assigned to CC+Stover removal for all cases is as follows: 21.04% for the base case, 21.60% for annual ryegrass, 20.29% for crimson clover, and $23.99% for crimson clover adjusted for N. Figure 2 (page 8), which depicts the acreage assignment for annual ryegrass, illustrates a steeper increase in stover and CC+Stover acres as stover price increases.From the PC-LP results we also analyze the total amount of stover harvested at each stover price. Figure 3 illustrates these results. Since in cases involving cover crops the stover removal rate is increased to 75%, we expect to see greater quantities of stover harvested in the cover crop cases. We observe that crimson clover with the N reduction allows for the greatest amount of stover to be harvested. At stover prices of $80/ton and greater, the amount of stover harvested levels off and is almost indistinguishable among the three cover crop cases; this is due the limit placed on the amount of stover that can be harvested. Since we allow for 75% removal, once this limit is reached, so long as the yield and stover-to-grain ratio remain the same, the amount of total stover harvested will eventually flatten. Finally, PC-LP allows us to analyze total farm profit. Given that cover crops allow for increased stover removal and greater amount of stover to be harvested, we expect that as stover price increases and more farms harvest stover, profits will also increase. Figure 4 illustrates the results for farm profit for all cases. As shown, the farm profit with crimson clover after adjusting N yields the largest profit above a stover price of $40/ton. While the lowest cover crop cost yields the highest profit, all three cover crop cases are relatively similar, especially above a stover price of $60/ton. Furthermore, the cover crop cases offer significantly higher profit than the base case.The results from the four PC-LP simulations provide insight to the activities of profit-maximizing farms in
Figure 4. Farm Profit, All Cases
Indiana. They test how farms will react to added costs associated with cover cropping if the practice will allow them to increase their stover removal without concern for farm agronomics. Furthermore, results confirm the findings from our benefit cost analysis; based on cost alone, annual ryegrass offers greater farm benefits than crimson clover, but when considering the added value of added N, crimson clover provides greater benefits than annual ryegrass.
Figure 3. Tons of Total Stover Harvested, All Cases
10
Synergies Between Cover Crops and Corn Stover Removal • RE-7-WFueling and Feeding America Through Renewable Resources
RenewableEnergyConclusionsLooking at the complete pictures of all results in the study, we can draw several key conclusions:• Covercropcostsandbenefitsvarybytheselectedcover
crop;• Theuseofacovercropallowsstoverremovalto
sustainably increase by about 1.8 tons/acre; and• Theincreaseinstoverremoval,alongwithincreasesin
stover price, changes farm acreage allocations, increases the total amount of stover available, and has the potential to increase farm profit.
ReferencesEnergy Independence and Secutiry Act [EISA], H.R. 6, 110th Cong. 2007.Fiegel, J., F. Taheripour, and W. E. Tyner. 2012.
Development of a Viable Corn Stover Market: Impacts on Corn and Soybean Markets. Purdue Extension Re-6-W. West Lafayette, IN, Purdue University. Retrieved from http://www.extension.purdue.edu/extmedia/RE/RE-6-W.pdf
Huggins, D. R., R. S. Karow, H. P. Collins, and J. K. Ransom. 2011. “Introduction: Evaluating Long-Term Impacts of Harvesting Crop Residues on Soil Quality.” Agronomy Journal 103(1):230 - 233.
Muth, D., and K. M. Bryden. 2013. “An Integrated Model for Assessment of Sustainable Agriltural Residue Removal Limits for Bioenergy Systems.” Environmental Modelling & Software 39:50-59.
Thompson, J., and W. E. Tyner. Corn Stover for Bioenergy Production: Cost Estimates and Farmer Supply Response. Purdue Extension RE-3-W. West Lafayette, IN, Purdue University. Retrieved from http://www.extension.purdue.edu/extmedia/EC/RE-3-W.pdf
Thompson, J. L. 2011. “Corn Stover for Bioenergy Production: Cost Estimates and Farmer Supply Response.” MS thesis, Purdue University.
U.S. Deparment of Agriculture. 2011. Soil Organic Matter: What is topsoil worth? Natural Resources Conservation Services. Retrieved from http://soils.usda.gov/sqi/concepts/soil_organic_matter/som_value.html
U.S. Department of Agriculture. 2012. Average U.S. farm prices of selected fertilizers, 1960-2012. [Dataset]. Retrieved from http://www.ers.usda.gov/data-products/fertilizer-use-and-price.aspx#26727

PURDUE EXTENSION
11
Synergies Between Cover Crops and Corn Stover Removal • RE-7-W
Notes
Synergies Between Cover Crops and Corn Stover Removal • RE-7-WFueling and Feeding America Through Renewable Resources
RenewableEnergy
It is the policy of the Purdue University Cooperative Extension Service that all persons have equal opportunity and access to its educational programs, services, activities, and facilities without regard to race, religion, color, sex, age, national origin or ancestry, marital status, parental status, sexual orientation, disability or status as a veteran.
Purdue University is an Affirmative Action institution. This material may be available in alternative formats.
PURDUE AGRICULTURE 8/13
Order or download materials at the Purdue Extension Education Store • www.the-education-store.com
Visit <www.extension.purdue.edu/renewable-energy> for free, downloadable copies of all of the publications in the Purdue Extension Renewable Energy series.
Partial funding for this research was provided by Monsanto Corporation.