practical statistics - university of arizonaircamera.as.arizona.edu/astr_518/sep-13-stat.pdf ·...
TRANSCRIPT

1

Practical Statistics • Lecture 3 (Aug. 30)
Read: W&J Ch. 4-5
- Correlation
• Lecture 4 (Sep. 1) - Hypothesis Testing
- Principle Component Analysis
• Lecture 5 (Sep. 6): Read: W&J Ch. 6
- Parameter Estimation
- Bayesian Analysis
- Rejecting Outliers
- Bootstrap + Jack-knife
• Lecture 6 (Sep. 8) Read: W&J Ch. 7
- Random Numbers
- Monte Carlo Modeling
• Lecture 7 (Sep. 13): - Markov Chain MC
• Lecture 8 (Sep. 15): Read: W&J Ch. 9
- Fourier Techniques
- Filtering
- Unevenly Sampled Data2

Calculating “ML” over a grid
• General approach is to define nested “for” loops to iterate-over the parameters of interest:
3
• To “marginalize” out the parameters that are not if interest you can iterate-over these variables for each value of m and b.

Expected Result
4

More Matlab routines
• Some possibly useful functions, for reference - hist(vec,numcontours);
‣ creates histogram of values in “vec” with selectable number of contours.
-[X,Y]=meshgrid(xvec,yvec);
‣ If you define a range of x and y values, this creates the 2D indices.
5

Markov Chain Monte Carlo (MCMC)
• Often want to explore a multi-dimensional parameter space to evaluate a metric.
- A grid search approach is inefficient.
- Want algorithm that maps out spaces with higher probability more effectively.
6
General procedure: Start with a given set of parameters; Calculate metric Choose new set of points and calculate new metric. Accept new point with probability P= metric(new)/metric(old) * P(x1,x2)
- The procedure provides the optimum parameter values, and also explores the parameter values in a way that allows derivation of confidence intervals.
Good Intro: Numerical Recipes, 15.8

MCMC References
Detailed Lecture Notes from Phil Gregory: http://www.astro.ufl.edu/~eford/astrostats/
Florida2Mar2010.pdf Tutorial Lecture from Sujit Saha: http://www.soe.ucsc.edu/classes/cmps290c/Winter06/
paps/mcmc.pdf MCMC example from Murali Haran: http://www.stat.psu.edu/~mharan/MCMCtut/MCMC.html Good Lecture series on Astrostatistics: http://www.astro.ufl.edu/~eford/astrostats/ 7

Bayesian Review
8
“I see I have drawn 6 red balls out of 10 total trials.”
“I hypothesize that there are an equal number of red and white balls in a box.”
“There is a 24% chance that my hypothesis is correct.”
“Odds” on what is in the box.
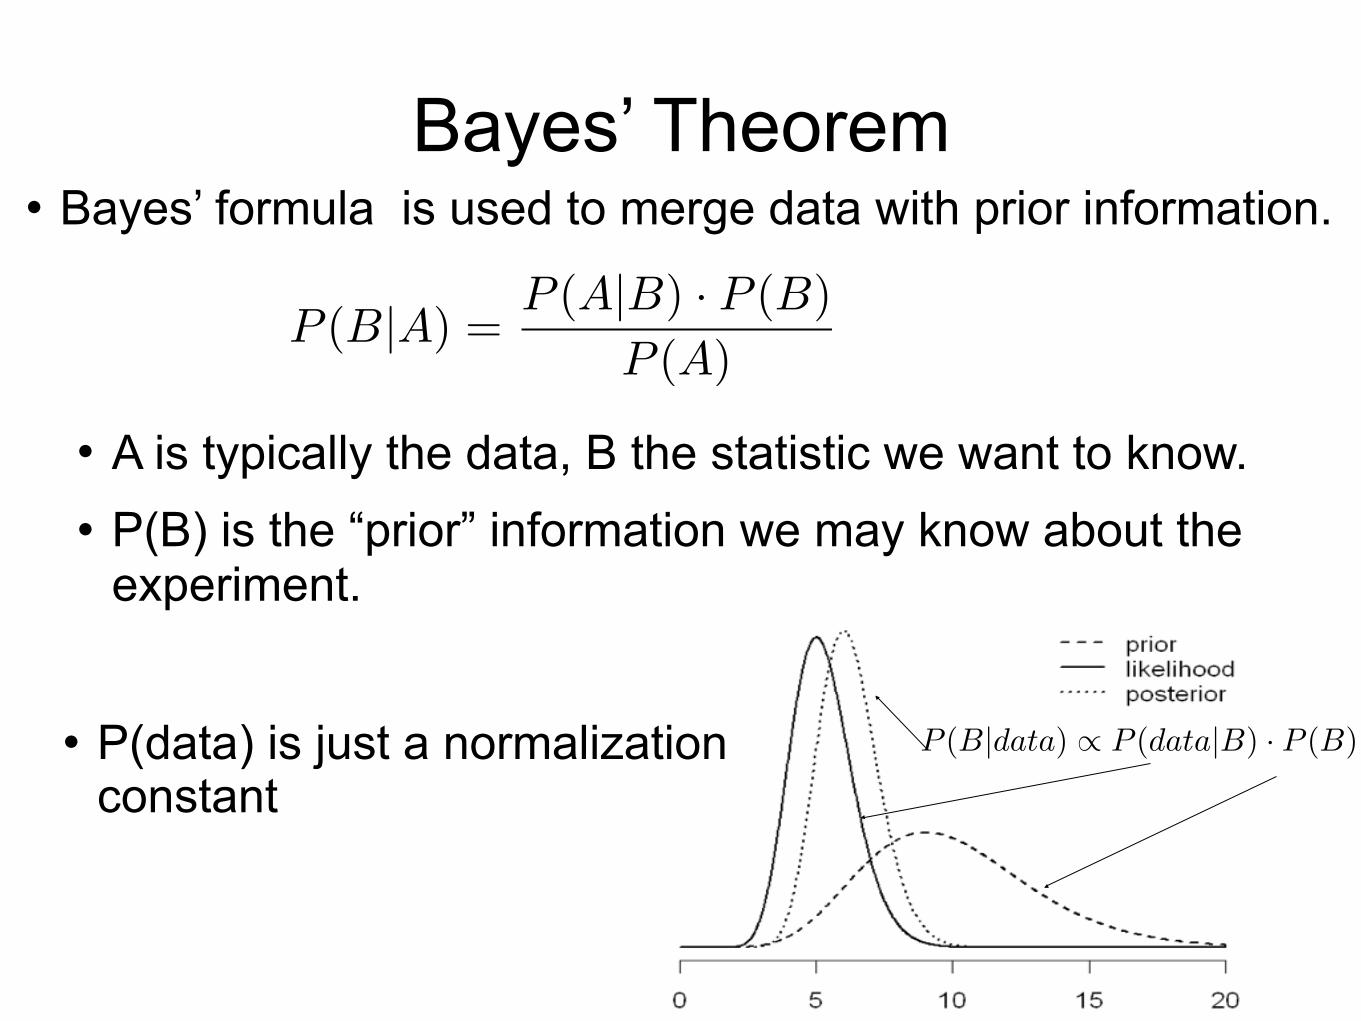
Bayes’ Theorem l Bayes’ formula is used to merge data with prior information.
l A is typically the data, B the statistic we want to know. l P(B) is the “prior” information we may know about the
experiment.
l P(data) is just a normalization constant
P (B|data) � P (data|B) · P (B)
P (B|A) =P (A|B) · P (B)
P (A)

Application to the Balls in a Box Problem
• P(frac=5| n=6) is calculated from the binomial probability distribution:
- “If frac=5/10, then p=frac, and P(6)=0.21.”
• P(frac) can be assumed to be uniform. - Is this a good choice?
10
• P(n=6) is the integral of all possibilities from frac=0/10 to frac=10/10 of getting P(6 | frac). =0.91
• P(n=6 | frac=5)=24%

Bayesian Analysis Applied to Model Fitting
• Set up a suitable model with sufficient parameters to describe your experiment/observation:
11
ML =Y
i
1� Pbq2�⇥2
yi
e�(yi�mxi�b)2
2�2yi +
Pbq2�(⇥2
yi + Vb)e�(yi�Yb)2
2�2yi
• “Marginalize” over parameters that may have a range of values (and for which you likely don’t care what the answer is):
%Marginalize over Pb, Vb, Yb, for i=1:10 for j=1:10 for k=1:10 Pb=(i-1)/9; Vb=2*mean(sigmay)*(j-1)/9; Yb=2*mean(Y)*(k-1)/9; C1=(1-Pb)./sqrt(2*3.14*sigmay.^2); E1=exp(-((Y - bb - m .* A2).^2 ./ sigmay.^2)); C2=Pb ./ sqrt(2*3.14.*(sigmay.^2+Vb)); E2=exp(-((Y - Yb).^2 ./ (sigmay.^2+Vb))); good(a,b)=good(a,b)+prod(C1.*E1+ C2.*E2); end end end

Challenge: Efficient Searching• This will allow you to find the maximum likelihood, while
incorporating the biases or uncertainty contained in the “nuisance” parameters:
12
At least a 1000 iterations are needed per m,b pair to carry out this calculation.

�(⇥x) = P (D|⇥x)P (⇥x)
Goal of MCMC in Bayesian Analysis
Assume we have a set of data, D, and a metric, P(D | x), that tells us the probability of getting D, given a set of parameters, x.
If we assume a prior, P(x), then Bayes’ theorem gives us:
13
Since we don’t know the normalizing constant, P(D), we might integrate this function (numerically, or analytically) to obtain an answer.
The value of MCMC is that its points are distributed in direct relation to the likelihood of π(x).

What is a Markov Chain?
A random number that depends on what the previous number was.
Our previous discussion of Monte Carlo used completely independent random values.
Example: A dice roll is a random number. Brownian motion is a Markov Process.
14

�(x1)p(x2|x1) = �(x2)p(x1|x2)
Markov Chains
•Mathematicians (Metropolis et al. 1950) realized that using a Markov chain to relate successive points allowed the sequence to visit the points in proportion to π(x).
- Called the Ergodic property.
• A Markov chain is considered ergodic if it satisfies:
15
• This can be shown to prove that if x1 is drawn from π(x), then so is x2.

MCMC jargon:
• Candidate point: New values of parameters that are compared to the current value in terms of the relative probability.
• Proposal distribution: Distribution of candidate points to try. This is a distribution which depends on the current value.
• Acceptance probability: The probability that a candidate point will be accepted as the next step in the MC.
16

y = q(y|x(t))
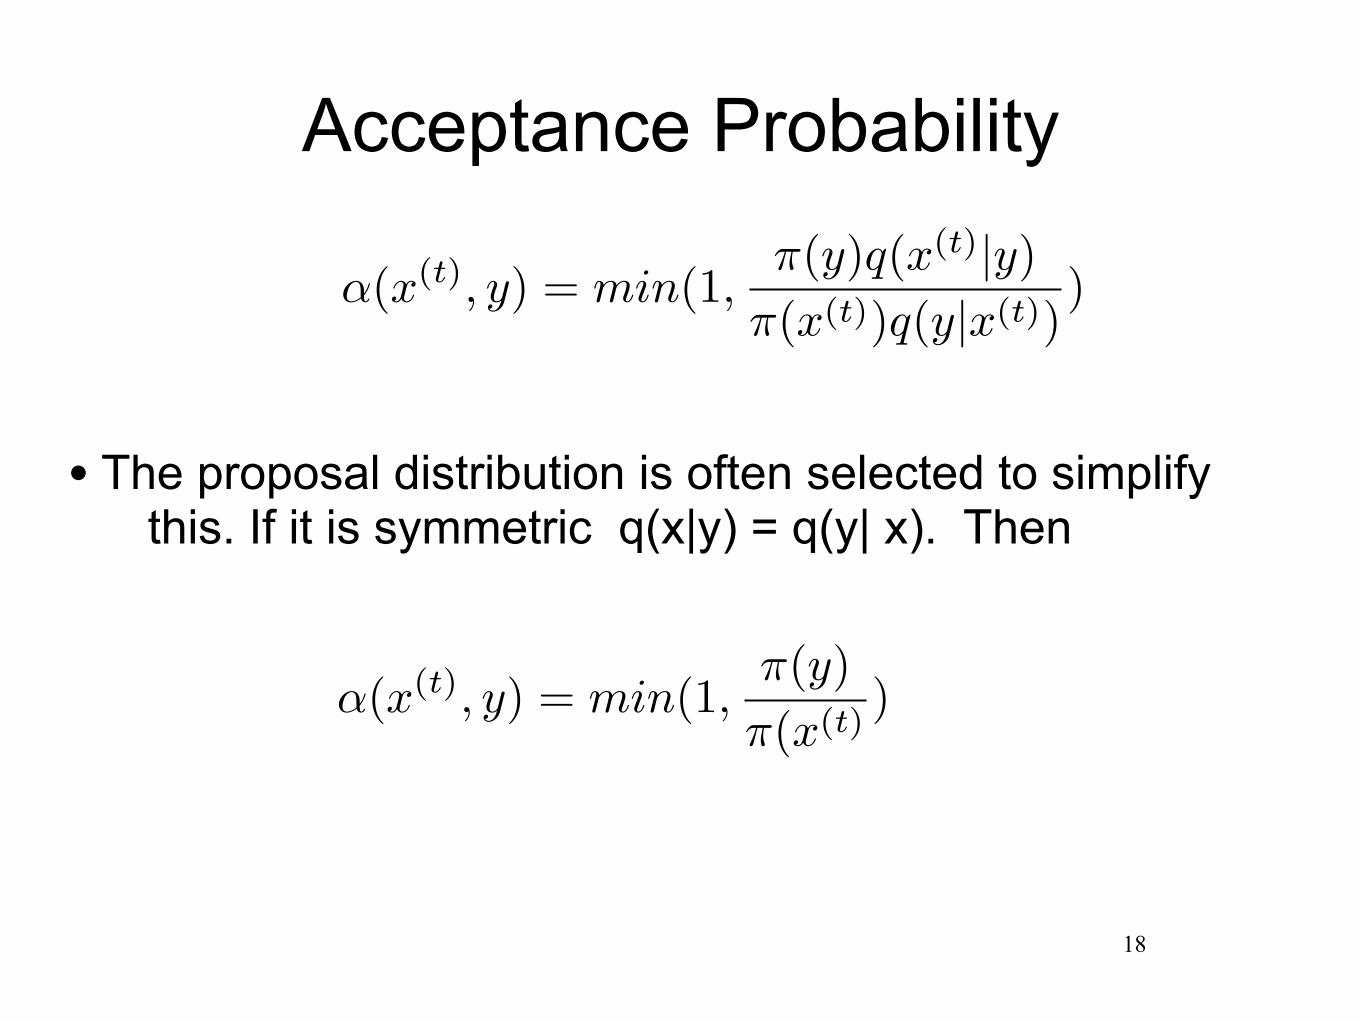
�(x(t), y) = min(1,⇥(y)q(x(t)|y)
⇥(x(t))q(y|x(t)))
Candidate points and Proposal Distributions
• A “candidate” point,y, can be generated using a proposal distribution, q.
17
• Hastings developed the general criteria for using any distribution with a Markov chain.
• The Acceptance probability is
q can be chosen arbitrarily
�(x(t), y) = min(1,⇥(y)q(x(t)|y)
⇥(x(t))q(y|x(t)))
�(x(t), y) = min(1,⇥(y)⇥(x(t)
)
Acceptance Probability
18
• The proposal distribution is often selected to simplify this. If it is symmetric q(x|y) = q(y| x). Then

But how do we get x1?• The starting point may be far from the equilibrium
solution. - Even very unlikely points in a probability distribution
occasionally occur.
- The number of points needed for the chain to “forget” where it started is called the “burn in” time. This is longer if the starting point was a very unlikely possibility, or the movement from one point to another is defined to be small. ‣ MCMC methods should use other ways of obtaining a best guess before starting
19
Two “random walks” that appear interchangeable after ~10 iterations.
see http://www.soe.ucsc.edu/classes/cmps290c/ Winter06/paps/mcmc.pdf
for more detailed discussion.

Burn-in Guidance
• The best solution for determining when the initial conditions have been forgotten is to simply look at the output of the calculations.
• Independent starting values can (and should) be used to check when the burn-in process is complete.
- These are parallel computations which are trivial to implement on today’s multi-core CPU computers.
20

How do we choose the sampling?
• You want to choose a proposal distribution that generates high acceptance criteria:
- Suggests a small variation (small sigma, if Gaussian)
• You want to explore parameter space in a “complete” way and eliminate starting conditions “burn in” quickly.
- Suggests a larger variation (larger sigma if Gaussian).
• Suggests that an adaptive approach may be useful.
• This area is where the majority of “art” in MCMC techniques is accomplished.
21

A simple MCMC example
• Assume we have a probability distribution, which is weirdly shaped:
22

Proposal distribution
• Choose zero mean, normally distributed values with sigma, s, to add to initial values.
• Accept new values with probability given by P(xnew)/P(xold).
•Want to look at how long “burn in” lasts vs. s.
•What are the range of parameters?
23
Script available at:
http://zero.as.arizona.edu/518/CodeExamples/mcmc_example.m
also need:
http://zero.as.arizona.edu/518/CodeExamples/MCMCpdf.m

MCMC example: Fitting Images
•MCMC approaches can be used to derive best fit and uncertainties on multi-dimensional fit data sets.
24
From Skemer et al. 2008

Fitting Procedure
• 3 parameter fit for each star. - x,y,flux
• 3 additional PSF parameters - width, e, PA
• Do best 12-d fit with Levenberg-Marquardt minimization.
• Use covariance matrix as first guess for step size.
25
see Skemer et al. 2008 for details

Example of results
26

HW 3: 1. Markov Chain Fit
• HW 2 focused on a least squares fit. We extended this to incorporate a more realistic model of the data.
• You can improve this via Markov Chain modeling.
• Remember: you already know the answer. Use HW 2 to confirm your code is working. Use the class example to understand how MCMC can be implemented.
27

Summary• MCMC techniques are useful both as an optimization
tool and for characterizing the confidence intervals of parameters.
• It is most useful for large-dimensional datasets, or ones where the probability distribution function is complex or not able to be manipulated analytically.
• The key way it works is by finding points in proportion to the relative probability of occurring.
- Good for parameter estimation.
28